The Impact of Climate Change on the High Water Levels of a Small River in Central Europe Based on 50-Year Measurements


Forest Research Institute, Sękocin Stary, ul. Braci Leśnej 3, 05-090 Raszyn, Poland
*
Author to whom correspondence should be addressed.
Forests 2020, 11(12), 1269; https://doi.org/10.3390/f11121269
Submission received: 18 October 2020
/
Revised: 25 November 2020
/
Accepted: 26 November 2020
/
Published: 28 November 2020
(This article belongs to the Section Forest Ecophysiology and Biology)
Abstract
:Climate change affects many elements of the natural environment and strongly influences the hydrology of rivers. In this study, we investigated trends in temperature, precipitation, and the water level characteristics in the small lowland river Lebiedzianka in northeastern Poland for the 50 year long period of observations (1970–2019). We recorded significant increase in air temperature and potential evapotranspiration, but the annual sum of precipitation did not change. We found significant downward trends for annual runoff. The results show a steady decrease in the number of days with high water levels. These changes caused by global warming will have a strong impact on forest habitats associated with high water levels and periodic inundations. In Europe, many of these precious habitats are protected under the Natura 2000 network as sites of high heritage value; nevertheless, their sustainability will be at risk due to the ongoing changes in their hydrological regime.
1. Introduction
About 2% of the territory of continental Europe is classified as riparian habitats. A large part of European riparian zones (around 69%) is associated with forest habitats, while to a minor extent to other vegetation lifeforms [1]. In Europe, many of the riparian forest is identified as a key ecosystem protected by the European Community under the Natura 2000 program. The alluvial forests disappear in many parts of the globe, especially in the developed countries of Europe [2]. Eighty percent of the riparian area of North America and Europe has disappeared in the last 200 years [3]. The ecological functioning and sustainability of these ecosystems depends on the hydrological processes driven by groundwater and surface water interactions [4]. Occasional overbank flooding and reliable access to groundwater regenerate and sustain native riparian vegetation [5,6], as the lifecycle of the riparian vegetation is adapted to the magnitude, timing, and frequency of floods [7]. Given the relationships between climate and hydrology and between hydrology and riparian vegetation, it is legitimate to argue that climate change can reasonably be expected to impact riparian vegetation [8]. By supplying riparian forests with water and occasional inundations, small rivers are particularly important to protect the swampy nature of these habitats. However, climate warming can induce an increase in evaporation and a decrease in the outflow rate, which can affect the water balance of these areas, leading to a reduction in high water (HW) level and occasional flooding. As a result, the area of riverside forests is expected to diminish in the foreseeable future.
We hypothesize that climate warming can induce an increase in evaporation and a decrease in the outflow rate, which can affect the water balance of these areas, leading to a reduction in high water level (HW) and occasional flooding. As a result, the area of riverside forests is expected to diminish in the foreseeable future. This paper presents the results of 50-year measurements of the water levels of a small river and the frequency of occurrence of HW events in relation to climatic conditions as an example of the processes that take place in the central European forests under changing climatic conditions. We investigate whether climate change affects the maximum water level, which in turn determines the frequency of floods and influences sustainability of riparian forests.
2. Materials and Methods
The measurements, results, and analyses are presented in hydrological years, i.e., from November to October of the following year. The trend of the changes in meteorological parameters and changes in the occurrence of HW in streams between 1970 and 2019 was tested by the non-parametric Mann–Kendall test using Makesens 1.0 software developed by the Finnish Meteorological Institute [9]. A non-parametric method, Sen’s slope estimate [10], was used to estimate the magnitude of the trends in the data time series. The benefit of the used methods is that missing values are allowed and the data need not conform to any particular distribution. Besides, the Sen’s method is not greatly affected by single data errors or outliers [9]. Both methods are widely described by Salmi et al. [9].
2.1. Study Area
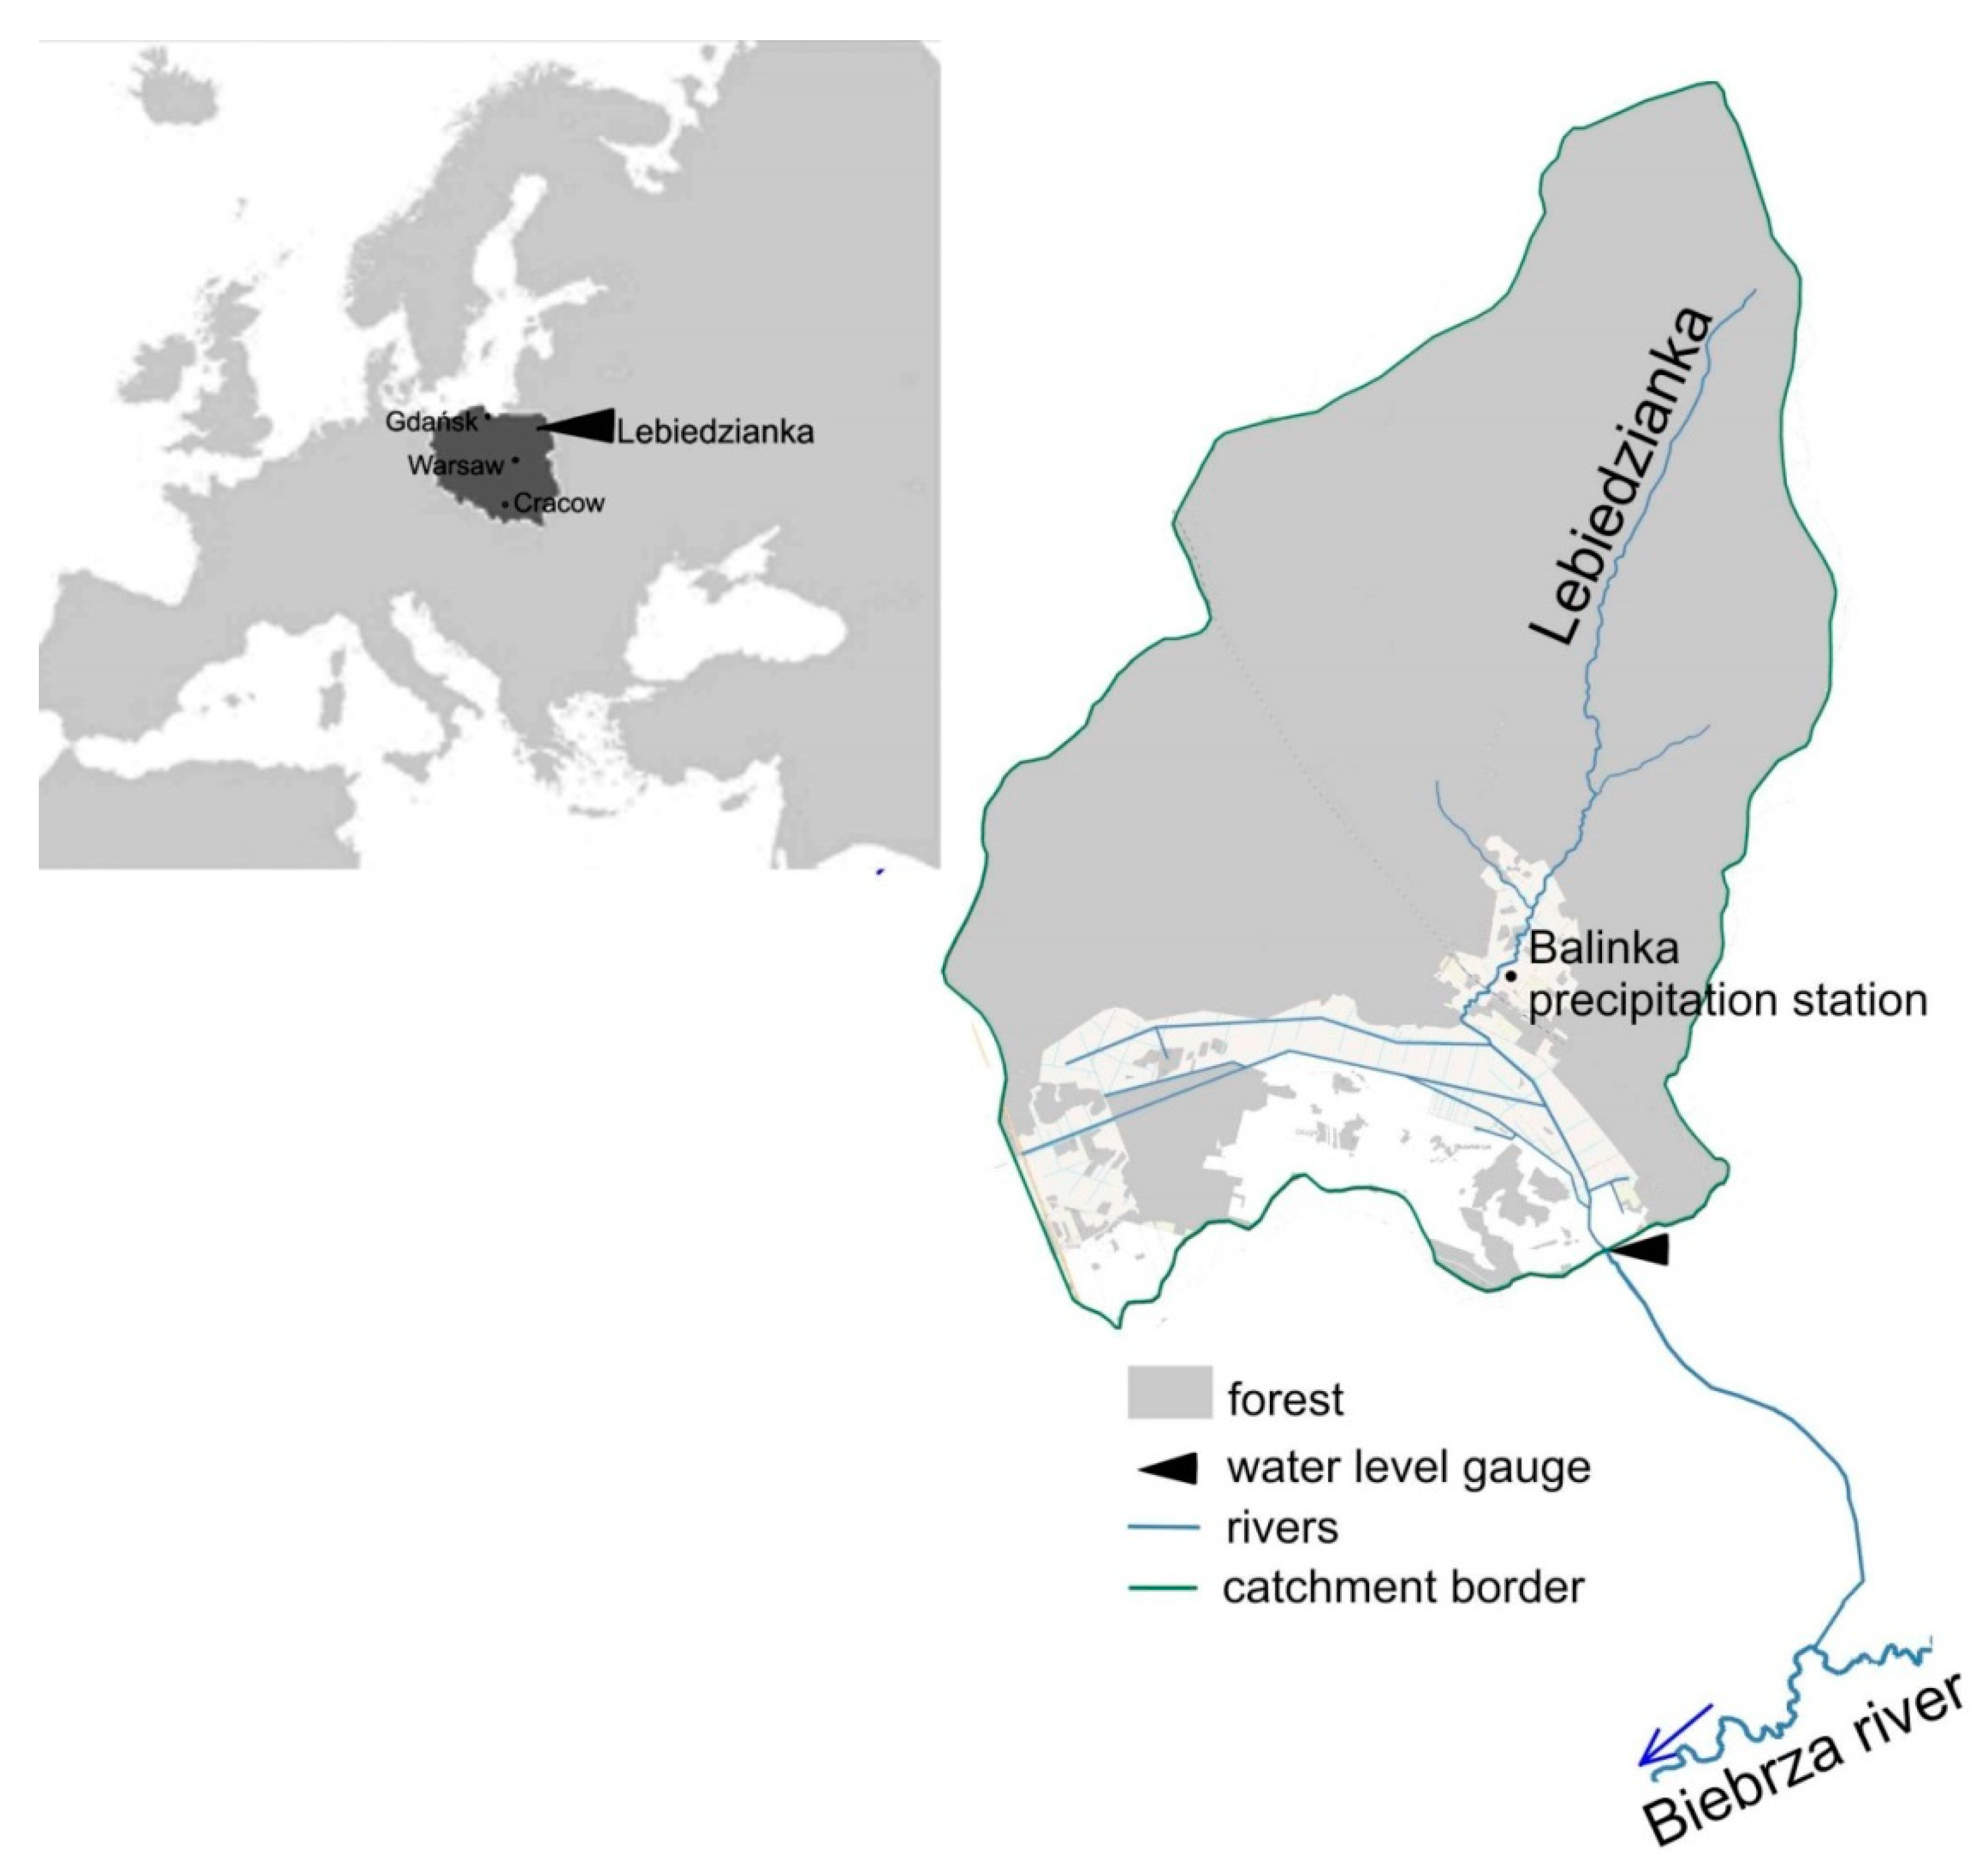
The Lebiedzianka River has springs in the Augustów Primeval Forest in the northeastern part of Poland, as shown in Figure 1. This river is a tributary of the Biebrza River, which is the main stream that feeds Biebrza National Park. A water gauge point where the water level in the stream is measured is located on the border of the Augustów Primeval Forest.
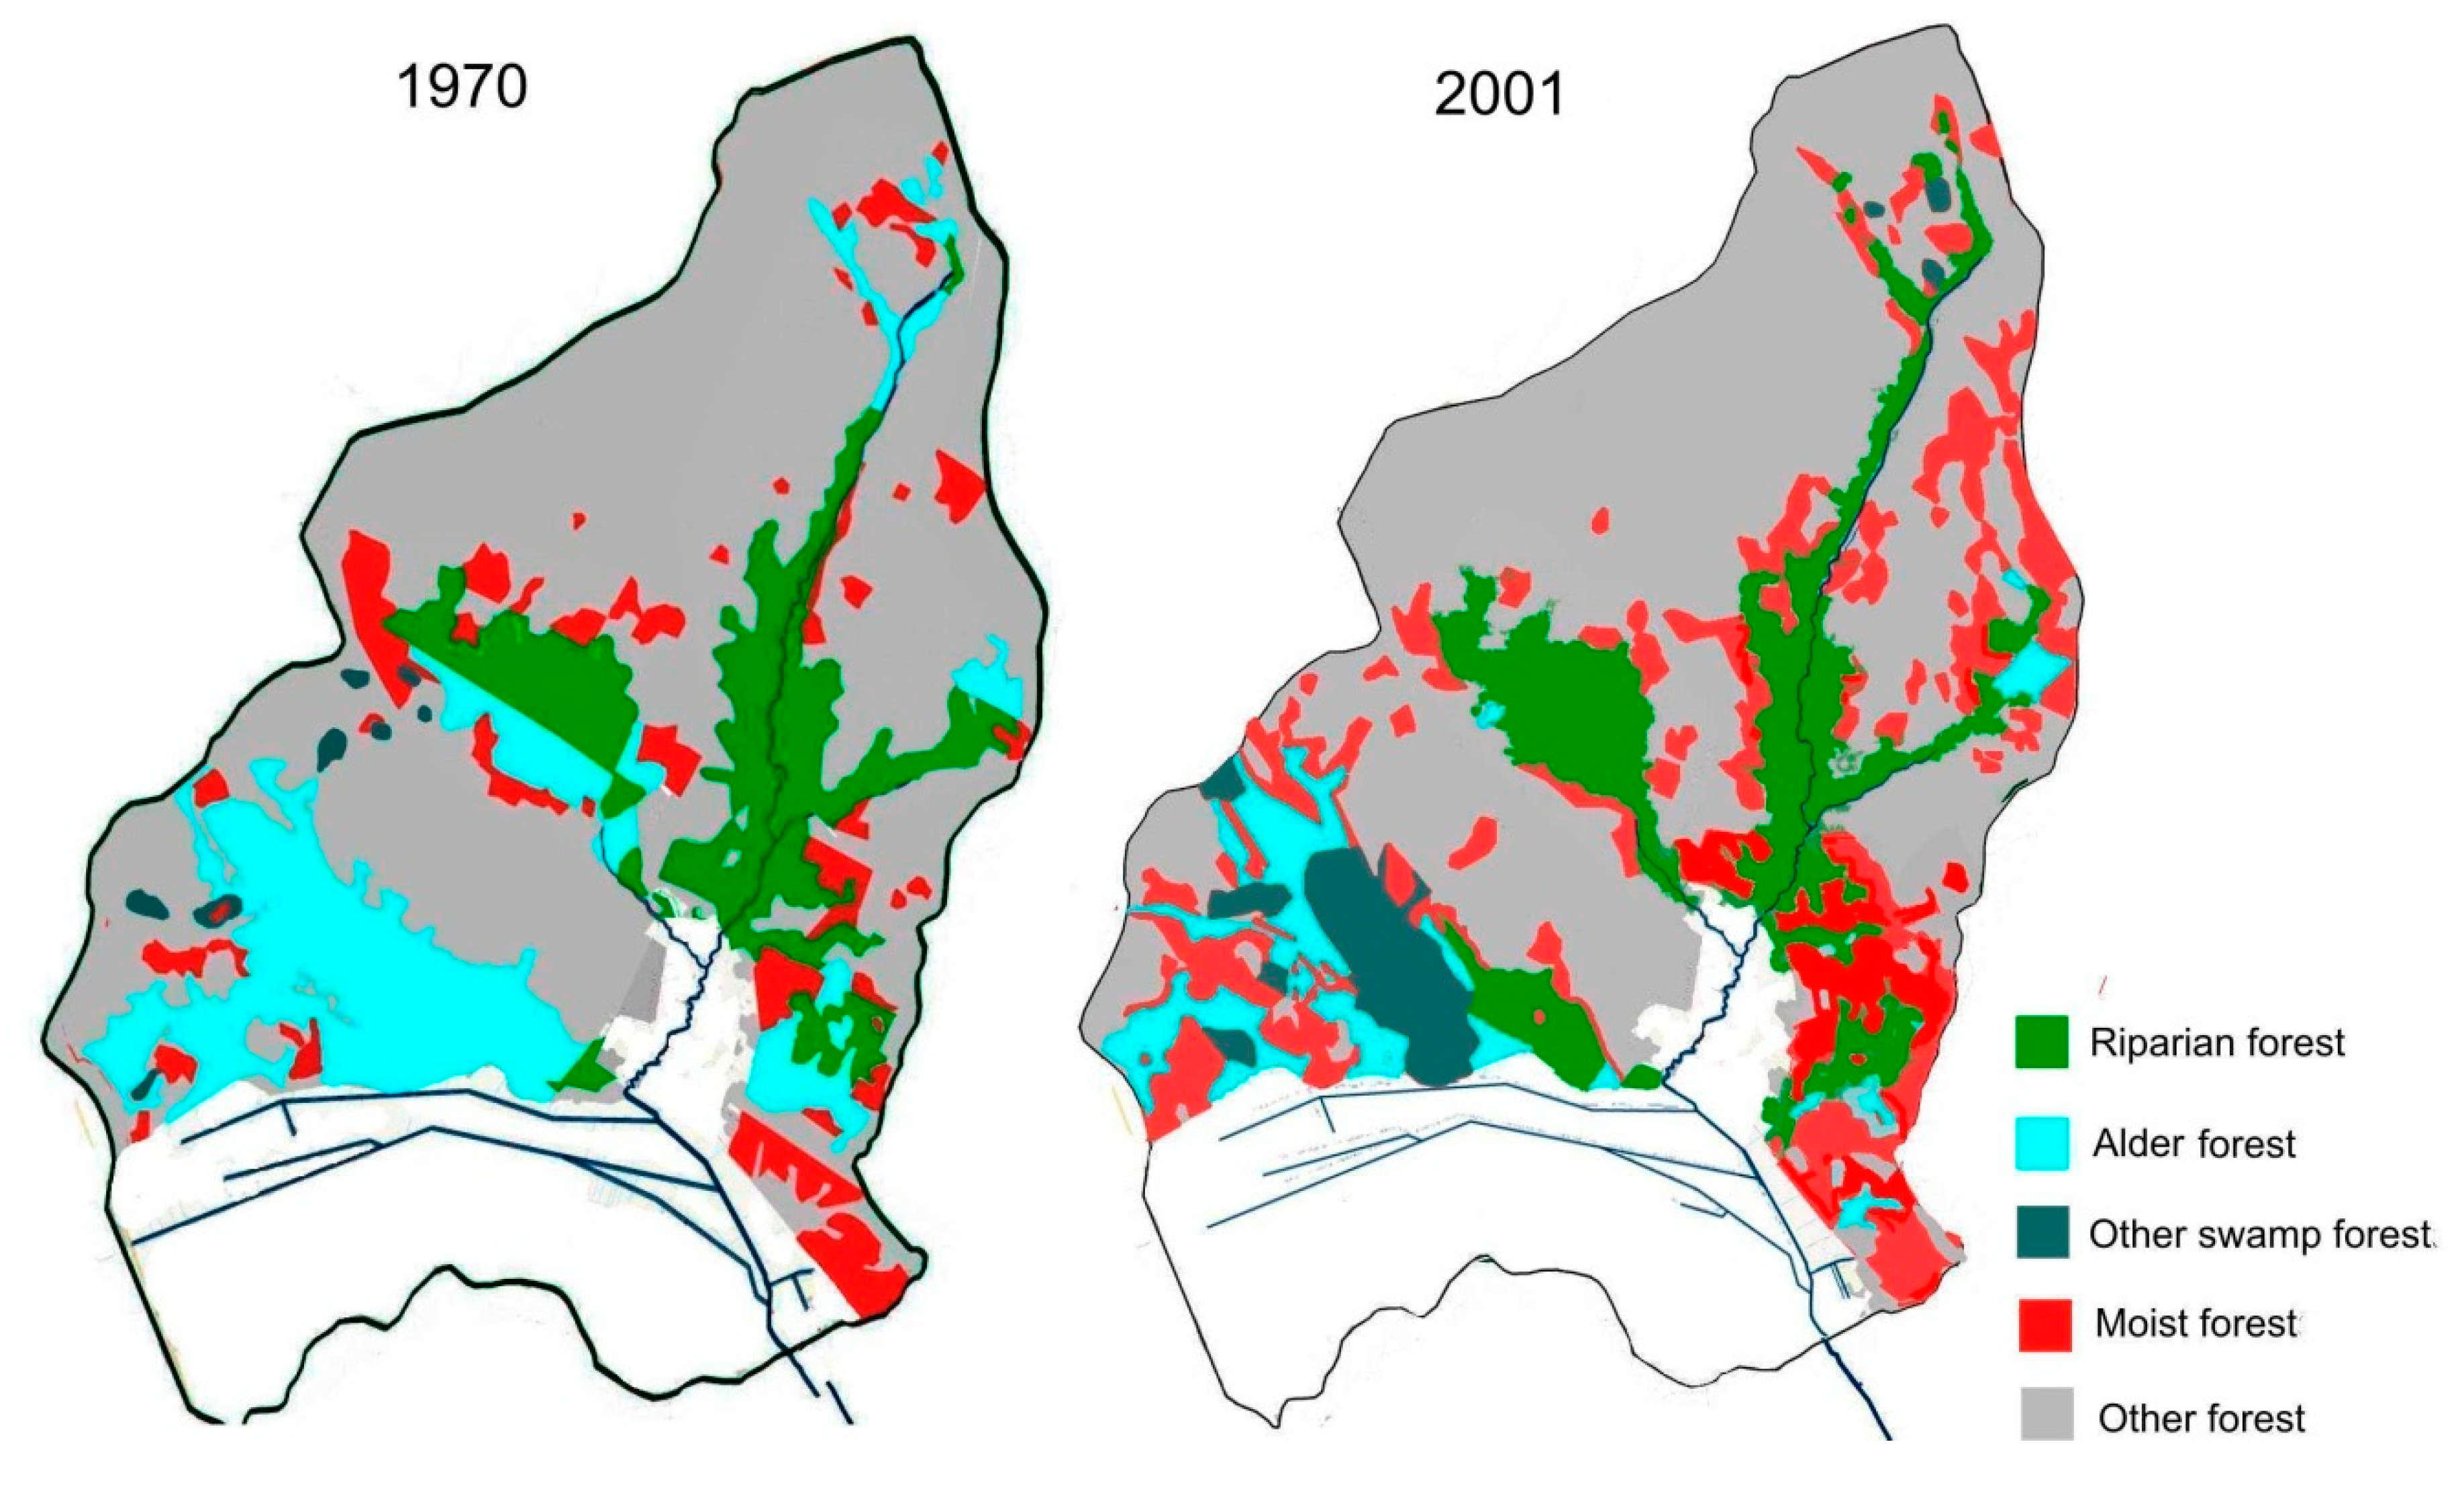
The length of the stream to the gauge point measures 11.2 km. The catchment area is a typical lowland with an average terrain slope of approximately 0.1%. The catchment area covers 5720 ha, of which forests amount to 4816.3 ha, meadows add up to 583.4 ha, and arable land amount to 320.3 ha. In the 1960s, wet or marshy forests covered a total area of 1771.2 ha, and the riparian forest covered 512.5 ha. We did not observe major changes in the structure of the land use nor in the catchment area during the research period, however some changes were present in the area of forest types. Therefore, we compared the percentage share of forest types in 1970 [11] and in 2001 [12]. The comparison reveals a significant reduction in riparian and swamp forests, the total area of which decreased by 10.3%, while the area of moist forest increased by 12%, as shown in Figure 2. The changes may also result from development of the principles of habitat mapping over the decades, and from technical progress that allows for more accurate identification of habitat types.
2.2. Meteorological Conditions
Air temperature (T) measurements at a height of 2 m come from the Institute of Meteorology and Water Management, National Research Institute (IMGW) station in Suwałki, located at a distance of 40 km from the gauge point. We collated the data from three nearest meteorological stations located to the north, west, and south-east to the catchment. The datasets showed high comparability thus we assume that presented results are representative for the study area. The data from 1970–2019 are presented.
The monthly potential evapotranspiration (PET) using the Thornthwaite method [13] was calculated for the period 1970–2019. The precipitation (P) was determined for the catchment of the Lebiedzianka River on the basis of rainfall measurements at the precipitation station in Balinka, which is located within the research catchment area. The climatic water balance (CWB) was calculated for hydrological years as the difference between the sum of the P and the calculated PET.
2.3. Water States of the Stream
Water level was measured by the vertical staff gauge and recorded daily at 7 a.m. The measurements of the water level were launched in 1963. The period of the last 50 years was selected for the analysis, i.e., the hydrological years from 1970 to 2019 (from November 1969 to October 2019). Gauged water level records were used to estimate river discharge by means of a rating curve.
The rating curve was established and verified based on hydrometric measurements conducted a few times per year. The hydrometric measurements included water level reading and estimating the corresponding discharge, on the basis of the cross-section area and flow velocity measurements taken by handheld water flow meter. The runoff from catchment (H) was estimated based on discharge up to 2016. The daily data is complete, however, the records from 1993 and 1994 were excluded from the analysis due to extremely HW levels caused by temporary artificial damming during road construction. The HW levels were determined to be the highest states that fall in the 5th percentile of all measurements from the selected period, i.e., higher than the 298 cm limit in Figure 3b. The days with HW level (NHW year) were counted for each year. The highest annual water levels (Lmax) were compiled for the whole period.
3. Results
3.1. Meteorological Conditions
3.1.1. Precipitation (P)
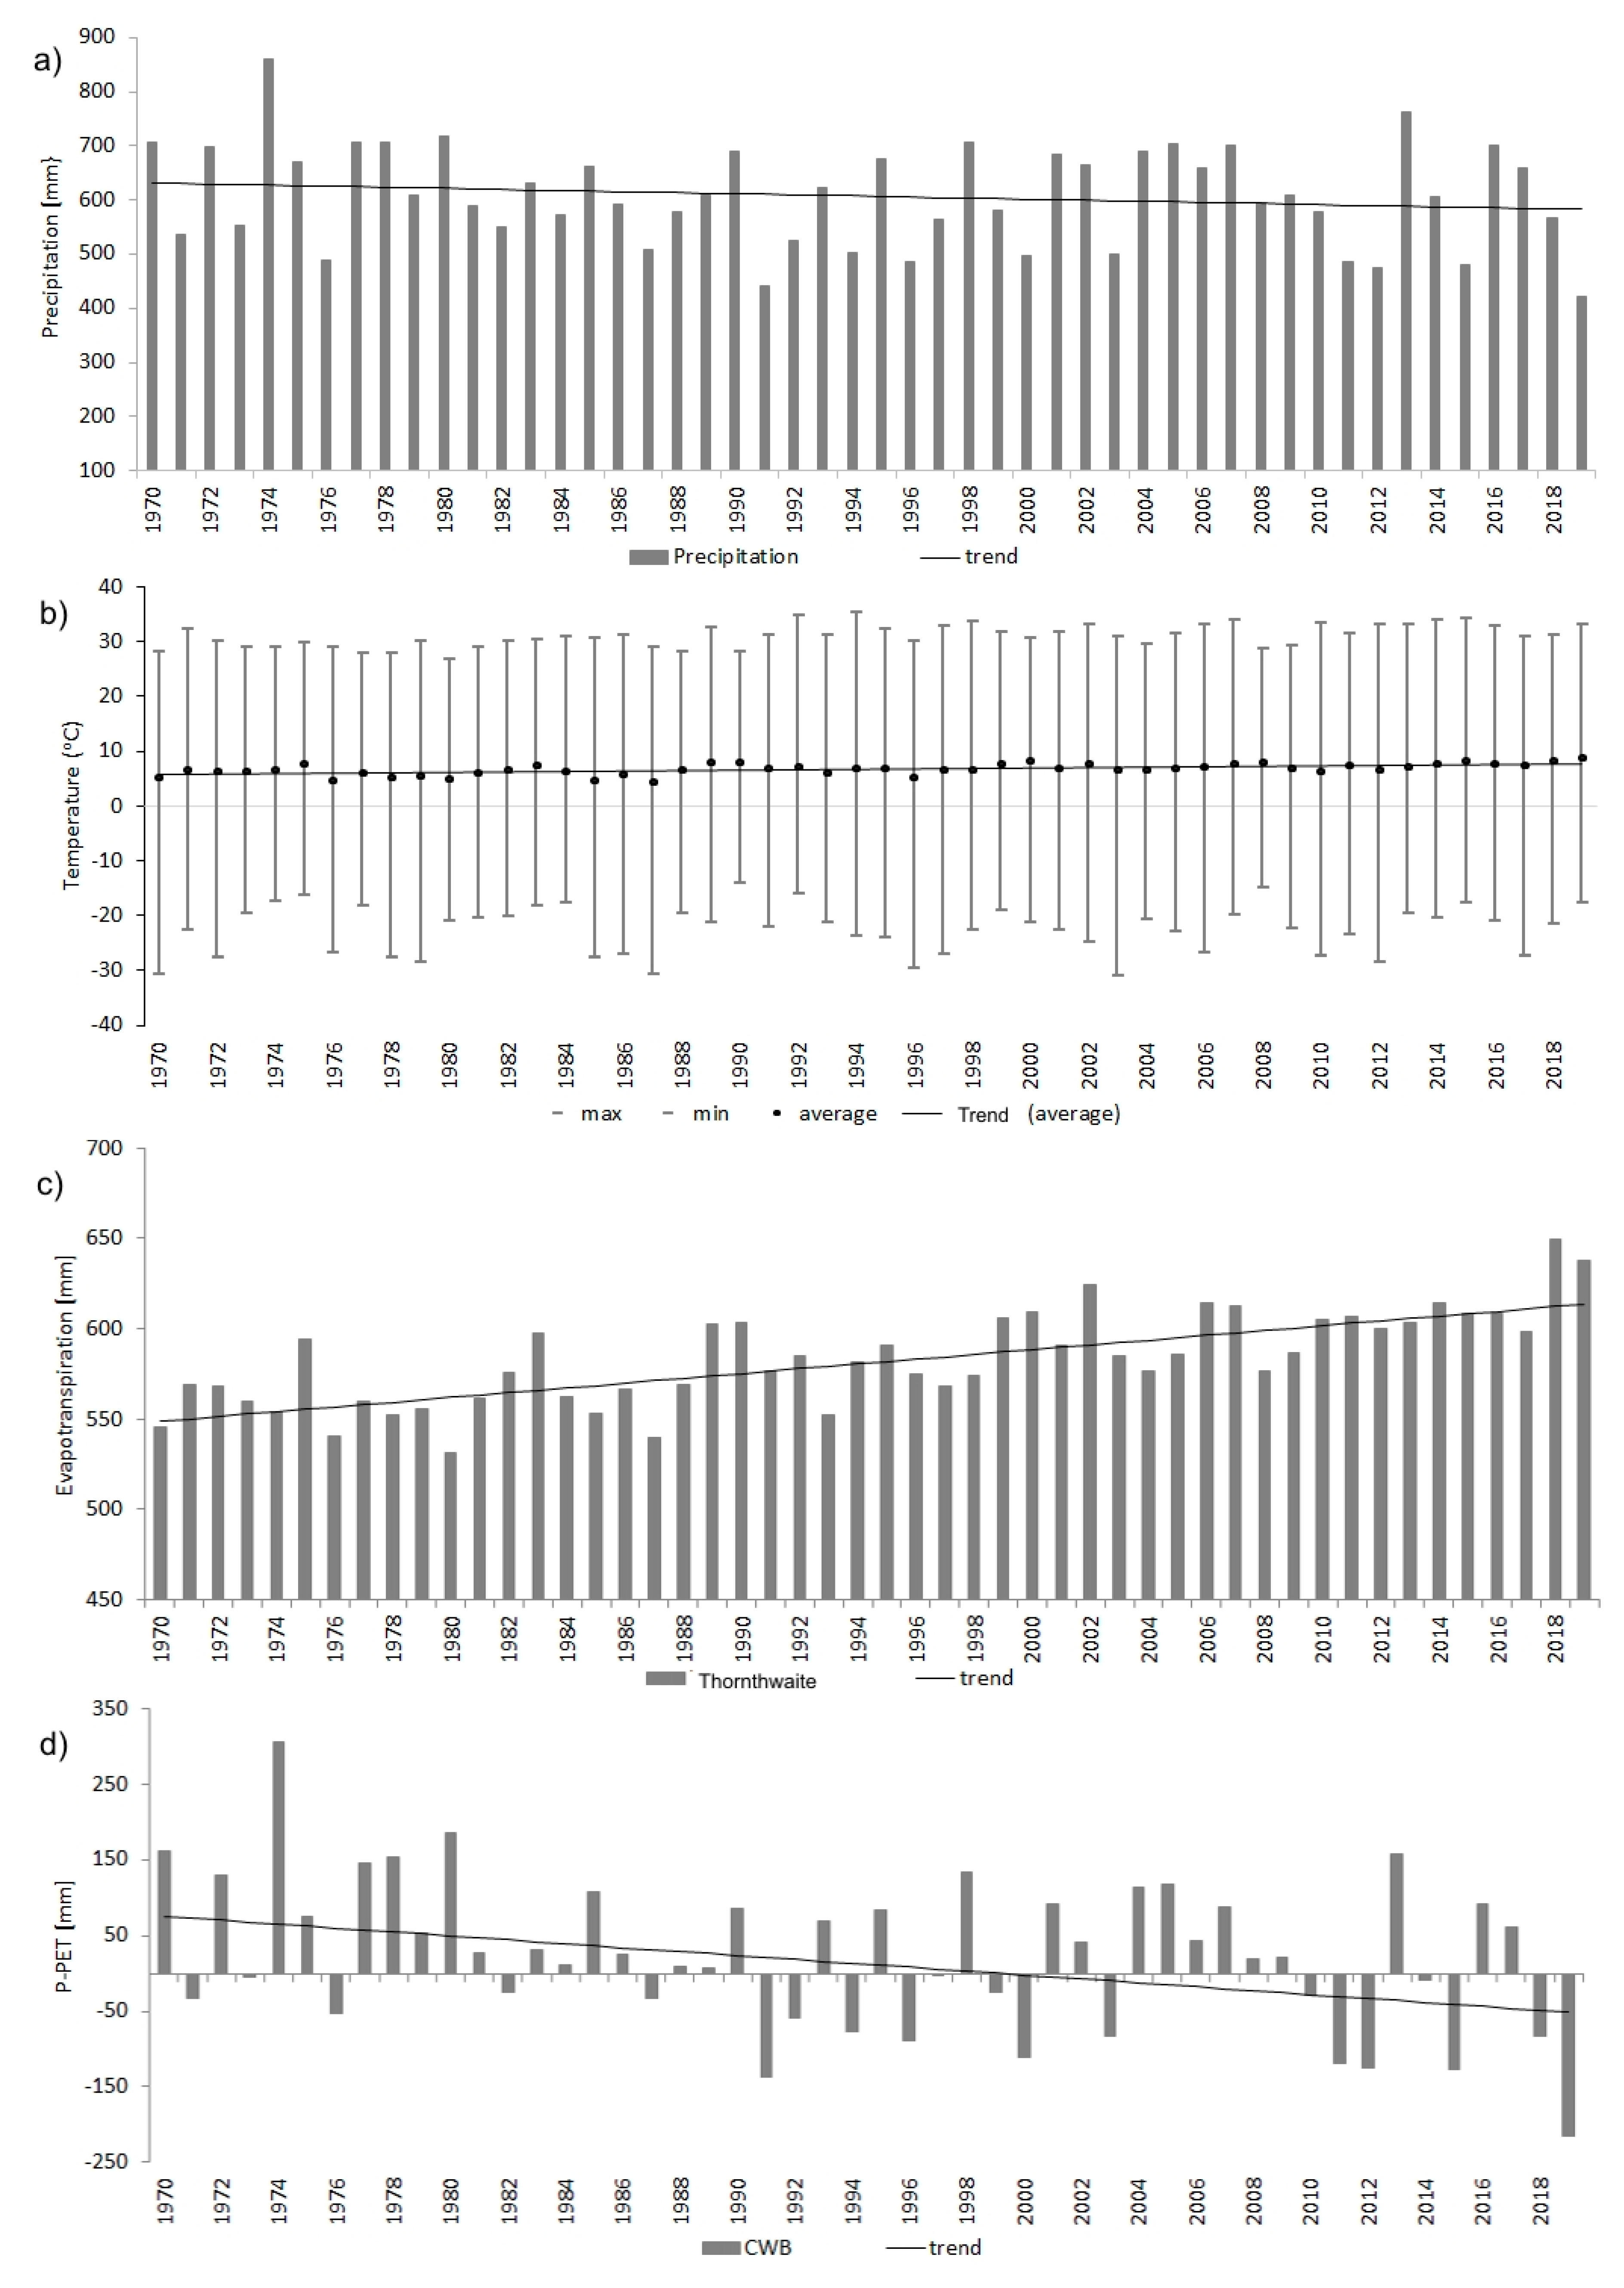
The average annual rainfall in the catchment area in 1970–2019 was 607 mm. The lowest rainfall of 421 mm was recorded in 2019, while the highest rainfall of 860 mm was recorded in 1974, as shown in Figure 3a. The value of Sen’s slope estimate indicates a decrease in the sum of the annual rainfall, but the changes are not statistically significant, as shown in Table 1. Estimated by the trend equation, P (year) dropped by 49 mm at the end of the period in relation to its beginning, which gives a decrease of 1 mm of rainfall per year.
3.1.2. Air Temperature (T)
The average air temperature was 6.7 °C. The average annual temperatures ranged from 4.4 °C in 1987 to 8.7 °C in 2019, as shown in Figure 3b. The temperature rose 2.1 °C between 1970 and 2019, i.e., approximately 0.4 °C per 10 years, and the trend was statistically significant, as shown in Table 1. The temperature ranged from −31.1 to 35.2 °C, as shown in Figure 3b.
3.1.3. Potential Evapotranspiration (PET)
The mean annual PET was 583 mm; the highest value (649 mm) was calculated for 2018, and the lowest value (531 mm) was calculated for 1980, as shown in Figure 3c. The changes in the annual values show an upward trend and are considered significant, as shown in Table 1. The annual PET increased by 65 mm over the study period.
3.2. Climatic Water Balance (CWB)
The mean annual CWB was 24 mm. The greatest the climatic water excess (306 mm) was recorded in 1974, and the greatest deficit (−216 mm) was recorded in 2019, as shown in Figure 3d. Until 1990, the years with water inflows that dominated over water outcomes prevailed. A negative CWB was recorded for nearly 3 hydrological years during this period. On the other hand, in the last 10 years before 2019, the years with a predominance of water outflow over its inflow were prevalent. As many as 6 years with a negative CWB were recorded between 2010 and 2019. The balance of the water resource decreased by 119 mm over the study period.
3.3. Water Level
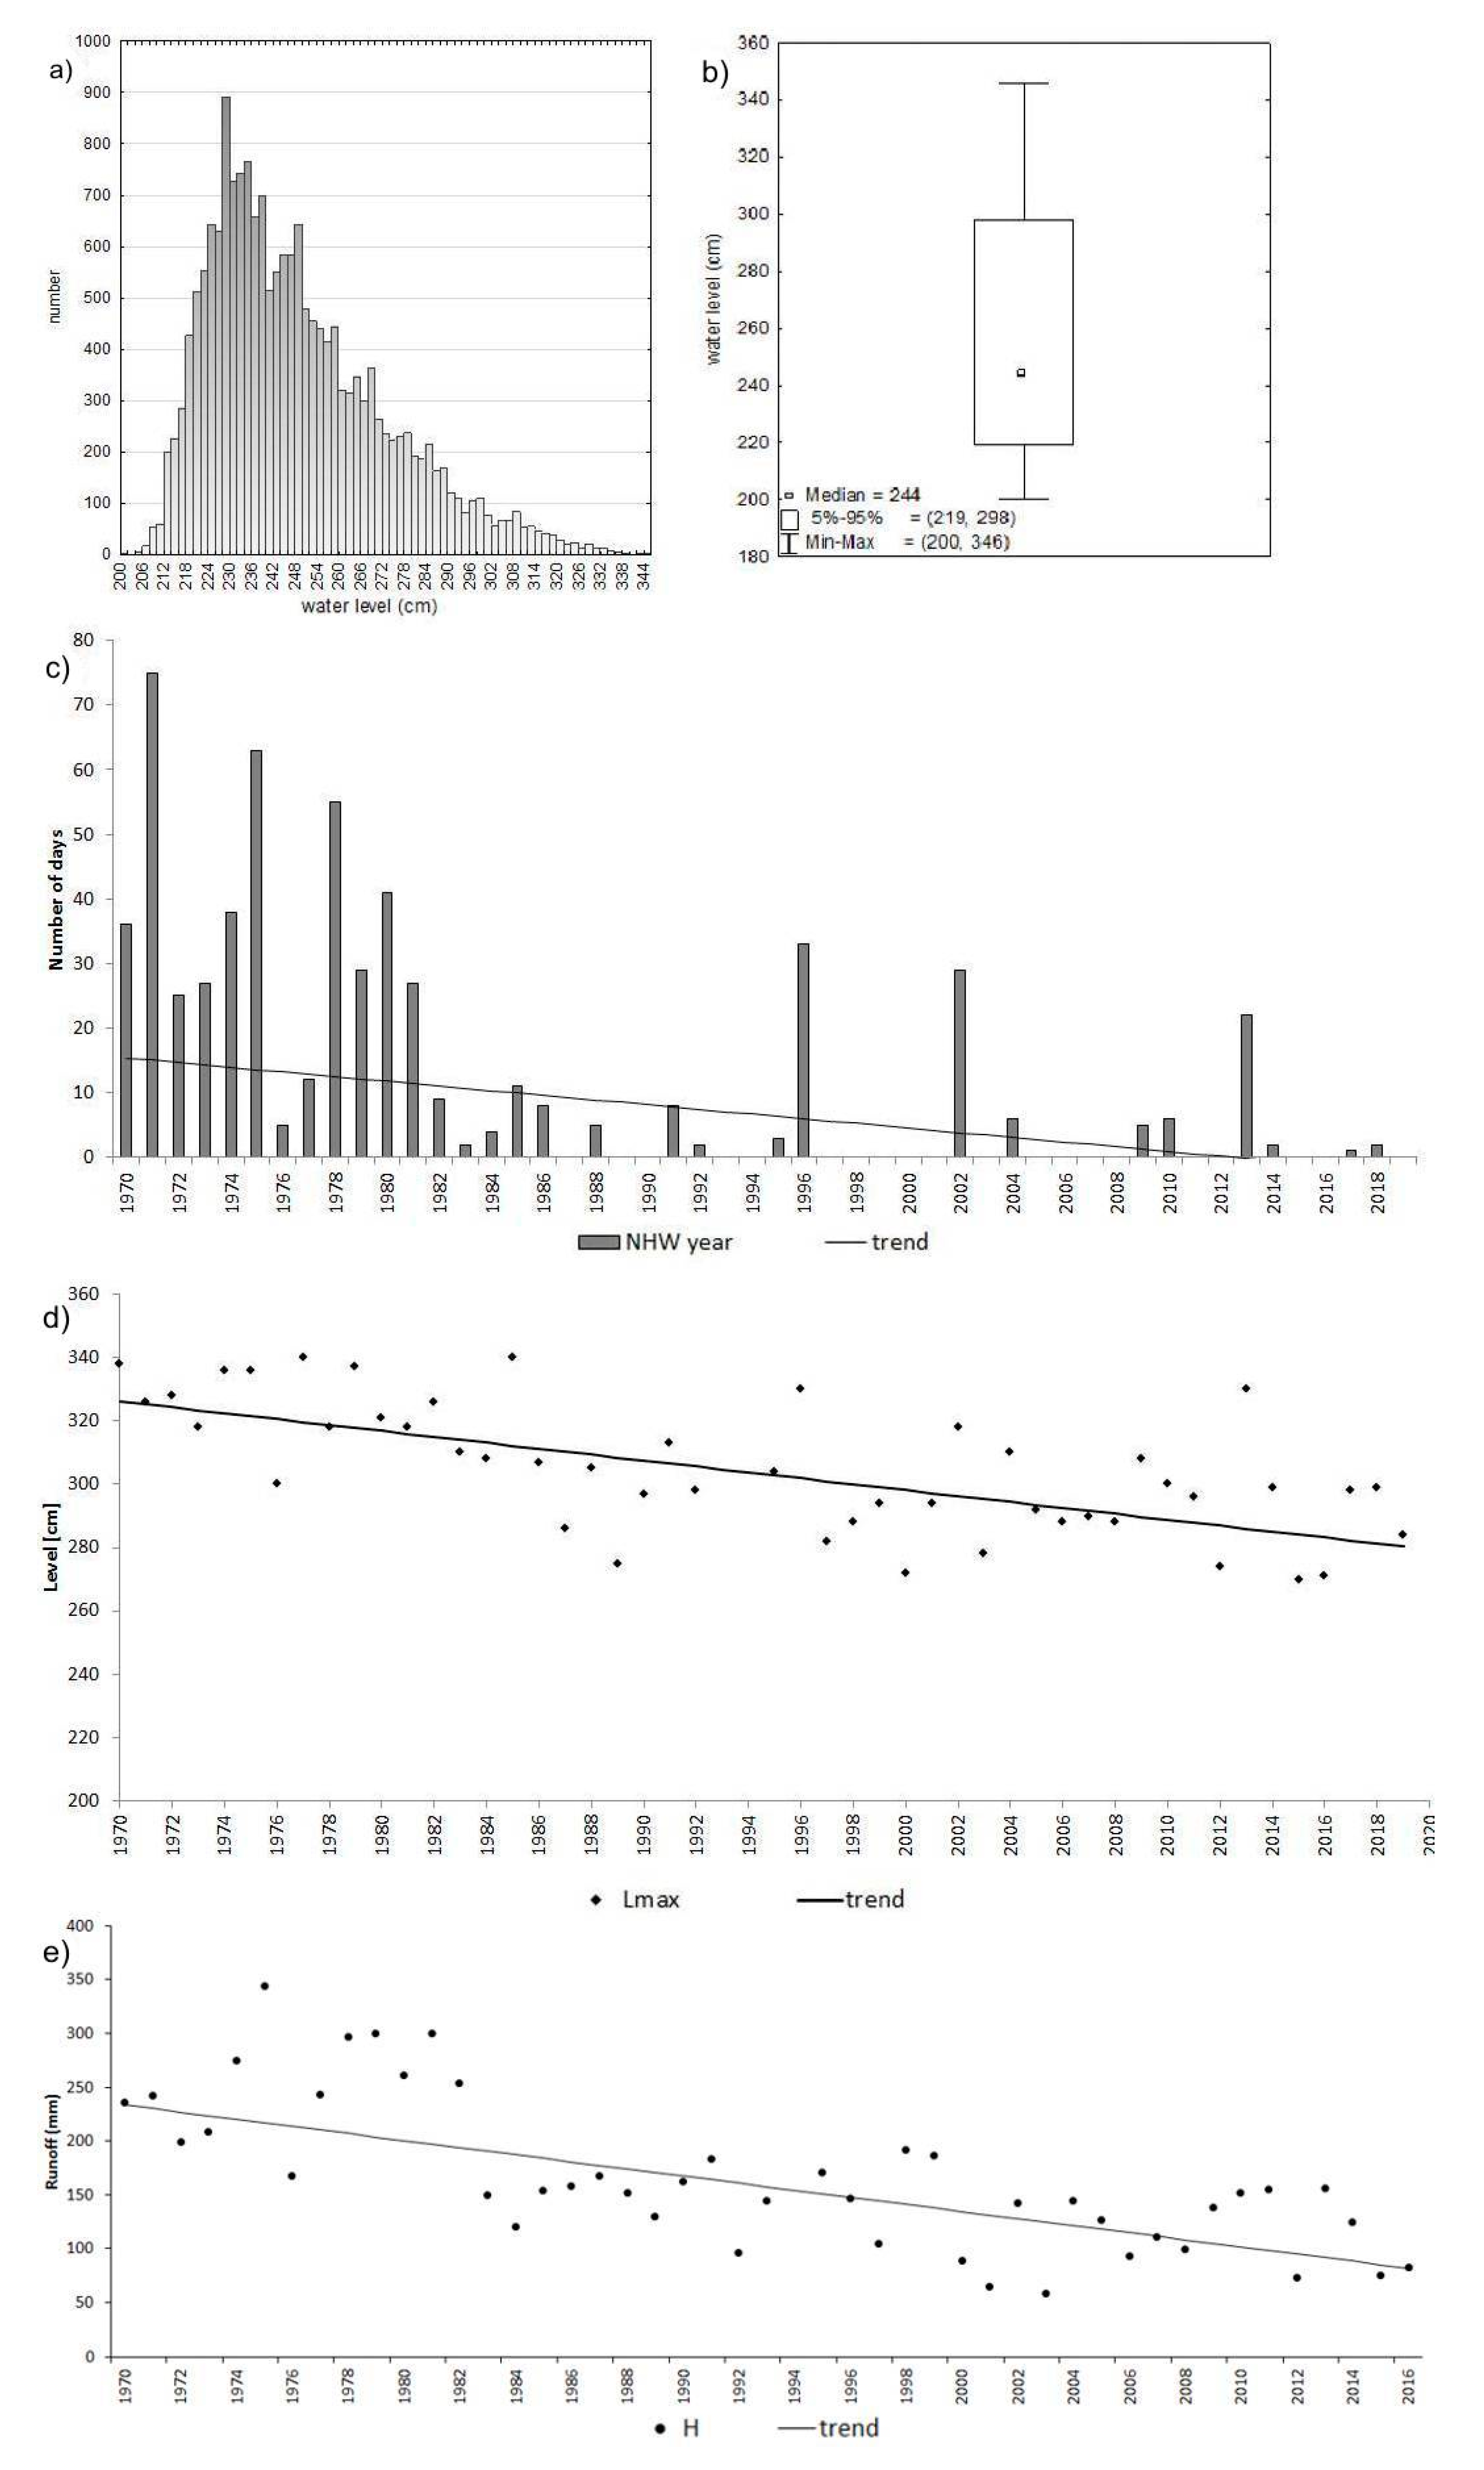
The water level in the stream from 1970 to 2019 ranged from 200 to 346 cm. Sixty-five percent of the daily data collected on the water gauge lie within the range from 220 to 270 cm, as shown in Figure 4a. The median water level was 244 cm, and HW (over 298 cm) occurred in total for 591 days, as shown in Figure 4b. Fifty-year-long measurements indicate a steady decrease in the highest annual water level over the years (Lmax), as shown in Figure 4d. The maximum annual water level decreased by 46 cm over the study period, and the changes are statistically significant, as shown in Table 1. The number of days per year with HW also significantly decreased, as shown in Table 1. In 1971, HW was observed for 75 days, while 1987 was the first year without any daily record of HW. None of the HW was recorded in the five years over the last decade of the observations. The average number of days per year with HW was as follows: 1970–1979—36 days, 1980–1989—11 days, 1990–1999—6 days, 2000–2009—4 days, and 2010–2019—only just 3 days, as shown in Figure 4c.
3.4. Runoff
The average annual runoff (H) from the catchment in 1970–2016 (excluding 1993 and 1994) was 165.8 mm. The lowest runoff of 58.2 mm was recorded in 2013, while the highest runoff of 343.8 mm was recorded in 1975, as shown in Figure 4e. Additionally, 1983 was the last year where runoff exceeded 200 mm, and 1992 was the first year with runoff below 100 mm. The annual runoff did not exceed 100 mm 8 times in the last 20 years. The changes in the annual values show a downward trend and are considered significant, as shown in Table 1. The annual runoff decreased by 151.7 mm over the study period.
4. Discussion
The predicted climate change can increase the risk of disrupting the river hydrology by altering the rainfall, temperature, and runoff patterns, as well as disrupting biological communities and severing ecological linkages in any given locale [14]. The expected climate variations include the temperature, type, quantity, and timing of the precipitation, all of which in turn affect the river hydrology [15]. As streams respond to a variable and changing climate, the riparian plant life cycles are likely to exhibit various responses to the hydrological changes [16].
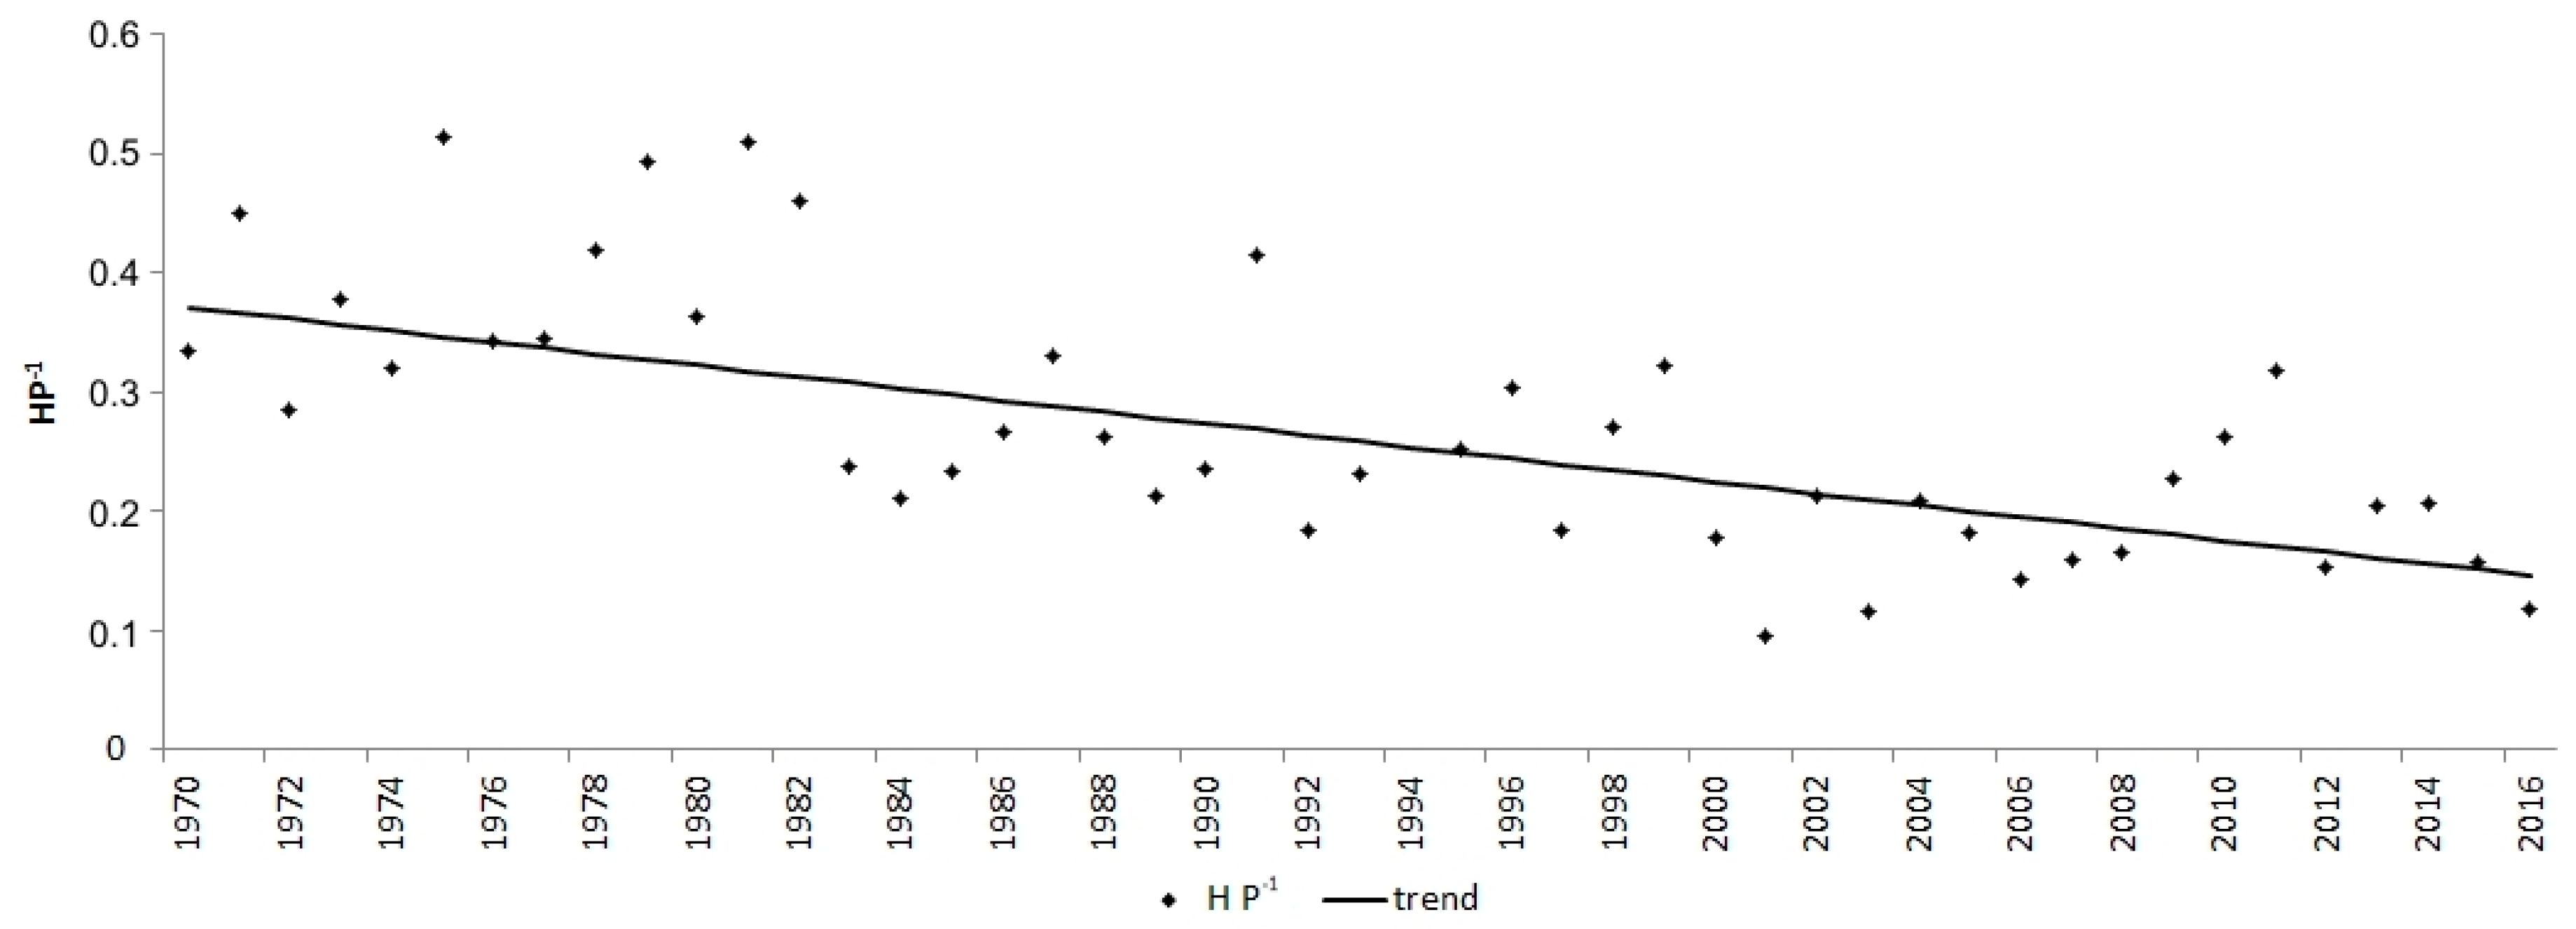
The number of days with HW significantly decreased. The observed changes progress with ongoing climate change; specifically, an increase in the air temperature results in an increase in PET, which in turn results in an increase in the water deficit and in a decrease in the runoff from the catchment. Simultaneously, the amount of precipitation virtually does not change, despite the fact that the scenarios of climate change assume its increase, especially during winter in Poland [17]. The insignificant changes in precipitation indicate that this factor does not affect the observed clear changes in the elements of the water balance (i.e., ET and runoff). We merely observe an increase in the air temperature, which affects the elements of the water balance. Greater evapotranspiration contributes to the reduced share of runoff in the water balance (HP-1), which in the period 1970–2016 decreased from 37% P to 15% P, as shown in Figure 5. As a consequence, flowing water resources are depleted and days with high water levels are less frequent.
Piniewski et al. [18], in their analysis of the long term trends of river flow in Poland for the period 1956–2016 measured at 57 gauging stations and for the period 1981–2016 at 144 gauging stations, showed a clear division of the country into three latitudinal zones: (1) northern part, in which decreasing trends dominate (particularly strong in its central part); (2) central part, in which trends are very weak; (3) southern part, in which mean annual flow increases for the majority of gauges. For approximately half of the gauging stations, no trends were identified in 1956–2016 [18]. Our results in the north-eastern part of Poland are consistent with the results of Piniewski et al. [18]. The changes in high water stage metrics in the multi-year period 1983–2014 for the selected catchments of the upper Vistula basin in southern Poland indicated upward not significant trends for maximum flows and increasing incidence of high water events [19]. In a small watershed, located in Central Poland, in the period 1981–2015, a significant decrease was observed in the mean annual discharge on a daily basis (−2.5 Ls−1year−1) [20].
The climate conditions of Central Europe allow for discerning two distinct periods in the hydrological cycle, namely, the winter half-year (November–April) and the summer half-year (May–October), which together form the hydrological year. In the winter half of the year, the water resources are replenished as a result of minimal evaporation due to low temperatures, the presence of a snow layer, and the lack of vegetation, while in the summer half of the year, the accumulated water is expended. HW levels mostly occur in two cases, either as a result of the inflow of water from melting snow at the end of winter or as a result of summer storms. Climate change has led to a decrease in snowfall during winter, which in turn reduced the possibility of spring flooding; however, Intergovernmental Panel on Climate Change (IPCC) prognoses indicate an increased risk of summer storms [21]. Both processes are important for riparian vegetation. Floods at the break of spring create favorable conditions for plant layer growth and fill the soil with water for many months, while summer floods strongly impact already developed vegetation. Climate change will increase PET and the manifestation of long-term droughts in Central Europe. The study shows that a small stream in the last 50 years significantly reduced the number of days with HW, which results in smaller inundations both in terms of area and duration. Similar phenomena are reported in boreal forests [22]. However, the hydrological conditions in Northern Europe and the boreal areas are different from those in Central Europe. Hydrological modeling for the boreal areas in Sweden predicts the mean annual runoff to increase by up to 24% with decreased spring-flood peaks, an increased frequency of high flow events during fall, and higher winter flows for the period 2071–2100 [23]. These changes will lead to increased discharge in the boreal rivers [24]. In Northern Europe, intensified permafrost thaw and glacier melting will temporarily increase the water supply to streams and rivers, but future hydrological conditions will become more unstable [22]. Due to the lack of a water supply from melting glaciers in Central Europe, the changes here are expected to proceed faster. Moreover, in Central Europe in recent years, snow cover during the winter has been decreasing and tends to melt much earlier [25,26,27]. In winter 2019/2020, in the large areas on lowlands of Poland, snow cover did not occur at all or was fragmented and largely ephemeral, as confirmed by satellite data [28]. Earlier snowmelt and thinner snowpacks will also result in earlier and smaller spring floods [23].
Fewer days with HW and smaller floods are expected to have a strong impact on coastal vegetation, including riverside forest habitats. The lower magnitudes of spring floods are predicted to result in narrower riparian zones and consequently in depleted plant species richness [22]. Groundwater table fluctuations may be critical for riparian vegetation because of a temporal shift between the higher groundwater supply and the growing season [22].
The great importance of riparian forest triggers activities aimed at their restoration. Highly functioning forested wetland can be established in 40–60 years, but complete restoration towards a fully developed mature species-rich forest may require 100 years or more [29]. Given the observed reduction in frequency of high water levels and runoff tide days, the process and efforts to restore riparian forest can be extremely difficult.
5. Conclusions
In this study, we investigated trends in climatic and hydrological variables in a small watershed, typical for European lowlands, based on 50 years of observations. Long-term measurements from 1970 to 2019 indicated significant increase in air temperature (by 2.1 °C) and potential evapotranspiration (by 65 mm) but annual sum of precipitation remained almost at the same level. We found significant downward trends for annual runoff (by 152 mm) and number of days with high water levels. The average number of days per year with high water level amounted to 36 in 1970–1979 but only to 3 in 2010–2019. In small lowland forest rivers, a systematic decrease in the number of days with HW level is observed. This phenomenon results in the reduction and shortening of the duration of floods, which may affect the sustainability and biodiversity of forest riparian habitats. This process cannot be attributed to anything but global warming.
Author Contributions
A.B. designed the study, conducted data analyses, wrote the paper; A.K. contributed to writing the manuscript, supported data analysis; A.S. data curation. All authors have read and agreed to the published version of the manuscript.
Funding
Long-term measurements were carried out as part of projects founded by the Ministry of Science and Higher Education through a statutory activity and by The Polish State Forests National Forest Holding. This work was funded by the Ministry of Science and Higher Education through a Forest Research Institute statutory activity no. 900125.
Acknowledgments
The authors would like to give special thanks to the Institute of Meteorology and Water Management-National Research Institute (IMGW-PIB) for providing data on temperature.
Conflicts of Interest
The authors declare no conflict of interest. The funders had no role in the design of the study; in the collection, analyses, or interpretation of data; in the writing of the manuscript, or in the decision to publish the results.
References
- Cerici, N.; Weissteiner, C.J.; Paracchini, M.L.; Strobl, P. Riparian Zones: Where Green and Blue Networks Meet, Pan-European Zonation Modelling Based on Remote Sensing and GIS; JRC Scientific and Technical Report; JRC EUR 24774 EN 2011; Office for Official Publication of the European Communities: Luxembourg, 2011; ISBN 978-92-79-19799-4. [Google Scholar]
- Kondolf, G.M.; Piégay, H.; Landon, N. Changes in the riparian zone of the lower Eygues River, France, since 1830. Landsc. Ecol. 2007, 22, 367–384. [Google Scholar] [CrossRef]
- Naiman, R.J.; Decamps, H.; Pollock, M. The role of riparian corridors in maintaining regional biodiversity. Ecol. Appl. 1993, 3, 209–212. [Google Scholar] [CrossRef] [PubMed]
- Webb, R.H.; Leake, S.A. Ground-water surface-water interactions and long-term change in riverine riparian vegetation in the southwestern United States. J. Hydrol. 2006, 320, 302–323. [Google Scholar] [CrossRef]
- Stromberg, J.C.; Tiller, R.; Richter, B. Effects of groundwater decline on riparian vegetation of semiarid regions: The San Pedro, Arizona. Ecol. Appl. 1996, 6, 113–131. [Google Scholar] [CrossRef] [Green Version]
- Eamus, D.; Froend, R.; Loomes, R.; Hose, G.; Murray, B. A functional methodology for determining the groundwater regime needed to maintain the health of groundwater-dependent vegetation. Aust. J. Bot. 2006, 54, 97–114. [Google Scholar] [CrossRef] [Green Version]
- Karrenberg, S.; Edwards, P.J.; Kollmann, J. The life history of Salicaceae living in the active zone of floodplains. Freshw. Biol. 2002, 47, 733–748. [Google Scholar] [CrossRef]
- Politti, E.; Egger, G.; Angermann, K. Evaluating climate change impacts on Alpine floodplain vegetation. Hydrobiologia 2014, 737, 225–243. [Google Scholar] [CrossRef]
- Salmi, T.; Määttä, A.; Anttila, P.; Ruoho-Airola, T.; Amnell, T. Detecting Trends of Annual Values of Atmospheric Pollutants by the Mann-Kendall Test and Sen’s Slope Estimates—The Excel Template Application MAKESENS; Publications on Air Quality. No. 31; Finnish Meteorological Institute: Helsinki, Finland, 2002.
- Sen, P.K. Estimates of the regression coefficient based on Kendall’s tau. J. Am. Stat. Assoc. 1968, 63, 1379–1389. [Google Scholar] [CrossRef]
- Białkiewicz, F. Development of a Pre-Melioration Study of the Forested Parts of the Lebiedzianka and Jastrzębianka River Catchments; Forest Research Institute: Warsaw, Poland, 1971. (In Polish) [Google Scholar]
- Database of the State Forests, National Forest Holding. Available online: www.bdl.lasy.gov.pl (accessed on 21 November 2020).
- Thornthwaite, C.W. An Approach toward a Rational Classification of Climate. Geogr. Rev. 1948, 38, 55–94. [Google Scholar] [CrossRef]
- Palmer, M.A.; Lettenmaier, D.P.; Poff, N.L.; Postel, S.L.; Richter, B.; Warner, R. Climate Change and River Ecosystems: Protection and Adaptation Options. Environ. Manag. 2009, 44, 1053–1068. [Google Scholar] [CrossRef]
- Kundzewicz, W.Z.; Ulbrich, U.; Brücher, T.; Graczyk, D.; Krüger, A.; Leckebusch, G.C.; Menzel, L.; Pińskwar, I.; Radziejewski, M.; Szwed, M. Summer Floods in Central Europe—Climate Change Track? Nat. Hazards 2005, 36, 165–189. [Google Scholar] [CrossRef]
- Smith, D.M.; Finch, D.M. Riparian trees and aridland streams of the southwestern United States: An assessment of the past, present, and future. J. Arid Environ. 2016, 135, 120–131. [Google Scholar] [CrossRef] [Green Version]
- Kundzwicz, Z.W.; Matczak, P. Climate change regional review: Poland. WIREs Clim. Chang. 2012, 3, 297–311. [Google Scholar] [CrossRef]
- Piniewski, M.; Marcinkowski, P.; Kundzewicz, Z.W. Trend detection in river flow indices in Poland. Acta Geophys. 2018, 66, 347–360. [Google Scholar] [CrossRef] [Green Version]
- Walega, A.; Młyński, D.; Bogdał, A.; Kowalik, T. Stages in Selected Catchments of the Upper Vistula Basin in the South of Poland. Water 2016, 8, 394. [Google Scholar] [CrossRef]
- Krajewski, A.; Sikorska-Senoner, A.E.; Ranzi, R.; Banasik, K. Long-Term Changes of Hydrological Variables in a Small Lowland Watershed in Central Poland. Water 2019, 11, 564. [Google Scholar] [CrossRef] [Green Version]
- Masson-Delmotte, V.; Zhai, P.; Pörtner, H.-O.; Roberts Skea, J.; Shukla, P.R.; Pirani, A.; Moufouma-Okia, W.; Péan, C.; Pidcock, R.; Connors, S.; et al. (Eds.) Global Warming of 1.5 °C; An IPCC Special Report on the Impacts of Global Warming of 1.5 °C above Pre-Industrial Levels and Related Global Greenhouse Gas Emission Pathways, in the Context of Strengthening the Global Response to the Threat of Climate Change, Sustainable Development, and Efforts to Eradicate Poverty; World Meteorological Organization: Geneva, Switzerland, 2018. [Google Scholar]
- Nilsson Ch Jansson, R.; Kuglerova, L.; Lind, L.; Ström, L. Boreal riparian vegetation under climate change. Ecosystems 2013, 16, 401–410. [Google Scholar] [CrossRef]
- Andrèasson, J.; Bergström, S.; Carlsson, B.; Graham, P.; Lindström, G. Hydrological change: Climate change impact simulations for Sweden. Ambio 2004, 33, 228–234. [Google Scholar] [CrossRef]
- Falloon, P.D.; Betts, R.A. The impact of climate change on global river flow in HadGEM1 simulations. Atmos. Sci. Lett. 2006, 7, 62–68. [Google Scholar] [CrossRef]
- Dong, C.; Menzel, L. Recent snow cover changes over central European low mountain ranges. Hydrol. Process. 2020, 34, 321–338. [Google Scholar] [CrossRef]
- Robinson, D.A. Northern Hemisphere continental snow cover extent [in Blunden, J; Arndt, D.S. State of the Climate in 2019]. Bull. Amer. Meteor. Soc. 2020, 101, S1–S429. [Google Scholar] [CrossRef]
- Szwed, M.; Pińskwar, I.; Kundzewicz, Z.W.; Graczyk, D.; Mezghani, A. Changes of snow cover in Poland. Acta Geophys. 2017, 65, 65–76. [Google Scholar] [CrossRef] [Green Version]
- Snow Cover Extent in Europe Based on Satellite Observation. Earth Observation Group at Space Research Centre of the Polish Academy of Sciences. Available online: http://zoz.cbk.waw.pl/snieg/en/#pl (accessed on 10 September 2020).
- Craft, C. Creating and Restoring Wetlands; From Theory to Practice; Elsevier: Amsterdam, The Netherlands, 2016; ISBN 978-0-12-407232-9. [Google Scholar]
Figure 1.
Location of the Lebiedzianka catchment.

Figure 2.
Forest types in the State Forests in the Lebiedzianka catchment in 1970 and 2001.

Figure 3.
Climatic conditions in the Lebiedzianka River basin from 1970 to 2019: (a) annual sum of precipitation, (b) average annual, maximum, and minimum air temperature, (c) annual sum of the evapotranspiration, (d) annual climatic water balance. (Equations for trend lines are summarized in Table 1).

Figure 4.
Water level characteristics in the Lebiedzianka River from 1970 to 2019: (a) frequency distribution of the daily values of water levels, (b) boxplot of daily water levels, (c) number of days with high water per year, (d) maximum annual water level (Lmax), (e) catchment runoff (H) from 1970 to 2016. (The equations for trend lines are summarized in Table 1).

Figure 5.
HP−1 ratio from 1970 to 2019. (The equation for the trend line is presented in Table 1).
Figure 5.
HP−1 ratio from 1970 to 2019. (The equation for the trend line is presented in Table 1).


Table 1.
Summary of the Mann–Kendall test and Sen’s slope estimation.
| Time Series | First Year | Last Year | n | Z-Value | Significance of the Trend a | Linear Regression Equations Based on Sen’s Method |
|---|---|---|---|---|---|---|
| Precipitation (P) | 1970 | 2019 | 50 | −1.35 | n.s. | P(year) = −1 (year—1970) + 631.5 |
| Temperature (T) | 1970 | 2019 | 50 | 4.56 | *** | T(year) = 0.0428 (year—1970) + 5.699 |
| Evapotranspiration (PET) | 1970 | 2019 | 50 | 5.77 | *** | PET(year) = 1.324 (year—1970) + 548.58 |
| Climatic water balance (CWB) | 1970 | 2019 | 50 | −2.33 | * | CWB(year) = −2.591 (year—1970) + 75.894 |
| Maximum water level (Lmax) | 1970 | 2019 | 48 | −4.63 | *** | Lmax(year) = −0.935 (year—1970) + 326.206 |
| Number of days with high water (NHW) | 1970 | 2019 | 48 | −4.62 | *** | NHW(year) = −0.362 (year—1970) + 15.397 |
| Runoff (H) | 1970 | 2016 | 45 | −5.02 | *** | H(year) = −3.297 (year—1970) + 233.44 |
| HP−1 ratio | 1970 | 2016 | 45 | −5.15 | *** | HP−1(year) = −0.00489(year—1970) + 0.3713 |
a level of significance: * α = 0.05; ** α = 0.01; *** α = 0.001; and n.s. α > 0.1.
Publisher’s Note: MDPI stays neutral with regard to jurisdictional claims in published maps and institutional affiliations. |
© 2020 by the authors. Licensee MDPI, Basel, Switzerland. This article is an open access article distributed under the terms and conditions of the Creative Commons Attribution (CC BY) license (http://creativecommons.org/licenses/by/4.0/).
Share and Cite
MDPI and ACS Style
Boczoń, A.; Kowalska, A.; Stolarek, A. The Impact of Climate Change on the High Water Levels of a Small River in Central Europe Based on 50-Year Measurements. Forests 2020, 11, 1269. https://doi.org/10.3390/f11121269
AMA Style
Boczoń A, Kowalska A, Stolarek A. The Impact of Climate Change on the High Water Levels of a Small River in Central Europe Based on 50-Year Measurements. Forests. 2020; 11(12):1269. https://doi.org/10.3390/f11121269
Chicago/Turabian StyleBoczoń, Andrzej, Anna Kowalska, and Andrzej Stolarek. 2020. "The Impact of Climate Change on the High Water Levels of a Small River in Central Europe Based on 50-Year Measurements" Forests 11, no. 12: 1269. https://doi.org/10.3390/f11121269
Note that from the first issue of 2016, this journal uses article numbers instead of page numbers. See further details here.