Effect of Forest Certification on International Trade in Forest Products
by
Jiaojiao Chen
1, 
Lanhui Wang
1,
Lingchao Li
1,
Juliana Magalhães
2,
Weiming Song
1,*,
Wenming Lu
3,
Lichun Xiong
4,5,
Wei-Yew Chang
6 and
Yujun Sun
1 1
School of Economics and Management, Beijing Forestry University, Beijing 100083, China
2
Department of Forest Resources Management, Faculty of Forestry, University of British Columbia, Vancouver, BC V6T 1Z4, Canada
3
International Bamboo and Rattan Organization, Beijing 100102, China
4
College of Economics and Management, Zhejiang Agriculture & Forestry University, Hangzhou 311300, China
5
Zhejiang Province Key Cultivating Think Tank Research Academy for Rural Revitalization of Zhejiang Province, Zhejiang A&F University, Hangzhou 311300, China
6
School of Economics, Lanzhou University, Lanzhou 730000, China
*
Author to whom correspondence should be addressed.
Forests 2020, 11(12), 1270; https://doi.org/10.3390/f11121270
Submission received: 2 November 2020
/
Revised: 25 November 2020
/
Accepted: 27 November 2020
/
Published: 28 November 2020
(This article belongs to the Special Issue Forest Management and Certification Systems)
Abstract
:Forest certification plays an important role in the global trade of legal, sustainably harvested timber. There is no accurate definition of how international forest certification systems impact international trade from a global perspective. This paper is intended to evaluate the influence of forest certification on international trade, so that it can provide a scientific basis for the improvement of the international forest certification systems and for the development of relevant forestry industries in different countries. First, the influence of forest certification on international trade of forest products is explained in the economic model; hence, four hypotheses are put forward. Second, to test these hypotheses, we verify the panel data of bilateral trade and forest certification of all forest products among 67 economies from 2009 to 2018 by incorporating forest certifications into the gravity model. Finally, tests by country groups and product groups were further analyzed, respectively. The results show that: (1) The extended Poisson pseudo maximum likelihood (PPML) estimation solves the problem of the heteroscedasticity and zero trade value problems of the gravity model well in the forest industry. (2) Forest certification has an export competitive effect, a trade barrier effect, as well as common language effect. (3) Forest certification has asymmetric trade effects. The export competitive effect of forest certification in developing countries is greater than that in developed countries. Forest certification has become a trade barrier for developing countries, especially in the process of trade with developed countries. The common language effect is higher during the trade between developed and developing countries. The export competitive effect of wood products is higher than that of furniture products. Forest certification has trade barrier effect on wood products in developing countries, while it has trade barrier effect on furniture products in developed countries.
1. Introduction
Forest certification began in the early 1990s and intended to address a range of forest sustainability and management issues, including illegal logging, deforestation, biodiversity loss and forest degradation. It is a global environmental governance system with positive environmental externality [1], which promotes the sustainable management of global forests [2]. Forest certification is a voluntary market behavior whereby independent third party “certifiers” assess the quality of forest management and production in accordance with the standards, criterions and principles predefined by the International Organization for Standardization (ISO) [3]. There are two dominant international forest certification systems: the Forest Stewardship Council (FSC) and the Program for the Endorsement of Forest Certification Schemes (PEFC). Forest certification, as an international public good [4], is gradually supported by many governments of developed countries in Europe and North America and developing countries in Asia and Africa. The governments participate in the development of forest certification through policies such as taxation, subsidies, and government procurement. Therefore, forest certification is a multi-stakeholder standard combined of market mechanisms [5,6] and government mechanisms [7].
Meanwhile, forest certification plays an important role of global trade in forest products. The purpose of forest certification is to create barriers to those producers who use illegal timber, contribute to deforestation, forest degradation and disadvantage indigenous people. Countries are the main actors of global forest governance, even though forest owners or companies are the main subject of certification, and they are governed by their national interests and objectives. Therefore, in the process of international trade in forest products, the certification regulatory process may have a more indirect impact on trade of legal, sustainably harvested timber than tariffs.
However, forest certification has become one of the most controversial issues as one tool of trade in contemporary international forest policies. First, the performance and impact of forest certification is different among countries due to the differences in forestry development and social awareness levels in different economies [7]. Under the trade protectionism, “standard” trade barriers [8] will restrict the economic development of some countries and will become one of the obstacles to world economic development for a long period of time. Second, certification can be prejudiced against some stakeholders, such as small forest holders, and this is reflected as a barrier in international trade [9]. Third, forest certification tends to become the political weapon of developed countries, and certification requirements are increasingly prominent in the non-tariff barriers debate [10,11], which hinder trade of legal, sustainably harvested timber.
Although forest certification has been widely studied, there is still no accurate definition of how international forest certification systems impact international trade from a global perspective. Among the economic literature on forest certification, market behaviors are the main focus, such as consumer cognition [12,13], cost and premium [14,15,16], market penetration [17,18], etc. Most studies from the national scope have generally claimed that forest certification has a negative impact on trade, such as Brazil [19], China [20,21,22], Chile [23], etc. From the limited existing evidences from a global perspective, Brenton [24] and Rametsteiner et al. [25] identified that forest certification was not conducive to trade for developing countries and was likely to become a trade barrier from the perspective of ethical trade and political factors, respectively [5,19,26]. Therefore, the evidence of existing studies on the impact of forest certification on international trade in forest products is scattered and unclear in academia. By reviewing the previous research about the research methods, the gravity model is recognized as one of the most effective tools for estimating international trade flows and is widely used in the study of the impact of the international standard (ISO 9000 or ISO 14000) on trade in different industries [27,28]. However, the endogeneity and heterogeneity problems in the gravity model require more verification, especially in the trade of forest products.
In this regard, we intend to fill in these research gaps by evaluating the influence of forest certification on international trade, so that it provides a scientific basis for the improvement of the international forest certification system and the development of relevant forestry industries in different countries. The objective of this paper is to study the effect of international forest certification standards on international trade in forest products from the global perspective. To undertake the test, we attempt to answer three questions:
- How to explain the influence of forest certification on international trade in forest products with an economic model?
- From the perspective of global trade, does the existence of a forest certification standard promote or hinder trade? If it promotes trade, how does that happen (e.g., competitive advantage)? If it impedes trade, what is the nature of the trade barrier (e.g., political or non-tariff)?
- What is the specific impact of different countries and different forest products?
2. Background
2.1. Number, Products and Countries of Forest Certification
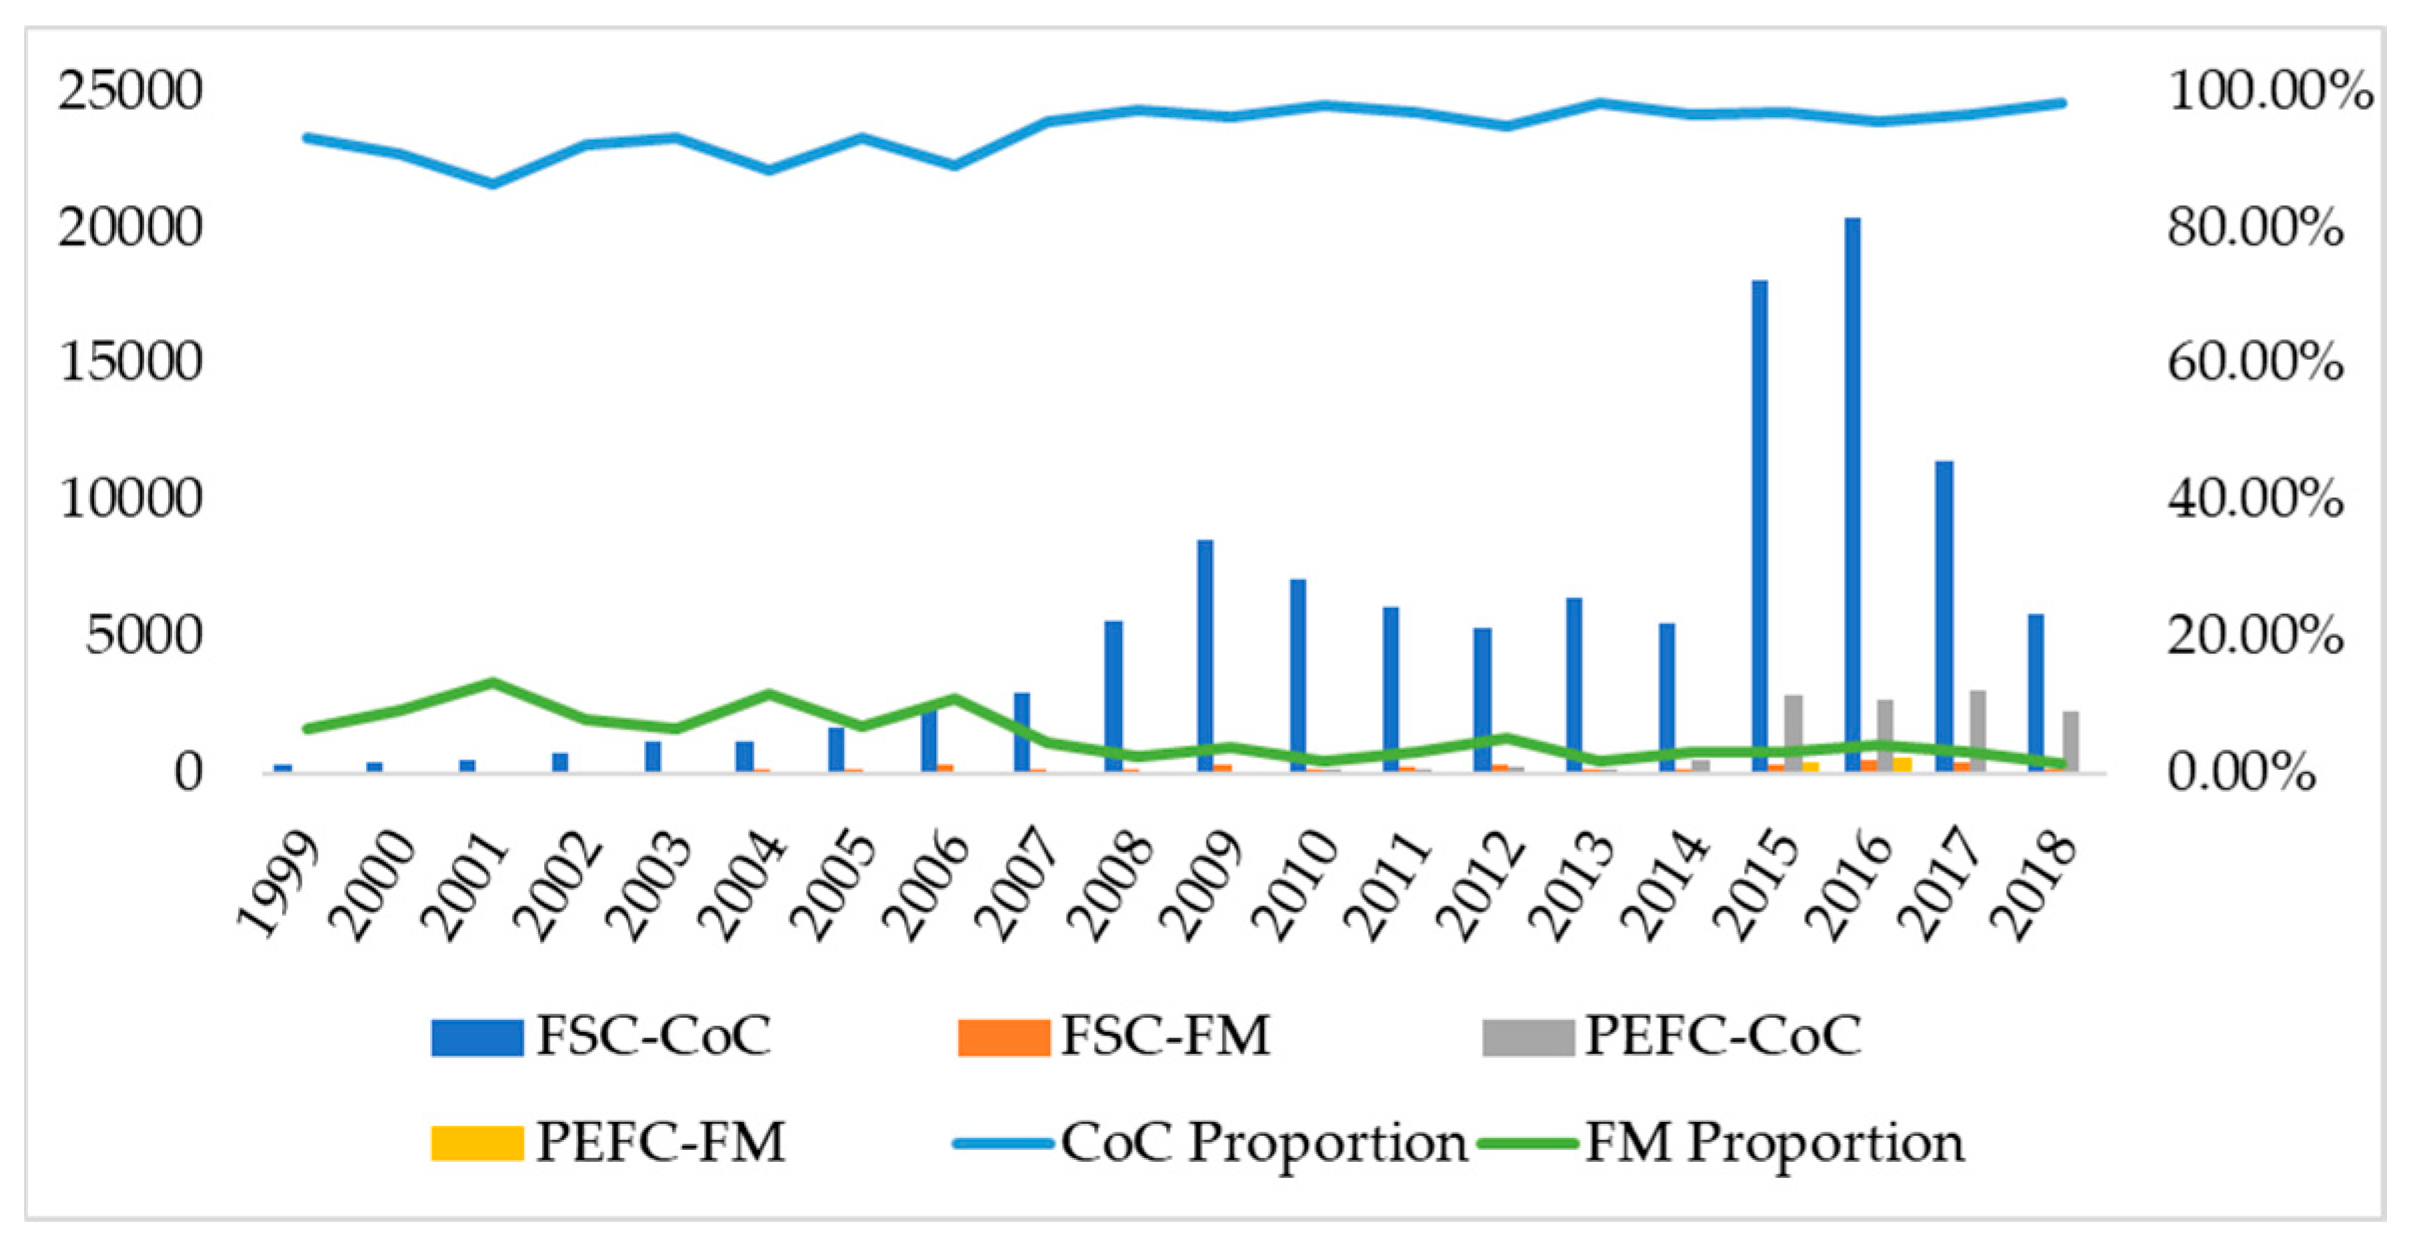
Forest certification applies to forest management (FM), as well as to the forest supply chain, the “Chain of Custody (CoC)”, ensuring the traceability of wood products from a certified forest during the process of trade. We mainly analyze the two most widely used and dominant international systems: FSC and PEFC. According to the basic data of certificates from the FSC website [29] and the PEFC website [30] as of November 2019, and further processing, there are a total of 270,847 certification records, as shown in Table 1. Among them, the records of FSC and PEFC are 236,677 and 34,170, respectively, while the records of CoC are far more than those of FM. (Note 1: the basic data from the certificates of FSC and PEFC are downloaded from the FSC and PEFC websites. Based on the certificates, the authors obtained statistics by year, country, certification type and different forest products. Figure 1 and Table 1, Table 2 and Table 3 are drawn based on the statistical data. Please ask the authors for the relevant data or statistical procedures if required).
The FSC started its first certification in 1993, while the PEFC started in 2005. As can be seen from Figure 1, the number of CoC is more than that of FM in both FSC and PEFC. The proportion of FM in the total number of certifications is constantly decreasing. In 2001, the number of FM accounted for 13.44% of the total number of certifications, which decreased to 4.47% in 2007 and to only 1.49% in 2018. However, the proportion of CoC has been rising in recent years. In the trading component, the focus is on chain of custody standards related to the companies (industry), and not to the forest management component. Since 2008, the number of both FSC and PEFC has increased significantly. According to the trend of statistics, the number of FSC and PEFC certifications will increase continuously.
According to the FSC data as of December 2019, there are three main categories of certified products (Table 2) (the trend of PEFC certified products and countries is similar to that of FSC. Please ask the authors for the relevant data if required): non-wood forest products, paper and pulp products and wood forest products. The number of certifications for non-wood forest products is relatively small compared to the other products, with only 1367 records (0.92%). The number of certifications for paper and pulp products is 52,062 (34.92%). The certified quantity of wood forest products is 95,649, particularly more in rough wood, solid wood, and wood package products. We further classify wood forest products into two categories: one is low value-added products that are mainly labor-intensive, and the primary wood forest products in FSC are W1–W9, whose total certified quantity is 41,526 (27.86%). The other category is high value-added products that are technology and capital intensive, and are W10–W19 furniture in FSC, whose total certified quantity is 54,123 (36.31%).
In terms of certified countries, there are 78 countries with more than 100 FSC certifications as of November 2019. Among those, 34 are developed countries, five are transition economies and 39 are developing countries (Table 3).
2.2. International Trade in Forest Products
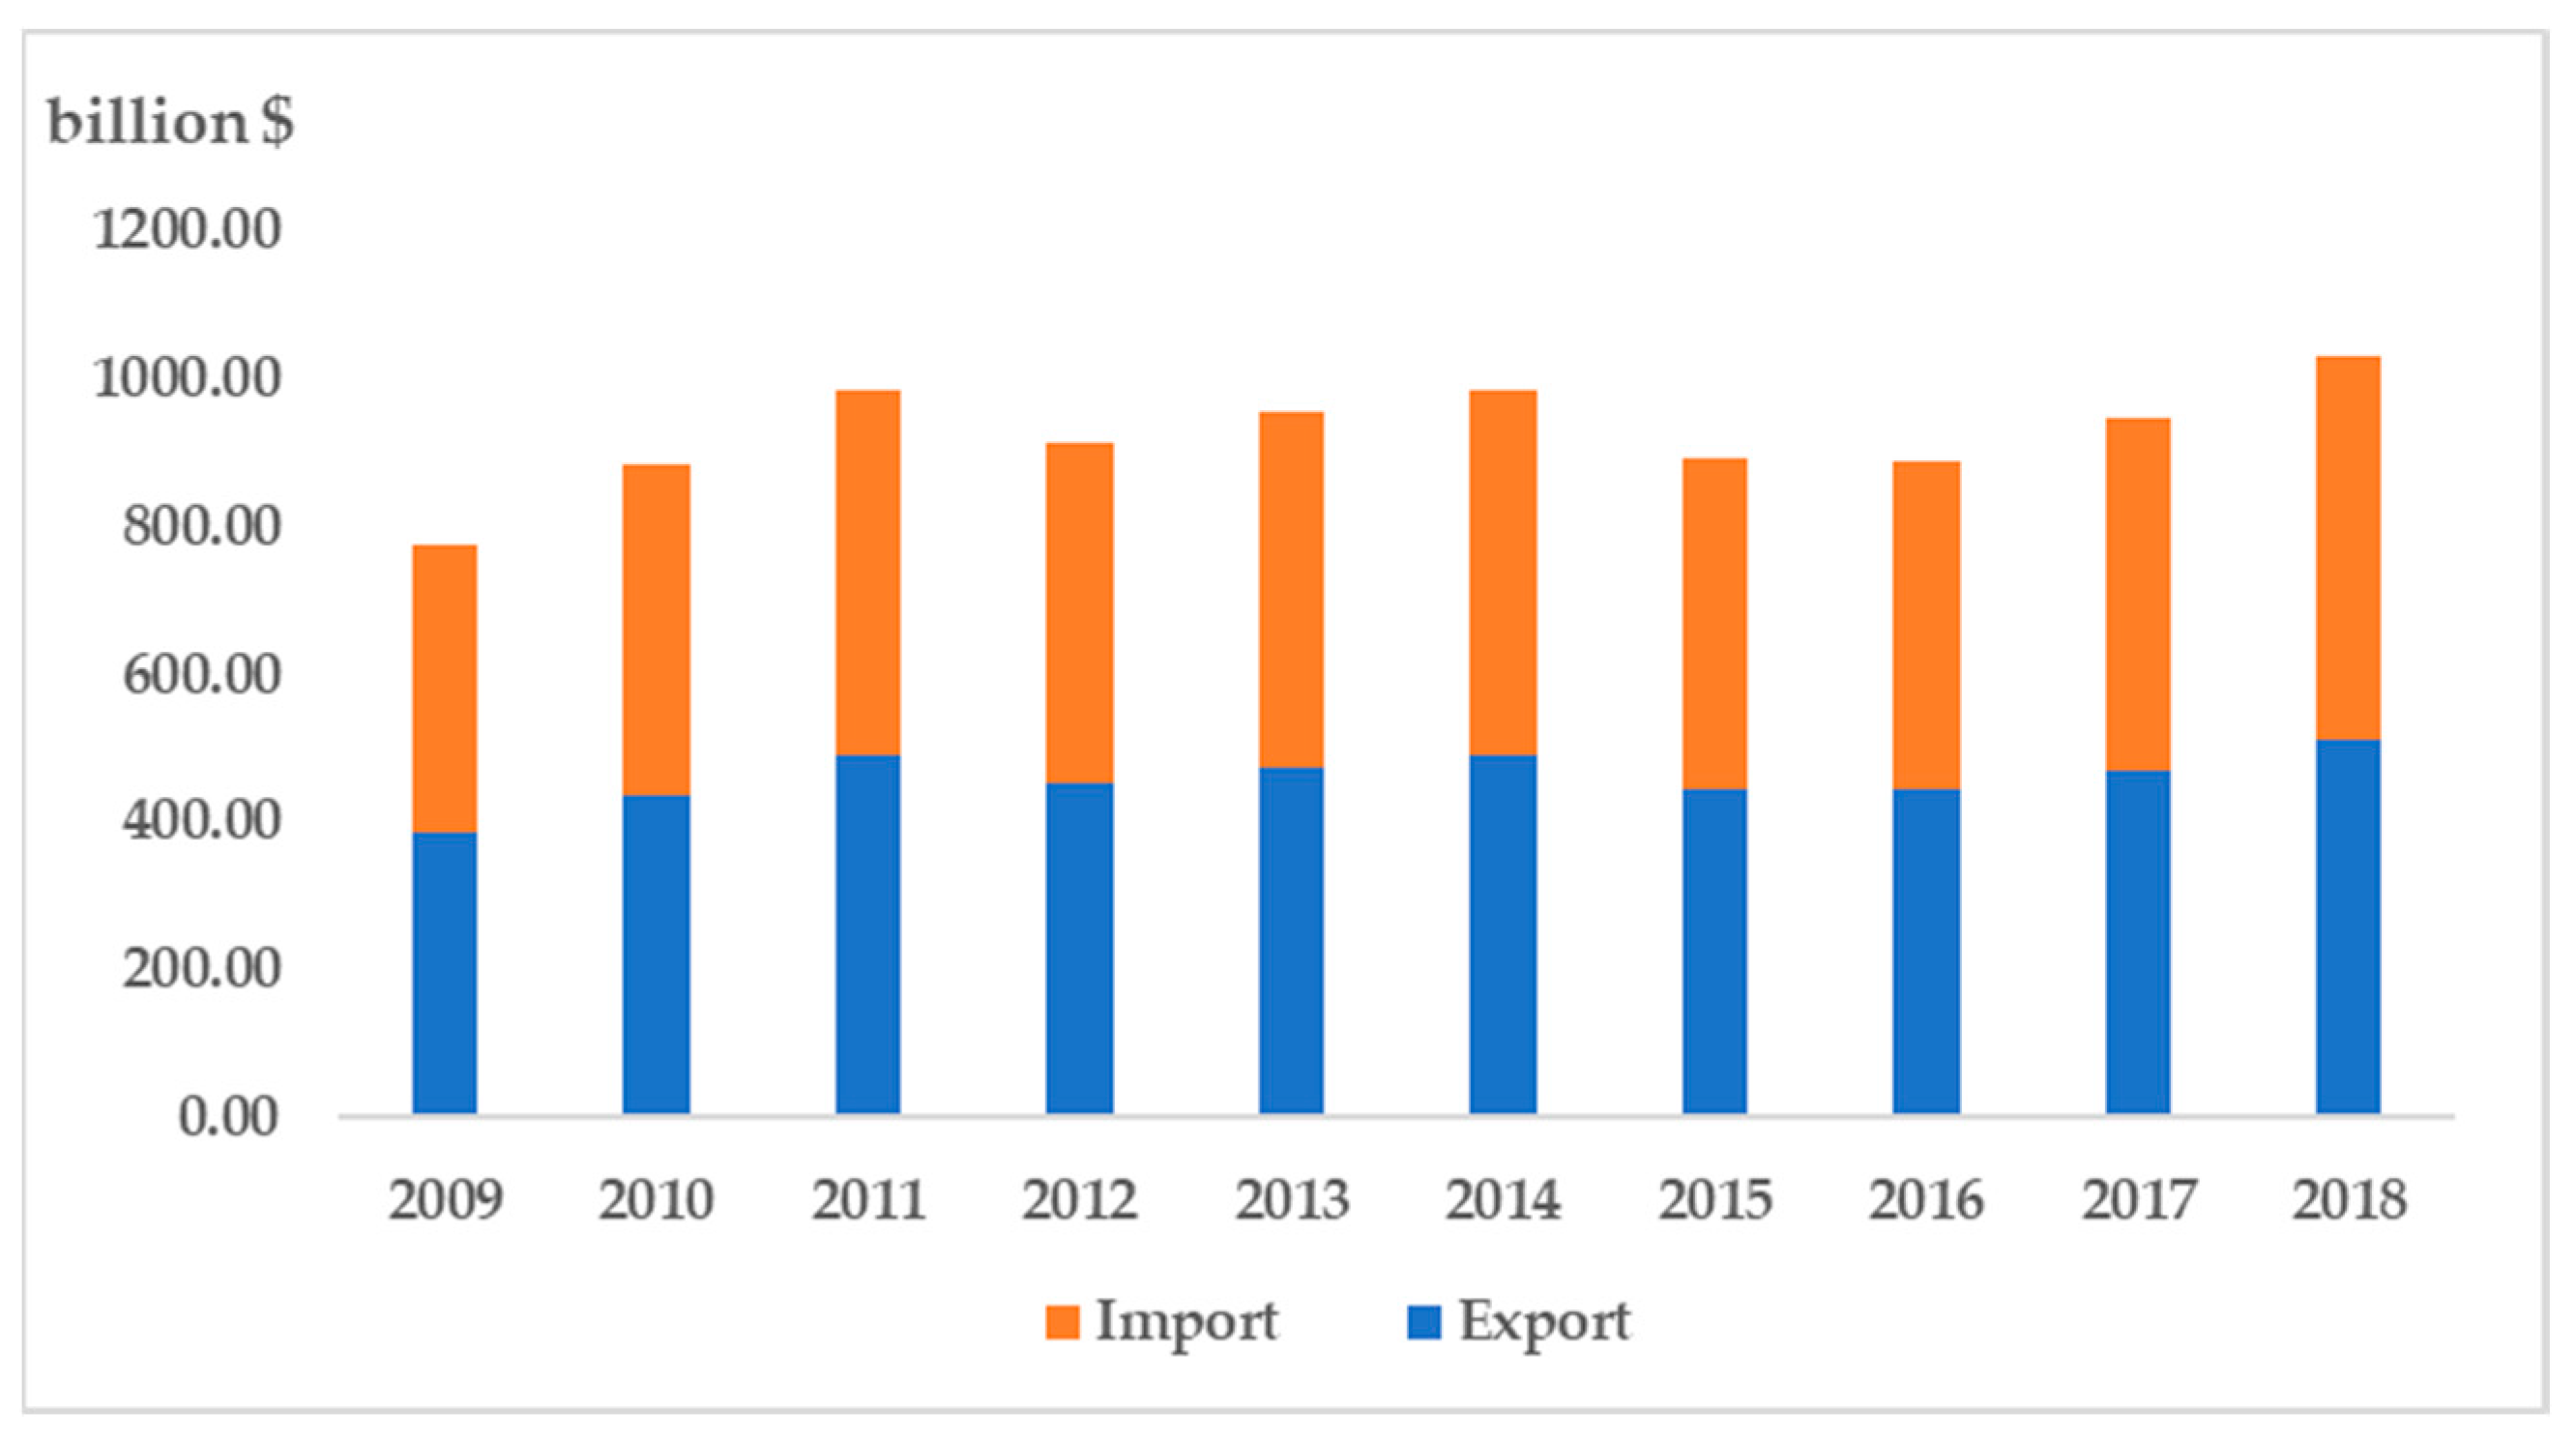
According to the data from United Nations Commodity Trade Statistics Database, UN Comtrade [31], the world trade value in forest products grew steadily from 2009 to 2018. The total value of world trade in forest products had reached USD 1030.76 billion, an increase of 32.91% over that of 2009 at the end of 2018 (Figure 2).
In 2018, the total trade value of wood products and furniture was USD 297.53 billion and USD 137.91 billion, respectively, accounting for 28.86% and 13.38% of the total trade value of forest products. From the perspective of the export market of furniture and wood products in 2018 (Figure 3), China is the biggest furniture exporter country, with an export value of USD 22.94 billion, accounting for 32.25% of the world’s furniture exports’ value, followed by Poland and Italy. China is also the biggest wood forest products exporter, with the export value of USD 14.89 billion, accounting for 10.31%, followed by Canada and Germany.
3. Materials and Methods
3.1. Model Specification
3.1.1. Basic Model
Forest certification is a method of introducing to consumers the sustainability of forest products and is a green quality standard certification to prove that products are derived from sustainably managed forests [1]. Normally, the improvement of green quality level of forest products comes from the improvement of the internal management [32,33] and technical level [34] by enterprises and forest landowners required by forest certification standards. We assume that consumers (importing countries) in the international market have the same preferences and can consume multiple units of products. The utility function of consumers is characterized by the Dixit–Spence–Bowley function:
where, represents the quantity of product of the importing country, and is the number of combination products. represents the green quality parameter of product. We assume that different countries have different green quality. Product 1 is from developed countries, and product 2 is from developing countries. Generally, the green quality of developed countries is higher than that of developing countries [5], namely . is the degree of substitution of two products, distributed in [0, 1]. When , the two products are completely irreplaceable, while is completely substitutable. The parameter is a simplified assumption that determines that the demand function depends only on the vertical intercept.
Then, we construct the cost function of producers (exporting countries). Assuming that all certified forest products are required to have the same standards of forest certification, and the cost function is:
In Equation (2), is the green quality level of the forest products, is the forest technology development level, and is the production volume of the forest products. In order to improve the green quality level of forest products, forest certification will increase the cost of enterprises and forest management, including direct certification cost and indirect improvement cost, and the same is true for the technology development level. The cost also increases with the increase in production volume. Hence, the cost of forest certification is positively correlated with the green quality level of the forest products, the forest technology development level, and the production volume. Then:
Generally, the green quality level of developed countries is higher than that of developing countries [35], and the forest technology development level of developed countries is higher than that of developing countries [5]. We assume that the production volume in both developed and developing countries is equal. When developing countries reach the same level of green quality and forest technology development as developed countries, the cost for developing countries is higher than that for developed countries. Hence:
We refer to Garella and Petrakis’ [36] hypothesis on the cost of green quality products. In a unified international market composed of two countries, each country has an enterprise that produces only one kind of product, and there are vertical differences and horizontal differences between the two products. Enterprises compete for green quality and price of products simultaneously. The cost function of the enterprise is:
Equation (5) shows that the cost is composed of two aspects. The first is the unit cost, where and are the output of the enterprise, which is the same for any country. The second item is the green quality cost of the product.
3.1.2. Model of Pre-Certified and Post-Certified
We aim to solve the problem of consumer maximization with the above basic model. That is,
Under the condition of complete information, we can obtain the inverse demand functions of the two products by maximizing the utility:
Then, the demand curve equation can be obtained as follows:
Take the derivative of :
Equation (9) demonstrates that the higher the level of green quality development of forest products in a country, the larger the demand for its products.
In the process of eco-service system certification, lack of information is often an obstacle for sellers [37]. Forest certification contains an important attribute, a label that transmits green quality of forest products [38], which is conducive to consumers’ judgment and affects the demand for certified products. We introduce consumer incomplete information conditions into the model according to Garella and Petrakis [36]. It is assumed that incomplete information with the absence of a forest certification label means each consumer has their own green quality information about each product. The consumer’s green quality information of a product is . The probability that a consumer has accurate information about the green quality of a product is , and the probability with inaccurate information is .
Therefore, for consumers, the probability of obtaining the accurate information of product 1 and product 2 is , the probability of obtaining the inaccurate information of product 1 and product 2 is , the probability of obtaining the accurate information of product 1 and inaccurate information of product 2 is and the probability of obtaining the inaccurate information of product 1 and accurate information of product 2 is . Hence, the consumer demand for product 1 is:
Substituting , and into Equation (8), we can get the general expression of total demand for product without forest certification label :
According to Equation (11), the demand for goods is a linear demand function, which depends on the green quality level of the two goods, the accuracy of the information, and the probability of obtaining the accurate information. With the acquisition of the forest certification label, the demand for the products is:
To determine the change in consumer demand for products with the introduction of the forest certification label, we performed a differential:
Lack of recognition of the forest certification causes inaccurate information of a product, which underestimates the level of green quality of the product. In this regard, the green quality level with wrong product information is lower than that with accurate product. Hence, and .
Take the derivative of the degree of information possessed of Equation (11):
The extent that consumers in different countries acquire accurate information is different. Generally, developed countries have more complete information markets than developing countries [27,39]. According to Equation (11), we find that the smaller the of developing countries is, the greater the demand for the product with the derivative of in Equation (11), namely the more incomplete information markets in developing countries, the more significant the trade effect of certification.
Hypothesis 1 (H1).
Forest certification improves the green quality of a country’s products; thus, increasing export competitiveness.
Hypothesis 2 (H2).
The information effect of forest certification promotes export.
Hypothesis 3 (H3).
The export effect of forest certification in developing countries is superior to that in developed countries.
3.1.3. Model of Equilibrium
In the international market, two enterprises simultaneously compete for green quality and price of products. The process of competition can be described by the perfect equilibrium of a two-stage sub-game. We first seek the equilibrium in the stage of price competition, and then seek the equilibrium in the stage of green quality competition. Enterprise prices the product with the green quality to maximize the profit:
The first stage is the price competition. Take the derivative of , then:
Equilibrium price and equilibrium output can be obtained, respectively:
The second stage is the green quality competition. Take the derivative of , then
The equilibrium green quality is:
We take the derivative with respect to the degree of substitution of two products :
The equilibrium green quality of the product decreases with the increase in the degree of substitution, that is, the higher the degree of substitution, the lower the green quality of the product. In the forest sector, the degree of substitution of the manufacturing sector is higher than that of the primary product sector. Thus, the green quality of the manufacturing sector is lower than that of the primary product sector. Further, according to Equation (9) and Hypothesis 1, products with higher green quality export more than products with lower green quality.
Hypothesis 4 (H4).
The trade effect of forest certification in the manufacturing sector is higher than that in the primary product sector.
3.2. Methodology and Data
We used the gravity model to test the above hypotheses. The theoretical assumptions of the basic gravity model [40] are as follows: (1) monopolistic competitive market; (2) constant elasticity of substitution (CES); and (3) iceberg cost, that is, the loss of transportation cost. The equation of the basic gravity model is:
Equation (22) is the export trade equation of the exporting country to the importing country . is the volume of trade from the exporting country to the importing country, and are the economic aggregate of the exporting country and the importing country, and is the distance between the two countries. Then, the basic gravity model is logarithmically treated, and the linear regression equation is:
In this paper, the standard gravity model was modified and forest certification variables were introduced to the basic gravity model in Equation (24) based on the discussion of international standards [28]. The fundamental gravity equation is composed of two parts, the index of importing and exporting country and the resistance term in Equation (25). Nine factors were considered that affected trade flow.
The trade volume between the two countries is directly and positively correlated to (1) the economic aggregate [41] between the two countries and negative correlated to (2) the geographical distance between the two countries. The core variable is the number of (3) forest certification, and we decomposed it into three aspects to analyze its impact on trade. (i) Forest certification in export country promotes or hinders trade, which does or does not have a competitive effect to enhance the export competitive advantage. (ii) Forest certification in import country promotes or hinders trade, which does or does not have the trade barrier effect. (iii) The common language effect is obtained from the interaction of forest certification in importing and exporting countries. The common language effect refers to the labeling function of forest certification to convey information about the sustainable management of forest products in the market [5,14]. (4) The population of the country is one of the factors because the greater the population is, the more demand for forest products there is, which promotes trade [42]. (5) A country’s infrastructure is considered as physical infrastructure, and is likely to be positively correlated with soft infrastructure such as standards according to Clougherty and Grajek [22]. Furthermore, four other resistance variables were taken into consideration. (6) Having a border between the two countries means closer geographic relations, which is conducive to trade between the two countries. (7) A common official language is more conducive to trade cooperation between the two countries. (8) A colonial relationship in history lends to closer trade. (9) The trade policy of the free trade agreement promotes trade. Table 4 shows the description and expected results of the variables contained in the model.
There are some problems with the gravity model. First, since zero natural logarithms do not exist, there is a potential bias associated with truncation of all zero trade observations. Second, due to the multiplication error term of the random gravity model, heteroscedasticity can make the results of the log-linear gravity model deviate. The multilateral resistance and panel data methods were used to overcome the endogeneity and heterogeneity problems in the gravity model referring to Clougherty and Grajek [28]. Then, the gravity equation was extended by the multilateral-resistance term (MR) referring to Baier and Bergstrand [45]. The constructed multilateral-resistance terms are and as showed in Equations (26)–(31).
where, .
4. Results
We first verified the panel data of bilateral trade and forest certification of all forest products among 67 economies from 2009 to 2018 and attempted to select the most appropriate estimation method for subsequent empirical test by comparing different regression specifications. Further, the analysis by four different country groups and the analysis by wood products and furniture products were subdivided to test Hypothesis 3 and Hypothesis 4.
4.1. Analysis by Total Sample
We first conducted an overall regression of 44,890 observations of 67 economies from 2009 to 2018 (Table 5). We attempted to compare various estimation methods so as to solve the problems of heteroscedasticity and autocorrelation that usually exist in gravity models. First, the baseline gravity equation does not specify other factors that influence trade, such as monetary union, religious culture, and race. To the extent that these trade drivers do not change over time, they can be controlled by a country-pair specific fixed-effects (FE) estimate. We also employed a random-effects (RE) estimate to control for these factors. Second, we expanded the gravity equation with the multilateral-resistance (MR) terms. Finally, Poisson pseudo maximum likelihood (PPML) estimation was adopted to solve the problem of zero trade volume [46]. Therefore, we compared eight estimates: the ordinary least squares (OLS), fixed-effect (FE) estimate, random-effects (RE) estimate, Poisson pseudo maximum likelihood (PPML), and expanded the multilateral-resistance (MR) terms of the above four estimates, OLS (MR), FE (MR), RE (MR) and PPLM (MR), respectively.
The results of the eight estimation methods are listed and compared in Table 6. In the OLS estimations, the logarithm of export volume is normally used as the explained variable, which excludes countries with zero bilateral trade volume. Only 11,052 observations are non-zero trade, accounting for only 25% of the total 44,890 observations. In Newtonian gravity, gravity may be small, but it is never zero. The reality is that most countries do not trade with other countries in the global market. Therefore, there would be a serious deviation if the trade observation value with zero was deleted directly in the OLS estimations. In addition, the OLS estimations greatly exaggerate the role of geographical colony, and its estimated elasticity (2.07%) is almost twice as high as PPML’s predicted elasticity (1.05%). This is consistent with the conclusion of the existing problems of OLS in comparison with several estimation methods in the gravity model by Silva and Tenreyro [42]. Another problem of the gravity model is heteroscedasticity, and the logarithmic linearization of the empirical model will lead to inconsistent estimates in this case. This bias exists not only in the OLS estimations, but also in the fixed-effects and random-effects for specific countries. We believe that the PPML estimation handles heteroscedasticity and zero trade value of gravity model well compared with the other estimation methods. PPML (MR) estimation is significant for all variables. Therefore, in the below analysis of the sample, as well as country groups and product groups, PPML(MR) estimation is selected to explain the results.
The regression results of PPML (MR) estimation in Table 6 show that the estimated direction of the main driving force of the gravity model is consistent with the results of literature. The GDP, population, and infrastructure index of both exporting country and importing country significantly promote export, while the distance between the two countries hinders export. The remaining dummy variables, including whether the two countries share a border, whether the two countries have the same official language, whether the two countries have colonial relations, as well as regional economic integration will promote export. Next, we mainly focus on explaining the core variables of forest certification.
The core variable of forest certification has three indicators reflecting its impact on exports. The coefficient of is 0.88, which indicates that when the quantity of forest certification increases by 1% in the exporting country, the export will increase by 0.88%. Hypothesis 1 is valid. Hence, forest certification has a competitive effect to enhance the export competitive advantage. The coefficient of is −0.14, meaning that the number of forest certifications in importing countries increases by 1%, while the value of export reduces by 0.14%. In this regard, forest certification has a trade barrier effect. The coefficient of is 0.06, indicating that forest certification can convey information about the sustainable management of forest products in import and export countries. In this regard, forest certification has a common language effect, which is consistent with Hypothesis 2.
4.2. Analysis by Country Groups
It should be noted that the performance of forest certification varies in different developed and developing countries. Further, we subdivided the data into four sub-models to assess the impact on different economies by PPML(MR) estimation (according to the UN Development Report 2019, we define the 67 countries studied in this paper. Firstly, 33 in the developed countries: Canada, the United States, Australia, Japan, New Zealand, Austria, Belgium, Denmark, Finland, France, Germany, Greece, Ireland, Italy, Luxembourg, the Netherlands, Portugal, Bulgaria, Croatia, Cyprus, Estonia, Hungary, Latvia, Lithuania, Poland, Slovakia and the Czech Republic, Spain, Sweden, Norway, Switzerland, England, Slovenia. Secondly, 34 in the developing world: Albania, Russia, Belarus, Ukraine, Egypt, Morocco, South Africa, China, Indonesia, Malaysia, Costa Rica, Gabon, the Philippines, South Korea, Thailand, India, Guatemala, Mexico, Panama, Argentina, Brazil, Chile, Turkey, Colombia, Ecuador, Peru, Uruguay, Lebanon, Pakistan, Sri Lanka, Oman, Qatar, Saudi Arabia, Turkey, United Arab Emirates). In other words, the exporting and importing countries are both developed countries (DC→DC), the exporting and importing countries are both developing countries (DIC→DIC), the exporting country is a developed country, the importing country is a developing country (DC→DIC), and the exporting country is a developing country and the importing country is a developed country (DIC→DC). According to Table 7, the observations of the four groups are 10,890, 11,220, 11,220 and 11,560, respectively, and several results for core variables are found.
First, the coefficient of in the four groups is significantly positive, and the coefficient of developing countries in the two groups (0.78, 0.69) is higher than that of developed countries in the two groups (0.55, 0.29), indicating that the export competition effect of forest certification in developing countries is higher than that of developed countries. This is consistent with Hypothesis 3—the export effect of forest certification in developing countries is higher than that in developed countries. The reason for this is the more incomplete information markets in developing countries, the more significant the trade effect of certification in developing countries.
Second, the coefficient of of developed countries in both groups is positive (0.04, 0.05), while the coefficient of of developing countries in both groups is positive (−0.14, −0.09). This indicates that forest certification has become a trade barrier for developing countries, especially in the process of trade with developed countries, and its trade barrier effect (−0.14) is higher than that of developing countries (−0.09).
Finally, the coefficients of of the four groups are all positive, and when developed and developing countries trade with each other (0.12), the effect of common language is higher for export promotion than for the other three groups.
4.3. Analysis by Product Groups
In the forest industry, the amount of forest certification and trade of different products vary greatly. To test Hypothesis 4, we chose wood products and furniture products for comparative analysis (in combination with the customs code, the products to be studied are wood forest products (HS44) and furniture products (HS940161, HS940169, HS940330, HS940340, HS940350 and HS940360). The PPML(MR) estimation was used to test the total 44,890 observations from 67 countries, and the total sample was further subdivided into four economies.
According to the regression results in Table 8, the trade effects of forest certification in wood products and furniture products are different.
- (1)
- The coefficient of of wood products (1.14) is higher than the coefficient of of furniture products (0.76). Therefore, the forest certification export competition effect of wood products is higher than that of furniture products, which does not conform to Hypothesis 4.
- (2)
- The coefficient of of wood products is positive (0.21) while that of furniture products is negative (−0.08). This shows that forest certification can promote the trade of wood products, while forest certification has a trade barrier effect on furniture products. Looking at the results by country groups, forest certification has a trade barrier effect on wood products in developing countries, while it has a trade barrier effect on furniture products in developed countries.
- (3)
- The coefficient of of wood products is negative (−0.04), while that of furniture products is positive (0.07). Specifically, the common language effect is higher (0.08, 0.17) in the trade of wood products between countries of different economies, while the effect of common language in the trade of wood products between countries of the same economy is negative (−0.18, −0.07). The common language effect on furniture products’ trade with developing countries was negative (−0.08, −0.06).
5. Discussion
Forest certification helps improve the green quality level of forest products [1], which consequently enhances the export competitive advantage of forest products. In this regard, forest certification has an export competitive effect. In the international forest certification systems, FM certification aims to improve the green quality level of forest, while CoC certification operates on the production, processing, transportation, and marketing of sustainable business certification [3]. Therefore, the export competitive advantage of wooden products based on FM certification is higher than that of furniture products based on CoC certification. Furthermore, the common language effect of forest certification conveys information about the sustainable management of forest products in import and export countries, which reduces the cost of searching products. However, forest certification has a trade barrier effect, which mainly comes from two aspects. First, enterprises and forest landowners pay the certification fees for third-party certification companies, as well as the indirect cost of improving their management, training, equipment, and technology to reach the requirements of forest certification [22]. Second, some governments have political motivation to protect their domestic market and manufacturers by formulating domestic trade and foreign policies, such as government procurement policies. These government policies are likely to be disguised as legal trade protection [21,34]; thus, breaching the notion of fair competition in the international market and hindering international trade.
It should be noted that forest certification performs differently in developed countries and developing countries [35,39], which thus influences trade. The common language effect of forest certification between different economies is higher than that between countries with similar economic levels. The green quality level of forest products in developing countries is improved more than that in developed countries once forest certification is obtained [5]. In this regard, the export effect of forest certification in developing countries brings more export competitiveness than that in developed countries. From the perspective of the trade barrier effect, the indirect costs of both FSC and PEFC standards are high especially for developing countries because there is a big gap between forest certification standards and their national forest conditions [19,20]. In addition, the response to forest certification of different governments varies greatly. Certification has been widely adopted in developed countries, while most developing countries are in the exploratory stage [35].
The limitations of our research are mainly due to the difficulty of acquiring data. The certificates of PEFC are not as available as FSC certificates. The uniformity of statistical caliber is another issue since PEFC and FSC are two different forest certification systems. In addition, due to the lack of certified forest area of some countries in some years, the panel data of forest certified area cannot be formed, which negatively affects further scientific research.
In future research, we attempt to quantify the export competition effect and trade barrier effect of forest certification for different forest products in each country. Based on this, the prediction of future international trade in forest products in terms of price, output and volume of imports and exports would be obtained by the general equilibrium model.
6. Conclusions
In this paper, we have constructed the consumer (importer) utility function and producer (exporter) cost model in the international market, and incorporated the different costs and information acquired from forest certification in different economies into the model; thus, deriving four hypotheses on the impact of forest certification on international trade. To test the hypotheses, we used the gravity model to examine the impact of forest certification on international trade in forest products in 67 economies from 2009 to 2018. We have compared various estimation methods and found that the extended PPML estimation handled the heteroscedasticity and zero trade value problems of the gravity model well in the forest industry. The results show that forest certification has an export competitive effect, which mainly comes from the improvement of products’ green quality level by forest certification. Forest certification has a trade barrier effect, which is the non-tariff barrier. Forest certification also has a common language effect. The trade effects of forest certification are asymmetric between developed countries and developing countries.
Based on our research, we can improve the following aspects. From the perspective of construction and development of a forest certification system, the unification of FSC and PEFC into ISO standards would reduce the costs of enterprises and forest landowners. We must emphasize that the government mechanism of forest certification is the main driving force for the development of forest certification. For the global environmental governance, governments should encourage the development of forest certification through policies such as taxes, subsidies, and government procurement. Countries with a low level of forest certification development should pay attention to improving their development of forest certification, otherwise they will be eliminated by the international market with the prosperity of global forest certification. Some governments have made efforts to expand the scope of forest certification. For example, the China Forest Certification Committee (CFCC) has expanded its certificated scope including Non-Wood Forest Production certification (NWFP), Forest Eco-environment Services certification (FESC), Bamboo Forest Management certification (BM), etc. However, FM certification and CoC certification still need to be developed, especially FM certification, which is more beneficial to forest sustainable management than other types of certification.
Author Contributions
Conceptualization, W.S. and J.C.; methodology, L.W. and J.C.; validation Y.S., W.S. and W.L.; formal analysis, J.C.; writing—original draft preparation, J.C.; writing—review and editing, J.M., L.X. and W.-Y.C.; visualization, L.L.; supervision, W.S. All authors have read and agreed to the published version of the manuscript.
Funding
This research received no external funding.
Acknowledgments
We would like to thank the China Scholarship Council (CSC) for the financial support (CSC no. 201906510023). This work was also supported by Zhejiang A&F University Scientific Research Development Fund Talent Start Program (no. 2034020108). We would also like to thank Juliana Magalhães for the useful comments on this paper.
Conflicts of Interest
The authors declare no conflict of interest. The funders had no role in the design of the study; in the collection, analyses, or interpretation of data; in the writing of the manuscript, or in the decision to publish the results.
References
- Overdevest, C.; Rickenbach, M.G. Forest certification and institutional governance: An empirical study of forest stewardship council certificate holders in the United States. For. Policy Econ. 2006, 9, 93–102. [Google Scholar] [CrossRef]
- Savilaakso, S.; Cerutti, P.O.; Montoya Zumaeta, J.G.; Ruslandi; Mendoula, E.E.; Tsanga, R. Timber certification as a catalyst for change in forest governance in Cameroon, Indonesia, and Peru. Int. J. Biodivers. Sci. Ecosyst. Serv. Manag. 2016, 13, 116–133. [Google Scholar] [CrossRef] [Green Version]
- Nussbaum, R.; Simula, M. The Forest Certification Handbook; Routledge: Abington, UK, 2013. [Google Scholar]
- Franklin, J.F.; Johnson, K.N.; Johnson, D.L. Ecological Forest Management; Waveland Press, Inc.: Long Grove, IL, USA, 2018. [Google Scholar]
- Rametsteiner, E.; Simula, M. Forest certification—An instrument to promote sustainable forest management? J. Environ. Manag. 2003, 67, 87–98. [Google Scholar] [CrossRef]
- Lapeyre, R.; Froger, G.; Hrabanski, M. Biodiversity offsets as market-based instruments for ecosystem services? From discourses to practices. Ecosyst. Serv. 2015, 15, 125–133. [Google Scholar] [CrossRef]
- Cashore, B.W.; Auld, G.; Newsom, D. Governing through Markets: Forest Certification and the Emergence of Non-State Authority; Yale University Press: New Haven, CT, USA, 2004. [Google Scholar]
- Barrios Villarreal, A. International Standards and the Agreement on Technical Barriers to Trade; Cambridge University Press: Cambridge, UK, 2018. [Google Scholar]
- Kaplinsky, R.; Open Knowledge, R.; World Bank, E.-L. Role of Standards in Global Value Chains; The World Bank: Washington, DC, USA, 2010. [Google Scholar]
- Beghin, J.; Disdier, A.-C.; Marette, S.; Van Tongeren, F. Welfare costs and benefits of non-tariff measures in trade: A conceptual framework and application. World Trade Rev. 2012, 11, 356–375. [Google Scholar] [CrossRef] [Green Version]
- Marette, S.; Beghin, J. Are Standards Always Protectionist? Rev. Int. Econ. 2010, 18, 179–192. [Google Scholar] [CrossRef] [Green Version]
- Sugiura, K.; Yoshinao, O. Reasons for Choosing Forest Stewardship Council (FSC) and Sustainable Green Ecosystem Council (SGEC) Schemes and the Effects of Certification Acquisition by Forestry Enterprises in Japan. Forests 2018, 9, 173. [Google Scholar] [CrossRef] [Green Version]
- Tian, N.; Lu, F.; Joshi, O.; Poudyal, N.C. Segmenting landowners of shandong, china based on their attitudes towards forest certification. Forests 2018, 9, 361. [Google Scholar] [CrossRef] [Green Version]
- Galati, A.; Gianguzzi, G.; Tinervia, S.; Crescimanno, M.; La Mela Veca, D.S. Motivations, adoption and impact of voluntary environmental certification in the Italian Forest based industry: The case of the FSC standard. For. Policy Econ. 2017, 83, 169–176. [Google Scholar] [CrossRef]
- Carlsen, K.; Hansen, C.P.; Lund, J.F. Factors affecting certification uptake—Perspectives from the timber industry in Ghana. For. Policy Econ. 2012, 25, 83–92. [Google Scholar] [CrossRef]
- Maraseni, T.N.; Son, H.L.; Cockfield, G.; Duy, H.V.; Nghia, T.D. The financial benefits of forest certification: Case studies of acacia growers and a furniture company in Central Vietnam. Land Use Policy 2017, 69, 56–63. [Google Scholar] [CrossRef]
- Paluš, H.; Parobek, J.; Šulek, R.; Lichý, J.; Šálka, J. Understanding Sustainable Forest Management Certification in Slovakia: Forest Owners’ Perception of Expectations, Benefits and Problems. Sustainability 2018, 10, 2470. [Google Scholar] [CrossRef] [Green Version]
- Paluš, H.; Parobek, J.; Vlosky, R.P.; Motik, D.; Oblak, L.; Jošt, M.; Glavonjić, B.; Dudík, R.; Wanat, L. The status of chain-of-custody certification in the countries of Central and South Europe. Eur. J. Wood Wood Prod. 2017, 76, 699–710. [Google Scholar] [CrossRef]
- Giannichi, M.L.; Dallimer, M.; Baker, T.R.; Mitchell, G.; Bernasconi, P.; Ziv, G. Divergent Landowners’ Expectations May Hinder the Uptake of a Forest Certificate Trading Scheme. Conserv. Lett. 2018, 11, e12409. [Google Scholar] [CrossRef] [Green Version]
- Xu, Y.; Qiu, J.; Wang, B. An empirical analysis on the impact of forest certification on China’s forest product export. Sci. Technol. Ind. 2018, 18, 31–36. (In Chinese) [Google Scholar]
- Guan, Z.; Shen, J.; Jia, W. Substituting Effects Analysis of Forest Certification against Tariff Barriers. J. Beijing For. Univ. (Soc. Sci.) 2010, 9, 110–113. (In Chinese) [Google Scholar]
- Mi, F.; Wu, W.; Yang, J. The impact of forest certification on the import and export trade of forest products in China. Prot. For. Sci. Technol. 2008, 6, 59–62. (In Chinese) [Google Scholar]
- Tricallotis, M.; Gunningham, N.; Kanowski, P. The impacts of forest certification for Chilean forestry businesses. For. Policy Econ. 2018, 92, 82–91. [Google Scholar] [CrossRef]
- Brenton, S. (Political) Consumers and Certification Schemes: The Ethics of Global Production and Trade. J. Agric. Environ. Ethics 2018, 31, 755–784. [Google Scholar] [CrossRef]
- Rametsteiner, E. The role of governments in forest certification—A normative analysis based on new institutional economics theories. For. Policy Econ. 2002, 4, 163–173. [Google Scholar] [CrossRef]
- Guan, Z.; Ip Ping Sheong, J.K.F. The Restricting Effects of Forest Certification on the International Trade of Wood Products. J. Sustain. For. 2019, 38, 809–826. [Google Scholar] [CrossRef]
- Blind, K.; Mangelsdorf, A.; Pohlisch, J. The effects of cooperation in accreditation on international trade: Empirical evidence on ISO 9000 certifications. Int. J. Prod. Econ. 2018, 198, 50–59. [Google Scholar] [CrossRef]
- Clougherty, J.A.; Grajek, M. International standards and international trade: Empirical evidence from ISO 9000 diffusion. Int. J. Ind. Organ. 2014, 36, 70–82. [Google Scholar] [CrossRef] [Green Version]
- The Forest Stewardship Council (FSC). Available online: https://info.fsc.org/certificate.php (accessed on 11 November 2019).
- The Program for the Endorsement of Forest Certification Schemes (PEFC). Available online: https://www.pefc.org (accessed on 11 November 2019).
- The United Nations (UN) Comtrade Database. Available online: https://comtrade.un.org/data/ (accessed on 11 November 2019).
- Paluš, H.; Parobek, J.; Dudík, R.; Šupín, M. Assessment of Chain-of-Custody Certification in the Czech and Slovak Republic. Sustainability 2017, 9, 1898. [Google Scholar] [CrossRef] [Green Version]
- Halalisan, A.; Abrudan, I.; Popa, B. Forest Management Certification in Romania: Motivations and Perceptions. Forests 2018, 9, 425. [Google Scholar] [CrossRef] [Green Version]
- Rickenbach, M.; Overdevest, C. More than Markets: Assessing Forest Stewardship Council (FSC) Certification as a Policy Tool. J. For. 2006, 104, 143. [Google Scholar]
- Durst, P.B.; McKenzie, P.J.; Brown, C.L.; Appanah, S. Challenges facing certification and eco-labelling of forest products in developing countries. Int. For. Rev. 2006, 8, 193–200. [Google Scholar] [CrossRef]
- Garella, P.G.; Petrakis, E. Minimum quality standards and consumers’ information. Econ. Theory 2008, 36, 283–302. [Google Scholar] [CrossRef] [Green Version]
- Page, G.; Bellotti, B. Farmers value on-farm ecosystem services as important, but what are the impediments to participation in PES schemes? Sci. Total Environ. 2015, 515–516, 12–19. [Google Scholar] [CrossRef]
- Marette, S.; Yokessa, M. A Review of Eco-labels and their Economic Impact. Int. Rev. Environ. Resour. Econ. 2019, 13, 119–163. [Google Scholar] [CrossRef]
- Auriol, E.; Schilizzi, S.G.M. Quality signaling through certification in developing countries. J. Dev. Econ. 2015, 116, 105–121. [Google Scholar] [CrossRef] [Green Version]
- Krugman, P. Scale Economies, Product Differentiation, and the Pattern of Trade. Am. Econ. Assoc. 1980, 70, 950–959. [Google Scholar]
- Buongiorno, J. Gravity models of forest products trade: Applications to forecasting and policy analysis. Forestry 2016, 89, 117–126. [Google Scholar] [CrossRef]
- Silva, J.M.C.S.; Tenreyro, S. The Log of Gravity. Rev. Econ. Stat. 2006, 88, 641–658. [Google Scholar] [CrossRef] [Green Version]
- World Bank’s WDI. Available online: https://databank.worldbank.org/home.aspx (accessed on 10 November 2018).
- Research and Expertise on the World Economy. CEPII Database. Available online: http://www.cepii.fr/CEPII/en/bdd_modele/bdd.asp (accessed on 23 August 2015).
- Baier, S.L.; Bergstrand, J.H. Bonus vetus OLS: A simple method for approximating international trade-cost effects using the gravity equation. J. Int. Econ. 2009, 77, 77–85. [Google Scholar] [CrossRef]
- Larson, J.; Baker, J.; Latta, G.; Ohrel, S.; Wade, C. Modeling International Trade of Forest Products: Application of PPML to a Gravity Model of Trade. For. Prod. Soc. 2018, 68, 303–316. [Google Scholar]
Figure 1.
The number and proportion of forest management (FM) and chain of custody (CoC) certifications of FSC and PEFC from 1999 to 2018. Date source: see note 1.
Figure 1.
The number and proportion of forest management (FM) and chain of custody (CoC) certifications of FSC and PEFC from 1999 to 2018. Date source: see note 1.

Figure 2.
Trade value of forest products from 2009 to 2018. Date source: UN Comtrade.

Figure 3.
Export market of furniture products and wood forest products in 2018. Date source: UN Comtrade.
Figure 3.
Export market of furniture products and wood forest products in 2018. Date source: UN Comtrade.


Table 1.
Quantity of the Forest Stewardship Council (FSC) and Program for the Endorsement of Forest Certification Schemes (PEFC) certifications.
Table 1.
Quantity of the Forest Stewardship Council (FSC) and Program for the Endorsement of Forest Certification Schemes (PEFC) certifications.
| FSC | PEFC | |||||||
|---|---|---|---|---|---|---|---|---|
| Type | CoC | FM | Others | Total | CoC | FM | Others | Total |
| Quantity | 226,602 | 10,023 | 52 | 236,677 | 24,675 | 9396 | 99 | 34,170 |
Date source: see note 1.
Table 2.
Number of different categories of FSC-certified forest products.
| Non-Timber Forest Products (NTFP) | Pulp and Paper Products | ||
| Commodity | Quantity | Commodity | Quantity |
| N1 Barks | 206 | P1 Pulp | 2648 |
| N2 Soil conditioner and substrates | 17 | P2 Paper | 6133 |
| N3 Cork and articles of cork | 156 | P3 Paperboard | 3179 |
| N4 Straw, wicker, rattan | 56 | P4 Corrugated paper and paperboard | 1769 |
| N5 Bamboo and articles of bamboo | 497 | P5 Packaging and wrappings of paper | 8057 |
| N6 Plants and parts of plants | 49 | P6 Household and sanitary products | 2032 |
| N7 Natural gums, oils and derivatives | 197 | P7 Stationery of paper | 11,826 |
| N8 Chemical, medicinal and cosmetic | 20 | P8 Printed materials | 14,762 |
| N9 Food, | 68 | P9 Bobbins, spools, rolls and similar | 152 |
| N10 Other NTFP | 101 | P10 Other pulp and paper products | 1504 |
| Total | 1367 | Total | 52,062 |
| Wood Products | |||
| Primary Products | Furniture Products | ||
| Commodity | Quantity | Commodity | Quantity |
| W1 Rough wood | 8272 | W10 Wood package and similar | 24,149 |
| W2 Wood charcoal | 354 | W11 Wood for construction | 8389 |
| W3 Wood in chips or particles | 5619 | W12 Indoor furniture | 11,283 |
| W4 Impregnated/treated wood, | 863 | W13 Outdoor furniture and gardening | 4687 |
| W5 Solid wood (sawn, chipped, peeled) | 11,709 | W14 Musical instruments | 83 |
| W6 Products from planning mill | 3435 | W15 Entertainment equipment | 674 |
| W7 Veneer | 1990 | W16 Household supplies | 2087 |
| W8 Wood panels | 5559 | W17 Stationery | 397 |
| W9 Engineered wood products | 3725 | W18 Other wood products | 1651 |
| W19 Others | 723 | ||
| Total | 41,526 | Total | 54,123 |
Date source: see note 1.
Table 3.
Ranking of countries with more than 100 FSC certifications.
| Rank | Country | Number | Rank | Country | Number | Rank | Country | Number |
|---|---|---|---|---|---|---|---|---|
| 1 | China | 10,505 | 27 | Denmark | 1662 | 53 | Yemen | 543 |
| 2 | USA | 7065 | 28 | Lithuania | 1604 | 54 | Guatemala | 481 |
| 3 | Italy | 6716 | 29 | Hungary | 1540 | 55 | Colombia | 476 |
| 4 | Brazil | 5712 | 30 | Czech Republic | 1534 | 56 | Thailand | 471 |
| 5 | Poland | 5451 | 31 | Malaysia | 1523 | 57 | Saudi Arabia | 452 |
| 6 | Germany | 5285 | 32 | Latvia | 1465 | 58 | Afghanistan | 406 |
| 7 | Romania | 4631 | 33 | Portugal | 1399 | 59 | Ukraine | 392 |
| 8 | India | 3983 | 34 | Japan | 1319 | 60 | Norway | 384 |
| 9 | Indonesia | 3857 | 35 | Albania | 1258 | 61 | Luxembourg | 302 |
| 10 | Russia | 3618 | 36 | Qatar | 1228 | 62 | South Africa | 294 |
| 11 | Netherland | 3389 | 37 | Argentina | 1220 | 63 | Nicaragua | 291 |
| 12 | Croatia | 3179 | 38 | Spain | 1181 | 64 | Costa Rica | 274 |
| 13 | Belarus | 2674 | 39 | Greek | 1134 | 65 | Pakistan | 255 |
| 14 | Singapore | 2548 | 40 | Slovakia | 1131 | 66 | Papua New Guinea | 239 |
| 15 | Canada | 2527 | 41 | United Kingdom | 1107 | 67 | Philippines | 233 |
| 16 | Austria | 2477 | 42 | Irish | 1046 | 68 | Sri Lanka | 219 |
| 17 | Bulgaria | 2248 | 43 | Finland | 1027 | 69 | Cyprus | 191 |
| 18 | Serbia | 2201 | 44 | New Zealand | 1000 | 70 | Panama | 162 |
| 19 | Slovenia | 2170 | 45 | Egypt | 871 | 71 | Ecuador | 161 |
| 20 | French | 2093 | 46 | Bangladesh | 849 | 72 | Cameroon | 161 |
| 21 | Turkey | 2068 | 47 | Peru | 843 | 73 | Honduras | 158 |
| 22 | Belgium | 2055 | 48 | Switzerland | 830 | 74 | Mozambique | 126 |
| 23 | Australia | 1894 | 49 | Chile | 788 | 75 | Greenland | 117 |
| 24 | Estonia | 1865 | 50 | United Arab Emirates | 640 | 76 | Morocco | 109 |
| 25 | Korea | 1755 | 51 | Lebanon | 578 | 77 | Ghana | 109 |
| 26 | Mexico | 1678 | 52 | Swedish | 570 | 78 | Uruguay | 102 |
Date source: see note 1.
Table 4.
Definition of variables and data sources.
| Variable | Variable Definitions | Expected Effects | Data Sources |
|---|---|---|---|
| Export value of exporting country to importing country in year | UN Comtrade database [31] | ||
| Quantity of forest certification in exporting country in year | +/− | FSC website [29] and PEFC website [30] | |
| Quantity of forest certification in importing country in year | +/− | Same as above | |
| GDP of exporting country in year | + | World Bank’s WDI [43] | |
| GDP of importing country in year | + | Same as above | |
| Population in exporting country in year | + | Same as above | |
| Population in importing country in year | + | Same as above | |
| Infrastructure index in exporting country in year | + | Same as above | |
| Infrastructure index in importing country in year | + | Same as above | |
| Geographical distance between two countries | − | CEPII database [44] | |
| Dummy variables, 1 if the two countries have the same border, 0 otherwise | + | Same as above | |
| Dummy variables, 1 if the two countries have the same official language, 0 otherwise. | + | Same as above | |
| Dummy variables, 1 if the two countries have a colonial relationship, 0 otherwise. | + | Same as above | |
| Dummy variables, 1 if the two countries have free trade agreement, 0 otherwise. | + | Same as above |
Table 5.
Variable statistics.
| Variable | Obs | Mean | Std. Dev. | Min | Max |
|---|---|---|---|---|---|
| (million) | 44,890 | 1.12 | 127.00 | 0.00 | 10,100.00 |
| 44,890 | 132.85 | 227.34 | 0.00 | 3011.00 | |
| (billion) | 44,890 | 103.00 | 249.00 | 1.14 | 2050.00 |
| 44,890 | 80.02 | 225.64 | 0.50 | 1392.73 | |
| 44,890 | 4.60 | 1.18 | 0.00 | 6.80 | |
| 44,890 | 7028.28 | 4862.28 | 20.25 | 19,563.95 | |
| 44,890 | 0.04 | 0.19 | 0.00 | 1.00 | |
| 44,890 | 0.07 | 0.26 | 0.00 | 1.00 | |
| 44,890 | 0.01 | 0.12 | 0.00 | 1.00 | |
| 44,890 | 2.53 | 1.95 | 1.00 | 7.00 |
Table 6.
The regression results of the total sample.
| OLS | FE | RE | PPML | OLS (MR) | FE (MR) | RE (MR) | PPML (MR) | |
|---|---|---|---|---|---|---|---|---|
| Core Variables | ||||||||
| 0.98 *** | 0.09 *** | 0.20 *** | 0.95 *** | 0.93 *** | 0.08 *** | 0.18 *** | 0.88 *** | |
| 0.03 | 0.02 | 0.02 | 0.00 | 0.03 | 0.02 | 0.02 | 0.00 | |
| 0.05 * | 0.02 | 0.04 * | −0.06 | −0.00 | 0.01 | 0.02 | −0.14 *** | |
| 0.03 | 0.02 | 0.02 | 0.00 | 0.03 | 0.02 | 0.02 | 0.00 | |
| −0.10 *** | −0.00 | −0.03 ** | 0.00 | −0.06 ** | 0.00 | −0.02 | 0.06 * | |
| 0.02 | 0.01 | 0.01 | 0.00 | 0.02 | 0.01 | 0.01 | 0.00 | |
| Economic Variables | ||||||||
| 1.18 *** | −0.53 *** | 0.91 *** | 1.16 *** | 0.90 *** | −0.66 *** | 0.52 *** | 0.76 *** | |
| 0.03 | 0.08 | 0.06 | 0.00 | 0.03 | 0.08 | 0.07 | 0.00 | |
| 0.66 *** | 1.32 *** | 0.78 *** | 0.61 *** | 0.31 *** | 1.20 *** | 0.37 *** | 0.12 *** | |
| 0.03 | 0.08 | 0.06 | 0.00 | 0.03 | 0.08 | 0.07 | 0.00 | |
| 0.16 *** | −1.56 *** | 0.40 *** | 0.16 *** | 0.15 *** | −1.57 *** | 0.32 *** | 0.16 *** | |
| 0.02 | 0.19 | 0.06 | 0.00 | 0.02 | 0.20 | 0.06 | 0.00 | |
| 0.59 *** | 0.32 | 0.42 *** | 0.64 *** | 0.63 *** | 0.31 | 0.35 *** | 0.72 *** | |
| 0.02 | 0.19 | 0.06 | 0.00 | 0.02 | 0.20 | 0.06 | 0.00 | |
| 0.42 *** | −0.02 | 0.11 *** | 0.50 *** | 0.42 *** | −0.01 | 0.11 *** | 0.51 *** | |
| 0.02 | 0.03 | 0.03 | 0.00 | 0.02 | 0.03 | 0.03 | 0.00 | |
| 0.46 *** | 0.01 | 0.09 ** | 0.53 *** | 0.46 *** | 0.01 | 0.09 ** | 0.54 *** | |
| 0.02 | 0.03 | 0.03 | 0.00 | 0.02 | 0.03 | 0.03 | 0.00 | |
| Variable Resistance | ||||||||
| −0.51 *** | 0.00 | −0.81 *** | −0.47 *** | −0.59 *** | 0.00 | −0.87 *** | −0.60 *** | |
| 0.02 | (.) | 0.14 | 0.00 | 0.03 | (.) | 0.14 | 0.00 | |
| 2.07 *** | 0.00 | 2.17 *** | 1.05 *** | 2.10 *** | 0.00 | 2.13 *** | 1.09 *** | |
| 0.11 | (.) | 0.29 | 0.01 | 0.11 | (.) | 0.30 | 0.01 | |
| 2.11 *** | 0.00 | 1.65 *** | 2.01 *** | 2.18 *** | 0.00 | 1.74 *** | 2.11 *** | |
| 0.08 | (.) | 0.16 | 0.01 | 0.08 | (.) | 0.17 | 0.01 | |
| 0.60 *** | 0.00 | 1.17 *** | 0.55 *** | 0.55 *** | 0.00 | 0.88 *** | 0.46 *** | |
| 0.13 | (.) | 0.24 | 0.01 | 0.13 | (.) | 0.26 | 0.01 | |
| 0.76 *** | 0.15 ** | 0.62 *** | 0.73 *** | 0.69 *** | 0.19 *** | 0.62 *** | 0.62 *** | |
| 0.01 | 0.05 | 0.05 | 0.00 | 0.01 | 0.05 | 0.05 | 0.00 | |
| cons | −43.21 *** | −5.13 * | −30.72 *** | −1.83 *** | −26.05 *** | −1.53 | −9.43 *** | 0.08 *** |
| 0.81 | 2.11 | 2.16 | 0.08 | −1.42 | −2.57 | −2.85 | 0.11 | |
| Multilateral Resistance | No | No | No | No | Yes | Yes | Yes | Yes |
* p < 0.05, ** p < 0.01, *** p < 0.001.
Table 7.
Poisson pseudo maximum likelihood (PPML) multilateral-resistance (MR) regression results of country groups.
Table 7.
Poisson pseudo maximum likelihood (PPML) multilateral-resistance (MR) regression results of country groups.
| DC—DC | DC—DIC | DIC—DC | DIC—DIC | |
|---|---|---|---|---|
| 0.55 *** | 0.29 *** | 0.78 *** | 0.69 *** | |
| 0.01 | 0.00 | 0.01 | 0.01 | |
| 0.04 | −0.14 ** | 0.05 | −0.09 | |
| 0.01 | 0.00 | 0.01 | 0.01 | |
| 0.09 | 0.12 *** | 0.05 | 0.06 | |
| 0.00 | 0.00 | 0.00 | 0.00 | |
| N | 10,890 | 11,220 | 11,220 | 11,560 |
** p < 0.01, *** p < 0.001.
Table 8.
PPML (MR) regression results of product groups.
| The Total Sample | DC—DC | DC—DIC | DIC—DC | DIC—DIC | |
|---|---|---|---|---|---|
| Wooden Products | |||||
| 1.14 *** | 0.86 *** | 0.54 *** | 0.83 *** | 0.92 *** | |
| 0.00 | 0.01 | 0.01 | 0.01 | 0.01 | |
| 0.21 ** | 0.65 *** | −0.28 * | 0.07 | 0.00 | |
| 0.01 | 0.01 | 0.01 | 0.01 | 0.01 | |
| −0.04 | −0.18 ** | 0.08 | 0.17 *** | −0.07 | |
| 0.00 | 0.01 | 0.01 | 0.01 | 0.00 | |
| Furniture Products | |||||
| 0.76 *** | 0.28 ** | 0.67 *** | 0.41 *** | 0.43 *** | |
| 0.00 | 0.01 | 0.01 | 0.01 | 0.01 | |
| −0.08 * | −0.47 *** | 0.35 *** | −0.17 ** | 0.09 | |
| 0.00 | 0.01 | 0.01 | 0.01 | 0.01 | |
| 0.07 ** | 0.28 *** | −0.08 * | 0.20 *** | −0.06 * | |
| 0.00 | 0.01 | 0.00 | 0.01 | 0.00 | |
| N | 44,890 | 10,890 | 11,220 | 11,220 | 11,560 |
* p < 0.05, ** p < 0.01, *** p < 0.001.
Publisher’s Note: MDPI stays neutral with regard to jurisdictional claims in published maps and institutional affiliations. |
© 2020 by the authors. Licensee MDPI, Basel, Switzerland. This article is an open access article distributed under the terms and conditions of the Creative Commons Attribution (CC BY) license (http://creativecommons.org/licenses/by/4.0/).
Share and Cite
MDPI and ACS Style
Chen, J.; Wang, L.; Li, L.; Magalhães, J.; Song, W.; Lu, W.; Xiong, L.; Chang, W.-Y.; Sun, Y. Effect of Forest Certification on International Trade in Forest Products. Forests 2020, 11, 1270. https://doi.org/10.3390/f11121270
AMA Style
Chen J, Wang L, Li L, Magalhães J, Song W, Lu W, Xiong L, Chang W-Y, Sun Y. Effect of Forest Certification on International Trade in Forest Products. Forests. 2020; 11(12):1270. https://doi.org/10.3390/f11121270
Chicago/Turabian StyleChen, Jiaojiao, Lanhui Wang, Lingchao Li, Juliana Magalhães, Weiming Song, Wenming Lu, Lichun Xiong, Wei-Yew Chang, and Yujun Sun. 2020. "Effect of Forest Certification on International Trade in Forest Products" Forests 11, no. 12: 1270. https://doi.org/10.3390/f11121270
Note that from the first issue of 2016, this journal uses article numbers instead of page numbers. See further details here.