Article

Linking Soil Acidity to P Fractions and Exchangeable Base Cations under Increased N and P Fertilization of Mono and Mixed Plantations in Northeast China

1
Key Laboratory for Sustainable Forest Ecosystem Management-Ministry of Education, School of Forestry, Northeast Forestry University, Harbin 150040, Heilongjiang, China
2
Pakistan Forest Institute (PFI), Khyber Pakhtunkhwa, Peshawar 25000, Pakistan
*
Author to whom correspondence should be addressed.
Forests 2020, 11(12), 1274; https://doi.org/10.3390/f11121274
Submission received: 9 November 2020 / Revised: 26 November 2020 / Accepted: 26 November 2020 / Published: 28 November 2020
(This article belongs to the Special Issue Forest Ecosystem Biogeochemical Cycling and Climate Change)

Abstract

:
Atmospheric N deposition is increasing worldwide, especially in China, significantly affecting soil health, i.e., increasing soil acidification. The northern region of China is considered to be one of the N deposition points in Asia, ranging from 28.5 to 100.4 N ha−1yr−1. Phosphorus (P) is the limiting factor in the temperate ecosystem and an important factor that makes the ecosystem more susceptible to N-derived acidification. However, it remained poorly understood how the soil acidification process affects soil P availability and base cations in the temperate region to increased N deposition. To address this question, in May 2019, a factorial experiment was conducted under N and P additions with different plantations in Maoershan Experimental Forest Farm, Northeast China, considering species and fertilization as variables. The effective acidity (EA) increased by N and NP fertilizations but was not significantly affected by P fertilization. Similarly, the pH, base saturation percentage (BS%), calcium (Ca2+), and magnesium (Mg2+) were decreased under N addition, while the Al:Ca ratio increased, whereas NaHCO3 inorganic phosphorus (Pi) and NaOH organic phosphorus (Po) significantly decreased under N enrichments. However, NaOH Pi increased in N-enriched plots, while H2O Pi and NaHCO3 Pi increased under the P addition. Thus, the results suggest that the availability of N triggers the P dynamics by increasing the P uptake by trees. The decrease in base cations, Ca2+, and Mg2+ and increase in exchangeable Fe3+ and Al3+ ions are mainly responsible for soil acidification and lead to the depletion of soil nutrients, which, ultimately, affects the vitality and health of forests, while the P addition showed a buffering effect but could not help to mitigate the soil acidity.

1. Introduction

The industrial revolution has caused an increase in atmospheric nitrogen (N) deposition around the globe [1]. According to the statistics, the deposition rate will be double by 2050 to that of 1995, i.e., 100 Tg N yr−1—200 Tg N yr−1 [2]. Similarly, the mean wet N deposition rate in China has increased to 25% from 1990 to 2000 [3], and a dramatic increase is expected in the coming future [4]. Pan et al. [5] also documented that the northern part of China is considered one of the N deposition points in Asia, ranging from 28.5 to 100.4 N ha−1yr−1. According to the China Statsitcal Year Book, the fossil combustion cause a major contribution in NOx in the atmosphere and increased approximately six times in the last 38 years (1980–2018) [6]. The ecosystem’s functions are greatly influenced by the N deposition [5,6], and the biodiversity is threatened [2,7]. The N deposition has resulted in soil acidification [8], with significant implications for the availability of soil nutrients [9].
Generally, N is considered a limiting nutrient for plant growth in terrestrial ecosystems [10], especially in temperate ecosystems, where the soil is relatively younger [11]. The enrichment of N through deposition increases growth and limits other important nutrients, like base cations and phosphorus (P) [12,13]. However, much attention was given to carbon (C) cycling with increased N deposition [14,15,16]. Still, less attention was given to P dynamics, base cations, Al:Ca ratio, and soil acidification under increased N deposition, as they are good ecochemical indicators for soil health and to assess the damage from soil acidification [12,17]. Therefore, it is essential to understand the effect of N addition on P fractions, soil acidification, and base cations in temperate forest ecosystems.
The N dynamics are affected by phosphorus (P) availability, as the P cycle is strongly coupled with the N cycle [18]. However, it is believed that the availability of P is considered to be a second limiting factor in forest ecosystems to that of available N [19]. Therefore, the effect of P availability has received limited attention as compared with the widespread concern over the effect of N availability upon N dynamics [20]. Phosphorus is an important but limiting nutrient factor in many ecosystems [21]. Many essential ecosystem functions rely on P cycling [22]. Besides, P limitation could make forest ecosystems more vulnerable to N-based acidification. However, induced P could make a bond with exchangeable Al and Fe oxides [23,24] while decreasing the leaching out of excess N and increasing the nitrate uptake by promoting the release of hydroxyl ions [24]. A variety of P forms exists in soil that significantly varies in their availability to microbes and plants [25,26]. The most bioavailable P is labile P in soil and is usually found in low concentrations but from a dynamic view [27]. This form of P may be continuously replaced by another stable form of P because of complex biological and chemical mechanisms [27]. Through weathering processes, soil mineral P may be released in the labile form [28], i.e., organic phosphorus (Po), by phosphatase catalysis, which can be mineralized as inorganic phosphorus (Pi) [29]. There is a significant difference in the flux rates of different soil P forms [30]; therefore, P in different forms could contribute differently to soil P bioavailability. Likewise, secondary mineral P (i.e., NaOH Pi) turned over in weeks to months is an essential possible source for P availability [31]. However, recalcitrant P might need a million years to turn over and, therefore, is considered unavailable to plants [32,33]. Similarly, the importance of soil P cycling and microbial biomass P has also been indicated by recent studies [25,34]. The immediate consumption of Po by microbes and rapid conversion to Pi plays a vital role in the releasing and restructuring of available P [27], especially in the accumulation of Po [35]. Hence, P form compositions control the P bioavailability, and therefore, it is essential to understand the P fractions and how atmospheric pollution affects the soil P availability.
In soil development, the tree species composition may affect the soil’s chemical properties, such as soil acidity and exchangeable cations [36,37]. Plant communities are closely linked with land ecosystems’ mechanisms, i.e., above- and belowground [38]. The changes in the global environment may significantly alter the diversity and composition of plants [39,40]. These variations can indirectly influence the belowground community’s functions, ultimately affecting plant growth [41,42]. The phosphorus, nitrogen, and carbon cycles are closely related to forest soil and responsible for different nutrients, which control vegetation health [43]. In establishing manmade plantations, China is the leading country, covering about 79 million hectares [44]. Northeast China also contributes a lot in the reforestation either by mono- or mixed cultures [45]. Larix gmelinii Rupr. (Dahurian larch) is a tree species well-spread all over the northern part of Asia. It is one of the notable fast-growing tree species used for plantations in pure and mixed forms [46]. Manchurian walnut (Juglans mandshurica) and Manchurian ash (Fraxinus mandshurica) are precious broadleaved species with great commercial values also planted as mono- and mixed cultures [47,48]. This study examines the effects of additional N and P fertilization on base cations and P fractions soil acidification in the temperate ecosystem. In particular, we aim to elucidate if fertilization significantly affects (1) the ecochemical indexes, i.e., soil pH, basic cation saturation (BS), Al:Ca ratio, and EA, and induces (2) soil P availability, i.e., P fractions (organic (Po) and inorganic (Po) phosphorus). In addition, we wanted to find the following questions depending upon the contrasting forest types at two levels: (i) considering the forest type separately (i.e., mono- and mixed plantations) (ii) and combined, representing an overview of three important tree species of temperate forests in Northeast China.

2. Materials and Methods

The experiment was carried out at Maoershan Research Station (45°16′ N, 128°34′ E), Northeast Forestry University, Heilongjiang China (Figure 1). The weather is astringent cold with snow in the winter. Spring receives monsoon, and the summer remains hot and humid. The average temperature in Jan–July is −19.6 to 20.9 °C. The frost-free period is 120–140 days long. The average relative air humidity is 70%, precipitation is 724 mm a−1, and evapotranspiration is 1094 mm a−1, respectively [49]. The soil is classified as Hap-Boric Luvisol in nature: high organic matter, up to 50-cm-deep, 1–10-cm loamy soil, and 10–20-cm sandy loam [13].
The study selected different plantations of Larix gmelinii (Rupr.) Rupr. (Dahurian larch; Larch), Juglans mandshurica Maxim. (Manchurian walnut; Walnut), and Fraxinus mandshurica Rupr. (Manchurian ash; Ash) in the monoculture and Ash× Lar and and Wal × Lar in the mixed culture (with 5 rows of larch with 3 rows of broadleaved species, alternately). The J. mandshurica and F. mandshurica are classified as angiosperms, having arbuscular mycorrhizal colonization, while the L. gmelinii was classified as a gymnosperm and having ectomycorrhizal colonization [50]. These plantations were planted with two-year-old seedlings at a spacing of 1.5 m × 2.0 m in 1987. Thus, a factorial experiment was conducted with five species and four treatments in a randomized fashion. The experiment was replicated three times, and each replication was considered as a big plot, i.e., 20 m × 20 m. Each big plot (replicate) was further subdivided into 3 subplots, and to each subplot, 20 sub-subpots were randomly allotted. Therefore, the experiment consisted of 180 experimental subunits. The application of nitrogen (N) as urea (CO(NH2)2) and phosphorus (P) as diammonium phosphate ((NH4)2 HPO4) fertilizers were carried out at 4 levels in pellet form per species. The subplots per species were designated as Control (C; no addition), nitrogen (N; 20-g N m−2), phosphorus (P; 10-g P m−2), and combination (NP; 20-g N m−2 and 10-g P m−2) [13,51,52]. The N was applied in three split doses (i.e., 30%, 40%, and 30%; May–Aug), preventing leaching, while P was applied at once [53]. Three sampling points in the sub-subplots were randomly selected to collect soil samples at 0–20-cm soil depth and made a composite sample. See Table 1 and Table 2 for the preharvest data of stand characteristics and soil chemical properties.

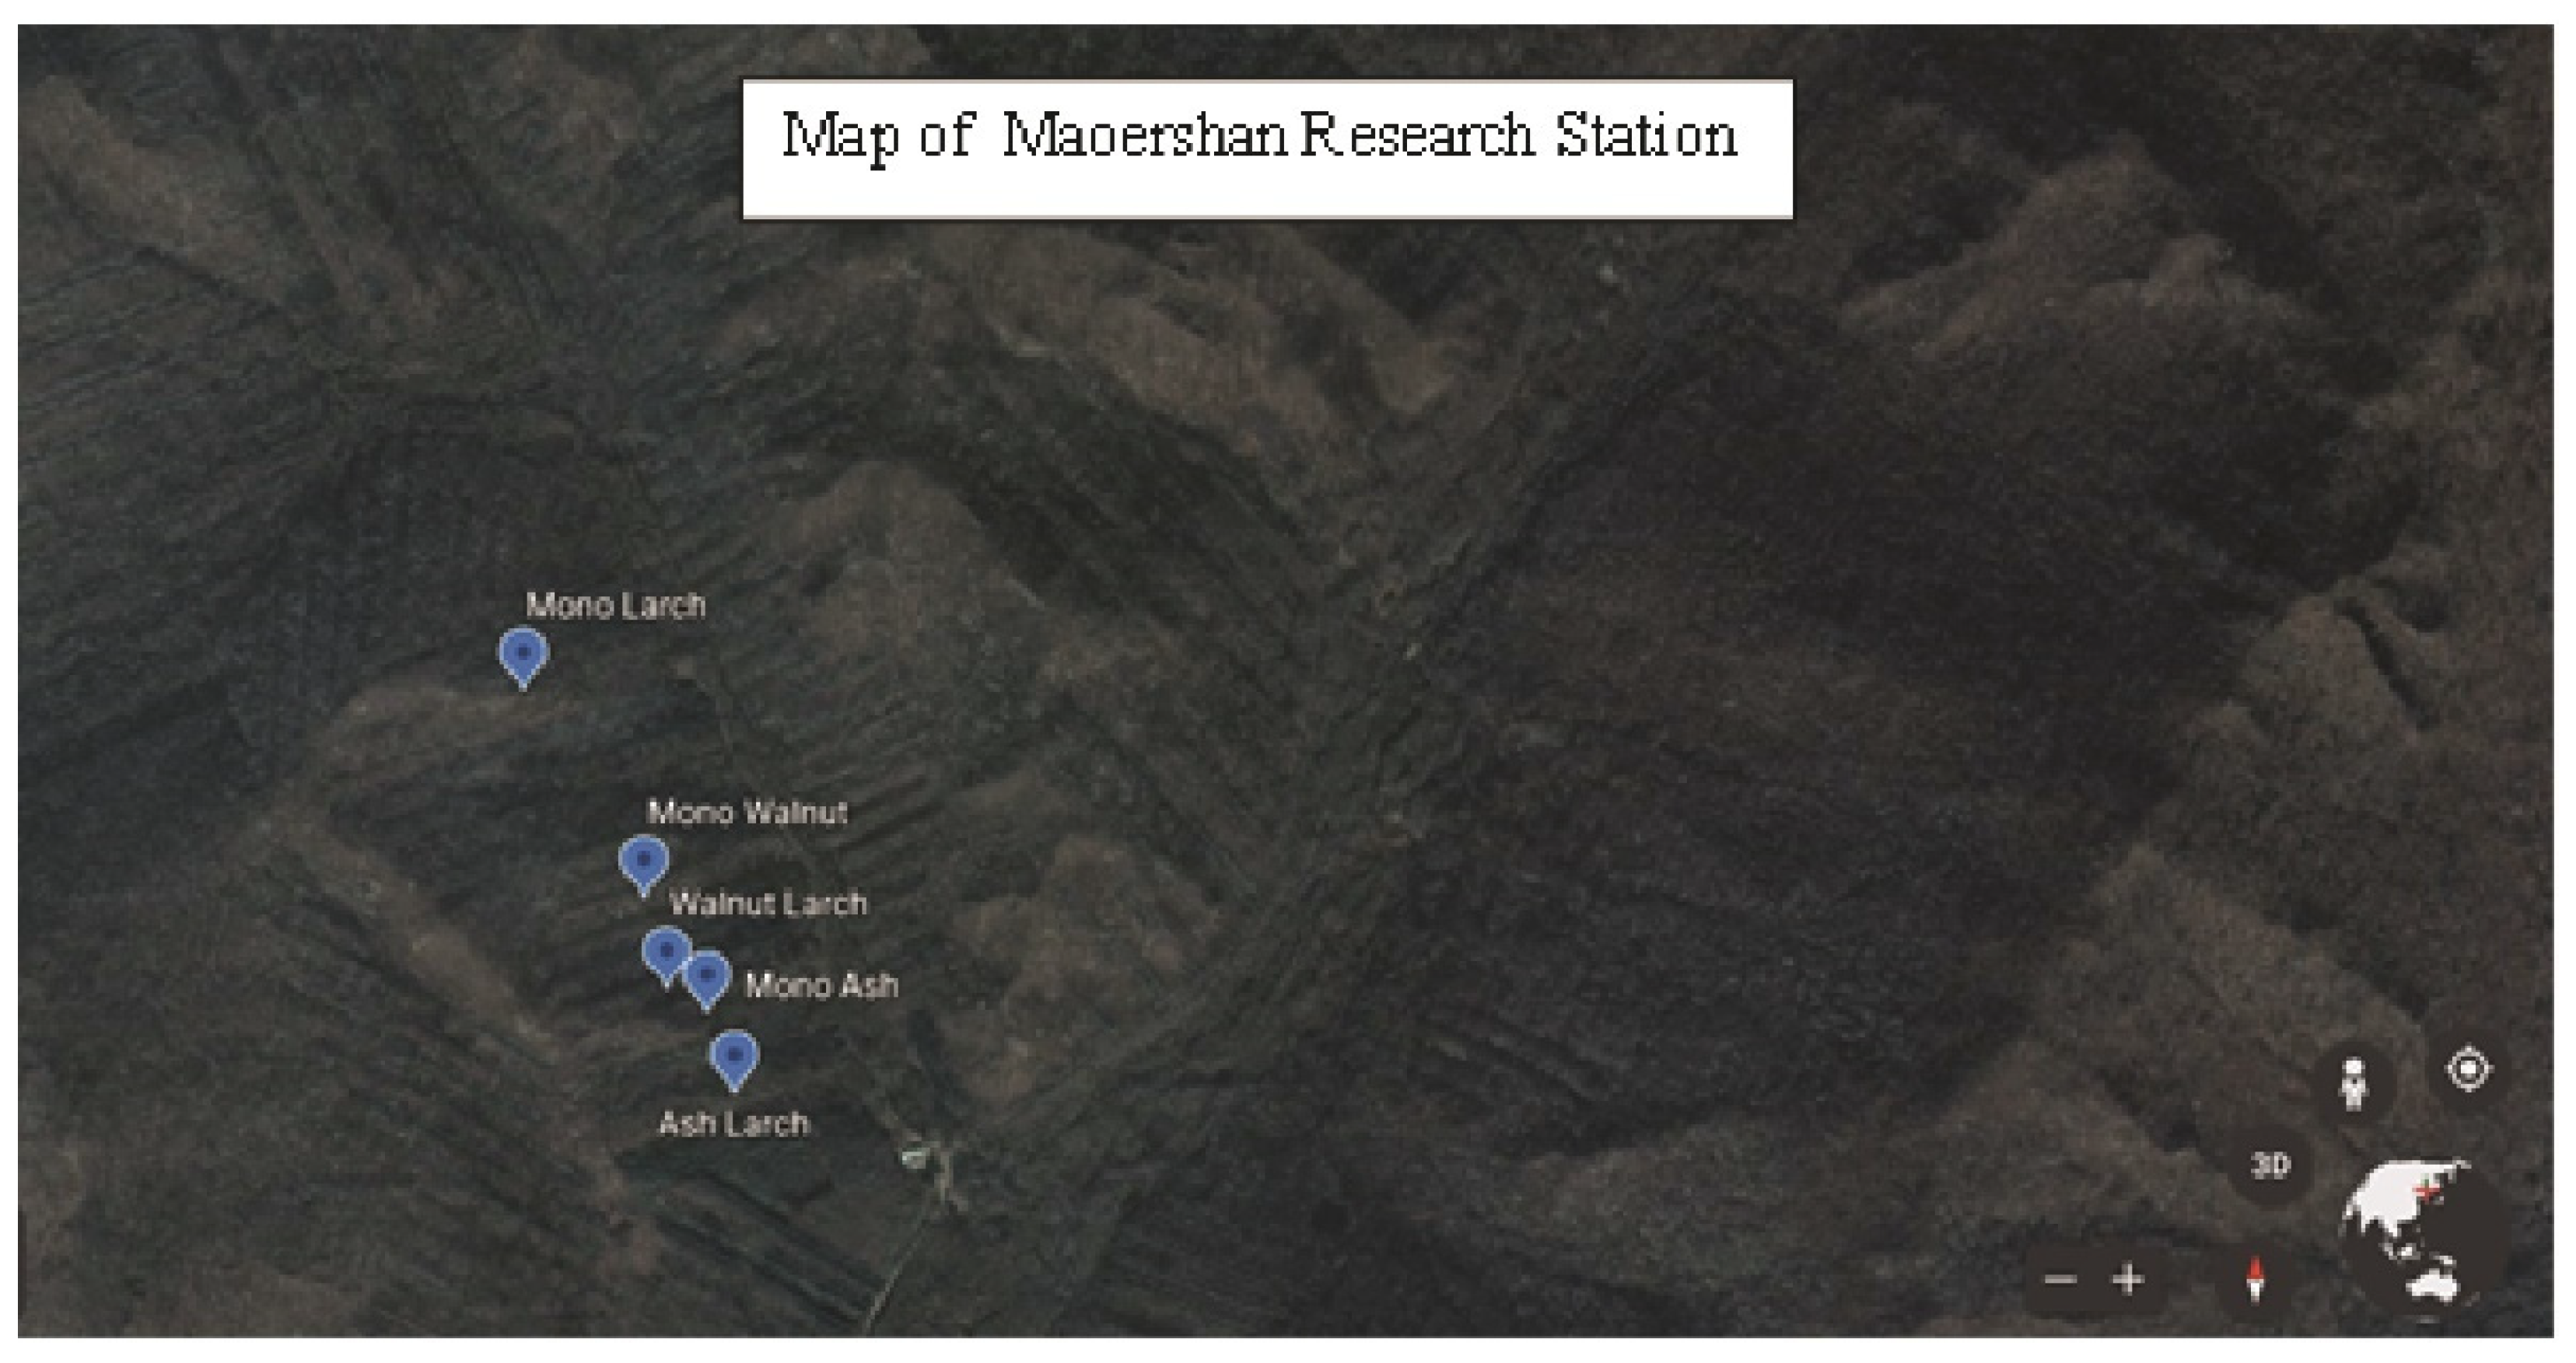
2.1. Soil Sampling Strategy

The soil samples were collected in October 2019 after removing the litter from the forest floor for each subplot, and randomly, three cores were selected, a soil sample taken from 0–20-cm soil depth mixed and put in Ziploc bags and transported to the laboratory. The soil samples were further subdivided into three parts. One subsample set was air-dried, grinded, and sieved through 2 mm to measure exchangeable cations and NH4+-N NO3-N [24]. In contrast, the second set of subsamples was processed through a 0.5-mm sieve and used to measure P fractions and soil pH. The third set was simultaneously oven-dried and processed through a 0.25-mm sieve to estimate the soil organic carbon and total nitrogen [13].

2.2. Soil Chemical Analyses

The soil organic carbon and nitrogen were determined through the dry combustion method using a Vario EL III elemental analyzer, i.e., Elementar Analysensysteme GmbH, Hanau, Germany. The NH4+-N (ammonium) and NO3-N (nitrate) were obtained using 2-M KCl, as determined by an auto analyzer III Bran, Luebbe GmbH, Norderstedt Germany [13]. One-step method i.e., 0.1-mol L−1 BaCl2 (50:1, solution:soil) was used to examine the exchangeable cations H+, K+, Na+, Ca2+, Mg2+, Al3+, Fe3+, and Mn2+. The extract was filtered with an acetate filter. The H+ ion was determined with a glass electrode, while the rest of the cations were measured by coupled plasma mass spectrometry (Agilent Technologies Co. Ltd., Santa Clara, CA, USA) [24]. To determine the soil pH, 1-g soil was mixed with distilled water at a ratio 1:2.5 and shaken on a mechanical shaker (30 min). The soil pH was measured using the calibrated pH meter (S220 Seven Compact pH Meter, Shanghai, China) [13]. Additionally, we calculated the effective acidity (EA), and it was the combination of Al and H.
For the analysis of the P fraction, a method modified by Hedley et al. [54] was used, and soil samples (01g) were taken into a 50-mL centrifugal tube with an added 30 mL of distilled water, along with 05 drops of chloroform. The solute was shaken for 18 h mechanically and used for organic and inorganic H2O determinations. The resultant soils in tubes were again filled with 0.5-mol/L NaHCO3, with an added 05 drops of chloroform, and shaken for 18 h. The extracts were used for organic (Po) and inorganic (Pi) phoaphorus, NaHCO3 determination. The tubes with remaining soil were again filled with 30 mL of distilled water, 0.1-mol/L NaOH, and an added 05 drops of chloroform. The solute was shaken for 18 h for the determination of Pi and Po. The same procedure was repeated for the determination of Pi and Po for 1-M HCl. While for the determination of residual P, the Tissen et al. [55] method was used, employing H2SO4 and H2O2 in the digestion chamber.

2.3. Calculations of the Effective Cation Exchange Capacity, Base Saturation%, Al:Ca Ratio, and Effective Acidity

The soil effective cation exchange capacity (CEC) was calculated by adding all the exchangeable base cations on an equivalent basis. The fractions of base cations like K+, Na+, Ca2+, and Mg2+ in CEC were calculated as the base saturation [24], while the effective acidity was measured by combining exchangeable aluminum and exchangeable hydrogen ions [56]. The calculations are as given below:
CEC (mmol kg−1) = K+ + Na+ + Mg2+ + Ca2+ + Mn2+ + Fe3+ + Al3+ + H+ (add on equivalent basis).
BS% = (K+ + Na+ + Mg2+ + Ca2+)/CEC * 100
Al:Ca = Al3+/Ca2+
EA(mmol kg−1) = Al3+ + H+

2.4. Statistical Analysis

ANOVA (Analysis of variance) of factorial design for species, fertilization, and their interactions were carried out to examine whether the N and P fertilizers affected the phosphorus fractions, exchangeable cations, or otherwise. The Shapiro-Wilk test was used to check the normality, while the post-hoc Tukey honest significant difference (HSD) test was applied to compare treatments. Heatmap for Pearson’s correlation coefficients was performed to determine positive or negative correlations within soil chemical properties and soil P forms using the “ggplot2” and “reshape2” packages in “R” v. 3.6.1 [57]. A redundancy analysis (RDA) was used to identify the soil properties (i.e., soil acidity) that predicted the variations in P fractions and base cations. The RDA was performed with the “rda” function by using the “vegan” package in R v. 3.6.1 [57]. All statistical analyses were performed in the program R v. 3.6.1 [57]. Sigma Plot v. 12.5 (Systat software Inc., San Jose, CA, USA) was used for graphical representations. Mean data were displayed as mean ± SE. If not noted otherwise, a significance level was reported at 0.05.

3. Results

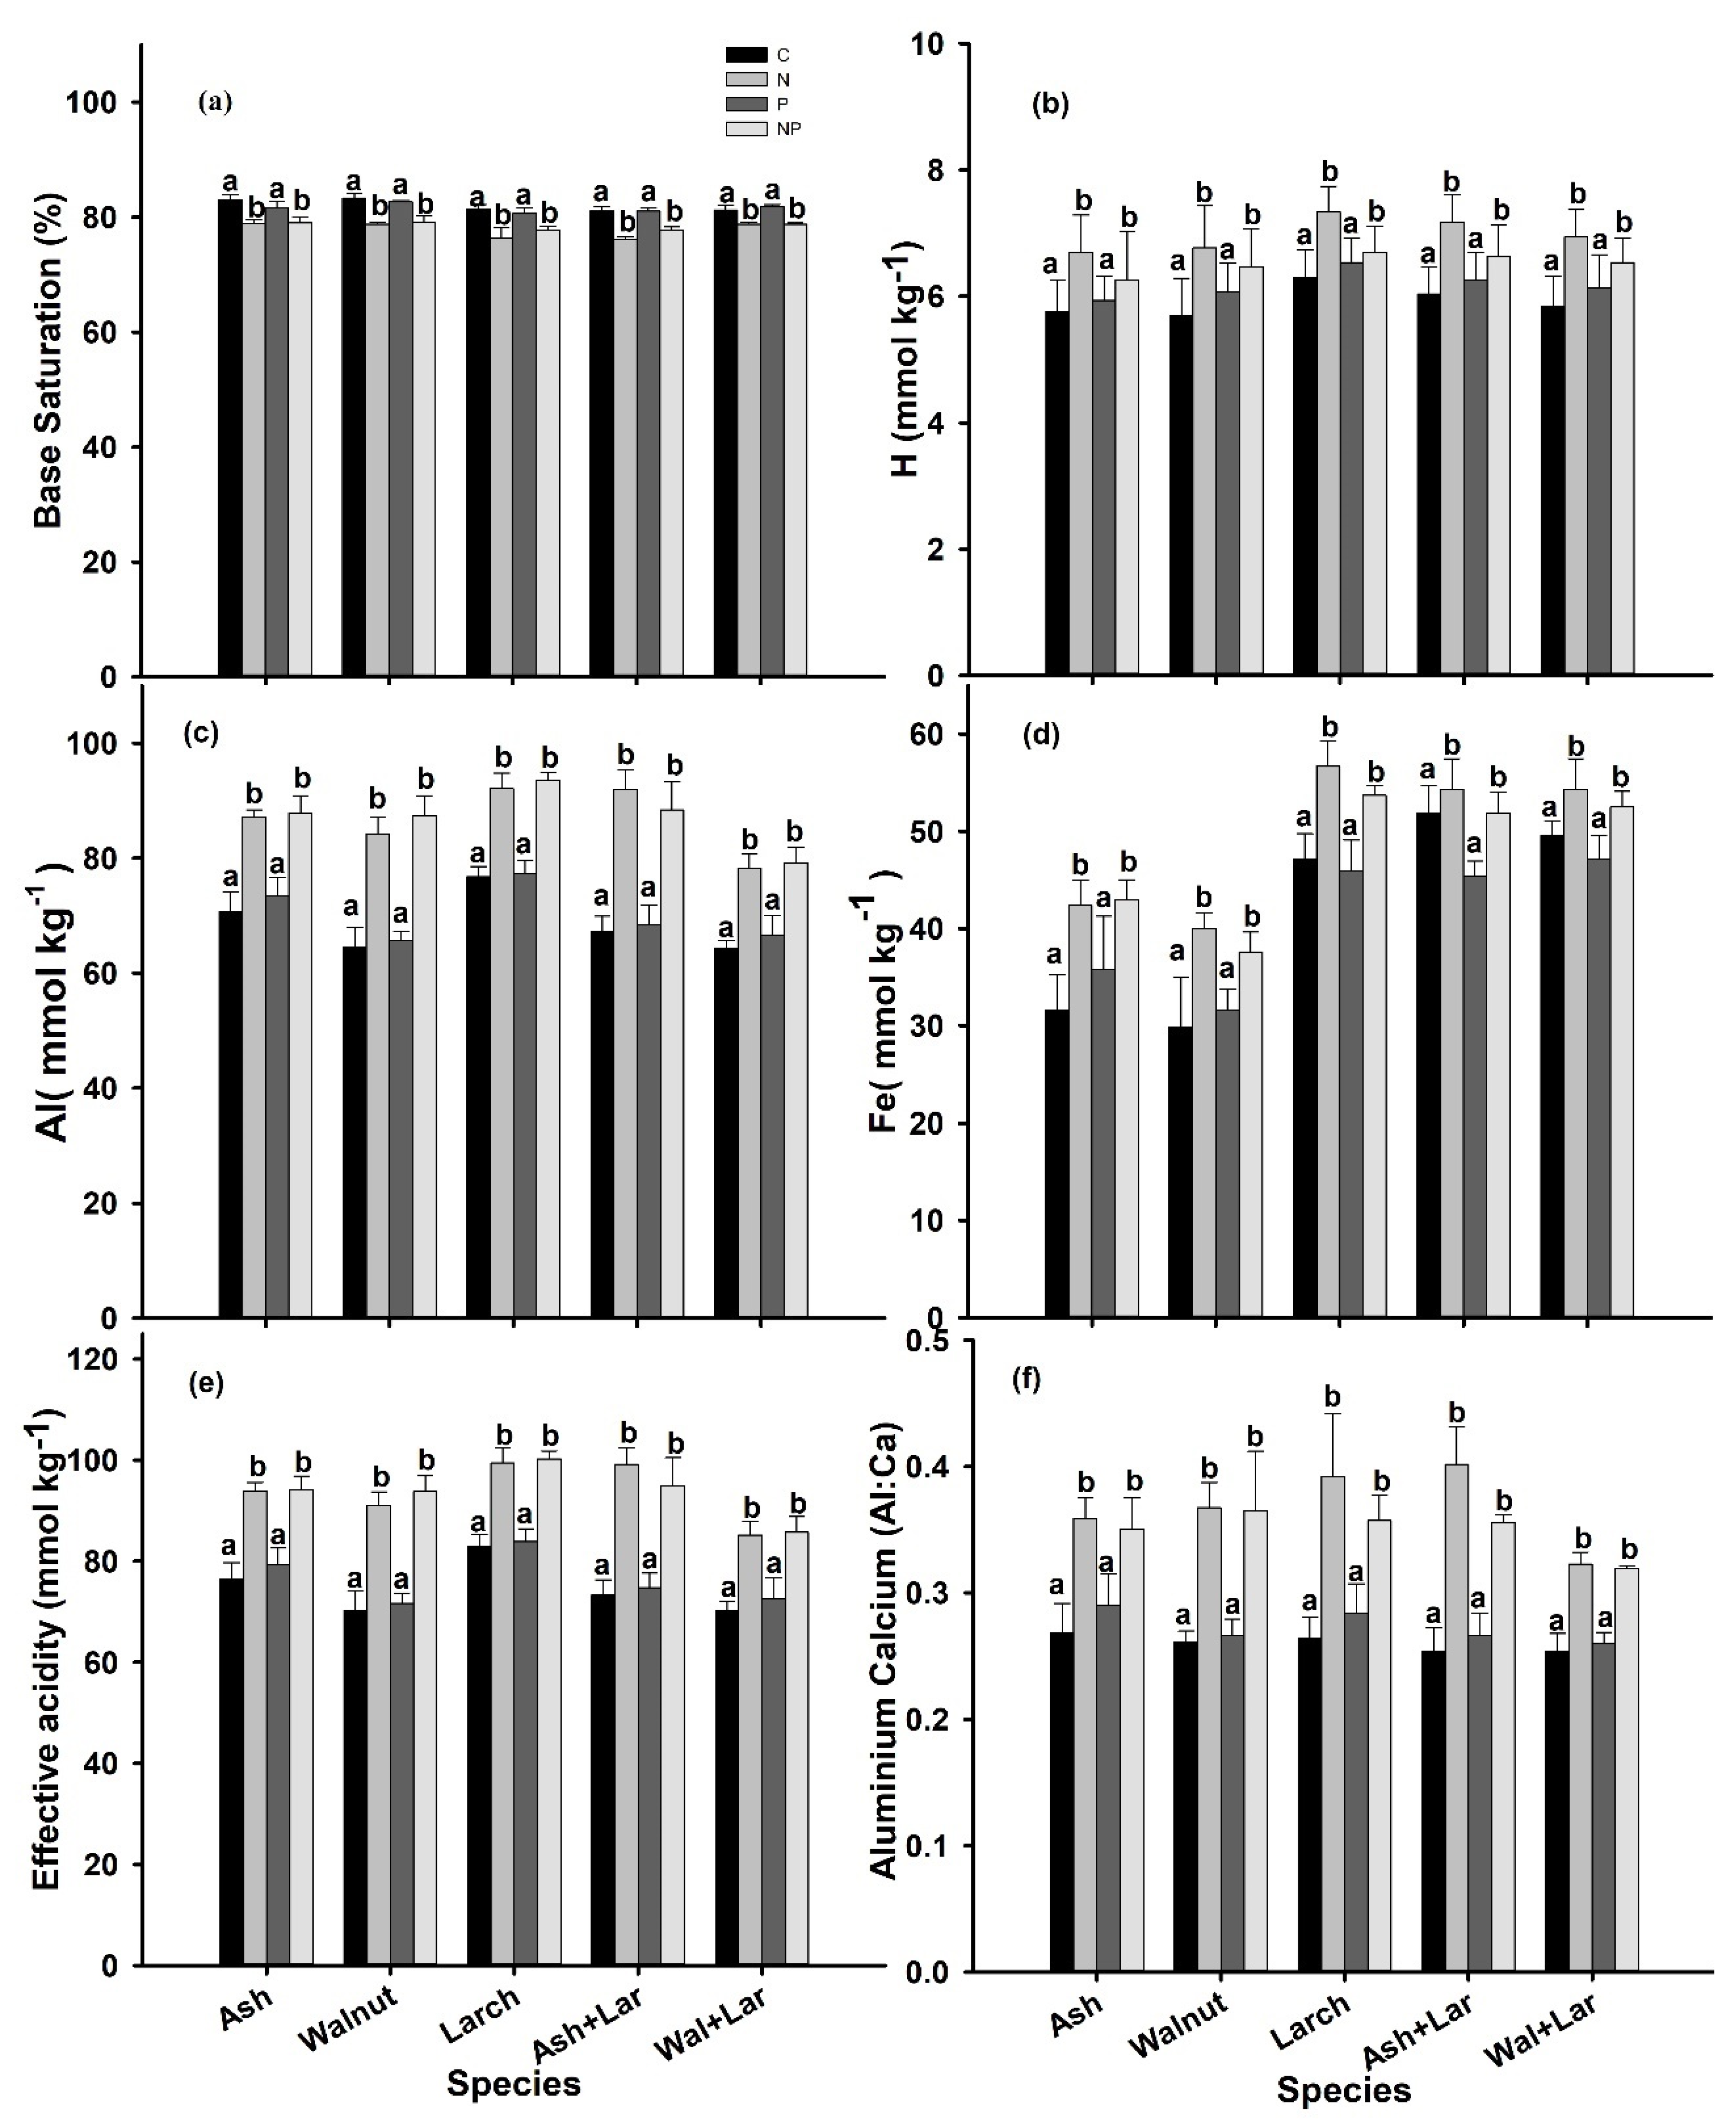
3.1. Soil Chemical Properties

Different elements showed variations concerning species and fertilizer application (Figure 2, Table 3, and Supplementary Table S1). However, of the selected soil chemical properties, i.e., the H+ ion, exchangeable ions Al3+ and Fe3+, EA (the combination of Al and H ions), Al:Ca, soil organic carbon (SOC), C:N ratios, and NO3-N significantly increased (p < 0.05) by N and NP fertilizations but remained stable under P application relative to the control in all plantations (Figure 2b–f and Table 3 and Table 4), while the Mg2+ and Ca2+ ions were significantly decreased (p < 0.05) by N addition but remained stable under P and NP fertilization in all plantations (Table 2 and Table 3). The base saturation percentage (BS%) was also affected (p < 0.05) in N and NP addition plots when compared to that of the control, while remaining stable under the P addition across the plantations (Figure 2a). Similarly, the soil pH significantly decreased by the soil N enrichment but was not significantly affected by either P or NP fertilizations across all plantations (Table 3 and Table 4), whereas the total P was not significantly affected by any of the fertilization’s treatments in all plantations (Supplementary Table S1 and Figure S1f).

3.2. Soil P Fractions

All phosphorus fractions were significantly affected by species and fertilization (Table 3). The H2O Pi significantly increased (p < 0.05) by P fertilization but remained stable under N and NP fertilizations across all plantations (Figure 3a). However, NaHCO3 Pi, the labile P, significantly decreased (p < 0.05) under N enrichment while increasing under P fertilization but remained stable under NP application across all plantations (Figure 3b). Similarly, the NaOH Pi increased significantly (p < 0.05) by N enrichment while remaining stable under P and NP fertilizations in all plantations (Figure 3c), whereas NaOH-Po significantly decreased (p < 0.05) by N and NP additions but remain unaffected under P applications across all plantations (Figure 3d). However, the H2O Po, NaHCO3 Po, HCl Pi, HCl Po, and residual P were not significantly affected by any of the fertilization treatments in all plantations (Supplementary Figure S1a–e and Table S1).

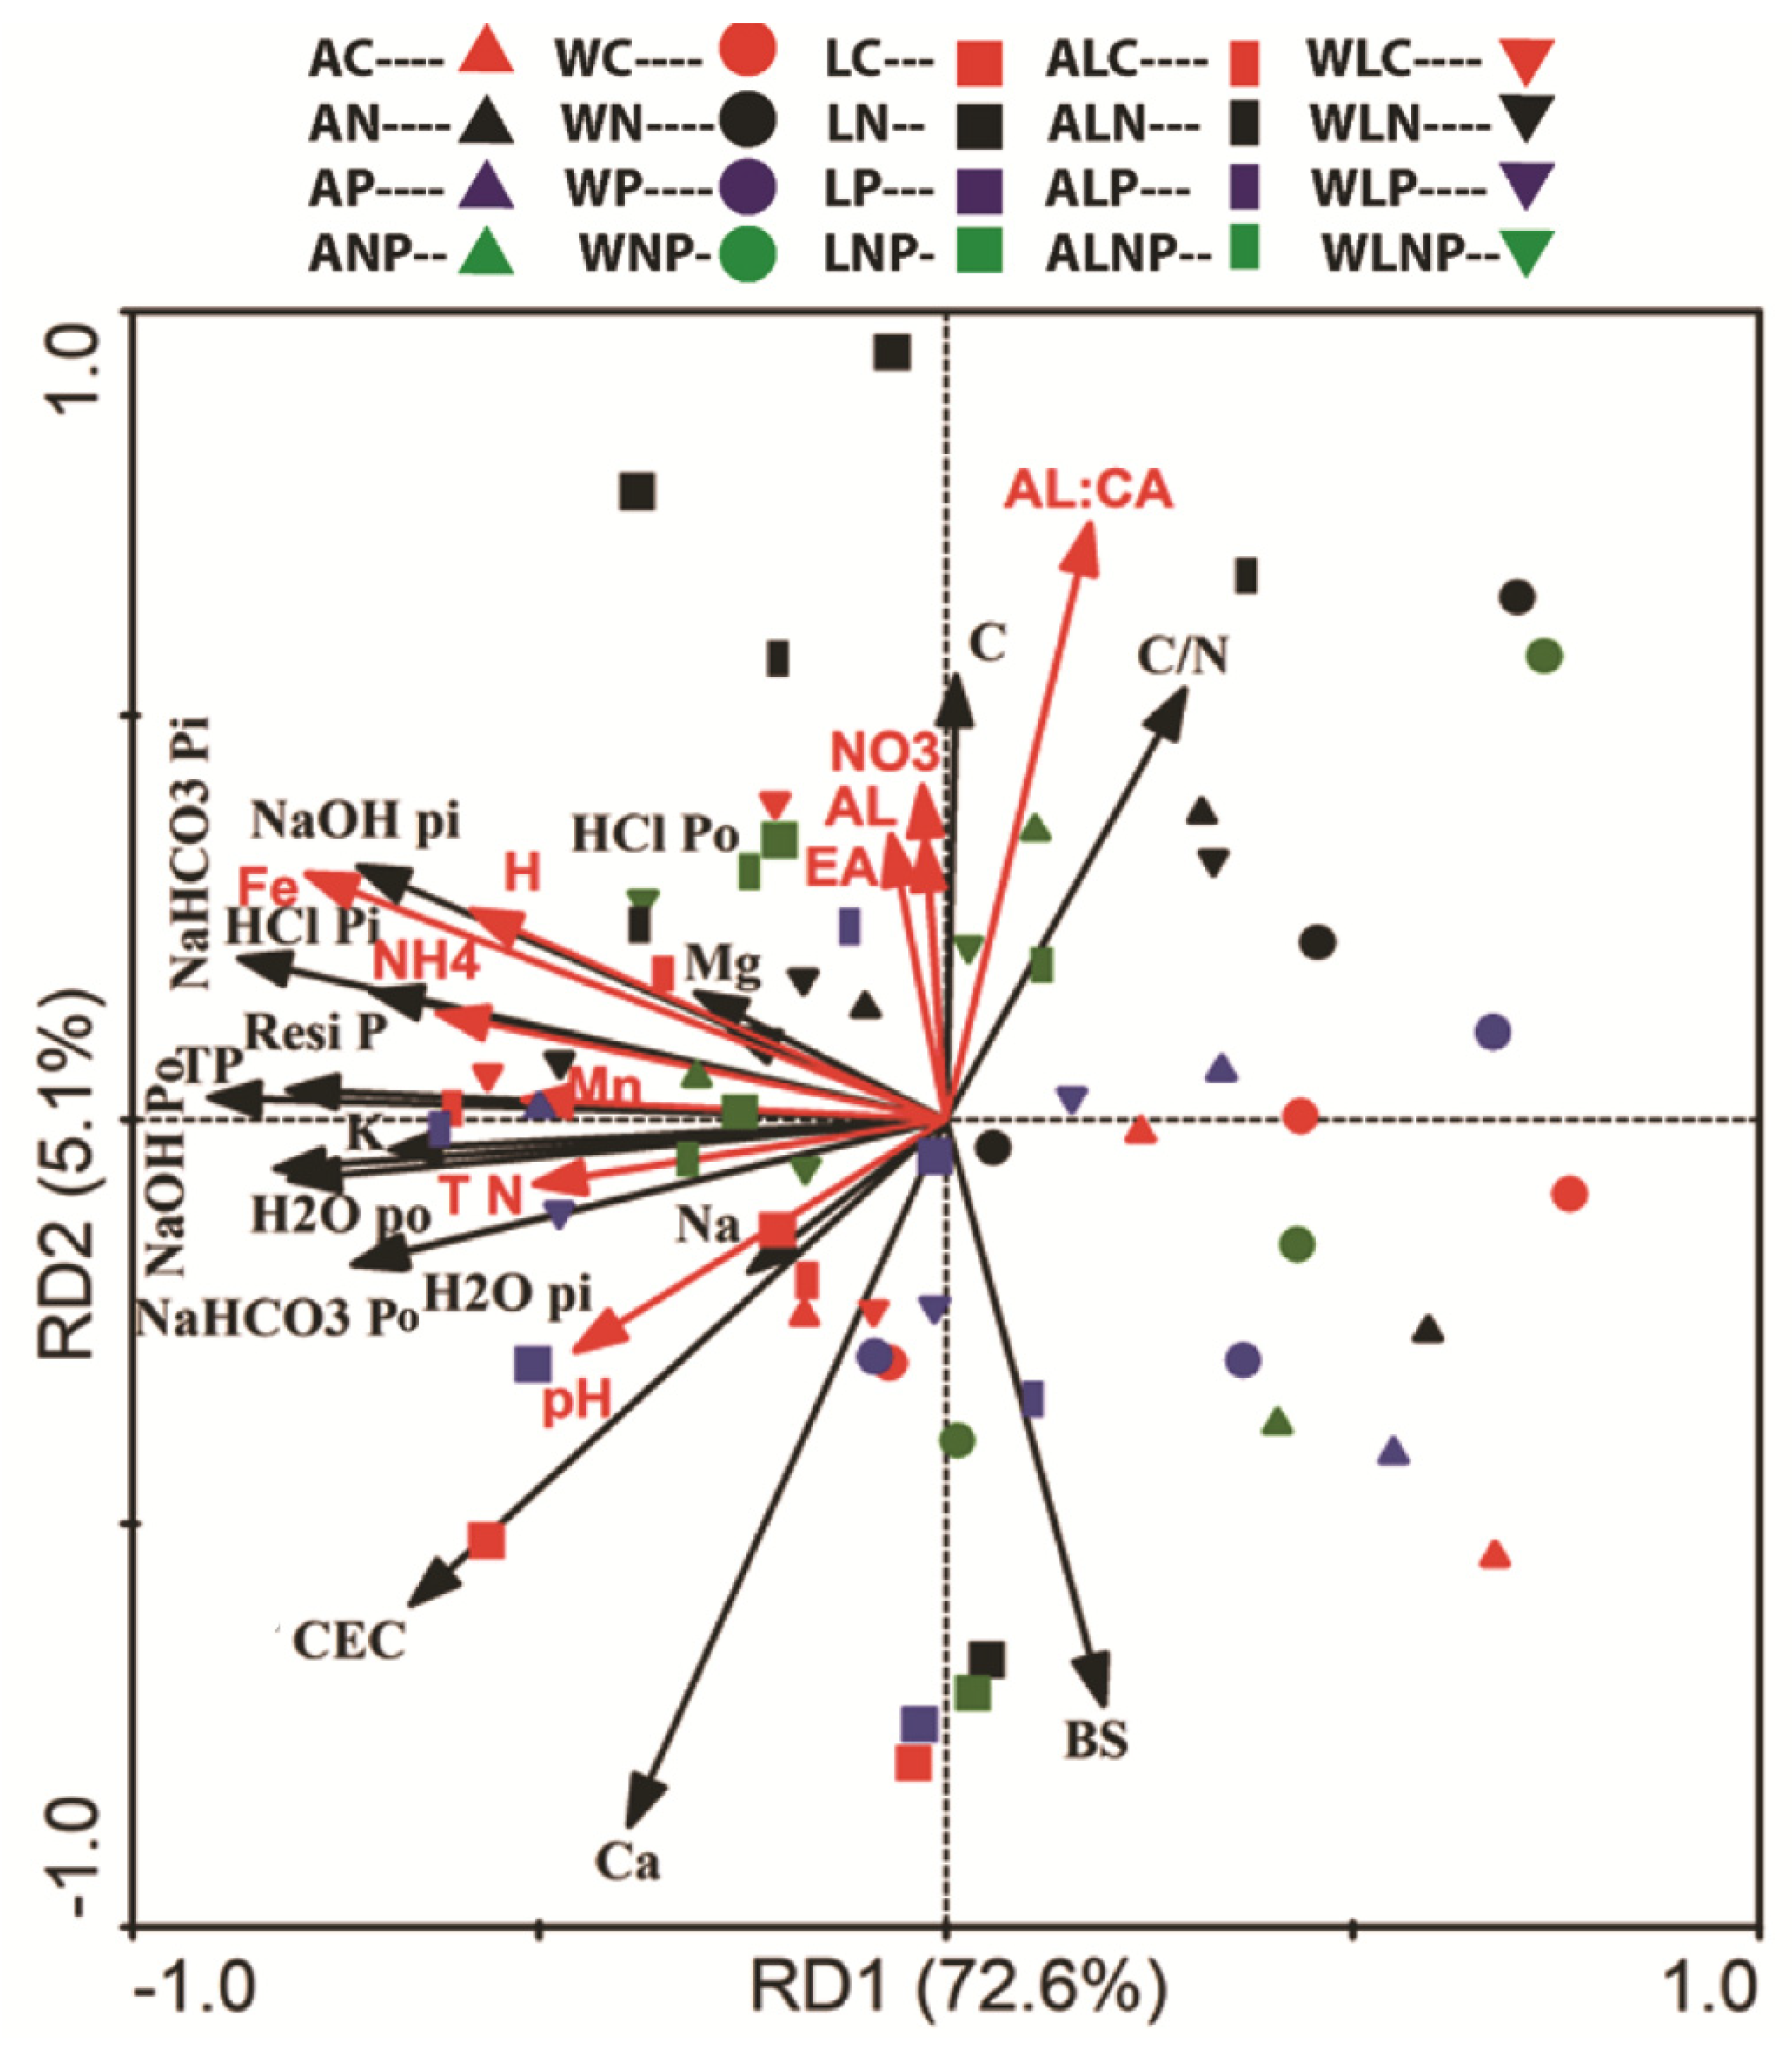
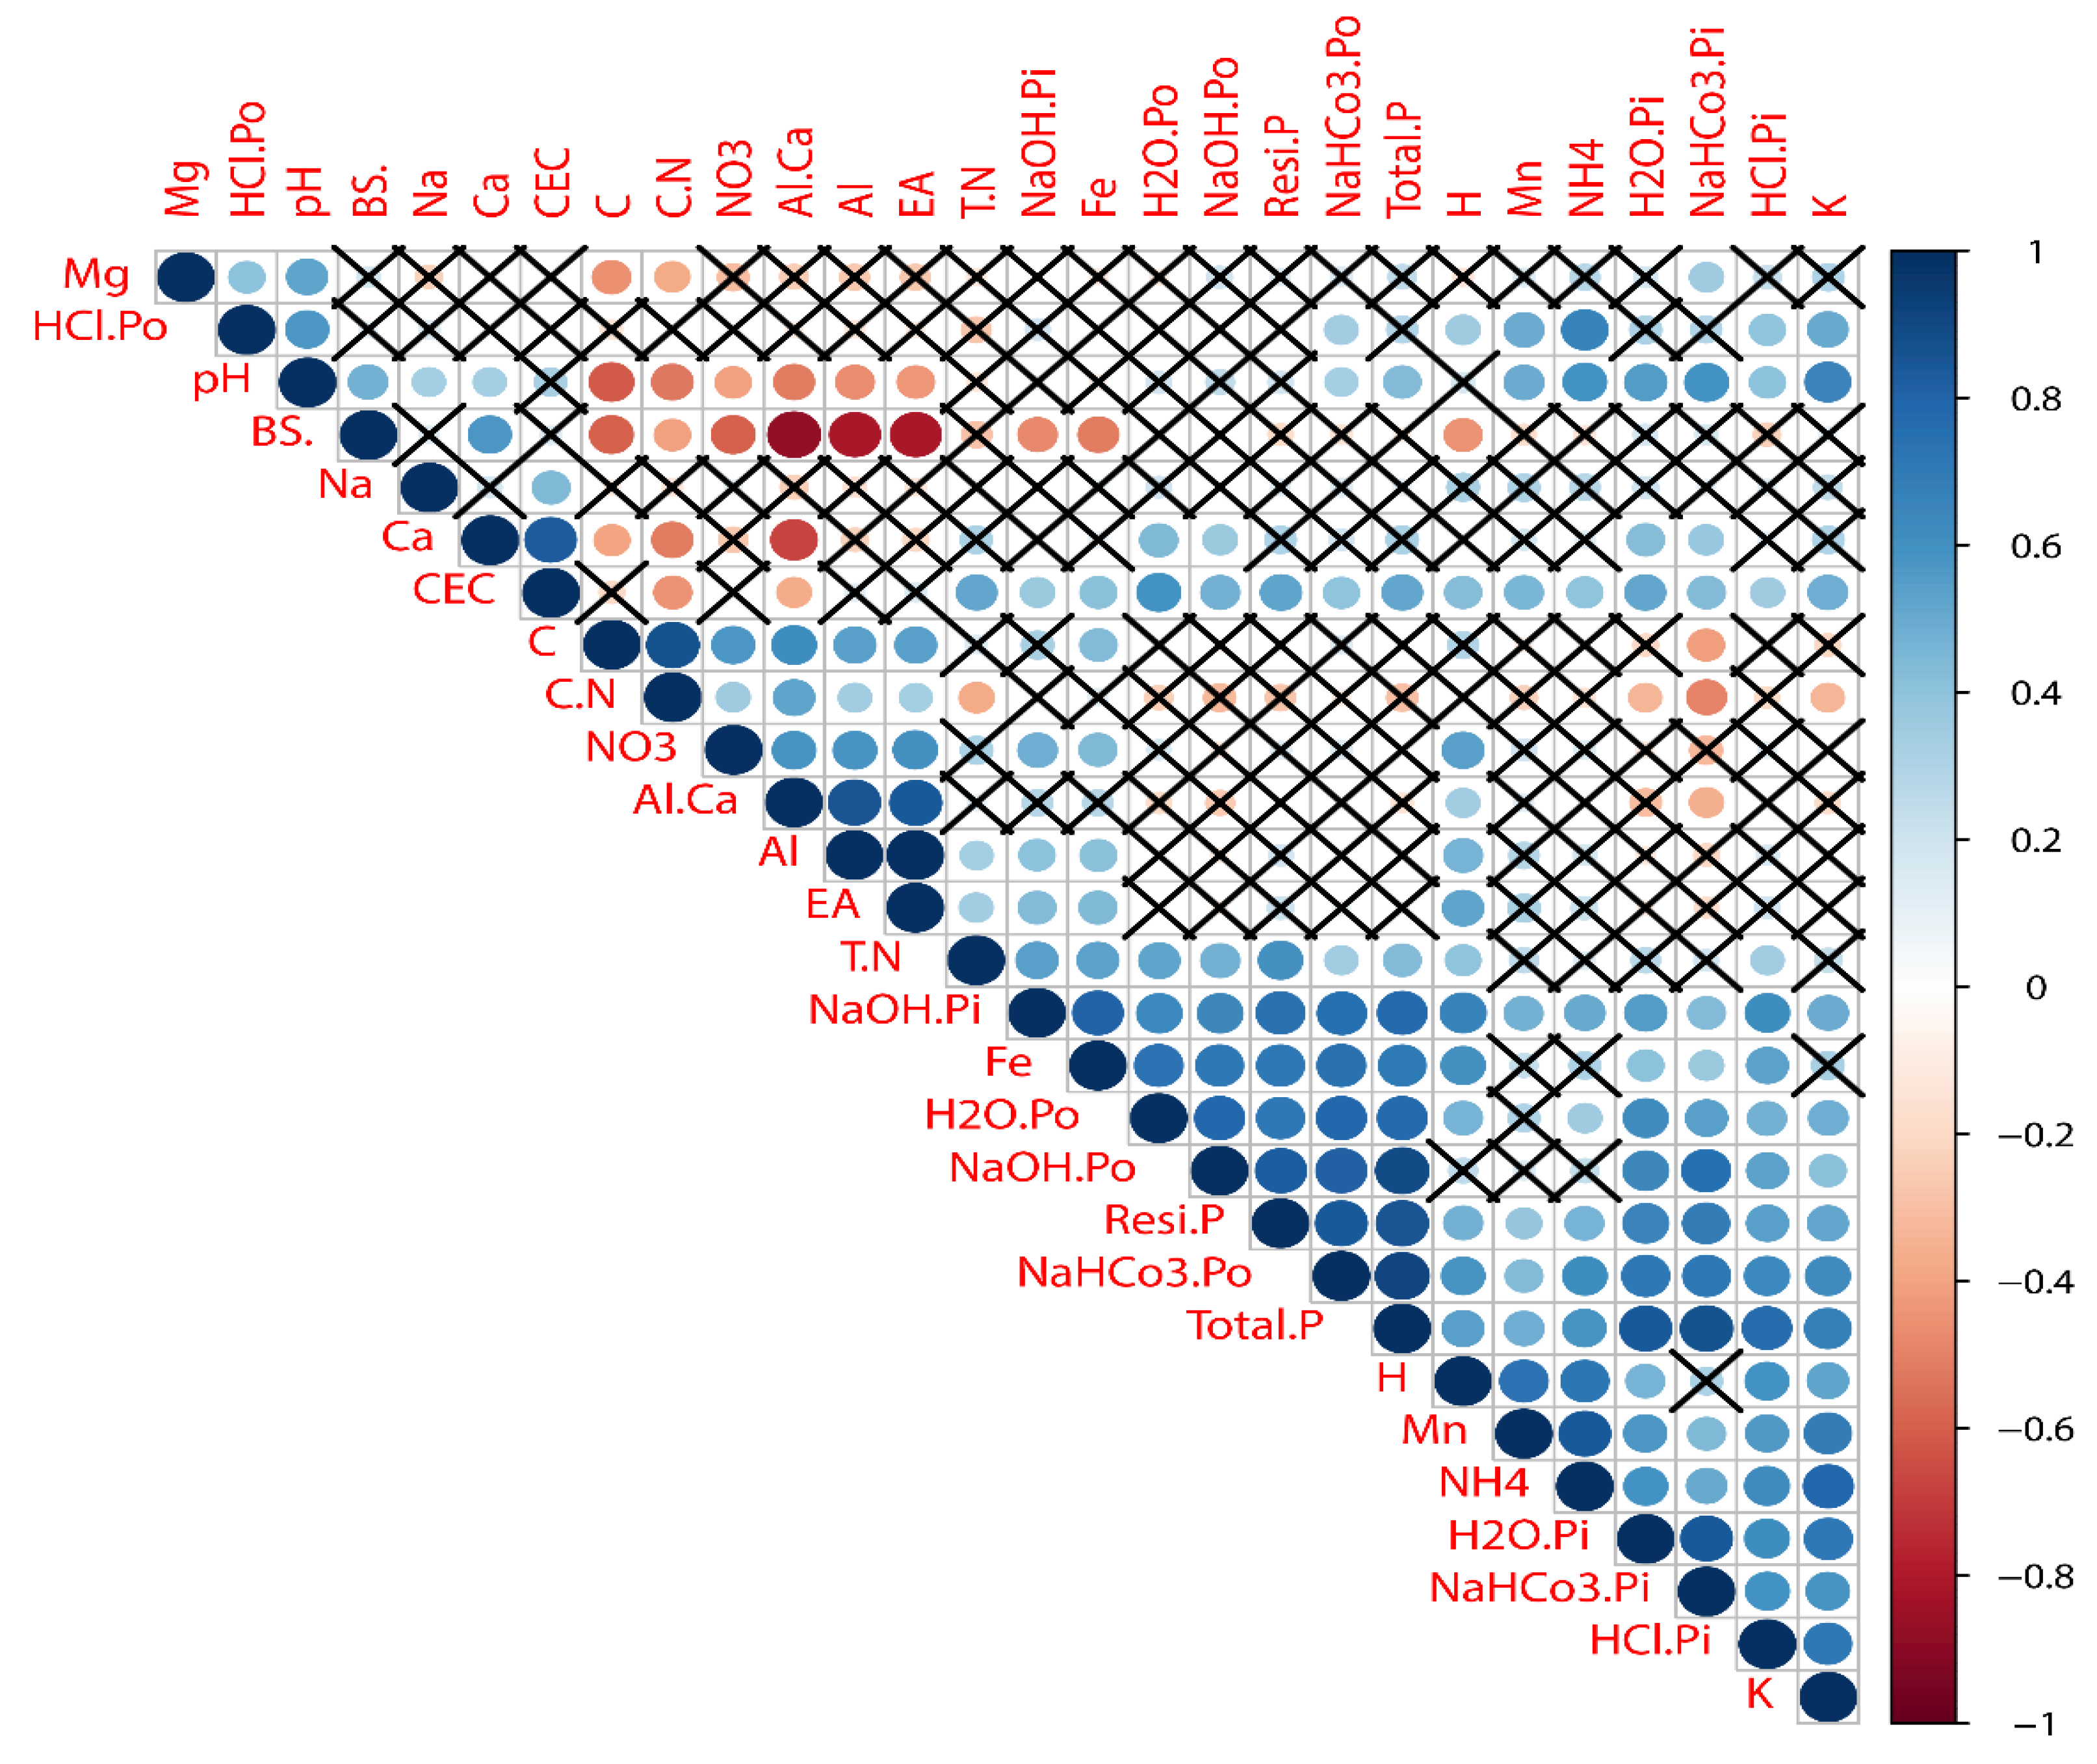
3.3. Correlation between Soil P Fractions and Chemical Properties

Among plantations, the RDA showed the interrelationship of soil P fractions and base cations with soil acidity and the responses to additional N and P fertilizations (Figure 4). The axis 1 and axis 2 of the RDA accounted for 72.6% and 5.6% of the total variations, respectively. Based on our aim, the factors responsible for soil acidification, like Fe3+, H+, NH4+-N, Mn, TN, and pH, strongly correlated to NaOH Pi, HCl Pi, NaHCO3 Pi, Resi P, total phosphorious (TP), NaOH Po, H2O Po, NaHCO3 Po, and H2O Pi while weakly correlating to HCl Po, Mg, C, BS%, and Na (Figure 4). Besides, the SOC and CN ratio were strongly positively related to the Al:Ca ratio. Based on the RDA, up to 77.7% of the total variation in soil P fractions and other chemical properties were explained by N and P availability. In contrast, Al3+, NO3-N, and EA showed weaker responses.
Looking at the trait interrelations between the mono- and mixed (Figure 5 and Supplementary Figures S2 and S3) cultures, the total P was found to be significantly positively related to all P fractions in the mixed culture. Still, in the monoculture, HCl Po was not significantly related to total P. All the P fractions were significantly related to each other. Still, HCl was not significantly related to H2O Po, NaHCO3 Pi, NaOH Pi, and NaOH Po in the monoculture, while, in the mixed culture, NaHCO3 Pi was not significantly related to H2O Po or NaOH Pi to NaHCO3 Pi or HCl Po to H2O Po, H2O Pi, NaOH Po, and NaOH Pi, respectively. However, K was significantly related to all P fractions in the monoculture but not in the mixed culture, except for HCl Po.
Similarly, Mg was significantly positively related to NaHCO3 Pi and HCl Po in the monoculture. In contrast, in the mixed, it was found to be significantly related to NaOH Po. Interestingly, Na was significantly positively related to H2O Pi, H2O Po, Total P, NaHCO3 Po, and HCl Po in the monoculture but not significantly related to any P fractions in the mixed culture. Ca2+ was found to be significantly positively related to H2O Pi, H2O Po, NaHCO3 Pi, NaOH Po, and total P in the monoculture, but in the mixed culture, it was found to be significantly related to H2O Pi, H2O Po, NaHCO3 Pi-Po, and total P. Looking at the trait interrelations between the base cations, K+ was found to be significantly positively related to Mg2+ and Na+ only in the monoculture and, in the mixed culture, significantly related to Mg2+ and Ca2+. The BS% was significantly related to NaOH Pi, HCl Pi, and Ca2+ in the monoculture and, in the mixed culture, significantly related to NaOH Pi and Ca2+. Interestingly, it was found that both the cultures showed a more or less similar pattern of correlations to their trait’s interrelations. See Supplementary Figures S2 and S3 for details.

4. Discussion

4.1. Effects of Additional N on the Soil Chemical Properties

The study revealed that soil pH and BS% significantly decreased in N addition plots and increased the EA (Figure 2a,e). Our results are confirmed by the previous study of Shi et al. [58], which reported that the pH and BS% significantly decreased by the N addition in two contrasting warm temperate forests. Some further studies suggested that N is limited in temperate ecosystems, but due to an increase in N’s atmospheric deposition, it can lead to N saturation [59,60]. The leaching down of nitrate due to its high mobility and weak bind to soil particles (i.e., negative charge on clay particle) results in a decrease in base cations and soil pH [61]. The increase in soil acidity might be the release of H+ at the time of nitrification processes [62]. The pattern of the cation pool also indicates that all plantations might be approaching towards the Al-buffering stage reported in previous studies [60,63]. However, we did not measure the precipitation rate and chemical composition, but Al buffering in the study area might be because of two factors, i.e., precipitation and N deposition. Precipitation plays a vital role in soil biochemistry, as reported in a previous study that the mean precipitation rate would rise in the 21st century [64]. Secondly, in nature, a N wet deposition never occurs alone; it will occur with precipitation [25]. We also observed a significant increase in the Al:Ca ratio, while a significant decrease in BS% (Figure 2b,d). Our findings confirmed the previous findings of Mao et al. [24] and Malek [12], which suggests that these plantations are probable in Al stress; in this regard, further long-term study is needed.
We also observed that NO3-N significantly increased while NH4+-N remained stable in N additional plots (Table 4 and Supplementary Table S2). Yan et al. [65] reported that, in Eastern China’s terrestrial ecosystem, the N’s input and its forms create a balance between H+ ion consumption and production and plays a significant role in soil N mineralization with increased N application. However, the nonsignificant effect of NH4+-N and increase of NO3-N also indicate that the decrease in ammonification and increase in nitrification suggest N saturation [66]. Similarly, the long-term N addition increases the N mineralization rate in the soil due to microorganism adaptability to increased soil acidification and the N content [67]. We found an increase in soil organic carbon (SOC) in N additional plots, which confirmed the findings of Tafazoli et al. [66] and Nave et al. [15], Since the global C cycle is affected by additional atmospheric N and essential to monitor the forest soil C:N ratio, it plays a significant role in forest health, as the plant uptake of available N is made through the C and microbial activities in soil [68]. The decrease in base cations like Ca2+ and Mg2+ in N additional plots (Supplementary Table S2) is attributed to the increase in Fe3+ and Al3+ ions, mainly responsible for soil acidification, and leads to the depletion of soil nutrients, which ultimately affect the vitality and health of forests [12,69,70]. Lucas et al. [9] reported that the emission of NOx and SO2 cause soil acidification, resulting in weathering and leaching down of base cations. The selective weathering of certain base cations like Ca > Na > Mg > K would cause a reduction in base cation budgets and an imbalance of metal ions in soils [71].

4.2. Effects of Additional P on the Soil Chemical Properties

In our study, we observed that the H2O Pi and NaHCO3 Pi significantly increased with the additional P (Figure 3a,b), while the rest of the P fractions remained stable in all plantations. The stability in other fractions might be refer to adding P, which increased the N uptake by plants and subsequently reduced the excess N from the ecosystem. This finding is an agreement with previous research, wherein P significantly increased the litter N and microbial biomass and reduced N mineralization [72], which reduced the nitrate leach-down effect and the emission of nitrous oxide [73]. In the acidification mitigation, nitrate uptakes by trees also provide hydroxyl ion in the soil [62]. An increase in H2O Pi and NaHCO3 Pi also suggests that P biotic assimilation might be augmented, i.e., an increase in soil hydroxyl ions [23,62]. Our current study was also confirmed by the previous study of Zarif et al. (unpublished data) that the P increase in leaf P contents, and an increase in the microbial biomass carbon was also in-line with previous studies conducted in the temperate and tropical ecosystems [13,74]. Mao et al. [24] also reported that the amount of N was relatively higher in the winter than summer, which might depict that the continuous N deposition from the atmosphere increased the soil acidity, which indicates that a buffering effect by the additional P keeps the soil pH stable [13,24].
The exchangeable soil cations like K+, Ca2+, and Mg2+ were not significantly affected by the P application (Table 4 and Supplementary Table S2). Our results align with the previous study of Mori et al. [62], who found that the response of exchangeable cations and base saturation percentage to the increased P deposition disappeared after a long term of P addition, contrary to Zhu et al. [75], who reported that the two-year P fertilization significantly increased the total soil exchangeable base cations by 60%. The Al concentration was also not significantly affected by the P fertilization (Figure 1c). P’s nonsignificant effect on Al might be exchangeable with Al’s concentration on the soil pH [76]. The soil also maintains constant Al3+ ions, resulting in a balance in soil acidity immobilization that might occur due to phosphate availability [24].
Last, we hypothesized that the combination of N and P might increase the process of acidification, i.e., a decrease in soil pH, increase in effective acidity (EA), and a reduction in BS. P added to the plots is the main evidence of the buffering effect. The EA in NP additional plots showed a significant increase (Figure 2a), which suggests that the N application might significantly increase the nitrification process. This also describes Al and Fe’s solubilization, which decreased P binding considerably [13,77,78]. Similarly, Guo et al. [79] reported that the soil acidification in a major cropland of China was influenced by the N cycle during 1980–2000. Another research spread over seven plantations of Australia found that the combined applications of N and P fertilizers significantly increased the soil acidification in topsoil at five experimental sites [80]. However, more comprehensive monitoring would be necessary to understand P’s role in buffering N-deprived soil acidification in temperate ecosystems.

4.3. Effects of Fertilizations on P Fractions

The total P is the sum of organic and inorganic P, which relates to the net input (litter) and net output (nutrients) of the plant uptake. In our results, we observed that the total P was not significantly affected by additional N and P fertilizations (Supplementary Figure S1f), which reflects that there might be balance in P’s input and output by below- and aboveground [13]. However, we found a significant decrease in the NaHCO3 Pi concentration under N application and a significant increase under the P addition, while no considerable effect was observed under NP application in all plantations (Figure 3b). Our findings are not in-line with the previous findings of Weand et al. [81], who stated that the abundance of available P and biotic P varied from species to species and remained stable with fertilizer application. The N addition could stimulate the potential net N mineralization rate and possible net nitrification processes [81], resulting in an increase in the P biotic demand. Similarly, the study conducted in a larch plantation revealed that N and P concentrations might be increased in the roots, stem, branches, and leaves [82]. However, we did not measure any root traits, but the decrease in NaHCO3 Pi concentration under the N additional plot depicted that the plants consumed for growth and similar findings were also reported by Yang et al. [13] and that the root biomass of the Larch plantation was significantly increased by 20% after the long-term addition (nine years) of N fertilization. In contrast, the increase in H2O Pi and NaHCO3 Pi (Figure 3a,b) showed that the P biotic assimilation might be increased under P addition by providing more hydroxyl ions in the soil, which justifies the previous results of Zarif et al. (unpublished data) and Mao et al. [24], who reported an increase in P contents in leaves. The decrease in NaHCO3 Pi in the N additional plots could be due to the microbial activity. Khan et al. [83] reported a linear relationship between NaHCO3 Pi (Olsen-P) and the microbial biomass under different management activities. However, our results contradict the previous findings of Sardans et al. [84], who suggested that the P uptake decreased in the evergreen Mediterranean forest due to the decrease of soil available P. Furthermore, we observed that the overall P inorganic concentration in the monoculture showed significant variations (i.e., Larch > Ash > Walnut) to that of the mixed culture, which suggests a decrease in the microbial and enzymatic activities.
The amount of labile Pi indicates that the mycorrhizae play an essential role in the nutrient uptake, especially under a stressed condition. In accordance to the findings of Cross and Schlesinger [85] and Yang et al. [13], who reported that the intermediate P fraction, i.e., NaOH, was not readily available to plants, made chalets with Fe and Al oxides and may represent P desorption sites. However, this study observed that the increase in NaOH Pi under N deposition attributed the significant increase in the nitrification process, i.e., to soil acidification by the microbial mediation process of ammonia oxidation H+ ion. Furthermore, the soil pH decreasing by N addition plots while remaining stable in other plots suggests that the increase in Al and Fe solubilization significantly increased the soil P binding [77,78]. However, we observed that the N deposition might reduce the available P in soil by changing the inorganic P solubilization, P uptake, and microbial and enzymatic activities. Our study further confirmed the findings of Liu et al. [86], and Yang et al. [13], who reported that the long-term N application decreased the NaOH Po concentration of Pinus radiata and Larix gmelinii in subtropical and temperate forests. It was suggested that the NaOH Po pool can be a significant sink for available P in soil and may maintain the levels of plant available P through P mineralization (Yang et al. [13] and Beck and Sanchez [87]).

5. Conclusions

Our results indicate a significant increase in effective acidity under N and NP fertilizations but were not significantly affected by P fertilization in all plantations. Similarly, under N addition, the significant decrease in pH, base cations, Ca2+, and Mg2+ was attributed to the increase in Fe3+ and Al3+ ions, mainly responsible for soil acidification and leading to the depletion of soil nutrients, which, ultimately, affects the vitality and health of forests. Similarly, NaHCO3 Pi and NaOH Pi pointed out that N deposition may stimulate plant P uptake. In contrast, the increase in P deposition plots of H2O Pi and NaHCO3 Pi depicts that P biotic assimilation might be increased. The study further concluded that, although the P deposition showed a buffering effect, it could not help to mitigate the soil acidity. The P concentration was ranked as Larch >Ash > Walnut, respectively, in the monoculture, while, in the mixed, it more or less remained the same. This study gave detailed insight and understanding about the potential factors affecting P fractions and soil acidification in a temperate ecosystem. However, we think it will be necessary to conduct long-term research on soil aggregates in relation to fertilization, atmospheric N deposition, and precipitation rates of different forest stands to assess the generality of our results.

Supplementary Materials

The following are available online at https://www.mdpi.com/1999-4907/11/12/1274/s1, Figure S1. The organic P fractions (extracted by H2O, NaHCO3, and HCl) Residual and P Total P. Figure S2. Heat map for Pearson’s correlation coefficients of soil acidification, P fractions, and other soil chemical properties in mono cultures at three replications. Figure S3. Heat map for Pearson’s correlation coefficients of soil acidification, P fractions, and other soil chemical properties in mixed cultures at three replications. Table S1. ANOVA results of species, fertilizations and their interactions in mono and mixed cultures. Table S2. Soil chemical properties of mono culture and mixed culture.

Author Contributions

Conceptualization, N.Z. and Q.W.; methodology, N.Z. and A.K.; software, N.Z.; validation, N.Z., A.K., and Q.W.; formal analysis, N.Z.; investigation. and resources, A.K.; data curation, N.Z.; writing—original draft preparation, N.Z.; writing—review and editing, N.Z., A.K., and Q.W.; visualization, N.Z.; supervision, Q.W.; project administration, Q.W.; and funding acquisition, Q.W. All authors have read and agreed to the published version of the manuscript.

Funding

This work was financially supported by Heilongjiang Provincial Government for National Key Research Programs (GX18B022), Fundamental Research Funds for the Central Universities (2572017PZ03 and 2572019CP16) and the National Key Research and Development Program (2017YFD0601103).

Acknowledgments

We thank Zhang Yong, Xu liqing, Jianwen Hu, Zhu Kaiyue, Ma Shuang Jiao, and Li Hongli for their help and support in the fieldwork. We also appreciate Muhammad Khurram Shahzad and Muhammad Arif for invaluable suggestions in this paper. Finally, we must appreciate Anwaar Hussain and Muhammad Atif Jamil, for their expert assistance/help in the laboratory work.

Conflicts of Interest

No one declared any conflicts of interest.

References

  1. Galloway, J.; Townsend, A.; Erisman, J.W.; Bekunda, M.; Cai, Z.; Freney, J.; Martinelli, L.; Seitzinger, S.; Sutton, M. Transformation of the Nitrogen Cycle: Recent Trends, Questions, and Potential Solutions. Science (New York, N.Y.) 2008, 320, 889–892. [Google Scholar] [CrossRef] [PubMed] [Green Version]
  2. Penuelas, J.; Janssens, I.; Ciais, P.; Sardans, J. Anthropogenic global shifts in biospheric N and P concentrations and ratios and their impacts on biodiversity, ecosystem productivity, food security, and human health. Glob. Chang. Biol. 2020, 26. [Google Scholar] [CrossRef] [Green Version]
  3. Jia, Y.; Yu, G.; He, N.; Zhan, X.; Fang, H.; Sheng, W.; Zuo, Y.; Zhang, D.; Wang, Q.-F. Spatial and decadal variations in inorganic nitrogen wet deposition in China induced by human activity. Sci. Rep. 2014, 4, 3763. [Google Scholar] [CrossRef] [PubMed] [Green Version]
  4. Liu, X.; Zhang, Y.; Han, W.; Tang, A.; Shen, J.; Cui, Z.; Vitousek, P.; Erisman, J.W.; Goulding, K.; Christie, P.; et al. Enhanced Nitrogen Deposition over China. Nature 2013, 494, 459–462. [Google Scholar] [CrossRef] [PubMed]
  5. Pan, Y.P.; Wang, Y.S.; Tang, G.Q.; Wu, D. Wet and dry deposition of atmospheric nitrogen at ten sites in Northern China. Atmos. Chem. Phys. 2012, 12, 6515–6535. [Google Scholar] [CrossRef] [Green Version]
  6. Wen, Z.; Xu, W.; Li, Q.; Han, M.; Tang, A.; Zhang, Y.; Luo, X.; Shen, J.; Wang, W.; Li, K.; et al. Changes of nitrogen deposition in China from 1980 to 2018. Environ. Int. 2020, 144, 106022. [Google Scholar] [CrossRef]
  7. Suding, K.; Collins, S.; Gough, L.; Clark, C.; Cleland, E.; Gross, K.; Milchunas, D.; Pennings, S. Functional- and abundance-based mechanisms explain diversity loss due to N fertilization. PNAS 2005, 102, 4387–4392. [Google Scholar] [CrossRef] [Green Version]
  8. Tian, D.; Niu, S. A global analysis of soil acidification caused by nitrogen addition. Environ. Res. Lett. 2015, 10. [Google Scholar] [CrossRef]
  9. Lucas, R.W.; Klaminder, J.; Futter, M.; Bishop, K.; Gustaf, E.; Laudon, H.; Högberg, P. A meta-analysis of the effects of nitrogen additions on base cations: Implications for plants, soils, and streams. For. Ecol. Manag. 2011, 262, 95–104. [Google Scholar] [CrossRef]
  10. Lebauer, D.; Treseder, K. Nitrogen Limitation of Net Primary Productivity in Terrestrial Ecosystems is Globally Distributed. Ecology 2008, 89, 371–379. [Google Scholar] [CrossRef] [Green Version]
  11. Vitousek, P.; Howarth, R. Nitrogen limitation on land and in the sea: How can it occur? Biogeochemistry 1991, 13, 87–115. [Google Scholar] [CrossRef]
  12. Małek, S. Sustainability of Picea abies of Istebna provenance in Dupniański stream catchment as dependent on stand age class. Dendrobiology 2009, 61, 95–104. [Google Scholar]
  13. Yang, K.; Zhu, J.; Gu, J.; Yu, L.; Wang, Z. Changes in soil phosphorus fractions after 9 years of continuous nitrogen addition in a Larix gmelinii plantation. Ann. For. Sci. 2015, 72, 435–442. [Google Scholar] [CrossRef]
  14. Sinsabaugh, R.; Gallo, M.; Lauber, C.; Waldrop, M.; Zak, D. Extracellular Enzyme Activities and Soil Organic Matter Dynamics for Northern Hardwood Forests receiving Simulated Nitrogen Deposition. Biogeochemistry 2005, 75. [Google Scholar] [CrossRef] [Green Version]
  15. Nave, L.E.; Vance, E.; Swanston, C.; Curtis, P.S. Impacts of elevated N inputs on north temperate forest soil C storage, C/N, and net N-mineralization. Geoderma 2009, 153. [Google Scholar] [CrossRef]
  16. Cusack, D.; Silver, W.; Torn, M.; Burton, S.; Firestone, M. Changes in microbial community characteristics and soil organic matter with nitrogen additions in two tropical forests. Ecology 2011, 92, 621–632. [Google Scholar] [CrossRef] [Green Version]
  17. Futa, B.; Mocek-Płóciniak, A. The influence of uncontrolled grass burning on biochemical qualities of soil. J. Agric. Eng. 2016, 61, 98–100. [Google Scholar]
  18. de Groot, C.; Marcelis, L.F.M.; Boogaard, R.; Lambers, H. Growth and dry-mass partitioning in tomato as affected by phosphorus nutrition and light. Plant Cell Environ. 2001, 24, 1309–1317. [Google Scholar] [CrossRef]
  19. Aber, J.; Nadelhoffer, K.; Steudler, P.; Melillo, J. Nitrogen Saturation in Northern Forest Ecosystems. Bioscience 1989, 39, 378–386. [Google Scholar] [CrossRef]
  20. Binkley, D.; Burnham, H.; Allen, H. Waterquality Impacts of Forest Fertilization with Nitrogen and Phosphorus. For. Ecol. Manag. 1999, 121, 191–213. [Google Scholar] [CrossRef]
  21. Hou, E.; Luo, Y.; Kuang, Y.; Chen, C.; Lu, X.; Jiang, L.; Luo, X.; Wen, D. Global meta-analysis shows pervasive phosphorus limitation of aboveground plant production in natural terrestrial ecosystems. Nat. Commun. 2020, 11, 637. [Google Scholar] [CrossRef] [Green Version]
  22. Vitousek, P.; Porder, S.; Houlton, B.; Chadwick, O. Terrestrial phosphorus limitation: Mechanisms, implications, and nitrogen-phosphorus interactions. Ecol. Appl. 2010, 20, 5–15. [Google Scholar] [CrossRef] [PubMed] [Green Version]
  23. Fujii, K. Soil acidification and adaptations of plants and microorganisms in Bornean tropical forests. Ecol. Res. 2014, 29. [Google Scholar] [CrossRef] [Green Version]
  24. Mao, Q.; Xiankai, L.; Zhou, K.; Chen, H.; Zhu, X.; Mori, T.; Mo, J. Effects of long-term nitrogen and phosphorus additions on soil acidification in an N-rich tropical forest. Geoderma 2017, 285. [Google Scholar] [CrossRef]
  25. Zhang, H.; Shi, L.; Fu, S. Effects of nitrogen deposition and increased precipitation on soil phosphorus dynamics in a temperate forest. Geoderma 2020, 380, 114650. [Google Scholar] [CrossRef]
  26. Zhang, H.; Shi, L.; Wen, D.; Yu, K. Soil potential labile but not occluded phosphorus forms increase with forest succession. Biol. Fertil. Soils 2016, 52, 41–51. [Google Scholar] [CrossRef]
  27. Helfenstein, J.; Jegminat, J.; McLaren, T.I.; Frossard, E. Soil solution phosphorus turnover: Derivation, interpretation, and insights from a global compilation of isotope exchange kinetic studies. Biogeosciences 2018, 15, 105–114. [Google Scholar] [CrossRef] [Green Version]
  28. Walker, T.W.; Syers, J.K. The fate of phosphorus during pedogenesis. Geoderma 1976, 15, 1–19. [Google Scholar] [CrossRef]
  29. Bünemann, E.K. Assessment of gross and net mineralization rates of soil organic phosphorus—A review. Soil Biol. Biochem. 2015, 89, 82–98. [Google Scholar] [CrossRef]
  30. Helfenstein, J.; Pistocchi, C.; Oberson, A.; Tamburini, F.; Goll, D.S.; Frossard, E. Estimates of mean residence times of phosphorus in commonly considered inorganic soil phosphorus pools. Biogeosciences 2020, 17, 441–454. [Google Scholar] [CrossRef] [Green Version]
  31. Helfenstein, J.; Tamburini, F.; von Sperber, C.; Massey, M.S.; Pistocchi, C.; Chadwick, O.A.; Vitousek, P.M.; Kretzschmar, R.; Frossard, E. Combining spectroscopic and isotopic techniques gives a dynamic view of phosphorus cycling in soil. Nat. Commun. 2018, 9, 3226. [Google Scholar] [CrossRef] [PubMed]
  32. Lambers, H.; Chapin Iii, F.S.; Pons, T. Plant Physiological Ecology: Second Edition; Springer Science & Business Media: New York, NY, USA, 2008; pp. 1–604. [Google Scholar] [CrossRef]
  33. Lambers, H.; Raven, J.; Shaver, G.; Smith, S. Plant nutrient-acquisition strategies change with soil age. Trends Ecol. Evol. 2008, 23, 95–103. [Google Scholar] [CrossRef] [PubMed]
  34. Rosling, A.; Midgley, M.; Cheeke, T.; Urbina, H.; Fransson, P.; Phillips, R. Phosphorus cycling in deciduous forest soil differs between stands dominated by ecto- and arbuscular mycorrhizal trees. New Phytol. 2015, 209. [Google Scholar] [CrossRef] [Green Version]
  35. Oberson, A.; Joner, E.J. Microbial turnover of phosphorus in soil. In Organic Phosphorus in the Environment; CABI Publishing: Wallingford, UK, 2005; pp. 133–164. [Google Scholar] [CrossRef]
  36. Rhoades, C. Single-tree influences on soil properties in agroforestry: Lessons from natural forest and savanna ecosystems. Agrofor. Syst. 1997, 35, 71–94. [Google Scholar] [CrossRef]
  37. Binkley, D.; Giardina, C. Why Do Tree Species Affect Soils? The Warp and Woof of Tree–Soil Interactions. Biogeochemistry 1998, 42, 89–106. [Google Scholar] [CrossRef]
  38. Bardgett, R.; Bowman, W.; Kaufmann, R.; Schmidt, S.; Bardgett, R.D.; Bowman, W.D.; Kaufmann, R.; Schmidt, S.K. A temporal approach to linking aboveground and belowground ecology. Trends Ecol. Evol. 2005, 20, 634–641. [Google Scholar] [CrossRef]
  39. West, J.B.; Hobbie, S.E.; Reich, P.B. Effects of plant species diversity, atmospheric [CO2], and N addition on gross rates of inorganic N release from soil organic matter. Glob. Chang. Biol. 2006, 12, 1400–1408. [Google Scholar] [CrossRef]
  40. Walker, T.N.; Ward, S.E.; Ostle, N.J.; Bardgett, R.D. Contrasting growth responses of dominant peatland plants to warming and vegetation composition. Oecologia 2015, 178, 141–151. [Google Scholar] [CrossRef]
  41. Liu, Z.; Liu, G.-h.; Fu, B.-J.; Zheng, X. Relationship between plant species diversity and soil microbial functional diversity along a longitudinal gradient in temperate grasslands of Hulunbeir, Inner Mongolia, China. Ecol. Res. 2008, 23, 511–518. [Google Scholar] [CrossRef] [Green Version]
  42. Bragazza, L.; Bardgett, R.; Mitchell, E.; Buttler, A. Linking soil microbial communities to vascular plant abundance along a climate gradient. New Phytol. 2014, 205. [Google Scholar] [CrossRef]
  43. Fahey, T.J.; Yavitt, J.B.; Sherman, R.E.; Maerz, J.C.; Groffman, P.M.; Fisk, M.C.; Bohlen, P.J. Earthworm effects on the incorporation of litter C and N into soil organic matter in a sugar maple forest. Ecol. Appl. 2013, 23, 1185–1201. [Google Scholar] [CrossRef] [Green Version]
  44. Payn, T.; Carnus, J.-M.; Freer-Smith, P.; Kimberley, M.; Kollert, W.; Liu, S.; Orazio, C.; Rodriguez, L.; Silva, L.N.; Wingfield, M.J. Changes in planted forests and future global implications. For. Ecol. Manag. 2015, 352, 57–67. [Google Scholar] [CrossRef] [Green Version]
  45. Frédéric, A.; Mollicone, D.; Stibig, H.-J.; Aksenov, D.; Laestadius, L.; Li, Z.; Popatov, P.; Yaroshenko, A. Areas of rapid forest-cover change in boreal Eurasia. For. Ecol. Manag. 2006, 237, 322–334. [Google Scholar] [CrossRef]
  46. Zhang, P.; Shao, G.; Zhao, G.; Le Master, D.C.; Parker, G.R.; Dunning, J.B.; Li, Q. China’s Forest Policy for the 21st Century. Science 2000, 288, 2135. [Google Scholar] [CrossRef] [Green Version]
  47. Yang, L.; Wang, P.; Kong, C.-H. Effect of larch (Larix gmelinii Rupr.) root exudates on Manchurian walnut (Juglans mandshurica Maxim.) growth and soil juglone in a mixed-species plantation. Plant Soil 2010, 329, 249–258. [Google Scholar] [CrossRef]
  48. Shi, F.; Chen, X.; Chen, N. Study on the artificial mixed forest of Juglans mandshurica and Larix olgensis. J. Northeast For. Univ. 1991, 19, 32–43. [Google Scholar]
  49. Razaq, M.; Salahuddin; Shen, H.-l.; Sher, H.; Zhang, P. Influence of biochar and nitrogen on fine root morphology, physiology, and chemistry of Acer mono. Sci. Rep. 2017, 7. [Google Scholar] [CrossRef]
  50. Guo, D.; Li, H.; Mitchell, R.; Han, W.; Hendricks, J.; Fahey, T.; Hendrick, R. Fine root heterogeneity by branch order: Exploring the discrepancy in root turnover estimates between minirhizotron and carbon isotopic methods. New Phytol. 2008, 177, 443–456. [Google Scholar] [CrossRef]
  51. Gundersen, P.; Rasmussen, L. Nitrification in Forest Soils: Effects from Nitrogen Deposition on Soil Acidification and Aluminum Release. Rev. Environ. Contam. Toxicol. 1990, 113, 1–45. [Google Scholar] [CrossRef]
  52. Bowden, R. Chronic nitrogen additions reduce total soil respiration and microbial respiration in temperate forest soils at the Harvard Forest. FEMS Microbiol. Lett. 2004. [Google Scholar] [CrossRef]
  53. Mei, l.; Gu, J.; Zhang, Z.; Wang, Z. Responses of fine root mass, length, production and turnover to soil nitrogen fertilization in Larix gmelinii and Fraxinus mandshurica forests in Northeastern China. J. For. Res. 2010, 15, 194–201. [Google Scholar] [CrossRef]
  54. Hedley, M.; Stewart, J.; Chauhan, B. Changes in Inorganic and Organic Soil Phosphorus Fractions Induced by Cultivation Practices and by Laboratory Incubations1. Soil Sci. Soc. Am. J. 1982, 46. [Google Scholar] [CrossRef]
  55. Tiessen, H.; Moir, J.O. Characterization of available P by sequential extraction. Soil Sampl. Methods Anal. 1993, 7, 75–86. [Google Scholar]
  56. Robertson, G.P.; Sollins, P.; Ellis, B.G.; Lajtha, K. Exchangeable ions, pH, and cation exchange capacity. Stand. Soil Methods Long Term Ecol. Res. 1999, 28, 462. [Google Scholar]
  57. Team, R.C. R: A Language and Environment for Statistical Computing; Team, R.C.: Vienna, Austria, 2013. [Google Scholar]
  58. Shi, L.; Zhang, H.; Liu, T.; Zhang, W.; Shao, Y.; Ha, D.; Li, Y.; Zhang, C.; Cai, X.-A.; Rao, X.; et al. Consistent effects of canopy vs. understory nitrogen addition on the soil exchangeable cations and microbial community in two contrasting forests. Sci. Total Environ. 2016, 553, 349–357. [Google Scholar] [CrossRef]
  59. Carreira, J.; García-Ruiz, R.; Lietor, J.; Harrison, A. Biochemistry. Changes in soil phosphatase activity and P transformation rates induced by application of N-and S-containing acid-mist to a forest canopy. Soil Biol. Biochem. 2000, 32, 1857–1865. [Google Scholar] [CrossRef]
  60. Bowman, W.; Cleveland, C.; Halada, L.; Hreško, J.; Baron, J. Negative impact of nitrogen deposition on soil buffering capacity. Nat. Geosci. 2008, 1, 767–770. [Google Scholar] [CrossRef]
  61. Lu, X.; Mo, J.; Gundersern, P.; Zhu, W.-X.; Zhou, G.-Y.; Li, D.; Zhang, X. Effect of Simulated N Deposition on Soil Exchangeable Cations in Three Forest Types of Subtropical China. Pedosphere 2009, 19, 189–198. [Google Scholar] [CrossRef]
  62. Bolan, N.; Hedley, M.; White, R. Processes of soil acidification during nitrogen cycling with emphasis on legume based pastures. Plant Soil 1991, 134, 53–63. [Google Scholar] [CrossRef]
  63. Raubuch, M.; Beese, F.; Bolger, T.; McCarthy, F.; Anderson, J.M.; Splatt, P.; Willison, T.; Coûteaux, M.M.; Ineson, P.; Berg, M.P.; et al. Acidifying processes and acid-base reactions in forest soils reciprocally transplanted along a European transect with increasing pollution. Biogeochemistry 1998, 41, 71–88. [Google Scholar] [CrossRef]
  64. Indian People Organizing for Change (IPOC). Climate Change 2013: The Physical Science Basis: Working Group I Contribution to the Fifth Assessment Report of the Intergovernmental Panel on Climate Change; Cambridge University Press: Cambridge, UK; New York, NY, USA, 2014; ISBN 110705799X. [Google Scholar]
  65. Yan, E.-R.; Wang, X.; Huang, J.-J.; Li, G.-Y.; Zhou, W. Decline of soil nitrogen mineralization and nitrification during forest conversion of evergreen broad-leaved forest to plantations in the subtropical area of Eastern China. Biogeochemistry 2008, 89, 239–251. [Google Scholar] [CrossRef]
  66. Tafazoli, M.; Hojjati, S.; Jalilvand or Djalilvand, H.; Lamersdorf, N. Simulated Nitrogen Deposition Reduces the Concentration of Soil Base Cations in Acer velutinum Bioss. Plantation, North of Iran. J. Soil Sci. Plant Nutr. 2019, 19, 440–449. [Google Scholar] [CrossRef]
  67. Falkengren-Grerup, U.; Brunet, J.; Diekmann, M. Nitrogen mineralisation in deciduous forest soils in south Sweden in gradients of soil acidity and deposition. Environ. Pollut. 1998, 102, 415–420. [Google Scholar] [CrossRef]
  68. Eberwein, J.; Shen, W.; Jenerette, G. Michaelis-Menten kinetics of soil respiration feedbacks to nitrogen deposition and climate change in subtropical forests. Sci. Rep. 2017, 7. [Google Scholar] [CrossRef] [Green Version]
  69. Katou, H. A pH-dependence implicit formulation of cation-and anion-exchange capacities of variable-charge soils. Soil Sci. Soc. Am. J. 2002, 66, 1218–1224. [Google Scholar] [CrossRef]
  70. Malhi, S.; Nyborg, M.; Harapiak, J. Effects of long-term N fertilizer-induced acidification and liming on micronutrients in soil and in bromegrass hay. Soil Till. Res. 1998, 48, 91–101. [Google Scholar] [CrossRef]
  71. Lu, X.; Mao, Q.; Gilliam, F.S.; Luo, Y.; Mo, J. Nitrogen deposition contributes to soil acidification in tropical ecosystems. Glob. Chang. Biol. 2014, 20, 3790–3801. [Google Scholar] [CrossRef]
  72. Mo, J.; Zhang, W.; Zhu, W.; Gundersen, P.E.R.; Fang, Y.; Li, D.; Wang, H.U.I. Nitrogen addition reduces soil respiration in a mature tropical forest in southern China. Glob. Chang. Biol. 2008, 14, 403–412. [Google Scholar] [CrossRef]
  73. Chen, H.; Gurmesa, G.A.; Zhang, W.; Zhu, X.; Zheng, M.; Mao, Q.; Zhang, T.; Mo, J. Nitrogen saturation in humid tropical forests after 6 years of nitrogen and phosphorus addition: Hypothesis testing. Funct. Ecol. 2015, 30. [Google Scholar] [CrossRef]
  74. Homeier, J.; Hertel, D.; Camenzind, T.; Cumbicus, N.; Maraun, M.; Martinson, G.; Poma López, L.; Rillig, M.; Sandmann, D.; Scheu, S.; et al. Tropical Andean Forests Are Highly Susceptible to Nutrient Inputs—Rapid Effects of Experimental N and P Addition to an Ecuadorian Montane Forest. PLoS ONE 2012, 7, e47128. [Google Scholar] [CrossRef]
  75. Zhu, F.; Lu, X.; Liu, L.; Mo, J. Phosphate addition enhanced soil inorganic nutrients to a large extent in three tropical forests. Sci. Rep. 2015, 5, 7923. [Google Scholar] [CrossRef] [PubMed] [Green Version]
  76. Ulrich, B. Natural and anthropogenic components of soil acidification. Zeitschrift für Pflanzenernährung und Bodenkunde 1986, 149, 702–717. [Google Scholar] [CrossRef]
  77. Chen, H. Phosphatase activity and P fractions in soils of an 18-year-old Chinese fir (Cunninghamia lanceolata) plantation. For. Ecol. Manag. 2003, 178, 301–310. [Google Scholar] [CrossRef]
  78. Dossa, E.; Diedhiou, S.; Compton, J.; Assigbetse, K.; Dick, R. Spatial patterns of P fractions and chemical properties in soils of two native shrub communities in Senegal. Plant Soil 2009, 327, 185–198. [Google Scholar] [CrossRef]
  79. Guo, J.; Liu, X.; Zhang, Y.; Shen, J.; Han, X.-W.; Zhang, W.; Christie, P.; Goulding, K.; Vitousek, P.M.; Zhang, F.S. Significant Acidification in Major Chinese Croplands. Science (New York, N.Y.) 2010, 327, 1008–1010. [Google Scholar] [CrossRef] [Green Version]
  80. Mitchell, A.D.; Smethurst, P.J. Surface soil changes in base cation concentrations in fertilised hardwood and softwood plantations in Australia. For. Ecol. Manag. 2004, 191, 253–265. [Google Scholar] [CrossRef]
  81. Weand, M.; Arthur, M.; Lovett, G.; Sikora, F.; Weathers, K. The phosphorus status of northern hardwoods differs by species but is unaffected by nitrogen fertilization. Biogeochemistry 2010, 97, 159–181. [Google Scholar] [CrossRef]
  82. Zhao, Q.; Liu, X.Y.; Hu, Y.; Zeng, D.-H. Effects of nitrogen addition on nutrient allocation and nutrient resorption efficiency in Larix gmelinii. Sci. Silvae Sin. 2010, 46, 14–19. [Google Scholar]
  83. Khan, K.S.; Joergensen, R.G. Relationships between P fractions and the microbial biomass in soils under different land use management. Geoderma 2012, 173–174, 274–281. [Google Scholar] [CrossRef]
  84. Sardans, J.; Penuelas, J. Increasing drought decreases phoshorus availability in an evergreen Mediterranean forest. Plant Soil 2004, 267, 367–377. [Google Scholar] [CrossRef]
  85. Cross, A.; Schlesinger, W. A Literature Review and Evaluation of the Hedley Fractionation: Applications to the Biogeochemical Cycle of Soil Phosphorus in Natural Ecosystems. Geoderma 1995, 64, 197–214. [Google Scholar] [CrossRef]
  86. Liu, Q.; Loganathan, P.; Hedley, M.; Skinner, M. The mobilisation and fate of soil and rock phosphate in the rhizosphere of ectomycorrhizal Pinus radiata seedlings in an Allophanic soil. Plant Soil 2004, 264, 219–229. [Google Scholar] [CrossRef]
  87. Beck, M.; Sanchez, P. Soil Phosphorus Fraction Dynamics during 18 Years of Cultivation on a Typic Paleudult. Soil Sci. Soc. Am. J. 1994, 58, 1424–1431. [Google Scholar] [CrossRef]
Figure 1. A map of the experimental site indicating the mono- and mixed plantations at Maoershan Experimental Farm of Northeast Forestry Univeristy, Harbin, China.
Forests 11 01274 g001
Figure 2. Base saturation (%) (a), hydrogen ion (H) (mmol kg−1) (b), aluminum (Al) (mmol kg−1) (c), iron (Fe) (mmol kg−1) (d), effective acidity (EA) (mmol kg−1) (e), and aluminum calcium ratio (f) at the control (C: no additional deposition; black bars) and after N: 20-g N m−2 yr−1; light grey, P: 10-g P m−2 yr−1; drak grey, and NP: 30-g NP m−2 yr−1; off-white fertilization of Ash, Walnut, Larch, Ash Larch, and Walnut Larch plantations in three replications at 0–20-cm soil depths in Northeast (NE) China. Within species significant differences between treatments are indicated by different lower-case letters (Tukey’s HSD post hoc; p < 0.05; mean ± SE).
Forests 11 01274 g002
Figure 3. H2O Pi (mg kg−1) (a), NaHCO3 Pi (mg kg−1) (b), NaOH Pi (mg kg−1) (c), and NaOH Pi (mg kg−1) (d) (extracted by H2O, NaHCO3, and NaOH) at control (C: no additional deposition; black bars) and after N: 20-g N m−2 yr−1; light grey, P: 10-g P m−2 yr−1; drak grey, and NP: 30-g NP m−2 yr−1; off-white fertilization of Ash, Walnut, Larch, Ash Larch, and Walnut Larch plantations in three replications at 0–20-cm soil depths in NE China. Within species significant differences between treatments are indicated by different lower-case letters (Tukey’s HSD post hoc; p < 0.05; mean ± SE).
Forests 11 01274 g003
Figure 4. The redundancy analysis (RDA) for soil properties from 0–20-cm soil depths in three mono- and mixed cultures: nitrogen 20 g m−2, phosphorus 10 g m−2, and the combination 20 + 10 g m−2. WC, WN, WP, and WNP: Walnut at control 0 g m−2, nitrogen 20 g m−2, phosphorus 10 g m−2, and combination 20 + 10 g m−2. LC, LN, LP, and LNP: Larch at control 0 g m−2, nitrogen 20 g m−2, phosphorus 10 g m−2, and combination 20 + 10 g m−2. ALC, ALN, ALP, and ALNP: Ash + Larch at control 0 g m−2, nitrogen 20 g m−2, phosphorus 10 g m−2, and combination 20 + 10 g m−2. WLC, WLN, WLP, and WLNP: Walnut + Larch at control 0 g m−2, nitrogen 20 g m−2, phosphorus 10 g m−2, and combination 20 + 10 g m−2. Phosphorus (Pi and Po) fractions (extracted by H2O, NaHCO3, NaOH, and HCl); residual P (Resi P); hydrogen ions (H); potassium ions (K); magnesium ions (Mg); manganese ions (Mn); sodium ions (Na); calcium ions (Ca); aluminum ions (Al); iron ions (Fe); effective cation exchange capacity (CEC); base saturation percentage (BS%); effective acidity (EA); aluminum calcium ratio (Al:Ca); ammonium (NH4+-N); nitrate (NO3-N); total nitrogen (TN); soil organic carbon (SOC); carbon nitrogen ratio (C/N ratio); soil pH (pH); and total phosphorus (TP).
Forests 11 01274 g004
Figure 5. Heat map for Pearson’s correlation coefficients of soil acidification, P fractions, and other soil chemical properties in the mono- and mixed cultures at three replications. The P fractions and other chemical properties were identified in each sample by colours deduced from red to blue (−1.0 to +1.0) and the cross indicates not significant differences between parameters. Abbreviations: phosphorus (Pi and Po) fractions (extracted by H2O, NaHCO3, NaOH, and HCl); residual P (Resi P); hydrogen ions (H+); potassium ions (K+); magnesium ions (Mg2+); manganese ions (Mn2+); sodium ions (Na+); calcium ions (Ca2+); aluminum ions (Al3+); iron ions (Fe3+); effective cation exchange capacity (CEC); base saturation percentage (BS%); effective acidity (EA); aluminum calcium ratio (Al:Ca); ammonium (NH4+-N); nitrate (NO3+-N); total nitrogen (TN); soil organic carbon (SOC); carbon nitrogen ratio (C:N ratio); soil pH (pH); and total phosphorus (TP).
Forests 11 01274 g005
Table 1. Summary of the monocultures and mixed cultures of the species analyzed. Stand characteristics given are tree density, mean diameter at breast height (DBH), mean tree height, and soil chemical properties before applying fertilizers.
Forest TypeSpeciesDensity (ha−1)DBH (cm)Height (m)
Mono-CultureWalnut149557.312.0
Mixed-CultureWalnut65067.112.5
Larch73544.813.4
Mono-CultureAsh153563.513.1
Mixed-CultureAsh68564.713.5
Larch74043.312.8
Mono-CultureLarch128581.213.7
Table 2. Summary of soil chemical properties before the application of fertilizers in mono- and mixed (i.e., Walnut*Larch and Ash*Larch) plantations. SOC: soil organic carbon.
Forest TypeSpeciesSoil pHTotal N
(g kg−1)
Total P
(mg kg−1)
SOC
(g kg−1)
C:N
Ratio
MonocultureWalnut5.657.11530.091.412.9
Mixed-CultureWalnut*Larch5.586.21487.7100.216.1
MonocultureAsh5.656.31479.691.714.5
Mixed-CultureAsh*Larch5.616.11465.9100.716.5
MonocultureLarch5.576.21464.590.714.6
Table 3. Two-way ANOVA results of species, fertilizations, and their intercations on the soil chemical properties and P fractions (three replications) of the monoculture (i.e., F mandshurica, J. mandshurica, and L. gmelinii) and mixed culture (i.e., F. mandshurica + L. gmelinii and J. mandshurica + L. gmelinii) at four levels of fertilization (i.e., C: no fertilizer application, N: 20-g N m−2 yr−1, P: 10-g P m−2 yr−1, and NP: 30-g NP m−2 yr−1 N and P fertilizer application) in Northeast China.
Source of VariancedfH+Al3+Fe3+EABS%Al:CaMg2+Ca2+
Species (Spp.)40.546<0.001<0.001<0.0010.0040.2280.9730.183
Fertilization (Fert)30.012<0.001<0.001<0.001<0.001<0.0010.0320.044
Spp.*Fert 121.0000.7200.8530.7700.9550.9311.0000.974
Source of VariancedfNO3-NSOC C:N ratiopHH2O PiNaHCO3 PiNaOH PiNaOH Po
Species (Spp.)40.3940.024<0.0010.7250.028<0.001<0.001<0.001
Fertilization (Fert)3<0.001<0.001<0.001<0.0010.001<0.0010.0090.001
Spp.*Fert 120.7420.9970.9891.0001.0001.0001.0001.000
p-values in the bold indicate significant effects. Abbreviations: hydrogen ion (H+; mmol kg−1), aluminum (Al3+; mmol kg−1), iron (Fe3+; mmol kg−1), effective acidity (EA, mmol kg−1), base saturation (BS;%), aluminum and calcium ratio (Al:Ca), magnesium (Mg2+; mmol kg−1), calcium (Ca2+; mmol kg−1), nitrate (NO3−N; mg kg−1), soil organic carbon (SOC; g kg−1), carbon nitrogen ratio (C:N), soil pH, inorganic P (Pi; mg kg−1), and organic P (Po; mg kg−1). df: dregrees of freedom, Spp.*Fert: Species and Fertilization interaction.
Table 4. Soil chemical properties of the monoculture (i.e., F mandshurica, J. mandshurica, and L. gmelinii) and mixed culture (i.e., F. mandshurica + L. gmelinii and J. mandshurica + L. gmelinii) in three replications at four levels of fertilization (i.e., C: no fertilizer application, N: 20-g N m−2 yr−1, P: 10-g P m−2 yr−1, and NP: 30-g NP m−2 yr−1 N and P fertilizer application) in Northeast China.
Species/
Fertilizer
Mg2+
(mmol kg−1)
Ca2+
(mmol kg−1)
NO3-N
(mg kg−1)
SOC
(g kg−1)
C:N
Ratio
Soil pH
AshC26.9 ± 1.6 a264.8 ± 9.7 a35.2 ± 0.9 a87.1 ± 5.3 a12.1 ± 0.8 a5.6 ± 0.2 a
N23.8 ± 1.9 b243.3 ± 8.4 b66.4 ± 1.4 b 118.9 ± 4.0 b16.2 ± 0.4 b5.2 ± 0.1 b
P26.0 ± 1.0 a254.8 ± 10.3 a34.1 ± 0.8 a89.4 ± 4.3 a12.9 ± 1.1 a5.4 ± 0.3 a
NP25.6 ± 1.6 a252.2 ± 10.9 a38.4 ± 1.6 c104.7 ± 3.4 b14.6 ± 0.8 b5.4 ± 0.1 a
WalnutC27.3 ± 1.8 a247.1 ± 10.3 a35.0 ± 0.9 a84.0 ± 7.7 a13.4 ± 1.2 a5.6 ± 0.5 a
N24.1 ± 1.8 b230.9 ± 17.4 b66.2 ± 1.4 b115.8 ± 4.1 b17.1 ± 0.5 b5.2 ± 0.1 b
P26.3 ± 1.5 a247.6 ± 16.6 a34.1 ± 0.8 a85.1 ± 3.8 a13.9 ± 0.8 a5.7 ± 0.3 a
NP25.7 ± 1.6 a244.7 ± 21.4 a41.8 ± 6.2 c111.2 ± 7.7 b17.7 ± 1.5 b5.6 ± 0.1 a
LarchC26.5 ± 1.6 a292.5 ± 14.3 a35.2 ± 0.9 a87.9 ± 4.8 a11.1 ± 0.7 a5.5 ± 0.2 a
N23.4 ± 1.6 b242.0 ± 16.3 b75.6 ± 1.1 b 119.4 ± 5.7 b14.5 ± 1.1 b 5.1 ± 0.1 b
P25.9 ± 1.0 a275.1 ± 15.4 a34.2 ± 0.8 a87.1 ± 5.1 a11.3 ± 0.7 a5.5 ± 0.2 a
NP25.3 ± 1.0 a263.9 ± 18.3 a48.8 ± 7.1 c101.8 ± 3.0 b13.6 ± 0.3 b5.5 ± 0.2 a
Ash + LarchC26.7 ± 1.4 a266.6 ± 11.0 a45.6 ± 9.3 a95.9 ± 4.9 a13.5 ± 0.9 a5.6 ± 0.2 a
N23.4 ± 2.1 b230.5 ± 10.8 b64.9 ± 1.4 b125.9 ± 7.2 b17.3 ± 1.5 b5.1 ± 0.1 b
P25.8 ± 1.4 a258.1 ± 11.2 a34.0 ± 0.9 a97.3 ± 4.9 a13.6 ± 0.2 a5.6 ± 0.3 a
NP25.1 ± 1.7 a247.9 ± 9.8 a47.0 ± 5.7 c112.6 ± 9.8 b16.0 ± 1.6 b5.5 ± 0.2 a
Walnut + LarchC26.7 ± 0.9 a254.4 ± 10.1 a35.1 ± 1.0 a97.9 ± 4.8 a13.9 ± 0.9 a5.5 ± 0.4 a
N24.9 ± 2.4 b253.1 ± 18.9 b66.1 ± 1.3 b126.6 ± 7.9 b17.5 ± 0.8 b5.2 ± 0.1 b
P25.9 ± 0.8 a271.7 ± 16.4 a34.1 ± 1.0 a98.1 ± 4.4 a14.9 ± 0.9 a5.6 ± 0.3 a
NP25.3 ± 0.9 a247.9 ± 9.8 a45.1 ± 4.7 c113.0 ± 4.7 b16.0 ± 0.8 b5.6 ± 0.3 a
Note: Significant differences between treatments per species are indicated by different lower-case letters (Tukey’s honest significant difference (HSD) post hoc; p < 0.05; mean ± SE). Potassium ions (K+), magnesium ions (Mg2+), calcium ions (Ca2+), nitrate (NO3-N), soil organic carbon (SOC), carbon nitrogen ratio (CN ratio), and soil pH (pH).
Publisher’s Note: MDPI stays neutral with regard to jurisdictional claims in published maps and institutional affiliations.

