


Abstract
The fundamental science question we address in this research concerns the evolution of asteroid families; more specifically, does asteroid (6) Hebe have a genetic family, and does this genetic family provide insight into the structure of (6) Hebe? Hebe has been identified dynamically and spectroscopically as the H-chondrite parent body. The H chondrites exhibit a range of metamorphisms suggesting deep excavation from the parent body, an event expected to form a family. Previously, several small H-type asteroids were identified near Hebe, supporting this possibility, but they were insufficient to test its existence. We initiated a limited spectroscopic investigation of 36 asteroids near Hebe between 2009 and 2018 using the NASA Infrared Telescope Facility's SpeX instrument to test for the presence of a small dynamical family of H-chondrite composition. Of our 36 asteroid spectra, 16 were featureless, 1 contained a single absorption feature, 16 exhibited two absorption features, and 3 were deemed unusable due to poor quality. Our interpretation of asteroid spectra with two absorption features began with the extraction and interpretation of band centers and the band area ratio, which we used to determine the surface mineralogy. In this paper, we report on the nine asteroids that were determined to have an H-chondrite mineralogy. We conclude that asteroids with H-chondrite mineralogies reside on both sides of the 3:1 Kirkwood gap, and this implies that (6) Hebe does have an old-dispersed family, as well as provide spectral evidence for Bottke's hypothesis of resonance jumping.
Export citation and abstract BibTeX RIS
1. Introduction
Researchers have long used meteorites and asteroids to understand nebular processes and history, and to formulate and to constrain models of the early solar system (e.g., Gaffey & McCord 1978, 1979; Barucci et al. 1987; Gomes 1997; Petit et al. 2002; O'Brien et al. 2007; Minton & Malhotra 2008; Minton 2009; Morbidelli 2010; Minton & Malhotra 2011; Davison et al. 2013; see proceedings volumes by Kerridge & Matthews 1988; Lauretta & McSween 2006). Because most of the larger main belt asteroids remain located near their relative heliocentric formation distances, they provide a glimpse of the distribution of inner solar system materials during the formation epoch. (The probable migration of Jupiter and Saturn into their orbital resonance would have swept proper motion resonances across the region of the asteroid belt, expelling objects by the same chaos-related mechanism as today. Only those objects for which orbital perturbations were minimal would have remained (e.g., Franklin et al. 2004; Minton & Malhotra 2009)). With a few exceptions, meteorites represent fragments of main belt asteroids that have escaped into Earth-crossing orbits, many via the chaotic zones associated with the proper motion (e.g., 3:1, 5:2, etc.) and secular (e.g., ν6, ν16, etc.) resonances with Jupiter and/or Saturn (e.g., Wisdom 1985; Morbidelli & Moons 1995; Granvik & Brown 2018). Similarly, most near-Earth asteroids appear to have originated in the main belt and escaped through these same resonances assisted by the Yarkovsky effect.
Clusters of asteroids with similar orbital elements have been identified as asteroid families. Since their initial discovery by Hirayama (1918), asteroid families have commonly been considered as fragments from the collisional breakup of individual parent bodies. Alfvén (1969) suggested that the asteroid "jet streams" might represent an intermediate stage of planetary accretion. Arnold (1969) argued that the asteroid families/jet streams are best explained by collisional breakup, a conclusion almost universally accepted today. Currently, two end-member types of collisionally derived genetic families are recognized: (A) families formed from the collisional breakup and dispersal of a parent body, and (B) families formed by the ejecta from a large impact/cratering event onto a still relatively intact parent body. The Vesta family with its large number of small members would be an example of the second type. Based on our current research findings combined with Marsset et al. (2017) AO imaging of Hebe and crater diameter measurements, we suggest that a Hebe genetic family would also be such a cratering-derived family.
Farinella et al. (1992) drew attention to the distinction between asteroid dynamical families identified based on their similar orbital elements and asteroid genetic families derived from a parent-body breakup. To be considered a genetic family, the members of a dynamical family must be shown to be compositionally compatible with a common parent body. To explore the orbital evolution of dynamical families, genetic criteria can be used. The Vesta family provides a clear example. The spectrally distinctive basaltic achondrite (HED) type surface assemblage of Vesta is unique among the larger asteroids. Based on this diagnostic spectral signature, Binzel & Xu (1993) identified a number of small V-type "vestoids" near Vesta, which they identified as the Vesta genetic family. Florczak et al. (2002) identified a number of small V-type asteroids near Vesta but outside the dynamical family. Based on the uniquely diagnostic spectra, Nesvorný et al. (2008) described these objects as "fugitives from the Vesta family" and modeled the dynamical mechanisms, which could disperse a dynamical family.
Additionally, the criteria (especially the threshold for membership in a dynamical family) might be set too high. Imagine a hilly terrain where you are trying to determine the surface area of a set of hills. To accomplish this, you need to set a base level for the hills. If the base level is too high, you will underestimate the area. If the base level is too low, you will include lowland areas. Similarly, thresholds must be set for the clustering algorithms used to identify membership in asteroid families. Thus, genetic families may extend over larger regions of orbital element space as the initial dynamical families disperse with time.
Historically, taxonomy has been used to test the potential genetic nature of dynamical families and to identify potential interlopers within dynamical families. For example, Gradie & Zellner (1977) were able to show that the limited range of colors for the asteroid families associated with asteroids (44) Nysa, (158) Koronis, and (221) Eos supported the interpretation that these were genetic families. A number of investigators (e.g., Bell 1989; Chapman et al. 1989; Carvano et al. 2001; Cellino et al. 2001; Mothé-Diniz et al. 2005) have used taxonomic classifications to test family memberships. Using taxonomy as a tool to derive or imply mineralogy and to test genetic relationships is fraught with ambiguity, both because most asteroid taxonomies are not based on compositionally diagnostic criteria (e.g., Gaffey et al. 2002), and because the diversity of asteroid space weathering processes introduces an unconstrained variable into the taxonomic classification process (e.g., Gaffey 2010). Most current asteroid taxonomies are based on CCD spectral data with limited wavelength coverage, typically ∼0.4–1.0 μm, which lacks the near-infrared spectral coverage (e.g., to ∼2.5 μm) normally required to establish the mineralogical nature of an asteroid.
Other investigators have used a spectral-curve-matching approach and CCD spectra (∼0.4–1.0 μm) to test family memberships or compositional patterns (e.g., Di Martino et al. 1997; Florczak et al. 1998; Carvano et al. 2001; Cellino et al. 2001, 2002; Mothé-Diniz et al. 2005; DeMeo & Carry 2014). Direct comparison of CCD spectra between members of a putative family is suggestive, but not definitive. It is likely to identify interlopers with significantly different compositions from the members of a genetic family. However, the limited spectral coverage of CCD data does not allow the actual mineralogical characterizations needed to assess potential genetic relationships. For example, two S-type spectra may have nearly identical CCD spectra, but show significant mineralogical (genetic) differences when a full ∼0.4–2.5 μm spectrum is analyzed.
To date, very few robust genetic studies of asteroid families have been conducted. Using Wide-field Infrared Survey Explorer data combined with archived spectra, Walsh et al. (2013) initially made a distinction within the Nysa–Polana complex of asteroids and further separated these asteroids into a new Polana family and a new Eulalia family. However, a more robust near-infrared spectroscopic investigation was orchestrated by Pinilla-Alonso et al. (2016) and showed that NIR spectroscopy cannot distinguish between the Eulalia and Polana families because their spectra are featureless. Fieber-Beyer et al. (2011) explored the genetic relationships of Maria asteroid family members over the 0.4–2.5 μm spectral interval using parametric analysis, which showed that Maria dynamical family members had surficial mineralogies consistent with mesosiderite silicates, and concluded that indeed the family members were genetically related. In addition, the Fieber-Beyer et al. (2011) study revealed the presence of an interloper of H-chondrite mineralogy. Furthermore, the Vestoids near Vesta, but outside the dynamical family, have been shown to be genetically related to Vesta (e.g., Binzel & Xu 1993; Hardersen et al. 2014, 2015), which indicates dispersion and dynamical evolution of Vesta's offspring (e.g., Marchi et al. 2012; Ieva et al. 2016).
Our goal is to better understand the origin of the H chondrites, the second most common meteorite type falling to Earth. Focusing on asteroids identified as strong meteorite sources based on dynamical criteria (Farinella et al. 1993a, 1993b; Morbidelli & Moons 1995) led to the identification of asteroid (6) Hebe, located near the intersection of the 3:1 and ν6 resonances, as the probable parent body of an abundant meteorite type (∼1/4–1/2 of the meteoroids reaching Earth). The H chondrites constitute ∼34% of meteorite falls. Based on spectral data, Gaffey & Gilbert (1998) identified Hebe as an H-type chondrite. (Based on isotopic and chemical criteria, meteorite investigators have concluded that the ordinary chondrite (OC) groups (the abundant H, L, and LL, and the rarer HH, H/L, and L/LL types) each derive from a single original parent body.) The Portales Valley meteorite (Kring et al. 1999; Rubin et al. 2001; Ruzicka et al. 2005) and subsequent dynamical analysis (Bottke et al. 2010) strengthened this conclusion. Furthermore, the Pribram (H5) meteorite fall's preterrestrial orbital elements are consistent with delivery via the ν6 secular resonance (Ceplecha 1977; Thomas & Binzel 2010), the Annama (H5) meteorite's orbital elements are consistent with delivery via the 3:1 Kirkwood gap (Trigo-Rodríguez et al. 2015) as well as the recent near-Earth asteroid identifications of H-chondrite assemblages that have been proposed as possible (6) Hebe fragments (Fieber-Beyer et al. 2011, 2015; Gaffey & Fieber-Beyer 2013; Kelley et al. 2014; Vernazza et al. 2014), indicating that additional small H-chondrite-type asteroids are delivered from this dynamical region. However, we would like to note that meteorites are not perfect compositional samples of their parent bodies (e.g., Goodrich et al. 2015 estimated that 99.9% of the mass of 2008 TC3 was lost during atmospheric entry). Therefore, it is not probable to perfectly match spectra of a meteorite and asteroid, which is why parametric analysis is necessary to identify surface mineral compositions.
For the past several years, spectral investigations of additional asteroids adjacent to the 3:1 mean-motion resonance have been conducted with the goal of identifying possible meteorite parent bodies (Fieber-Beyer 2010; Fieber-Beyer & Gaffey 2011, 2014, 2015; Fieber-Beyer et al. 2011, 2012). During this time, a small number of asteroids with semimajor axes near Hebe have been identified with H-chondrite-type spectra and mineralogies. However, they are located on the opposite side of the 3:1 Kirkwood gap from Hebe. These four asteroids were proposed to be a part of an old, small Hebe genetic family (Fieber-Beyer et al. 2011; Gaffey & Fieber-Beyer 2013). Dynamics show that after a collisional event produces fragments, fragments are influenced by secular resonances, mean-motion resonances, and Yarkovsky/YORP effects (Bottke et al. 2001; Brasil et al. 2016; Wiegert 2015), which can spread them in proper element space and inclination and/or frequency domain such that members may be neighbors in proper element space, but not in frequency domain and vice versa (Carruba & Michtchenko 2007, 2009; Michtchenko et al. 2010). Carruba & Michtchenko (2007) examined the Vesta, Eunomia, Eos, and Koronis families using frequency domains and found members on the periphery that most likely drifted due to Yarkovsky forces (this study has not been done in the Hebe region). Numerical simulations by Bottke et al. (2000) show Hebe fragments would have a high drift rate and that meteoroids can jump the resonance (e.g., Figures 14, 15, and 16 in Bottke et al. 2000, which show explicitly how asteroids can jump inward or outward in semimajor axis to cross a resonance).
If this small group is part of a Hebe genetic family, then logic implies that there should be Hebe-derived objects nearer Hebe itself, which is the focus of our research effort. If this hypothesis cannot be verified and there are no H-chondrite bodies near Hebe on the short side of the gap, then the alternate scenario would suggest that the asteroids located on the far side of the gap condensed from the same nebular compositional reservoir, inferring multiple H-chondrite parent bodies (e.g., Vernazza et al. 2014)—a conclusion that is at odds with the meteorite isotope data, which point to a single H-chondrite parent body (T. J. McCoy 2010, private communication; Henke et al. 2012). Vernazza et al. (2014) and a number of other investigators have concluded that most or all of the S-type asteroids are undifferentiated OC (or OC-like) assemblages and furthermore that H-chondrite compositions are common in this population as reflected by the high abundance of H chondrites among meteorite falls. Four lines of evidence support the "one H-chondrite parent-body" model. Noonan et al. (2019) accept the "one or maybe a few" H-chondrite parent-body model, but argue that the lack of an associated family rules out Hebe as that parent body. The current work addresses the family issue.
(1) As noted above, the isotopic as well as the measured petrographic and mineralogical properties of the H chondrites do not require or favor multiple source bodies unless they are identical in those properties, a situation considered very unlikely by meteorite investigators.
(2) Approximately 135 chemically distinct parent bodies are represented in our terrestrial meteorite collections (e.g., Keil 2000). There are significant implications for the heterogeneity of the solar nebula, a situation initially emphasized by the oxygen isotopes in meteorites (e.g., Clayton 1993, 2003). The diversity of parent bodies requires that at the times and places where those meteorite parent bodies formed, the solar nebula was divided spatially and/or temporally into at least ∼135 chemically distinct regions. To have an overall OC (or a large H-chondrite) theme while still manifesting the balkanization of the solar nebula would seem to be an insurmountable contradiction.
(3) The cosmic-ray exposure ages of H chondrites span from <1 to ∼80 Myr, but exhibit a distinct peak near 7 Myr, which includes nearly half of the H chondrites, and an earlier smaller cluster at ∼33 Myr. These clusters of ages are attributed to single events that ejected large volumes of material from the H-chondrite parent body (e.g., Graf & Marti 1995; Graf et al. 2001; Eugster 2003; Herzog 2003). In addition to a plethora of meter-scale meteoroids, these events may have ejected larger fragments, producing a temporary family of multikilometer objects. The CRE peaks and the chemical and isotopic constraints that the H chondrites (meteorite collections include more than 6900 H-chondrite samples among the ∼22,500 cataloged meteorites—British Museum Catalog of Meteorites, 5th ed.) come from a single parent body would seem to preclude any significant contributions from a second original parent body, unless the second to Nth H-chondrite bodies do not contribute to the meteorite flux. In that case, any H-chondrite family would most probably derive from that same parent body.
(4) The CRE ages of the most common meteorite type (L chondrites ∼37% of meteorite falls) show a much broader age distribution or a number of poorly resolved abundance peaks consistent with a number of source bodies. However, about two-thirds of the L chondrites exhibit shock ages that cluster around 370 Myr (e.g., Nesvorný et al. 2009), implying that most of them come from a single impact event on a single parent body. The wide range of shock intensities recorded in the shocked L chondrites from mildly shocked to extensively shock-melted (e.g., the L6 chondrite Chico—Bogard et al. 1995) is consistent with the unshocked L chondrites being derived from the same impact event on a single parent body. The ∼470 Myr event is commonly interpreted as the collisional disruption of the L-chondrite parent body producing an asteroid family. The large number of fossil L chondrites from mid-Ordovician terrestrial rock units strengthens this conclusion. Heck et al. (2016, 2017) documented a ∼100-fold increase in the flux of L chondrites after the shock event compared to before the shock event. This is strong evidence for a single original L-chondrite parent body, a conclusion that supports the plausibility of a single parent body for the H chondrites as well. The lack of a peak in the CRE ages of L chondrites would be expected if the impact event shattered the parent body into a number of fragments, each potentially contributing to the L-chondrite flux. Additionally, terrestrial sediments from a relatively narrow period show abundant L-chondrite dust consistent with a unique event on a single body.
The use of diagnostic spectral parameters can robustly identify H-type assemblages ("Yes") even in the presence of space weathering (e.g., Gaffey 2010). The spectral effects of metamorphism do not mimic the spectral difference between different OC types, nor are the spectral changes associated with partial or complete differentiation consistent with the identification of H-chondrite assemblages.
Based on the initial H-chondrite interpretation of 695 Bella (Fieber-Beyer et al. 2011), we are left with a lagging question: does asteroid (6) Hebe have a genetic family, and does this genetic family provide insight into the structure of (6) Hebe? The H chondrites exhibit a range of metamorphism suggesting deep excavation from the parent body, an event expected to form a family. We conducted a limited spectroscopic investigation of 36 asteroids in the dynamical region near Hebe to test for the presence of a small genetic family of H-chondrite composition. The detection or nondetection of such a family would place constraints on the formation of impact-generated families by providing data to the modeling community to test orbital diffusion models in regions proximate to resonances, as well as providing an explanation for the diverse thermal histories of the H chondrites. Our research effort also provides a strong test of spectroscopic and dynamical predictions regarding asteroid family identification.
The internal structure of the H-chondrite parent body may be reflected in the distribution of metamorphic types (e.g., H3–H6) within an H-chondrite family. It is broadly accepted that heating of the OC parent bodies by a short-lived heat source (commonly believed to be the radioactive decay of 26Al) produced an "onion shell" model with maximum temperature (and slowest cooling) in the deep interior with progressively lower peak temperatures (and faster cooling rates) nearer to the surface. In this model, higher metamorphic grade H-chondrite should exhibit slower cooling rates. A number of geochronometers applied to minerals in a sample of H chondrites have agreed with the predictions of the onion shell model (e.g., Trieloff et al. 2003; Kleine et al. 2008). However, this picture is complicated by the inverse correlation between metamorphic grade and cooling rates from the NiFe phases in H chondrites. This suggests a deep insulating regolith or an early collisional breakup and reassembly of the H-chondrite parent body (e.g., Keil et al. 1995; Lucas et al. 2019; also see Figure 3.16 in McSween 1999 and review by Taylor 2008).
With a single parent body for the H chondrites, the structure of the parent body must serve to provide the range of H-chondrite metamorphic types. This implies that any H-chondrite asteroid family should exhibit a similar range of metamorphic grades. For an "intact onion" parent body, this constrains the size and depth of the family-forming crater (e.g., Taylor 2008). For a rubble pile, the distribution of metamorphic types across the surface (e.g., McSween 1999) allows a number of smaller impacts to contribute to a family.
2. Observations/Data Reduction
We obtained near-infrared spectral observations of 36 asteroids near the ν6 secular resonance and 3:1 Kirkwood gap between 2009 and 2018. We used the NASA Infrared Telescope Facility (IRTF) SpeX instrument in the low-resolution spectrographic "prism" mode (Rayner et al. 2003) located at Maunakea Observatory, Hawai'i. The observational parameters are listed in Table 1. Physical properties and orbital elements are listed in Tables 2. We report in Table 1 and 2 the nine bodies identified as H-chondritic from our study; the remaining 27 bodies will be detailed in a forthcoming paper.
Table 1. Observational Properties
| Object | Date | Univ. Time | R.A.a | Decl.a | r (au)a | Δ (au)a | φ (°)a | Vmaga |
|---|---|---|---|---|---|---|---|---|
| (6) Hebe | 12/13/15 | 13:02–13:25 | 12 08 16.6 | +04 54 36.0 | 2.76 | 2.74 | 20.59 | 11.11 |
| (115) Thyra | 12/13/15 | 09:53–10:19 | 09 08 30.1 | +22 08 03.5 | 2.12 | 1.37 | 21.55 | 11.01 |
| (518) Halawe | 07/21/16 | 12:22–13:09 | 01 15 45.2 | +12 47 32.4 | 2.00 | 1.61 | 30.22 | 14.86 |
| (695) Bella | 05/25/09 | 10:26–11:10 | 15 51 53.0 | −32 45 54.1 | 2.63 | 1.64 | 04.69 | 12.89 |
| (1166) Sakuntala | 06/03/11 | 10:53–11:44 | 18 44 10.5 | −11 01 31.3 | 2.06 | 1.12 | 29.40 | 14.91 |
| (1607) Mavis | 06/03/11 | 11:57–13:24 | 21 48 20.9 | −11 57 22.8 | 2.03 | 1.47 | 28.60 | 15.24 |
| (2038) Bistro | 01/03/16 | 09:04–09:59 | 06 34 12.5 | +33 33 50.5 | 2.64 | 1.67 | 04.24 | 15.49 |
| (5129) Groom | 12/14/17 | 14:27–15:24 | 10 06 38.4 | +02 13 40.6 | 2.20 | 1.66 | 24.49 | 16.68 |
| (19727) Allen | 01/03/16 | 11:14–11:53 | 06 52 18.1 | +12 00 21.1 | 2.55 | 1.57 | 04.17 | 16.59 |
Note.
aObservational properties were obtained from JPL Horizons.Download table as: ASCIITypeset image
Table 2. Physical Properties
| Object | a(au)a | ea | i(°)a | r(km)a | albedoa | D (km)b,c |
|---|---|---|---|---|---|---|
| (6) Hebe | 2.425 | 0.201 | 14.77 | 92.59 | 0.267 | 193.0 |
| (115) Thyra | 2.379 | 0.191 | 11.60 | 39.91 | 0.274 | 55.139 |
| (518) Halawe | 2.533 | 0.225 | 06.73 | 08.08 | 0.246 | 16.157 |
| (695) Bella | 2.541 | 0.159 | 13.85 | 48.18 | 0.145 | 40.620 |
| (1166) Sakuntala | 2.538 | 0.206 | 18.89 | 13.05 | 0.286 | 26.011 |
| (1607) Mavis | 2.550 | 0.305 | 08.57 | 06.37 | 0.193 | 12.756 |
| (2038) Bistro | 2.436 | 0.091 | 14.80 | 05.47 | 0.168 | 12.580 |
| (5129) Groom | 2.379 | 0.865 | 10.36 | 03.73 | 0.346 | 7.477 |
| (19727) Allen | 2.434 | 0.187 | 13.36 | 02.97 | 0.262 | 13.2 |
Notes.
aPhysical properties were obtained from JPL Horizons. bNEOWISE diameters retrieved from JPL Horizons. cHebe diameter was obtained from Marsset et al. (2017).Download table as: ASCIITypeset image
We followed our normal observing procedure, which intersperses asteroid and local standard star observations within the same airmass range. We performed the spectral extraction, wavelength calibration, and data reduction using procedures outlined by Clark (1980), Reddy et al. (2009), and Fieber-Beyer (2010). We discarded the first spectrum of each set due to image persistence on the detector chip, and the remaining individual raw flux spectra were corrected to a standard pixel array to compensate for the subpixel shifts of the dispersed spectrum on the array detector (e.g., Gaffey et al. 2002).
We utilized two software packages for data reduction and analysis: (1) the IDL-based spectral reduction program to reduce SpeX cross-dispersed and prism data, spextool (Cushing et al. 2014), and (2) SpecPR, a Windows-based program for reduction and analysis of spectra stored in one-dimensional arrays (Clark 1980; Gaffey et al. 2002). The raw spectra were in the form of Flexible Image Transport System (FITS) images. We used spextool to extract spectra from the FITS images and to determine the wavelength calibration. The SpecPR software package processes the extracted spectra to produce final calibrated spectra. Important operations of SpecPR include (1) channel shifting to account for instrumental flexure, (2) calculation of atmospheric extinction coefficients (starpacks) from the local standard star observations, (3) division of individual asteroid flux spectra by the relevant starpack, (4) division of the asteroid/local standard star ratio by the solar calibration star/local standard star ratio to produce an asteroid/"Sun" ratio or reflectance spectrum, and (5) isolation and analysis of diagnostic spectral features.
To produce the starpacks, we empirically modeled the atmospheric extinction for each asteroid observation (which becomes pertinent when faced with deteriorating sky conditions). We use the local standard star to derive the extinction coefficients from the variation in flux versus airmass for each channel in the spectrum. We then computed starpacks for various permutations of the standard star observations (e.g., all standard star sets, sets that bracketed individual sets of asteroid observations, etc.) and divided the asteroid flux curve by the starpack that most effectively removed the telluric features from the spectrum. We averaged the individual spectra, deleting individual points that deviated by more than two standard deviations from the mean. Each individual asteroid's average reflectance spectrum was then divided by an average of the ratio of the local standard star to the solar analog to make a final correction for any nonsolar spectral properties of the local standard star.
3. Analysis
We began our analysis of the 36 calibrated spectra visually. If a spectrum was featureless, we assigned it a "NO" and did not analyze it further. If a spectrum contained a single absorption feature, we assigned it a "NO" and did not analyze it further. If a spectrum exhibited two absorption features (1 and 2 μm), it was assigned a "MAYBE" and a parametric analysis followed. Of our 36 asteroid spectra: 16 were featureless, 1 contained a single absorption feature, 16 exhibited 2 absorption features, and 3 were deemed unusable due to poor quality. Our interpretation of asteroid spectra with two absorption features began with the extraction and interpretation of diagnostic spectral parameters (band centers and band area ratio (BAR)—Figure 1), which we used to determine the surface mineralogy.

Figure 1. Spectral parameter plot. The mineralogical interpretation of asteroid spectra involves the extraction and interpretation of diagnostic spectral parameters, band centers, and band area ratios, which we use to determine the minerals, present on the asteroid surface.
Download figure:
Standard image High-resolution imageIn order to ascertain whether an asteroid was likely an H-type candidate or not, the 16 asteroids with 2 absorption features were plotted on the Band I versus BAR graph, and on the Band I versus Band II pyroxene trendline graph. In order to be considered an OC analog (and to apply the Dunn et al. 2010 calibration), the object under investigation must plot within the OC subtype region of the S-asteroid Band I versus BAR plot (Figure 2(A)) and fall within an OC zone of the Band I versus Band II pyroxene trendline (Figure 2(B); Adams 1974; Cloutis et al. 1986; Cloutis & Gaffey 1991). If an asteroid failed to meet these first two criteria, they were removed from each plot and excluded from further analysis. Figures 3 and 4 show the asteroids that "made the H-chondrite cut."

Figure 2. (A) The BAR value for ol-opx assemblages is proportional to the abundance of orthopyroxene in the mixture (Cloutis et al. 1986). The resulting parameter space is subdivided into mineralogically distinct regions as derived by Gaffey et al. (1993). (B) Assemblages in which pyroxene is the sole or predominant spectral contributor fall along a trend with Fe2+ and Ca2+ content of the pyroxenes increasing from the lower left to the upper right. If olivine is present in orthopyroxene-bearing assemblages, the center of Band I is displaced toward longer wavelength while the Band II center is unchanged.
Download figure:
Standard image High-resolution image
Figure 3. S-Asteroid subtype plot, as derived by Gaffey et al. (1993). We plotted the Band I center value with the BAR value to determine which meteorite region was predominant. Shown here are the nine asteroids that plot within/along the S (IV) region. The toe of the boot is where the H-chondrite meteorites cluster.
Download figure:
Standard image High-resolution image
Figure 4. Band I vs. Band II plot (Adams 1974; Cloutis & Gaffey 1991). The graph clearly shows two vertical clusters with Band I centers at 0.92 and 0.93 μm. However, we see some dispersion along the horizontal axis. (6) Hebe, (115) Thyra, (518) Halawe, (695) Bella, (1166) Sakuntala, and (1607) Mavis all plot in the center of the H-chondrite zone. The asteroids (2038) Bistro, (5129) Groom, and (19727) Allen lie along the outer edge of the H-chondrite zone, and when including the uncertainties in error, all fall within the H-chondrite zone.
Download figure:
Standard image High-resolution imageFor the nine objects that satisfied the aforementioned criteria, we applied Equation (7) from Dunn et al. (2010) to calculate the iron-rich end-member ferrosilite (Fs) chemistry of the pyroxene. The Band I center in pyroxenes is primarily a strong function of the iron (Fs) content of the pyroxene (e.g., Adams 1974) while the Band I center in olivine is a weak function of the iron-rich end-member fayalite (Fa; e.g., King & Ridley 1987). In OCs, there is a strong correlation between the Fa and Fs, and this correlation allows Fa to be inferred from the measured Fs values. (Figures 5–7) One needs to be mindful of a degree of circularity in this procedure. The calibration was based on the spectral parameters of OCs. Thus, in applying this calibration, one effectively assumes that the assemblage is an OC. It is important to be aware of and sensitive to the possible (yet poorly defined) functional relationship.

Figure 5. Plot of Fa vs. Fs values of the H-, L-, and LL-type ordinary chondrites (Figure 2(A) from Nakamura et al. 2011). Our asteroids: (6) Hebe, (115) Thyra, (518) Halawe, (695) Bella, (1166) Sakuntala, (1607) Mavis (black circle), and (2038) Bistro, (5129) Groom, (19727) Allen (black square) plot in two regions that lie exactly on the trendline in the middle of the H-chondrite zone (red circles).
Download figure:
Standard image High-resolution image
Figure 6. Plot of Fa vs. Band I center and Fs vs. Band I center using derived band centers and Fa and Fs values (Figures 3(a) and 4(a) of Dunn et al. 2010) of our nine bodies that plotted within the toe of the boot of Figure 3 (this paper). Because the Band I centers were either 0.92 or 0.93 μm, and because the Dunn et al. (2010) chemistries only rely on the Band I center to infer the mineralogy, our points cluster in two spots on the graph. These bodies plot along the trendline in the H-chondrite region (black square and black circle) on both plots.
Download figure:
Standard image High-resolution image
Figure 7. Plot of Band II center vs. spectrally derived [ol/(ol + opx)] (background data courtesy Tasha Dunn, unpublished). We can clearly see all nine asteroids plot within the H-chondrite region.
Download figure:
Standard image High-resolution imageAssuming that these are OC assemblages as allowed by the S (IV) classification, and using the correlation between the Fs and Fa compositions of OC pyroxenes implicit in the Dunn et al. (2010) calibration, olivine compositions were inferred. Table 3 lists the extracted/derived values. Using our measured BAR values, the Burbine et al. (2003) ol/(ol + opx) equation was used to calculate the percentage of olivine present on each asteroid's surface (Figure 8). In the analyses, we utilized all of the appropriate calibrations to best constrain mineral compositions and abundances.
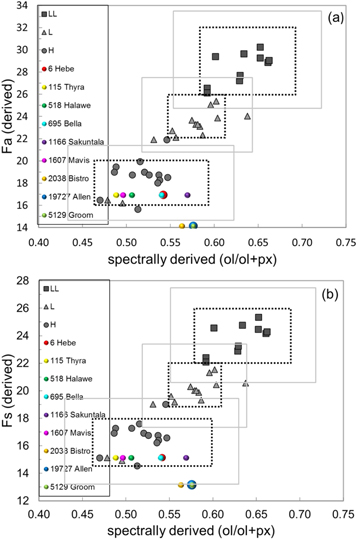
Figure 8. Plot of Fa vs. spectrally derived [ol/(ol + opx)] and Fs vs. spectrally derived [ol/(ol + opx)] (Figures 5(b) and 6(b) of Dunn et al. 2010). The asteroids (colored circles) plot either within or just outside of the designated H-chondrite box. According to Dunn et al. (2010), "dashed boxes represent the range of XRD-measured ol/(ol + px) and the range of measured Fa contents in ordinary chondrites (Brearley et al. 1998 and references therein). The solid boxes include the least square root mean of the errors on these spectrally derived values (0.03 for ol/(ol + px), 1.3 mol% for Fa, and 1.4 mol% for Fs)."
Download figure:
Standard image High-resolution imageTable 3. Band Parameters
| Object | Band I (μm) | Tcorr (μm) | Band II (μm) | Tcorr(μm) | BAR | Tcorr | ol/(ol+opx)a | Fab | Fsb |
|---|---|---|---|---|---|---|---|---|---|
| (6) Hebe | 0.93 ± 0.02 | 0.004 | 1.94 ± 0.03 | 0.03 | 0.99 ± 0.10 | −0.11 | 0.542 | 16.93±1.3 | 15.12±1.4 |
| (115) Thyra | 0.93 ± 0.01 | 0.004 | 1.89 ± 0.01 | 0.02 | 1.23 ± 0.15 | −0.09 | 0.488 | 16.93±1.3 | 15.12±1.4 |
| (518) Halawe | 0.93 ± 0.01 | 0.002 | 1.90 ± 0.02 | 0.02 | 1.15 ± 0.15 | −0.09 | 0.506 | 16.93±1.3 | 15.12±1.4 |
| (695) Bella | 0.93 ± 0.01 | 0.004 | 1.92 ± 0.04 | 0.03 | 1.00 ± 0.20 | −0.10 | 0.540 | 16.93±1.3 | 15.12±1.4 |
| (1166) Sakuntala | 0.93 ± 0.01 | 0.004 | 1.93 ± 0.03 | 0.02 | 0.87 ± 0.05 | −0.09 | 0.569 | 16.93±1.3 | 15.12±1.4 |
| (1607) Mavis | 0.93 ± 0.01 | 0.004 | 1.95 ± 0.01 | 0.02 | 1.19 ± 0.08 | −0.09 | 0.496 | 16.93±1.3 | 15.12±1.4 |
| (2038) Bistro | 0.92 ± 0.02 | 0.004 | 1.88 ± 0.03 | 0.03 | 0.90 ± 0.23 | −0.10 | 0.563 | 14.14±1.3 | 13.14±1.4 |
| (5129) Groom | 0.92 ± 0.02 | 0.004 | 1.93 ± 0.07 | 0.02 | 0.84 ± 0.30 | −0.09 | 0.576 | 14.14±1.3 | 13.14±1.4 |
| (19727) Allen | 0.92 ± 0.02 | 0.004 | 1.92 ± 0.05 | 0.03 | 0.84 ± 0.40 | −0.11 | 0.576 | 14.14±1.3 | 13.14±1.4 |
Notes.
aol/(ol + opx) values were calculated using Burbine et al. (2003). bFa and Fs values were calculated using Dunn et al. (2010).Download table as: ASCIITypeset image
Temperature affects the band center positions of mafic minerals such as pyroxene (e.g., Roush 1984; Roush & Singer 1986; Lucey et al. 1998; Moroz et al. 2000; Hinrichs & Lucey 2002; Sunshine et al. 2007; Reddy et al. 2011). Dunn et al. (2010) based their calibration on laboratory spectra of OCs measured at room temperature (∼290 K). The surface temperature of our targets were calculated using the formula from Burbine et al. (2009):

where A is the asteroid albedo, Lo is the solar luminosity (3.846 × 1026 W), η is the beaming factor (assumed to be 1.0), ε is the asteroid's infrared emissivity (assumed to be 0.9), σ is the Stefan–Boltzmann constant, and r is the asteroid's distance from the Sun in meters. (The values of the parameters η and ε are from the standard thermal model (STM; Lebofsky et al. 1986)). The temperature for each asteroid surface was compared to the laboratory calibration samples to check if a shift in the Band positions using the calibration for orthopyroxenes by Sanchez et al. (2012) for OCs is necessary for each object. The calculated Band I center shifts are in the 0.002–0.004 μm range. We did not make any corrections to the Band I center because these shifts are significantly smaller than the uncertainties for the Band I centers. We calculated the BAR shifts in the 0.08–0.11 range. Because these shifts are either smaller than or equal to the uncertainties for the BARs, no corrections were applied to the BAR values. However, Band II centers were affected by temperature, and the values reported in Table 3 are temperature-corrected values.
4. Discussion
We sought to try to answer two questions: (1) does (6) Hebe have a small, dispersed genetic family, and if so, (2) does this genetic family provide insight into the structure of (6) Hebe?
The results of our study do seem to confirm the existence of a Hebe-derived family. When we map the family's distribution around Hebe, the distribution reflects both the initial dispersion of ejecta fragments and the subsequent orbital evolution (Figure 9). Based on the cosmic-ray exposure ages of the H chondrites (e.g., Graf & Marti 1995; Eugster 2003), which exhibit a strong peak (nearly half of the H chondrites) due to an ejection event at ∼7 Myr and an earlier event at the ejection event at ∼33 Myr, the probable formation times of a Hebe family can be used to constrain the subsequent orbital evolution.

Figure 9. Plot of asteroids from 2.37 to 2.56 au. We have labeled the neighboring resonances. There are five asteroids with H-chondrite mineralogy located on the short side of the chaotic zone of the 3:1 Kirkwood gap (Hebe is the red circle). There are four asteroids located on the long side of the 3:1 Kirkwood gap.
Download figure:
Standard image High-resolution image
Based on AO imaging of Hebe using SPHERE at ESO VLT, Marsset et al. (2017) concluded that the largest impact crater appears smaller than the volume of nearby S-type H-chondrite-like asteroid families. However, it should be noted that our study did not look at nearby families, but instead focused on individual asteroids in/near the 3:1 Kirkwood gap and ν6 resonance because we hypothesized in Gaffey & Fieber-Beyer (2013) that if a Hebe family exists, then it would be dispersed among the background population.
The Marsset et al. (2017) conclusion assumes that the single largest impact crater would account for a body that is ∼58 km. Our findings do show that (115) Thyra fits this description at 55 km very well (see Table 2). However, we closely examined Figure 3 in their paper and found that Hebe looks like a lopped-off tooth such that a significant portion of the asteroid is missing. We suggest that this chunk of Hebe was likely disrupted and expelled into space, leaving behind this flattened face of Hebe. The objects in the proposed family would represent a small fraction of the lost mass, but would probably sample all the metamorphic types. Although such an event would probably predate any of the cosmic-ray exposure ages of meter-scale meteoroids that have dropped H chondrites, impacts onto two of the family members could be the sources of the 7 and 33 Myr pulses of H chondrites.
Furthermore, their results show that there are five impact craters on the surface of Hebe, and we suggest that the events that caused these basins spewed fragments into space, potentially contributing to the Hebe family presented in this paper. In that case, two of these craters could have been the sources of 7 and 33 Myr H-chondrite pulses. If Hebe is a rubble pile, each of these smaller impacts could contribute to the diversity of metamorphic types with the family and among the H chondrites.
Using the Marsset et al. (2017) maximum crater basin value, we calculated the volume of ejected material using equations from Scott (2013), and then translated that value into a representative asteroid radius using [(Ve∗3)/(4π)]1/3 = r, and then multiplied r by 2 to yield the diameter. Table 4 clearly shows that these five craters yielded asteroidal material ranging from 25 to 57 km. Of our identified Hebe family members (eight excluding Hebe), their diameters range from 7 to 55 km. Only two are on the larger side ((115) Thyra = 55 km and (695) Bella = 40 km), and these two asteroids could themselves be derived from two of the largest crater basins while the remaining asteroids have diameters less than 26 km, with the majority being in the 12–16 km range. Therefore, when these data are combined with the spectral data, it is highly probable that these bodies are Hebe ejecta.
Table 4. Ejecta and Equivalent Body Calculations
| Crater Diameter Range (km)a | Max Volume Ejected (km3)b | Body with Equivalent Diameter (km)c | |
|---|---|---|---|
| Basin 1 | 92–105 | 55010 | 47 |
| Basin 2 | 85–117 | 74693 | 52 |
| Basin 3 | 68–83 | 28301 | 37 |
| Basin 4 | 75–127 | 94180 | 56 |
| Basin 5 | 42–53 | 7965 | 24 |
Notes.
aCrater diameter range from Marsset et al. (2017). bVolume ejected derived from the equation in Scott (2013). cBody with equivalent diameter calculated from this work.Download table as: ASCIITypeset image
Our study has now have definitively proven that asteroids with H-chondrite mineralogies reside on both sides of the 3:1 Kirkwood gap. This implies that (6) Hebe does, in fact, have an old-dispersed family, as well as provides spectral evidence for the Bottke et al. (2000) hypothesis of resonance jumping.
Lastly, we would like to note that our study only observed a small fraction of small bodies near Hebe (35). A deeper probe that expands the scope of the perimeter space would likely reveal a larger presence of disbursed H-chondrite-like bodies in this region.
This material is based upon work supported by the National Science Foundation under grant No. 1737448 (SFB). We thank the IRTF TAC for awarding time to this project, and to the IRTF TOs and MKSS staff for their support.
We extend our deepest appreciation to T. Dunn and an anonymous reviewer for their timely and thoughtful feedback that ultimately improved our work.
A special thank you is extended to Paul Hardersen and Rachel Roberts for their assistance early in the effort of spectra acquisition when I was too ill to conduct the observations myself.