
Abstract
The advent of high temperatures superconductors (HTS) will enable the development of compact fusion reactors capable of delivering large quantities of low carbon energy. However, the inside of a fusion reactor is a hostile environment and bombardment by high energy neutrons will alter the microstructure of constituent materials, including the HTS in the magnets. Key to understanding the evolution of a material's microstructure when subjected to neutron irradiation is knowledge of the defect population in the starting material. Therefore, this work uses density functional theory (DFT) simulations, combined with simple thermodynamics, to create a point defect model that enables prediction of the types and concentrations of defects present in a model HTS, YBa2Cu3O7, under a range of fabrication conditions. The simulations predict that the defect chemistry of YBa2Cu3O7 is dominated by oxygen defects, predominantly vacancies, in agreement with prior experimental observations. Interestingly, the simulations predict that the exchange of Y and Ba atoms is the second lowest energy defect process in YBa2Cu3O7 after the oxygen Frenkel process. Furthermore, the point defect model shows that any cation non-stoichiometry will also be accommodated via antiste defects rather than either vacancies or interstitials. Overall, these results suggest that future fusion magnets will contain a high concentration of oxygen and cation antisite defects and that these must be considered in future studies of the evolution of HTS materials under irradiation.
Export citation and abstract BibTeX RIS

Original content from this work may be used under the terms of the Creative Commons Attribution 4.0 licence. Any further distribution of this work must maintain attribution to the author(s) and the title of the work, journal citation and DOI.
1. Introduction
The ability to pass high currents under high fields at advantageous temperatures means that high temperature superconductors (HTS) may lead to a revolution in the development of magnetic confinement fusion, resulting in smaller reactors with dramatically reduced capital costs [1, 2]. However the unique environment in a fusion reactor presents challenges that require further attention. In particular, the HTS materials will be exposed to high energy neutrons that may impact the magnet's superconducting properties ultimately compromising the integrity of the magnetic field.
The underlying defect population dictates the superconducting performance of HTS materials. Early in their development it was shown that the critical temperature, Tc , in YBa2Cu3O7−x decreases as x increases from 0 to 1 [3]. This oxygen deficiency is accommodated by oxygen vacancy defects that are thought to exist predominantly in the Cu-O chains [4, 5]. However, the number of oxygen vacancy defects is not the only factor that determines the critical temperature, the ordering of the vacancies is also important [6, 7].
Extended defects, including twins, grain boundaries, precipitates, dislocations and stacking faults have all been observed in YBa2Cu3O7. These larger defect structures act to immobilise magnetic flux vortices, thereby reducing pseudo-resistance due to flux creep and enhancing the superconducting performance of the material. Consequently, there has been extensive research on how to incorporate such defects into HTS materials either during fabrication (see for example [8, 9]) or subsequently using irradiation with swift heavy ions (SHI) [10, 11].
There have been a number of experimental investigations of the influence of fast neutron irradiation in HTS. Sauzeropf et al observed that at low neutron fluences (2 × 10²² m−3) the critical temperature of YBa2Cu3O7 decreases almost linearly with neutron fluence [12]. This linear trend was extended to higher fluences by Prokopec et al [13]. The decrease in Tc is attribute to the accumulation of vacancies as oxygen ions are displaced from their lattice sites due to elastic collisions. A process that has been observed in molecular dynamics (MD) simulations of low energy cascades [14]. By contrast, positron annihilation lifetime spectroscopy suggests that Cu-O divacancy defects are the dominant point like defect in YBa2Cu3O7 following neutron irradiation [15]. This same study also suggests that it is the larger defects that have a stronger influence on Tc .
Sauzeropf et al observe an increase in the critical current densities in both the ∣∣(c) and ∣∣(ab) directions with neutron fluence, however, this increase is asymmetric, such that it reduces the initial anisotropy due to the underlying crystal structure [12]. The increase in the critical current was attributed to the introduction of nanoscale defect regions that act as flux pinning centres. However, Chudy et al argue that the point like defects have a significant impact on Jc , while the larger defective regions have a greater impact on Tc as mentioned above [15]. Fischer et al have shown that the increase in Jc is sensitive to the concentration of flux pinning sites in the initial material. The presence of a high concentration of initial pinning sites also leads to Jc dropping below its initial value at lower neutron fluxes than when the initial concentration of pinning sites is low [16]. Overall, this suggests that the introduction of defects by neutron bombardment is initially beneficial however, there is a saturation point whereby the increase in flux pinning is dominated by the loss of the underlying crystal structure, leading to a decrease in superconducting properties. This point is reached at lower neutron fluxes for materials with a higher initial concentration of flux pinning defects as the material is already closer to the saturation point.
It is essential that we understand the defect structure of the materials proposed for use in fusion reactors in order to develop the optimum balance between initial superconducting properties and operational lifetime. This study will focus on understanding the concentrations of point defects in YBa2Cu3O7. Direct observation of point defects in materials is complex, therefore, this study will employ atomistic simulation, based on density functional theory (DFT), to study defects in YBa2Cu3O7. There have been a number of previous studies of defects using empirical pair potentials (see for example [17, 18]) and DFT [19–21], however, these have focused predominantly on oxygen defects and neglect possibly important defect species, such as cation antisites and interstitials. Therefore, this study will use defect formation energies from DFT coupled with simple thermodynamics to create a point defect model for YBa2Cu3O7−x enabling a prediction of the point defect concentrations under conditions relevant to fusion applications.
2. Crystallography
The unitcell of YBa2Cu3O7 has an orthorhombic shape with the pmmm space group and can be thought of as a defective perovskite. One of the key features of the rare earth cuperates is that the Cu ions exhibit two different charge states. The Cu2 ions occupy the 2y Wyckoff site and have five surrounding oxygen ions that form square pyramids that link together to in the x and y planes. The base of the pyramids forms the characteristic CuO2 layers that are believed to play a key role in superconductivity in these materials. These five co-ordinate Cu ions take a 2+ charge state while the Cu1 ions have 4 neighbours in a planner shape take a 3+ charge state and form CuO chains [22]. An illustration of the YBa2Cu3O7 unitcell is presented in figure 1.
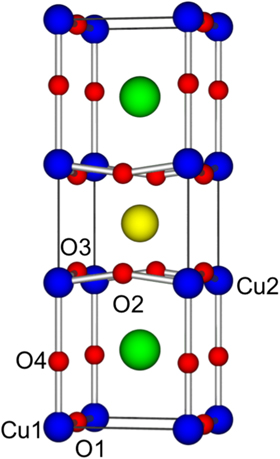
Figure 1. Graphical representation of the YBa2Cu3O7 unitcell, where red spheres represent oxygen anions and the blue, green and yellow spheres represent the copper, barium and yttrium cations respectively.
Download figure:
Standard image High-resolution image3. Methodology
3.1. Electronic structure simulations
Defect energies for use in the point defect model were calculated using DFT implemented in the CASTEP simulation package [23, 24]. Simulations employed the Generalised Gradient Approximation (GGA) exchange correlation functional of Perdew et al [25]. Atoms were represented using a plane wave basis and ultrasoft pseudopotentials generated using the on-the-fly pseudopotential generator in CASTEP (version 17). The electrons considered as valence and hence treated explicitly in the simulations are presented in table 1. The plane wave expansion was truncated at a cutoff energy of 600 eV.
Table 1. Electrons considered explicitly in the simulations.
| Atom | Explicit electrons |
|---|---|
| Y | 4s, 4p, 5s, 4d |
| Ba | 5s, 5p, 6s |
| Cu | 3d, 4s |
| O | 2s, 2p |
To demonstrate the efficacy of the DFT model the Brilloiun Zone (BZ) was sampled using a Monkhorst−Pack grid of 8 × 8 × 4 k-points in the unitcell and the lattice parameters and elastic constants were compared with available experimental data. Table 2 demonstrates the efficacy of the DFT model to reproduce the fundamental properties of the YBa2Cu3O7 lattice.
Table 2. Lattice parameters and elastic constants calculated for YBa2Cu3O7 using the DFT simulations compared to existing experimental data of Fernandes et al [26], Lei et al [27] and references therein.
| Parameter | DFT | Experiment |
|---|---|---|
| a/Å | 3.840 | 3.821 |
| b/Å | 3.919 | 3.884 |
| c/Å | 11.830 | 11.677 |
| c11/GPa | 215.97 | 211-234 |
| c12/GPa | 109.24 | 37-132 |
| c13/GPa | 58.03 | 71-100 |
| c22/GPa | 232.40 | 230-268 |
| c23/GPa | 57.16 | 93-100 |
| c33/GPa | 142.55 | 138-186 |
| c44/GPa | 51.13 | 35-61 |
| c55/GPa | 41.19 | 33-50 |
| c66/GPa | 81.72 | 57-97 |
The electronic density of states (DOS) for the reference YBa2Cu3O7 unitcell is presented in figure 2. The total DOS is in excellent agreement with previous works that utilise local or semi-local exchange correlation functionals [28–30]. Previous comparisons between the band structures obtained from the local density approximation (LDA) and ARPES measurements indicates that even relatively simple functionals can accurately reproduce the electronic structure observed experimentally [31]. As a consequence, the PBE exchange correlation functional is considered appropriate for the current work. Also shown in figure 2 is the partial or projected DOS that shows that the region close to the Fermi level is dominated by oxygen 2p and Cu 3d states also in agreement with previous work by Wang et al [32]. Mulliken analysis of the ions indicates charges of 0.37∥e∥ and 0.34∥e∥ on the Cu1 and Cu2 respectively. It is noted that this relatively small difference may be due to limitations with localisation due to the GGA functional.
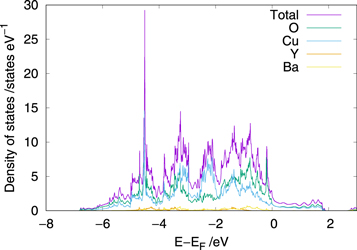
Figure 2. Density of states of the YBa2Cu3O7 unitcell.
Download figure:
Standard image High-resolution imageIt is essential that the DFT simulations accurately represent all of the subsystems of YBa2Cu3O7 used in the construction of the point defect model. Therefore, the ability of the DFT model to reproduce the properties of these was also tested. Table 3 shows the lattice parameters for the various binary oxides and the metallic elements are in excellent agreement with the existing experimental data.
Table 3. Comparison of calculated lattice parameters for the subsystems of interest compared with experimental data.
| Subsystem | Parameter | DFT | Experiment | Reference |
|---|---|---|---|---|
| Y2O3 | a/Å | 10.66 | 10.61 | [33] |
| BaO | a/Å | 5.60 | 5.52 | [34] |
| Cu2O | a/Å | 4.30 | 4.27 | [35] |
| Y | a/Å | 3.65 | 3.65 | [36] |
| c/Å | 5.69 | 5.73 | [36] | |
| Ba | a/Å | 5.01 | 5.01 | [37] |
| Cu | a/Å | 3.63 | 3.62 | [38] |
For the calculation of defect formation energies the simulation supercells were constructed by taking 4 × 4 × 1 repetitions of the unitcell resulting in a cell containing 208 atoms that is sufficiently large to ensure any finite size effects are negligible. For reasons of computational tractability and given the large number of defects considered here the k-point density was reduced such that the supercell is sampled using the gamma point, which corresponds to a sampling equivalent to 4 × 4 × 1 in the unitcell. The impact of the reduction in the BZ sampling density on the defect formation energies is found to be negligible. Defects are introduced into the cell by adding and removing atoms and performing energy minimisation under fixed volume conditions until the force on each atom converged to 0.01 eV Å−1.
3.2. Defect formalism
The concentration of any given defect, i, is proportional to the free energy required to form the defect, Gf i , as shown below:

where mi
is the multiplicity of the defect (defined per formula unit), kB
is the Boltzmann constant and T is the temperature. At relatively low temperatures, the difference in vibrational contributions to the free energy between perfect and defect supercells can be safely neglected, so we can approximate  by
by  , calculated from the total energies of the perfect and defective cells according to the formalism of Zhang and Northrup [39]. The defect formation energy is then given by:

where,  and
and  are the DFT total energies of the system with and without the defect, nα
is the number of atoms added/removed of each atomic species α and μα
is the chemical potential of each species. The chemical potential represents the availability of the different elements and can be directly related to the experimental conditions present during fabrication through the use of elementary thermodynamics. From a thermodynamic perspective we assume that YBa2Cu3O7 can be fabricated from a series of binary oxides and oxygen, i.e.:
are the DFT total energies of the system with and without the defect, nα
is the number of atoms added/removed of each atomic species α and μα
is the chemical potential of each species. The chemical potential represents the availability of the different elements and can be directly related to the experimental conditions present during fabrication through the use of elementary thermodynamics. From a thermodynamic perspective we assume that YBa2Cu3O7 can be fabricated from a series of binary oxides and oxygen, i.e.:

while noting this is not the traditional route for synthesis of YBa2Cu3O7. Under any given conditions, the sum of the chemical potentials per formula unit of the constituent species must equal the total Gibbs free energy of the YBa2Cu3O7 product, i.e.:

where,  ,
,  , and
, and  are the chemical potentials of the constituent binary oxides as a function of the oxygen partial pressure and the temperature,
  is the chemical potential for the oxygen molecule and
  is the chemical potential for YBa2Cu3O7. Note that under standard conditions we assume that
  , where the chemical potential of the YBCO is taken from DFT calculations.
It should be noted that only neutral defects are considered. This is because the Fermi level in YBa2Cu3O7 falls within the band ensuring that it is metallic. As a consequence, any electrons added or removed from the system will be added/removed from the electron reservoir which will remain essentially fixed (except at very high defect concentrations).
Under equilibrium conditions, the chemical potentials of the constituents of a crystal cannot exceed the Gibbs free energy of any phase made of the constituent elements. For example, the chemical potential of Cu2O in YBa2Cu3O7 cannot exceed that of solid Cu2O, otherwise a Cu2O precipitate would form. By considering a range of different competing phases, it becomes possible to define a region of the phase diagram where the host compound is stable that bounds the possible chemical potentials as illustrated by Huang and Johannes [40]. However, this approach assumes that the host compound is itself stable, which is not the case for YBa2Cu3O7 as it decomposes according to [41]:

As it is not possible to define a region where the YBa2Cu3O7 is stable the approach adopted here is to set the upper bounds for the chemical potentials to that of the binary oxides as determined from DFT, i.e.

where,  is the energy of a formula unit of Cu2O determined using DFT. To calculate the lower bound for the chemical potential for a constituent, we assume all other binary oxides must be at their upper bound and thus:

The values for the chemical potentials can fall anywhere in this range, therefore we define a fraction, f, for each binary oxide ensuring that the chemical potential becomes:

Within this framework a further limitation is placed on the possible fractions, f, such that:

where, n is the number of cations in the system, in order to ensure that the chemical potentials do not exceed that of YBa2Cu3O7. This approach enables the exploration of the defect chemistry under conditions that contain either an excess or deficit of each of the cation species.
The chemical potentials for the binary oxides can be further decomposed into their constituents, for example for Cu2O;

where,  and
and  are the chemical potentials of Cu and O in Cu2O in equilibrium with O2 gas. From equations (7) and (10) it is clear that the chemical potential for the oxygen molecule is necessary. The chemical potential for oxygen may be determined using DFT, however, there are known issues surrounding the calculation of small dimer molecules using semilocal functionals such as the GGA employed here. Therefore, we follow the approach of Finnis et al [42] and reference the known formation energy of the oxide under standard conditions, i.e.:

where,  is the chemical potential of metallic copper determined using DFT. Oxygen chemical potentials at standard temperature and pressure as calculated from the three binary oxides all fall within 0.1 eV of each other, therefore,
  is simply calculated as a weighted average of the contributions by the fractions of binary oxides present, i.e.:

where the summation runs over all binary oxides, j.
The oxygen chemical potential under the desired conditions,  , is extrapolated from
  according to equation (13):

where Δμ(T) can be be determined from the real heat capacities for the O2 molecule, i.e.:

where,

The parameters A-G are taken from Johnston et al [43].
The determination of the oxygen chemical potential enables determination of the chemical potentials of the binary oxides and YBa2Cu3O7 as shown in table 4. These can then be used to define of a region of chemical potential space representing the availability of the individual cations. Figure 3 shows the relationship between μCu and μY at an oxygen partial pressure of 10−4 atm and a temperature of 700 K. Varying the fractions of each binary oxide fj enables the examination of this region of the phase diagram.

Figure 3. Chemical potential diagram showing μCu and μY at a temperature of 700 K and an oxygen partial pressure of 10−4 atm. The points indicated on the diagram correspond to the different regimes based on assigned fractions, i.e. ( ).
).
Download figure:
Standard image High-resolution imageTable 4. Table showing the chemical potentials of the binary oxides and YBa2Cu3O7 at 10−4 atm and 700 K.
| System | Chemical potential/eV | |
|---|---|---|
| rich | poor | |
| Y2O3 | −0.472 | −1.315 |
| BaO | −15.720 | −18.248 |
| Cu2O | −4.202 | −4.834 |
| YBa2Cu3O7 | −2.529 | |
4. Results and discussion
4.1. Defect formation energies
The defect formation energies for multicomponent compounds exhibit a complex dependency on the values chosen for the chemical potentials. When a chemical potential for a given specie is at its upper bound it will have the effect of minimising the formation energy of an interstitial defect for the corresponding specie and maximising the vacancy formation energy. Therefore, any formation energy presented will depend on the choice of reference chemical potential. In order to enable a simple discussion of the relative energies for the different defect sites and allow comparison with previous studies we begin our discussion by presenting the defect formation energies for all defects considered at both the rich and poor limits (referenced to their elemental states) in the reference YBa2Cu3O7. A discussion of the prevalence of the different defect species based on the conditions present during fabrication will be illustrated using the point defect model later.
4.1.1. Vacancy defects
Defect formation energies for the intrinsic vacancy defects are presented in table 5. Immediately apparent from the table is the dramatic difference in the formation energies calculated under rich and poor conditions. For all species the lower limits of the chemical potential generate negative formation energies that indicate that these conditions are not accessible. Comparison of the defect formation energies for the Cu sites show that vacancy formation on the Cu2 site in the CuO2 planes is lower in energy than in the CuO chain by 0.4 eV. A similar pattern was predicted by Gazquez et al who calculated a formation energy of 1.4 eV for the VCu2 defect (the chemical potential for Cu is not discussed but it is assumed to be for the metal) [21]. This compares to a value of 1.76 eV in the current work. The discrepancy between the formation energy calculated here and that of Gazquez et al may be due to computational parameters, such as the simulation supercell size and k-point sampling density.
Table 5. Defect formation energies for the different vacancy defects in YBa2Cu3O7.
| Defect | Formation energy/eV | |
|---|---|---|
| Rich | Poor | |
| VY | 10.82 | −12.49 |
| VBa | 7.17 | −4.51 |
| VCu1 | 2.15 | −5.63 |
| VCu2 | 1.76 | −6.03 |
| VO1 | 1.01 | −2.33 |
| VO2 | 1.60 | −1.74 |
| VO3 | 1.71 | −1.62 |
| VO4 | 0.88 | −2.45 |
The DFT simulations also predict that the VO4 has the lowest formation energy, which is 0.12 eV lower in energy that the VO1 defect. This prediction appears to be at odds with previous empirical potential studies that suggest that the VO1 defect has the lowest defect energy [44]. While widely adopted for the study of high temperature superconductors [45, 46], the potential forms, original developed for use in conventional ceramics may be unsuitable for the study of defects in these materials due to screening of Coulombic interactions [47] as YBa2Cu3O7 is metallic. Previous DFT studies state the formation energy for an oxygen vacancy in the CuO chains is lower than in the CuO2 layers which agrees well with the results presented here, although it is not clear whether the VO4 is considered to be in the chains or whether it has been considered at all. Horide and Matsumoto predict values of 0.86 and 1.66eV for vacancies in the CuO chains and CuO2 layers respectively which are in good agreement with the values presented in table 5 [20]. However, experimental observations suggest that the oxygen vacancies occur predominantly on the O1 sites with some evidence, from diffraction studies, of vacancies on the O4 site. As will be discussed in later sections this discrepancy can be resolved by considering vacancy clustering.
4.1.2. Interstitial defects
Here we consider seven symmetrically distinct interstitial sites as illustrated in figure 4. The energies for the different interstitial defects are reported in table 6. For the oxygen interstitial defect the lowest energy interstitial site is in the yttrium layer (indicated as interstitial site 5 in figure 4). Other interstitial defects that lie close to interstitial site 5 (sites 6 and 7) are not stable and relax to give the same structure as the interstitial site 5, hence the almost identical formation energies. Surprisingly, this interstitial defect is lower in energy than the interstitial 2 site where the oxygen atoms are located in tetragonal YBa2Cu3O8.
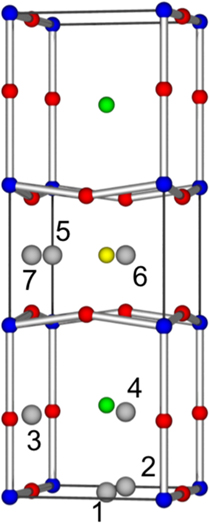
Figure 4. Graphical representation of the YBa2Cu3O7 unitcell, where red spheres represent oxygen anions and the blue, green and yellow spheres represent the copper, barium and yttrium cations respectively.
Download figure:
Standard image High-resolution imageTable 6. Defect formation energies for the intrinsic interstitial defects in YBa2Cu3O7.
| Site | O | Y | Ba | Cu | ||||
|---|---|---|---|---|---|---|---|---|
| Rich | Poor | Rich | Poor | Rich | Poor | Rich | Poor | |
| 1 | 2.14 | 5.48 | −0.31 | 23.05 | 1.84 | 13.53 | 1.52 | 9.31 |
| 2 | 0.26 | 3.59 | −1.94 | 21.43 | 0.55 | 12.23 | 2.60 | 10.39 |
| 3 | 2.27 | 3.61 | −1.61 | 21.76 | 2.73 | 14.41 | 1.33 | 9.12 |
| 4 | 0.27 | 3.61 | −1.31 | 22.05 | 0.55 | 12.23 | 1.81 | 9.60 |
| 5 | 0.11 | 3.45 | −1.63 | 21.73 | 3.06 | 14.74 | 2.91 | 10.70 |
| 6 | 0.1 | 3.44 | 1.65 | 25.01 | 3.89 | 15.57 | 2.49 | 10.28 |
| 7 | 0.11 | 3.45 | 3.01 | 26.38 | 5.55 | 17.23 | 3.27 | 11.06 |
By contrast the interstitial 2 site is predicted to have the lowest formation energies for the large cations Y and Ba. This is likely due to this site minimising the interaction of these cations with the other Y and Ba atoms in the structure. This is exemplified by the high energies predicted for the large cation defects in the BaO and Y layers. For the Cu interstitial the lowest interstitial site is in the BaO layer (site 3 in figure 4). As was the case for the other cation species the interstitial sites close to the Y and Ba ions are higher in energy due to repulsive interactions with other cations.
4.1.3. Antisite defects
Defect formation energies for the antisite defects are presented in table 7. As is the case above the large variation in the chemical potentials between the rich and poor regimes makes direct comparisons difficult. However, from table 5 it can be seen that the Ba and Y cations prefer to sit on different Cu sites. Ba prefers to sit on the Cu1 site, while the most favourable site for Y is the Cu2 site where is replaces a Cu2+ ion.
Table 7. Defect formation energies for the antisite defects in YBa2Cu3O7. Note that the defect formation energies are presented assuming that both constituents are in their rich or poor states.
| Defect | Formation energy/eV | |
|---|---|---|
| Rich | Poor | |
| BaY | 4.34 | −7.34 |
| YBa | −2.81 | 8.87 |
| BaCu1 | −1.56 | 2.34 |
| BaCu2 | −0.63 | 3.27 |
| CuBa | 5.70 | 1.80 |
| CuY | 9.55 | −6.03 |
| YCu1 | −4.97 | 10.60 |
| YCu2 | −6.17 | 9.41 |
4.2. Intrinsic defect reactions
The defect formation energies presented above can be used to calculate the reaction energies for the intrinsic defect processes. For the calculation of the reaction energies the chemical potentials appear on both sides of the equation and therefore cancel, making interpretation unambiguous. The reaction energies for the intrinsic defect processes are presented in table 8. Table 8 shows that the lowest energy process is the oxygen Frenkel process, which correlates with the relatively high level of oxygen ion diffusion anticipated in YBa2Cu3O7 even when the material is close to stoichiometric. By contrast, the cation Frenkel processes all have relatively high reaction energies which appears to agree well with previously very high activation energies predicted for Y and Ba diffusion in YBCO. Of particular note is the relatively low energy for swapping the Y and Ba cations. This implies the as fabricated material will likely exhibit high levels of these antisite defects. The reaction energy for the Schottky process is predicted to be very high at 13.26 eV, however, this corresponds to a normalised reaction energy of 1.02 eV per defect formed, making it the third lowest energy defect process in YBa2Cu3O7.
Table 8. Reaction energies for the intrinsic defect processes in YBa2Cu3O7.
| Reaction | Reaction energy/eV | Normalised energy/eV |
|---|---|---|
| OO → Oi + VO | 0.98 | 0.49 |
| YY → Yi + VY | 8.92 | 4.46 |
| BaBa → Bai + VBa | 7.72 | 3.86 |
| CuCu → Cui + VCu | 6.16 | 3.08 |
| 7OO + YY + 2BaBa + 3CuCu → 7VO | ||
| + VY + 2VBa + 3VCu + YBa2Cu3O7 | 13.26 | 1.02 |
| YY + BaBa → BaY + YBa | 1.52 | 0.76 |
| CuCu + BaBa → BaCu + CuBa | 3.38 | 1.69 |
| CuCu + YY → YCu + CuY | 4.14 | 2.07 |
4.3. Oxygen vacancy clustering
The chemical formula for YBCO is frequently written YBa2Cu3O7−x indicating that it can accommodate a significant degree of oxygen non-stoichiometry. This reduction of the oxygen stoichiometry is accommodated in the structure by oxygen vacancy defects. As the concentration of these defects increases the defects begin to interact and form clusters, therefore, the isolated oxygen vacancy defect will not offer the best description of the defect chemistry. Therefore, defect formation energies of pairs of oxygen vacancies in the Cu-O chains were calculated. Note that given the large number of possible vacancy cluster configurations we have ignored clusters in the CuO2 planes as these defects have significantly higher formation energies.
Plotted in figure 5 is the defect formation energy per vacancy defect for the oxygen vacancy in YBa2Cu3O7 as a function of the separation between vacant sites. The horizontal dashed line represents the formation energy of an isolated oxygen vacancy defect on the O4 site, which was shown to have the lowest formation energy above. Figure 5 indicates that there are a number of defect clusters that have lower formation energies per defect than the isolated vacancy on the O4 site. Importantly, it appears the lowest energy oxygen vacancy defect clusters occur in the CuO chains on the O1 site, which is in good agreement with existing experimental data. An example of one of these low energy clusters showing two vacancies on the O1 sites is illustrated in figure 6.

Figure 5. Plot showing the defect formation energy per VO defect as a function of the separation between the vacancy defects for a selection of defect clusters involving oxygens on the O1 and O4 sites. The horizontal line corresponds to the lowest energy for the formation of an isolated VO defect.
Download figure:
Standard image High-resolution image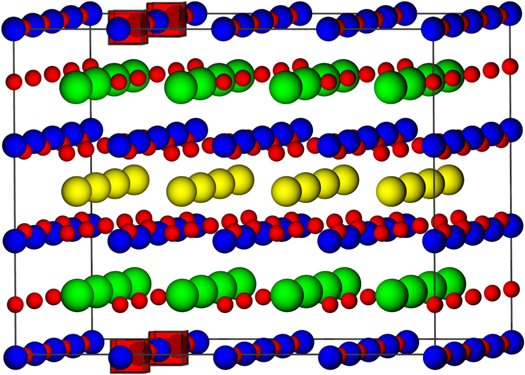
Figure 6. Graphical representation of the simulation supercell containing the lowest energy vacancy cluster. The red, blue, green and yellow spheres represent the oxygen, copper, barium and yttrium respectively. Oxygen vacancies are represented by transparent red cubes. Note that the number of vacancies shown is four due to the application of periodic boundary conditions.
Download figure:
Standard image High-resolution imageThe results indicated in figure 5 suggest that at low deviations from stoichiometry the oxygen vacancy defects will prefer to occupy the O4 site, however, as the oxygen substoichiometry increases there will be an increase of vacancies on the O1 site with some expected on the O4 site, in agreement with experiment. Figure 7 shows the binding energy between the vacancy defects as a function of their separation. The plot shows that there is a repulsive interaction between the vacancy defects at short separations. In general, the binding energy decreases as the separation increases, such that it is negligible at about 10 Å, however, there are a series of configurations with significant binding energies representing the most favourable cluster configurations.
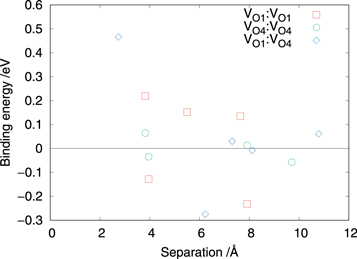
Figure 7. Plot showing the binding energies of VO clusters as a function of the separation between the vacancy defects for a selection of defect clusters involving oxygens on the O1 and O4 sites.
Download figure:
Standard image High-resolution image4.4. Point defect model
This final section will examine the defect chemistry of YBa2Cu3O7 under different conditions. Initially, the Y2O3, BaO and Cu2O-poor limits were considered. When the conditions are Y2O3-poor the defect formation energy for the BaY antisite defect was found to be negative for all temperatures and partial pressures of interest. This indicates that these conditions would not be accessible in a real system. However, it is noted that YBa2Cu3O7 is largely fabricated with excess Y2O3 to introduce nanoparticles that can act as flux pinning centres, thereby improving superconductivity [48]. Due to the combination of these two factors, the results for Y2O3-poor YBa2Cu3O7 are not presented here.
4.4.1. Cu2O-poor YBa2Cu3O7
Defect concentrations for Cu2O-poor YBa2Cu3O7 are presented as a function of oxygen partial pressure at a temperature of 700 K in figure 8. Such plots are commonly referred to as Brouwer diagrams. In materials with a bandgap the gradient of the line indicates the specific reaction that ensures overall charge neutrality in the system, for example a  defect charge compensated for by 2e1- would have a gradient -1/6. However, the defects considered here are charge neutral and there is, consequently, no requirement to ensure charge neutrality and therefore, there is no similar relationship to the defect charges. Note that for clarity all defects of the same type have been summed and plotted together (i.e. [VO]=
 ]).
]).
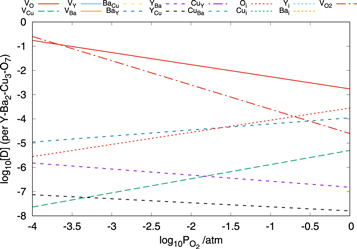
Figure 8. Plot showing the concentration of defects in YBa2Cu3O7−x as a function of the oxygen partial pressure at 700 K under Cu2O-poor conditions.
Download figure:
Standard image High-resolution imageFigure 8 shows that the defect chemistry is dominated by oxygen defects as would be expected. As the oxygen partial pressure decreases the concentration of oxygen vacancy defects increases rapidly resulting in a substantial increase in x in YBa2Cu3O7−x . This overall trend is in good agreement with the experimental data of Yamaguchi et al [49]. Concomitant with an increase in the concentration of VO defects is an increase in the number of these defects contained in clusters and consequently on the VO4 site, also in agreement with experimental observations.
In addition to the oxygen vacancy defects there are a number of other important classes of defects in Cu2O-poor YBa2Cu3O7. Interestingly, there is a relative high concentration of oxygen interstitial defects present. The concentration of Oi defects increases as the oxygen partial pressure increases and is almost equal to the vacancy concentration under atmospheric pressure. Also evident are significant concentrations of the YBa and BaY antisite defects as predicted above. In the Cu2O-poor limit the paucity of Cu is reflected in the high concentration of VCu and YCu defects. The concentration of these defects is sensitive to the oxygen partial pressure with the VCu predicted to be of increasing importance at higher partial pressures while the concentration of YCu defects shows a slight decrease. All of the remaining defect species are predicted to have concentrations below 10−8 per formula unit and therefore, these are unlikely to play a significant role in determining the macroscopic properties of the material.
As demonstrated by Yamaguchi et al the deviation in oxygen stoichiometry increases linearly as the oxygen partial pressure decreases, however, as x approaches unity defect-defect interactions and competition for lattice sites leads to the loss of this linear relationship. The results presented in figure 9 shows an almost to linear relationship between x and log![$[{P}_{{{\rm{O}}}_{2}}]$](https://content.cld.iop.org/journals/2399-6528/4/11/115003/revision3/jpcoabc9a7ieqn21.gif) , although the point defect model applied does not consider the defect-defect interactions and as a consequence is not applicable at the highest vacancy concentrations where such interactions would inevitably occur.
, although the point defect model applied does not consider the defect-defect interactions and as a consequence is not applicable at the highest vacancy concentrations where such interactions would inevitably occur.

Figure 9. Plot showing the change in x in YBa2Cu3O7−x as a function of the oxygen partial pressure at at a series of temperatures under Cu2O-poor conditions.
Download figure:
Standard image High-resolution image4.4.2. BaO-poor YBa2Cu3O7
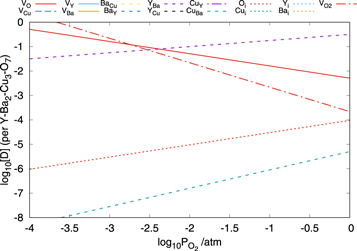
Figure 10 shows the concentrations of the defects in BaO-poor YBa2Cu3O7 as a function of the oxygen partial pressure at 700 K. The results show that once again the oxygen defects have very high concentrations, however, this time the YBa antisite defect is dominant at the highest oxygen partial pressures. The reason for this is that the system is both poor in Ba and rich in Y. Although of much lesser importance the CuBa defect is also present under these conditions.
Figure 10. Plot showing the concentration of defects in YBa2Cu3O7 as a function of the oxygen partial pressure at 700 K under BaO-poor conditions.
Download figure:
Standard image High-resolution image
It should be noted that the dominant defects under BaO-poor conditions have high concentrations that are not best represented using the point defect model applied here and consequently the results in this limit should be treated with a degree of caution.
5. Summary
This work has combined defect formation energies calculated using DFT with simple thermodynamics to explore the defect chemistry of YBa2Cu3O7 under a range of different conditions. Formation energies have been determined for all simple point defects in YBa2Cu3O7 and there is good agreement with previous values determined from DFT where available. The results predict that it is thermodynamically favourable for isolated oxygen vacancy defects to reside on the O4 site in the CuO chains, however, as the concentration of such defects increases the defects will prefer to form clusters distributed predominantly on the O1 site as observed in previous experimental observations of YBa2Cu3O7−x . Calculation of the reaction energies for the simple Frenkel and Schottky processes show that the oxygen Frenkel reaction is the lowest energy defect process with a normalised energy of 0.49 eV. Interestingly, the next most thermodynamically favourable process is for the Y and Ba atoms to switch sites resulting in antisite defects. The dominance of the oxygen and antisite defects is reflected in the point defect model that shows that the isolated and clustered oxygen vacancy defects accumulate resulting is significant changes in x when YBa2Cu3O7−x is annealed at moderate temperatures where the oxygen partial pressure is a below atmospheric conditions. Finally, the point defect model shows that slight deviations in cation stoichiometry are likely accommodated by antisite defects rather than vacancy or interstitial defects.
Acknowledgments
STM acknowledges funding from Tokamak Energy and EPSRC under contract number EP/R511560/1. Computational facilities were provided via our membership of the UK's HEC Materials Chemistry Consortium, which is funded by EPSRC (EP/L000202), on the ARCHER UK National Supercomputing Service (http://www.archer.ac.uk).