

Abstract
Current structure in the scrape-off layer (SOL) of a tokamak is analyzed. It is demonstrated that poloidal currents measured in the experiments are a combination of several current types with different physical nature. Besides the known Pfirsch–Schlüter currents and thermoelectric currents, so-called plate closing currents flowing to/from the divertor plates are also analyzed. The latter close radial currents in the SOL and below/above the X-point in the SOL and private flux region (PFR). In particular, the current flowing to the outer plate in the PFR, opposite to the thermoelectric current, is predicted for the standard single-null configuration and favorable direction of  drift. In addition, a pair of currents should flow to and away from the outer plate. In the single-null configuration, they are often masked by a larger thermoelectric current. However, for the connected double null (CDN) case, where the thermoelectric current is strongly reduced due to smaller temperature asymmetry, these currents dominate. The suggested physical model is supported by the results of simulations performed with the SOLPS-ITER transport code. Simulations were done for ASDEX Upgrade (AUG), L- and H-modes, single-null configurations, and for Globus-M H-mode, both disconnected and CDN configurations. Results of the simulations are compared with probe measurements for AUG and Globus-M tokamaks, and reasonable agreement has been found. The role of parallel currents in the formation of the potential maximum/minimum in the vicinity of the X-point for strongly detached regimes is also analyzed.
Export citation and abstract BibTeX RIS
1. Introduction
Current structure in the edge of a tokamak is quite complicated. Besides the widely known parallel Pfirsch–Schlüter (PS) currents [1] and thermoelectric currents [2], there are other currents flowing through the divertor plates, which close radial currents in the plasma volume [1, 3–5]. These currents can be called plate closing currents (PCCs). Below, we analyze the structure of all currents in the edge plasma both in the scrape-off layer (SOL) and divertor regions, including currents flowing to the divertor plates. Currents in the SOL determine potential profiles, and, in particular, potential distribution along the divertor plates. The latter can have a significant impact on the sheath heat transmission factor and hence on the electron temperature and the density near the divertor plates and particle flux to the divertor plates. In the detached regimes, where strong parallel currents require strong poloidal electric fields due to low conductivity [6], strong  drifts are responsible for plasma redistribution in the edge. Therefore, understanding the current structure in the SOL is quite important. Analysis is performed based on modeling done by the SOLPS-ITER code for different regimes of ASDEX Upgrade (AUG), L- and H-modes, single-null configurations, and for Globus-M, H-mode, both single and double null configurations. Simulation results are compared with probe measurements of the currents at the divertor plates. It is shown that current density distribution at the divertor plates obtained in the modeling is in good agreement with experimental measurements. The role of parallel (poloidal) currents in the formation of a potential maximum/minimum in the vicinity of the X-point for strongly detached regimes is also analyzed. Parallel currents for low parallel conductivity require poloidal electric fields directed away from the X-point for the normal direction of the magnetic field (towards the X-point for unfavorable direction). In the private flux region (PFR) the poloidal electric field is directed towards (from) the plates for the normal (reversed) direction of the magnetic field. As a result, the maximum (minimum) of potential is formed in the X-point vicinity causing clockwise
  drifts around the X-point.
2. PS and thermoelectric currents
PS current compensates divergence of diamagnetic current ( driven current), as can be seen in figure 1. Its value in the SOL can be obtained in a way similar to derivation for the core from the equation
  assuming that diamagnetic current and PS current give the main contribution. If one assumes that in the SOL above the X-point, the total pressure is constant along magnetic field lines as in the core (which is rather close to reality), then [1]:
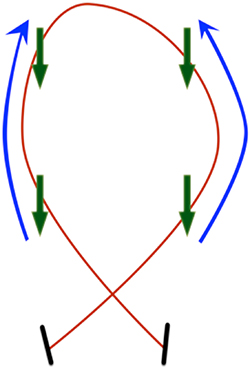
Figure 1. Poloidal components of PS currents closing  driven currents.
Download figure:
Standard image High-resolution imageHere, x, y, z are poloidal, radial and toroidal dimensionless coordinates used in SOLPS simulations [7],  are metric coefficients,
  , angle brackets correspond to the volume average quantity and const is a constant for a given magnetic surface. In contrast to the well-known expression for PS currents in the core, in the SOL there is an arbitrary constant in equation (1). In the core, this constant is zero. Outside the separatrix this constant may be attributed to the thermoelectric current, which usually flows from the outer to the inner plate. Note that according to equation (1) the poloidal component of this current flowing between two flux surfaces is conserved and thus is flowing from one divertor plate to another. We shall define PS current as the first periodic part of the parallel current in equation (1):
In the modeling, PS currents in the SOL are well reproduced, see, for example, the result of AUG L-mode simulation figure 4 in [1]. Figure 2 shows the modeled value of parallel current and the parallel current calculated with equation (1) for the ASDEX Upgrade L-mode shot 34685. Here, one can see negative thermoelectric current flowing from the outer to the inner plate and typical PS modulation. Thermoelectric current is caused by the temperature difference between the outer and inner plates. Its value, therefore, depends on the tokamak regime and, in particular, on the degree of detachment. An example is presented in figure 6 of [6], where the simulated net poloidal current flowing through the divertor plates is shown as a function of the gas puff value, which is connected to the degree of detachment. The strong decrease of the thermoelectric current through the plates with gas puff corresponds to the temperature decrease at the outer divertor plate.
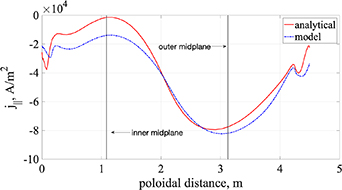
Figure 2. Parallel current in the SOL for the flux surface at the distance 2.4 mm from the separatrix (at the outer midplane) for AUG L-mode shot 34685. Red line—current, calculated with equation (1), constant is chosen to produce the best fit with simulations at the top of the tokamak; blue dashed line—current calculated in the SOLPS-ITER 2D code.
Download figure:
Standard image High-resolution image3. Plate closing currents
In addition to the parallel (poloidal) currents discussed above, currents are flowing to (away from) the plates, which are PCCs. They can be separated into two groups.
The first type of PCC closes  driven currents for the normal direction of the magnetic field flowing to the PFR below the X-point or away from the PFR above the X-point for double-null configuration. At the lower outer target this current is directed to the plate (is subtracted from thermoelectric current) at the PFR part of the target and is added to thermoelectric current at the SOL part of the target, see schematic figure 3. For the first time, the current flowing to the outer plate in the PFR was obtained in the simulations [1] and was measured at AUG [8].

Figure 3. PCC type I (black arrows) closing  driven currents (green arrows) below the X-point. Currents through plasma along the magnetic field are shown by blue arrows. Currents through the divertor targets are shown by white arrows.
Download figure:
Standard image High-resolution imageThe second type of PCC is associated with the parallel (poloidal) currents closing radial currents flowing in the SOL above the X-point for single-null configuration or between two X-points for double-null configuration. According to the analysis [4], a radial current of 'neoclassical' nature flows in the SOL. This radial current and associated radial ion flux can determine, as was suggested in [9], SOL width. This assumption was supported by several simulations [4, 10, 11] where anomalous transport coefficients were strongly reduced in the SOL. Net radial current through the separatrix is zero, since no integral current can flow through the closed flux surface [4]. Furthermore, in the SOL the radial current reaches a maximum and is reduced in the far SOL. Therefore, a pair of parallel (poloidal) currents should close the radial current, as shown in figure 4, which is reproduced from figure 1 of [4]. The circuit of PCC is shown in figure 5. In the experiments these currents could be to a large extent masked by the first type of PCC and thermoelectric current.

Figure 4. Ion flux (solid teal color arrows), electron flux (dashed teal color arrow) and parallel current induced by these fluxes in the SOL. Figure is reproduced from figure 1 of [4].
Download figure:
Standard image High-resolution image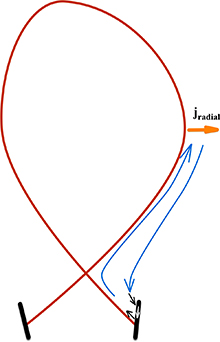
Figure 5. Scheme of PCC type 2. Radial current is shown by the orange arrow. Poloidal projections of parallel currents are shown by blue arrows. PCC type 2 (black arrows) and current through the target (white arrow) circuit this pair of currents.
Download figure:
Standard image High-resolution image4. Results of Globus-M modeling
4.1. Disconnected double-null configuration
Here, we are presenting some of the simulation results obtained with an earlier version of the SOLPS-ITER (SOLPS5.2) code for Globus-M tokamak for disconnected double-null (DDN) configuration in the H-mode for the favorable direction of the magnetic field and comparison with probe measurements at the divertor plates. For details of the simulations, see [3]; the experiment is described in [12].
The poloidal current density at the divertor plates is shown in figure 6 for the Globus-M 34439 shot. Current density is defined as the ratio of current to the target with the corresponding sign to the surface of the target. The currents in figure 6 are also shown in figure 9 of [3]. At the SOL part of the outer plate, the poloidal current is flowing away from the plate, as one can expect for the thermoelectric current (with the exception of the far SOL). The potential here is reduced with respect to the floating potential, which is consistent with the current direction, as shown in figure 6. The value of current from the outer lower target between two separatrixes is 137A. The value of the current from the plasma to the lower inner target between two separatrixes is 29A. So the current flowing from the outer plate to the inner plate is not conserved within the flux tube as one would expect for the thermoelectric current. Here, one has to keep in mind that for conserved current in the spherical tokamak, the current density at the inner plate should be significantly larger than that at the outer plate due to the smaller major radius. The observed reduction of the inner plate current density can be explained by the presence of PCC. At the SOL Strike Point vicinity of the lower outer target, PCC is flowing away from the plate, shown in figure 3, and hence is added to the thermoelectric current. Part of the SOL poloidal current below the X-point goes to the PFR due to vertical  driven currents and returns to the outer and inner PFR parts of the plates, where PCCs are directed towards the plates. The latter corresponds to the positive current peak in figure 6 at the PFR part of the outer plate and the negative one at the PFR part of the inner plate. PCCs flowing to the plates in the PFR are consistent with the fact that the plasma potential here is larger than the floating one.

Figure 6. Current density at the divertor targets for Globus-M H-mode shot 34439, DDN configuration, modeling with SOLPS-ITER. Positive values of the x-axis correspond to the SOL part of both targets; negative values of the x-axis correspond to the PFR part of both targets. Positive sign of current at the outer plate corresponds to current to the plate, at the inner plate—away from the plate.
Download figure:
Standard image High-resolution imageAt the outer plate, the measured distribution of the poloidal current density and plasma potential in front of the plate, shown in figure 7, are presented [12]. The measurements have been made not in the modeled discharge 34439 but in a similar one. One can see that the measurements are in reasonable agreement with the simulation results. It is worth noting that at the inner plate in the simulations (unfortunately, no measurements are available here) plasma potential in the units of  is very large, which means that the current to the inner plate is carried by ions while electrons are kept in the plasma by the electric field. The distribution of the poloidal currents in the divertor volume from the SOLPS-ITER simulation is shown in figure 8.
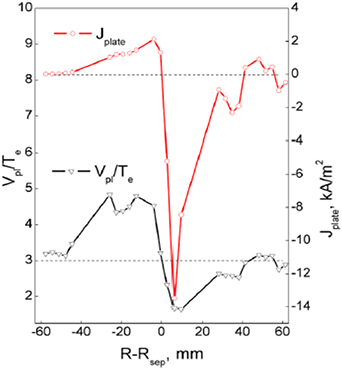
Figure 7. Current density at the outer divertor target (red curve) for the Globus-M H-mode, single-null configuration, experiment. Positive sign at the outer target corresponds to current from plasma to the plate. Plasma potential in the units of  is shown by the black curve.
Download figure:
Standard image High-resolution image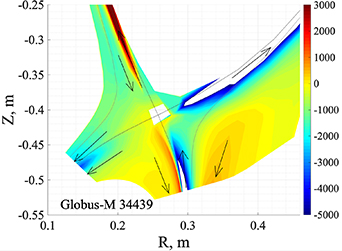
Figure 8. Poloidal current density in Globus-M 34439 shot. The results of simulation with SOLPS-ITER.
Download figure:
Standard image High-resolution imageHence, PCCs of the first type are obtained in the Globus-M tokamak both in the modeling and experiment.
4.2. Connected double-null configuration
The second type of PCC can be clearly seen in the simulations of Globus-M performed for the connected double-null (CDN) configuration, where the contribution from thermoelectric currents should be smaller due to the smaller difference in temperatures between the upper and lower plates [5]. Figure 10(a) of [5] shows electric current to the outer plates of CDN discharge. In the SOL vicinity of the Strike Point, a current is directed from the targets to the plasma for both targets; this is PCC type 2. Further from the Strike Point, the current changes sign for both targets. In the far SOL, thermoelectric current can be observed in the simulations—for both targets the current has the same value and direction.
5. Modeling of ASDEX Upgrade L- and H-mode shots
In this section, we present the results of a dedicated modeling comparison with divertor probe measurements for ASDEX Upgrade (AUG) L- and H-mode shots, single-null configuration, normal direction of magnetic field. Two L-mode shots and one H-mode shot have been simulated with SOLPS-ITER code. For L-mode shot N34685, the following parameters were chosen: discharge power P = 0.7 MW (Pe = 0.45 MW, Pi = 0.25 MW), D fueling rate  , N seeding rate
  . For this shot, magnetic perturbation coils were switched on, which we assume has a modest impact on divertor plasma parameters. Our choice of anomalous transport coefficients is presented in table 1. Fitted density and temperature profiles in the outer equatorial midplane are shown in figure 9. In figure 10, distributions of probe saturation current and electron temperature at the outer divertor plate are shown. The modeling reproduces well the experimental results except for the far SOL. Large temperature and density decay lengths in the far SOL were observed on many tokamaks and have been discussed in the literature. As an example, see the AUG experimental data and modeling results (see [13], figures 2 and 5), where both at the equatorial midplane and outer divertor plate electron temperature have long tails. As a possible mechanism, one can put forward convective transport in the SOL caused by blobs (see [14]), which are generated in the far SOL. Comparison of measured and simulated poloidal currents at the outer divertor plate is shown in the upper graph of figure 11. The experimental data were acquired from seven earthed Langmuir probes located at poloidal intervals of 2.5 cm along the outer divertor plate in segment 3 of the ASDEX Upgrade vacuum vessel. Each probe has a poloidal extension of 5 mm, hence there was only 20% coverage of the region spanned by the probes. To get the continuous spatial coverage in the experimental Jtarget data shown in the upper graph of figure 11, discharges with slow separatrix excursions ≥2 cm with quasi-constant plasma conditions were selected. One сan see that modeling reproduces experimental measurements reasonably well. Current density distribution at the outer plate is similar to that observed in Globus-M, see figures 6 and 7. Currents at the outer and inner plates are compared in the lower graph of figure 11. It can be seen that at the SOL part of the plate, the current density at the inner plate is smaller than that at the outer one. In other words, the current flowing from the outer plate to the inner plate is not conserved within the flux tube, as it should be for thermoelectric current, but partially goes to the PFR due to
  drift and then to the PFR parts of both plates. Hence, part of the current to the plates can be attributed to PCC. Spatial distribution of the poloidal currents is shown in figure 12. The main pattern of the poloidal current distribution for AUG is the same as for DDN configuration in Globus-M.
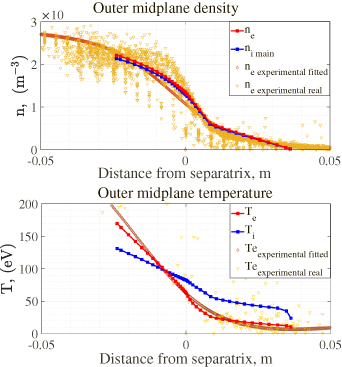
Figure 9. Density and temperature profiles in the outer midplane for L-mode shot N34685. Upper graph—calculated profiles of electron and main ion densities and corresponding experimental data. Here and below, curve corresponds to fitted experimental data, brown one is raw experimental data. Lower graph—calculated profiles of electron and ion temperatures and corresponding experimental data.
Download figure:
Standard image High-resolution image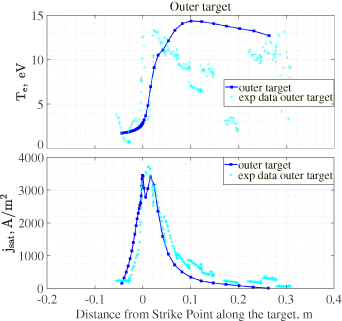
Figure 10. Ion saturation current and electron temperature profiles at the outer target for L-mode shot N34685. Upper graph—calculated ion saturation current profile and corresponding experimental data. Lower graph—calculated electron temperature at the outer divertor target and corresponding experimental data.
Download figure:
Standard image High-resolution image
Figure 11. Current at the targets of AUG L-mode shot N34685. Upper graph—calculated current density and corresponding measurements at the outer target. Lower graph—calculated current density at the outer and inner targets.
Download figure:
Standard image High-resolution image
Figure 12. Poloidal current density for L-mode shot N34685.
Download figure:
Standard image High-resolution imageTable 1. Transport coefficients for L-mode shot N34685.
| The zone/The coeff. | Pedestal | Transport barrier | Near SOL | Far SOL | Below/above the X-point |
|---|---|---|---|---|---|
 , m2 s−1 , m2 s−1
| 0.4 | 0.4 | 0.3 | 1.2 | 1.2 |
 , m2 s−1 , m2 s−1
| 0.8 | 0.8 | 0.4 | 1.6 | 1.2 |
 , m2 s−1 , m2 s−1
| 0.8 | 0.8 | 0.4 | 1.6 | 1.2 |
 , m s−1 , m s−1
| 0.0 | 0.0 | 0.0 | 0.0 | 0.0 |
Current density at the outer plate for similar L-mode shot N34458, discharge power P= 0.5 MW (Pe = 0.3 MW, Pi = 0.2 MW), D fueling rate  , N seeding rate
  is shown in figure 13. Again, reasonable agreement with experiment is observed.
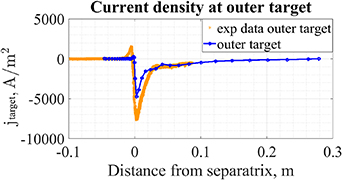
Figure 13. Calculated current density and corresponding measurements at the outer target of AUG L-mode shot N34458.
Download figure:
Standard image High-resolution imageParameters of the simulated H-mode AUG shot N34873 are: discharge power P = 2.5 MW (Pe = 1.5 MW, Pi = 1.0 MW), D fueling rate  , N seeding rate
  . Our choice of anomalous transport coefficients is presented in table 2. Fitted density and temperature profiles at the outer equatorial midplane are shown in figure 14. In figure 15, ion saturation current and electron temperature at the outer divertor plate are presented. Current density distribution at the outer plate is shown in figure 16. Here, in addition to the distribution obtained for the L-mode case, thermoelectric current in combination with PCC type 1, additional current to the outer plate at its SOL part can be seen. In particular, an additional maximum of current density at the SOL part of the plate, corresponding to the current flowing to the plate, is caused by a pair of PCCs of type 2. This pair of currents can be clearly seen in the 2D plot of poloidal currents, in figure 17. In the far SOL the main contribution is from the thermoelectric current.
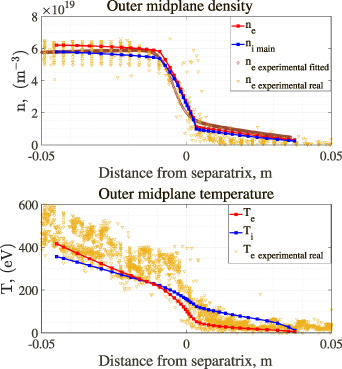
Figure 14. Density and temperature profiles in the outer midplane for H-mode shot N34873. Upper graph—calculated profiles of electron and main ion densities at the outer midplane and corresponding experimental data. Lower graph—calculated profiles of electron and ion temperatures at the outer midplane and corresponding experimental data.
Download figure:
Standard image High-resolution image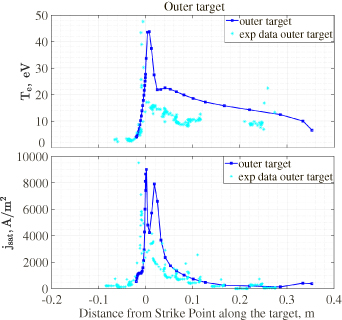
Figure 15. Electron temperature and ion saturation current profiles at the outer target for H-mode shot N34873. Upper graph—calculated ion electron temperature profile and corresponding experimental data. Lower graph—calculated ion saturation current at the outer divertor plate and corresponding experimental data.
Download figure:
Standard image High-resolution image
Figure 16. Calculated current density and corresponding measurements at the outer target of H-mode shot N34873.
Download figure:
Standard image High-resolution image
Figure 17. Poloidal current density for H-mode shot N34873.
Download figure:
Standard image High-resolution imageTable 2. Transport coefficients for H-mode shot N34873.
| The zone/The coeff. | Pedestal | Transport barrier | Near SOL | Far SOL | Below/above the X-point |
|---|---|---|---|---|---|
 , m2 s−1 , m2 s−1
| 0.5 | 0.05 | 0.05 | 1.5 | 1.5 |
 , m2 s−1 , m2 s−1
| 0.9 | 0.45 | 0.36 | 1.44 | 1.44 |
 , m2 s−1 , m2 s−1
| 0.9 | 0.2 | 0.2 | 1.44 | 1.44 |
 , m s−1 , m s−1
| 0.0 | 0.0 | 0.0 | 0.0 | 0.0 |
6. Role of parallel currents in the formation of a potential extremum in the vicinity of the X-point in the detached regime
In strongly detached regimes in the vicinity of the X-point for the normal direction of the magnetic field a potential maximum is observed in the simulations [6]. When the seeding rate is large enough, a cold high-radiating region is observed here, both in the simulations and experiments [15, 16]. As was first discussed in [6], parallel currents and corresponding parallel (poloidal) electric fields are responsible for the formation of the extremum of the potential. Here, we demonstrate this using SOLPS-ITER simulations for AUG-type H-mode 5 MW shot with large N seeding rate. Distribution of the poloidal currents is shown in figure 18. One can see that in the vicinity of the X-point, poloidal currents are directed away from it. Inside and outside the separatrix above the X-point, PS currents (equation (2)) for the normal direction of the magnetic field flow upwards from the X-point. In the PFR, poloidal currents close the vertical  drift current and are directed towards the plates, i.e. away from the X-point. The same is true for currents outside the separatrix but very close to it below the X-point due to some shift of the plasma pressure maximum towards the far SOL. As shown in [6], in the detached cases with low temperatures near the X-point and low parallel conductivity, the parallel electric field approximately corresponds to Ohm's law
  because electron pressure gradient and thermal force can be neglected in the parallel momentum balance for electrons. Let us introduce a dimensionless parameter, which demonstrates how well Ohm's law is satisfied:

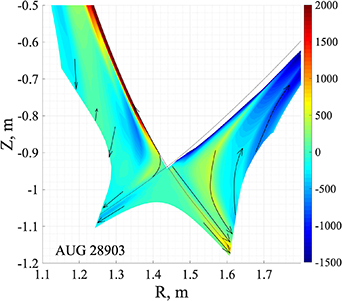
Figure 18. Poloidal current density for H-mode in the detached regime.
Download figure:
Standard image High-resolution imageWhen  , Ohm's law
  is satisfied, for small R in the regions with high parallel сonductivity electric field
  and the potential is of the order of
  . As can be seen from figure 19, in the vicinity of the X-point, parameter R is not far from unity, and, therefore, the parallel electric field has the same direction as parallel current. The poloidal electric field is directed away from the X-point in the core, SOL and PFR, and hence the potential at the X-point should have a maximum. The corresponding potential 2D distribution is shown in figure 20. A potential maximum in the X-point vicinity causes
  drifts around the X-point in the clockwise direction [6], which leads to the redistribution of plasma and impurities. This is especially important in the regimes with a highly radiating X-point.

Figure 19. Parameter R, which demonstrates how well Ohm's law is satisfied.
Download figure:
Standard image High-resolution image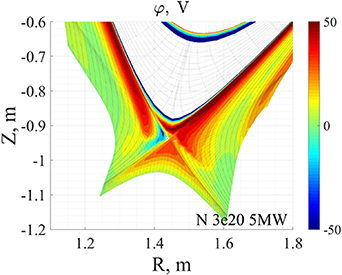
Figure 20. Potential distribution for H-mode in the detached regime.
Download figure:
Standard image High-resolution image
For a reversed magnetic field, poloidal projections of PS currents and poloidal currents in the PFR change their direction, and, therefore, one would expect a potential minimum near the X-point. Such a minimum has been observed in the simulations [17].
7. Conclusion
Currents at the plates are the sum of thermoelectric current and PCC. There are two types of PCC: a-closing  vertical current in the divertor regions, below (above) the X-point in the PFR and SOL, and b-closing radial current in the SOL. Currents at the plates require deviation of the plasma potential from the floating one—edge modeling should be done taking account of currents and electric fields. Parallel currents for low parallel conductivity require poloidal electric fields directed away from the X-point for the normal direction of the magnetic field (towards the X-point for the unfavorable direction). As a result, a maximum (minimum) of the potential is formed in the X-point vicinity causing clockwise
  drifts around the X-point.
Acknowledgments
This work was supported by the Ministry of Science and Higher Education of the Russian Federation in the framework of the state contract in the field of science under Project No. 0784-2020-0020 using the Federal Joint Research Center 'Material science and characterization in advanced technology' (Project No. RFMEFI62119X0021), including the unique scientific facility 'Spherical tokamak Globus-M'.