Ecological Reference Points for Atlantic Menhaden Established Using an Ecosystem Model of Intermediate Complexity
 David Chagaris
 Katie Drew
 Amy Schueller
 Matt Cieri
 Joana Brito
 Andre Buchheister
- 1Nature Coast Biological Station, Institute of Food and Agricultural Sciences, University of Florida, Gainesville, FL, United States
- 2Atlantic States Marine Fisheries Commission, Arlington, VA, United States
- 3National Marine Fisheries Service, Southeast Fisheries Science Center, Beaufort, NC, United States
- 4Maine Department of Marine Resources, Boothbay Harbor, ME, United States
- 5OKEANOS Research Center, University of the Azores, Horta, Portugal
- 6Department of Fisheries Biology, Humboldt State University, Arcata, CA, United States
Atlantic menhaden (Brevoortia tyrannus) are an important forage fish for many predators, and they also support the largest commercial fishery by weight on the U.S. East Coast. Menhaden management has been working toward ecological reference points (ERPs) that account for menhaden’s role in the ecosystem. The goal of this work was to develop menhaden ERPs using ecosystem models. An existing Ecopath with Ecosim model of the Northwest Atlantic Continental Shelf (NWACS) was reduced in complexity from 61 to 17 species/functional groups. The new NWACS model of intermediate complexity for ecosystems (NWACS-MICE) serves to link the dynamics of menhaden with key managed predators. Striped bass (Morone saxatilis) were determined to be most sensitive to menhaden harvest and therefore served as an indicator of ecosystem impacts. ERPs were based on the tradeoff relationship between the equilibrium biomass of striped bass and menhaden fishing mortality (F). The ERPs were defined as the menhaden F rates that maintain striped bass at their biomass target and threshold when striped bass are fished at their Ftarget, and all other modeled species were fished at status quo levels. These correspond to an ERP Ftarget of 0.19 and an ERP Fthreshold of 0.57, which are lower than the single species reference points by 30–40%, but higher than current (2017) menhaden F. The ERPs were then fed back into the age-structured stock assessment model projections to provide information on total allowable catch. The ERPs developed in this study were adopted by the Atlantic menhaden Management Board, marking a shift toward ecosystem-based fishery management for this economically and ecologically important species.
Introduction
Forage fishes are abundant, schooling, mid-trophic level fishes that contribute substantially to the diet of many larger predators and serve central roles in energy transfer within ecosystems, but many forage species are themselves harvested and support some of the largest fisheries in the world. Due to their role in the ecosystem and their environmentally driven fluctuations, forage fish and their management have become a focal issue in the call for ecosystem-based fisheries management (EBFM) approaches (Pikitch et al., 2004; Dickey-Collas et al., 2014; Rice and Duplisea, 2014; National Marine Fisheries Service [NMFS], 2016; Siple et al., 2019). Although several general recommendations have been proposed to guide forage fish harvest rates and management policy (Constable et al., 2000; Cury et al., 2011; Smith et al., 2011; Pikitch et al., 2012), the effect that forage fish harvest has on predator populations remains a subject of debate among scientists (Hilborn et al., 2017; Pikitch et al., 2018). Despite the different viewpoints, there is a consensus that case-specific modeling and research are necessary to address specific ecological considerations and management challenges associated with individual forage fisheries or the systems they reside in (Hilborn et al., 2017; Pikitch et al., 2018).
Multi-species and ecosystem models that account for predator–prey dynamics are essential tools for evaluating the ecological impacts of forage fish harvest policies. However, the added complexity and data requirements of these approaches introduce considerable uncertainty into the management advice they provide. Overly simple models may not provide a good enough representation of the ecosystem and can lead to poor fits and model bias, and reduced stakeholder buy-in; while full end-to-end ecosystem models require an increased understanding of species-environment interactions and have high parameter uncertainty (Collie et al., 2016). Models of intermediate complexity for ecosystem assessment, or MICE models, seek to strike a balance by including only the necessary components to address the main management question(s) (Plagányi et al., 2014). For example, a MICE model of the California Current included three forage species and two predator species and was used to evaluate forage fish management systems and identify key sources of uncertainty (Punt et al., 2016; Kaplan et al., 2019). While MICE models have some clear advantages (speed and ease of use, fewer data requirements, and simpler interpretation), they should be compared to other intermediate and highly complex models of the same system to check against critical model biases (Plagányi et al., 2014; Kaplan et al., 2019).
Atlantic menhaden (Brevoortia tyrannus), members of the Clupeidae family, are a planktivorous schooling fish found in Atlantic waters from Nova Scotia to Florida (Ahrenholz, 1991). They are prey for a wide range of other species, including commercially and recreationally important finfish like striped bass [Morone saxatilis (Hartman and Brandt, 1995) and bluefin tuna (Thunnus thynnus) (Butler et al., 2010), piscivorous birds (Mersmann, 1989; Glass and Watts, 2009), and marine mammals (Gannon and Waples, 2004)]. Atlantic menhaden have been the target of commercial fisheries since the 1800s (Ahrenholz et al., 1987). The majority of landings are taken by the purse-seine reduction fishery, which processes the catch into fish meal and fish oil for aquaculture and animal feed, dietary supplements, and other products. Atlantic menhaden are also harvested by mixed gear fisheries in most states for use as bait in other commercial and recreational fisheries (SEDAR, 2020a). Landings peaked in the mid-1950s at about 700,000 mt per year; over the past decade, total landings have averaged approximately 200,000 mt per year with an average annual value of $40.8 million USD, making Atlantic menhaden the largest fishery by weight on the U.S. East Coast for that time period (National Marine Fisheries Service [NMFS], 2019). Because Atlantic menhaden have been primarily caught in state waters, the species is managed by the Atlantic States Marine Fisheries Commission (ASMFC). ASMFC also manages, solely or jointly with the National Oceanic and Atmospheric Administration (NOAA), several predator species that consume Atlantic menhaden, including striped bass, bluefish (Pomatomus saltatrix), weakfish (Cynoscion regalis), and spiny dogfish (Squalus acanthias).
The role of Atlantic menhaden as a forage species has long been recognized, particularly for striped bass, which is arguably ASMFC’s highest profile predator species. There has been increasing interest from managers and stakeholders in accounting for Atlantic menhaden’s ecosystem services when setting regulations and harvest limits. ASMFC convened a workshop with managers, scientists, and stakeholders to identify ecosystem management objectives for Atlantic menhaden. The objectives included (1) sustaining menhaden to provide for directed fisheries, (2) sustaining menhaden for consumptive needs of predators, (3) sustaining menhaden to provide stability across all fisheries, and (4) minimizing risk due to a changing environment (ASMFC, 2015b). ASMFC has already implemented precautionary measures to achieve these objectives. In 2006, harvest by the purse seine reduction fishery within the Chesapeake Bay was capped due to concerns about localized depletion of Atlantic menhaden in an important predator nursery area (ASMFC, 2005), and in 2017 the coastwide total allowable catch (TAC) was set at a level lower than the TAC at the single-species target F to leave more Atlantic menhaden in the water for predators (ASMFC, 2017). However, these measures were somewhat ad hoc and were not based on quantitative analyses. Developing quantitative ecological reference points (ERPs) that take into account Atlantic menhaden’s role as a forage species remained a high priority for ASMFC.
With the passage of Amendment 3 to the Menhaden Fishery Management Plan in 2017, the ERP workgroup was tasked with developing ERPs for management that account for menhaden’s role as a forage fish. Several models were considered as part of this process. The models ranged from simple to complex and included a time-varying intrinsic growth rate surplus production model (Nesslage and Wilberg, 2019), a two-species surplus production model with predation (Uphoff and Sharov, 2018), a multispecies statistical catch-at-age model (Curti et al., 2013; McNamee, 2018), an Ecopath with Ecosim (EwE) MICE model with a limited number of predator and prey species (described here), and a more holistic EwE model that included many more menhaden predators (Buchheister et al., 2017a,b). Of these, the EwE MICE model was put forward as the recommended tool for developing the ERPs because it included bottom-up effects of menhaden harvest on predators, captured the dynamics of key managed predator species, and can be updated on a timeframe suitable for management (SEDAR, 2020b). This paper describes the development of the final EwE MICE model and its utility in establishing Atlantic menhaden ERPs. The overall goal of this work was to identify tradeoffs associated with Atlantic menhaden harvest and establish management reference points that account for the dietary needs of menhaden predators.
Materials and Methods
Ecopath With Ecosim
We developed a model of intermediate complexity for ecosystem assessment for the Northwest Atlantic Continental Shelf, hereafter called NWACS-MICE, using EwE. EwE is a trophic dynamic modeling package that facilitates management of biomass and food web data for whole ecosystems and has been widely used for analysis of aquatic resources (Pauly et al., 2000; Christensen and Walters, 2004a; Colléter et al., 2015). The Ecopath component of EwE is a static, mass-balance view of the ecosystem that allows for representation of age structure and provides the initial state for dynamic modeling. In Ecopath, the production of each modeled species or functional group is allocated among fishing, predation, other mortality, and migration while maintaining mass-balance between groups. In Ecosim, biomass dynamics are modeled on a monthly time step as a series of differential equations, where the change in biomass for each group is predicted as its consumption minus losses to predation, fishing, migration, and other unexplained natural mortality (Walters et al., 1997). The EwE software package also includes several built-in functions that were utilized in the development of menhaden ERPs. These included the time series fitting routine, equilibrium FMSY analysis (Walters et al., 2005), emergent stock-recruit curves, and batch run processing with the multi-sim plugin. For full details on the underlying theory, assumptions, equations, and model mechanics of EwE see the original sources (Walters et al., 1997; Christensen and Walters, 2004a; Christensen et al., 2005).
In developing menhaden ERPs, it was critical that the chosen model be able to account for top-down predation effects on menhaden as well as the bottom-up effects that menhaden have on their predators. In Ecosim, this is modeled based on foraging arena theory, which states that predator–prey interactions are restricted to spatial and temporal arenas, and movement of prey into the foraging arena determines how much is consumed by predators (Ahrens et al., 2012). The Ecosim vulnerability exchange rate parameters, Vij, describe the exchange rates of prey i from a not vulnerable state into a vulnerable biomass pool where they can be consumed by predator j. The vulnerability parameters control the amount of prey biomass available to predators and therefore regulate consumption, and in turn, the growth and biomass of the predators. Consumption for a predator is mortality for its prey, and the Vij also serve as limits on predation mortality at high predator biomass. Low Vij values restrict flow into the vulnerable state, which thereby limits consumption and prevents any substantial biomass gains in the predator. Large Vij values result in stronger top-down predation effects because the exchange rate of prey into the vulnerable biomass pool is high, allowing for prey biomass to be quickly exhausted by predators.
Other Ecosim parameters that factor into the foraging arena equations include foraging time adjustment (FTA) and prey switching. FTA allows groups to spend less time feeding when their densities are low or when food density increases, which lowers exposure to predation under those conditions (i.e., FTA regulates the tradeoff between growth vs. survival). Additionally, the time spent feeding can be directly responsive to changes in predator abundance (risk-sensitive feeding) and some proportion of unexplained mortality can be allowed to vary with feeding time (stronger density-dependence in natural mortality, M). Prey switching is said to occur when predator diets change disproportionately to the relative abundance of their prey. In Ecosim, this is accomplished by modifying the search rates, aijt, of predator j in relation to changes in biomass B of prey i over time t using a power function , where the predator switching power parameter (Pj) can range between zero (constant aij) and two (fast response). In our analysis, prey switching allowed us to explore whether impacts of menhaden harvest on predators might be moderated by the ability of predators to quickly switch to other prey resources.
The NWACS-MICE Model
Spatial Domain and Functional Groups
The spatial domain for the model spans the continental shelf of the Northwest Atlantic Ocean from North Carolina to Maine including the Mid-Atlantic Bight, Southern New England, Georges Bank, and Gulf of Maine subregions. The model implicitly represents major estuaries along the coastline, such as the Chesapeake Bay, Delaware Bay, and Long Island Sound, given that diet and biomass data from estuaries were included in the model parameterization. Although the domain does not encompass the entire distributional range of Atlantic menhaden (from Florida to Nova Scotia), it is similar to the range of a multispecies virtual population analysis model developed for Atlantic menhaden (Garrison et al., 2010) and of existing ecosystem models for the region (Link et al., 2008, 2010). This domain relies on the natural faunal and oceanographic break in North Carolina (Longhurst, 2010), while also including the bulk of historical Atlantic menhaden fishing effort concentrated in the Chesapeake Bay and the Mid-Atlantic (SEDAR, 2020a).
An original EwE model of the NWACS was previously developed to inform Atlantic menhaden management in an ecosystem context (Buchheister et al., 2017a,b). The original NWACS model leveraged previous Ecopath models developed for the region (Link et al., 2008). The model consisted of 48 different functional or species groups, with several important species modeled using age stanzas (for a total of 61 unique groups). The model was calibrated to data from 1982 to 2013 and was partially updated to include data through 2017 for key species as part of the Atlantic menhaden ERP development (SEDAR, 2020b). The original NWACS model served as a basis for developing the NWACS-MICE model, which was restricted to focus on key managed species that are connected through food web interactions. The NWACS-MICE model simulated the dynamics of 17 biomass pools including Atlantic menhaden (ages 0 and 1+), striped bass (ages 0–1, 2–5, and 6+), spiny dogfish, bluefish (ages 0 and 1+), weakfish (ages 0 and 1+), Atlantic herring (Clupea harengus, ages 0 and 1+), anchovies (Anchoa spp.), benthic invertebrates, zooplankton, phytoplankton, and detritus (Table 1). Striped bass, menhaden, spiny dogfish, bluefish, weakfish, and Atlantic herring are managed, or co-managed, by the ASMFC, and regularly undergo formal stock assessments. Of these, striped bass, spiny dogfish, bluefish, and weakfish were identified as major consumers of Atlantic menhaden based on an analysis of diet data (SEDAR, 2020b) from the NOAA Northeast Fisheries Science Center food habits database1. These six species are hereafter referred to collectively as the ERP complex. Multiple age stanzas were used to represent basic trophic ontogeny, fishery selectivity, and age-dependent predation for these key species. Anchovies were also included because they are an important prey item for species in the ERP complex. A separate fishing “fleet” for each species in the ERP complex was included in the NWACS-MICE model, where each fleet only captured a single target species and landings included both harvests and dead discards combined overall gear types and fishing sectors.
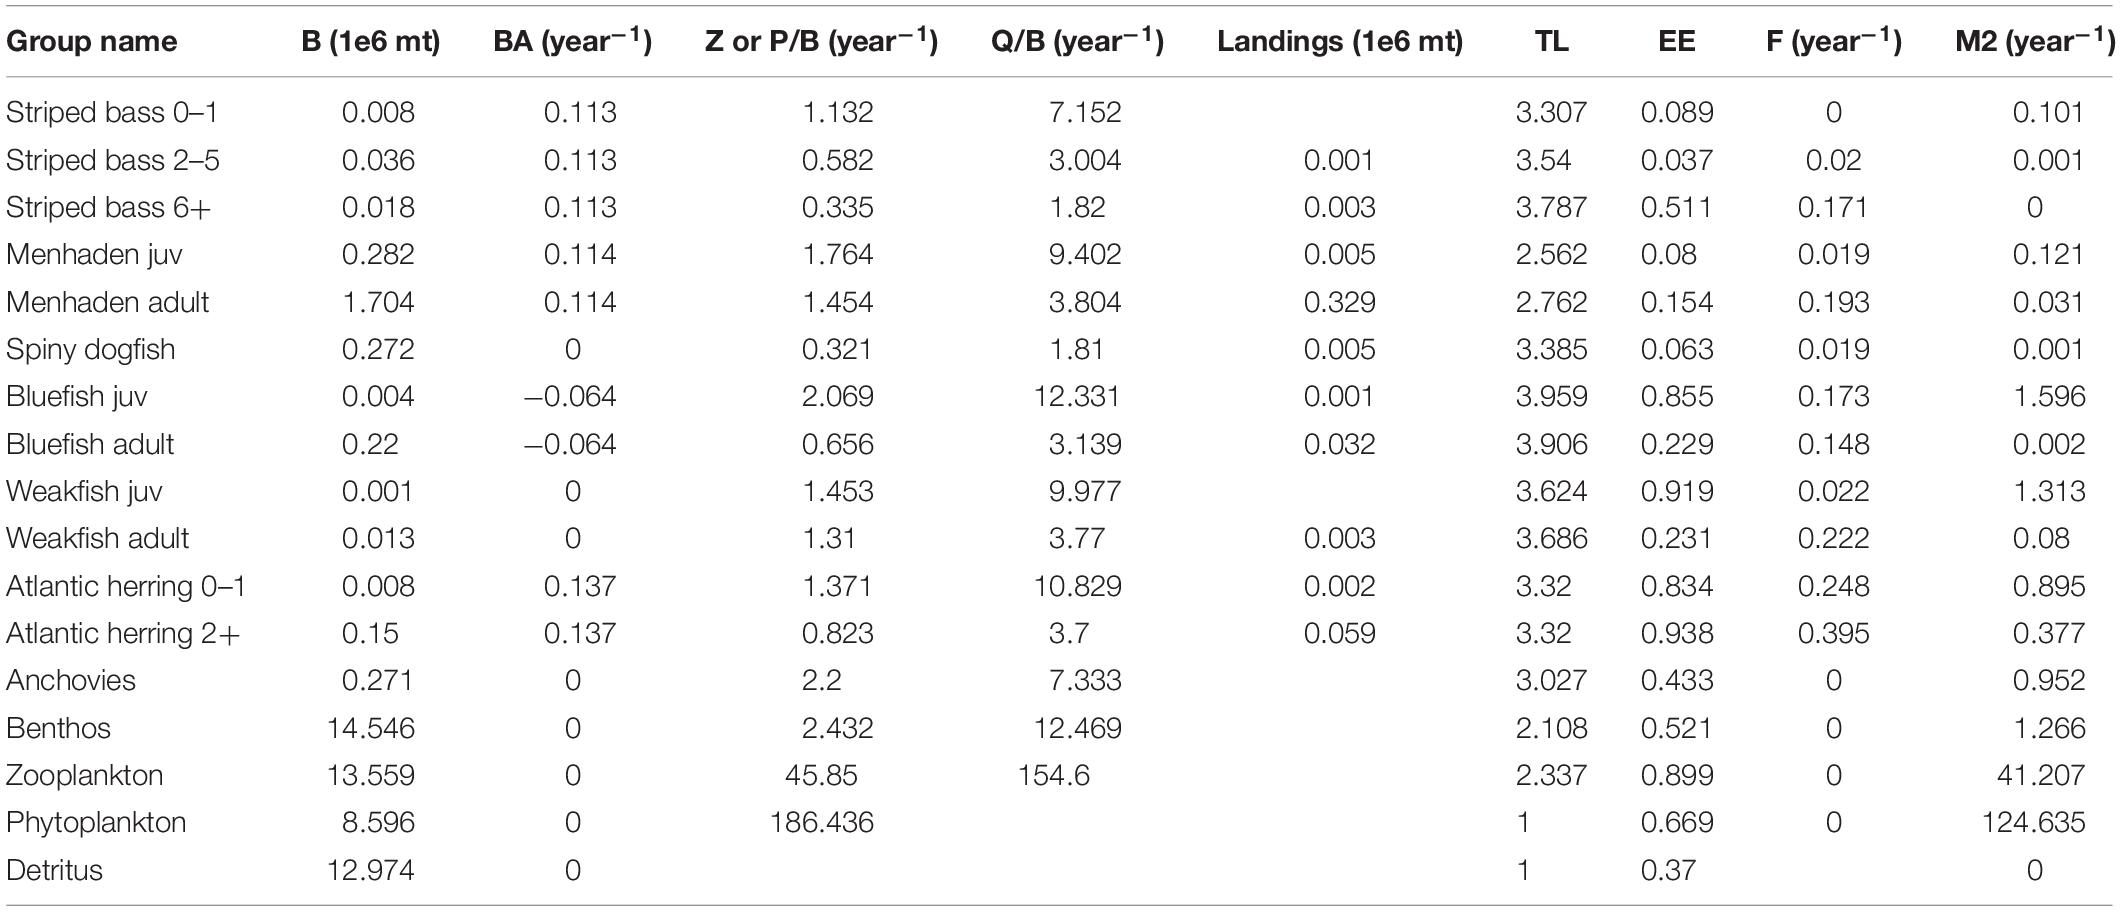
Table 1. Basic inputs and estimates from the NWACS-MICE Ecopath model, including biomass (B), biomass accumulation (BA), production to biomass ratio (PB) or total mortality rate (Z), consumption to biomass ratio (QB), trophic level (TL), ecotrophic efficiency (EE), fishing mortality (F), and predation mortality (M2).
Ecopath Model Inputs
The basic data requirements for Ecopath are biomass (B), production to biomass ratio (PB) or total mortality rate (Z), consumption to biomass ratio (QB), diet composition (DC), and landings for each model group. Biomass accumulation (BA) was included to represent non-equilibrium changes in biomass occurring over the Ecopath base year. The NWACS-MICE Ecopath model base year was 1985, which is the earliest common year in all stock assessments for the ERP complex. Biomass inputs (million metric tons) were obtained either directly from stock assessments or by simply adding the biomass of lower trophic level groups from the original NWACS model. For all the assessed species, biomasses were taken directly from the single-species stock assessments (ASMFC, 2015a, 2019b; Northeast Fisheries Science Center [NEFSC], 2018, 2019a,b; SEDAR, 2020a) and summed by age for each Ecopath age stanza. For multi stanza groups, biomass was only input for a single age stanza (usually the oldest) and then calculated by Ecopath for other stanzas based on input growth and mortality parameters. Details for biomass calculations of each group are provided in the Supplementary Materials.
Biomass accumulation was input to represent non-stationarity within the Ecopath base year of 1985. BA is a flow term expressed as a rate of change, where a negative value signifies biomass depletion during the base year and a positive value indicates biomass gains. For multi-stanza groups, high BA will shift the calculated age distribution to younger ages, representing a strong year class during the Ecopath base year and leading to initial increases during the first few years of an Ecosim simulation. Biomass accumulation was entered for all species in the ERP complex except weakfish and spiny dogfish (Table 1), which according to time series data, showed little change during the base year. The input BA rates were calculated from the stock assessment model output as (B1986/B1985)-1, where B was the total biomass of all ages.
In Ecopath, PB ratios and total mortality rates are used interchangeably because the two values are equal under the assumption of equilibrium (Allen, 1971). Mortality rates for species in the ERP complex were entered as annual total instantaneous mortality, Z, where Z = F + M. Age-specific M was available from each species’ stock assessment. For multi stanza groups, M was taken as the average over all ages in each stanza weighted by the 1985 mean numbers-at-age (Table 1). In the case of Atlantic herring, the 2018 assessment used a constant M, thus, the age-varying M vector was taken from the previous stock assessment conducted in 2015, which used the Lorenzen (1996) estimator (Deroba, 2015; Northeast Fisheries Science Center [NEFSC], 2018). Spiny dogfish and anchovy M were taken directly from the original NWACS model, and the PB of the invertebrate and zooplankton groups were taken as the average PB of the inclusive groups from the original NWACS model, weighted by the biomass of those groups. The PB ratio for phytoplankton was taken directly from the original NWACS model. Fishing mortality, F, for each species in the ERP complex was calculated from stock assessment output as the sum of landings for each stanza divided by the average (or mid-year) biomass of each stanza. These F rates were added to numbers-weighted mean M to obtain the input Z values.
The Ecopath diet matrix describes the proportion of each prey i in the diet of predator j, DCij. The diet matrix of the original NWACS model was simplified for the NWACS-MICE model by first summing the DCij across NWACS-MICE prey groups and then averaging across NWACS-MICE predators, weighted by total consumption of each predator (Supplementary Table S1). Any diet proportions of a prey type included in the original NWACS model but not in the MICE model were assigned to diet import, which represents a constant proportion of consumption that is obtained from outside the modeled system. Consumption rates, QB, were input for all consumer groups and taken directly from the original NWACS model (Table 1). For multi-stanza species QB was entered for the leading stanza only and calculated for other ages based on input biomass, mortality, and growth parameters. For aggregate groups (inverts and zooplankton) the QB was taken as the weighted average QB for inclusive groups from the original NWACS model weighted by the biomass of each group. Lastly, landings were included for the ERP complex species (Table 1) and derived from stock assessment outputs by summing the 1985 landings-at-age across ages within each stanza.
Time Series Data
The NWACS-MICE Ecosim model was calibrated to time series of observed abundance and catch from 1985 to 2017 using species and age-specific time series of fishing mortality as forcing functions. A total of 18 indices of abundance and 10 catch time series were used as reference data during model calibration (Supplementary Table S2, SEDAR, 2020b). Relative abundance time series for species in the ERP complex were obtained from fisheries independent surveys and recreational creel surveys as reported in the stock assessments. Given that some species had many such time series, we included no more than two times series that were recommended by the ASMFC’s Species Technical Committees as the most representative for each species. Catch time series were assembled from the stock assessment report files as the landings and dead discards in weight, summed over all gears and age classes for each stanza. Fishing mortality was used as a forcing time series in Ecosim for all harvested species except spiny dogfish, which used catch forcing instead because F estimates were not available. Time series weights (one for each reference time series) were derived from the year-specific coefficient of variation (CV) for each survey, calculated as the inverse of the mean CV over all available years (i.e., 1/CV) such that more precise data streams had higher weights and thus more influence on model fit.
Ecosim Calibration Procedure
Fitting an Ecosim model begins by first identifying the most sensitive Vij parameters and then estimating those parameters to improve the model’s goodness-of-fit as assessed by the sum of squared differences (SS) between predicted and observed biomass and catch time series. As a conservative approach, it has been recommended to only estimate K-1 parameters (Heymans et al., 2016), where K is the number of reference time series (i.e., observed biomass and catch) used to tune the model. Ecosim models are prone to local minima in SS, thus requiring repeated vulnerability searches to find model convergence. Therefore, a “repeated search” methodology (described in the Supplementary Materials) was implemented where the sensitivity and estimation routine was repeated until no further improvement in the SS and AIC was obtained. The vulnerabilities were reset to their default value of 2 and the repeated search was initiated after any changes were made to Ecopath inputs, FTA parameters, prey switching parameters, or time series forcing functions.
When calibrating Ecosim models, the Vij parameters are often estimated at extremely high values (1 × 10⁹) during the fitting process, which may result in theoretical predation rates far above the prey’s Z when predator biomass is high. While this may improve the SS measure-of-fit over the period of observed data, the high Vij could lead to dynamic instability, exaggerated top-down effects, and groups crashing entirely when projecting extreme fishing or environmental scenarios. To correct for this, we set an upper limit to the vulnerability parameters to prevent the theoretical maximum predation mortality from exceeding the natural mortality of the prey (see the Supplementary Materials for details). Additionally, Vij estimated at the lower bound of 1.0 can be problematic in projections scenarios and often causes species to be unresponsive to fishing; therefore a minimum vulnerability of 1.02 was used.
Ecosim Base Run Configuration
Over 30 different Ecosim configurations were tested during the development of the NWACS-MICE model representing alternative inputs and assumptions for diet composition, foraging time adjustments, prey switching, vulnerability caps, primary production anomalies, seasonal prey availability, and recruitment deviations (Supplementary Table S3). Each model was fit following the repeated search methodology and then adjusted by applying the minimum vulnerability of 1.02 and the upper Vij limit described above and in the Supplementary Materials. We began by fitting Ecosim with recommended default settings which included FTA of 0.5 for the youngest age stanzas only, which allows for compensatory improvements in juvenile survival at low stock sizes due to density-dependent foraging behavior (Christensen et al., 2005). Next, we fit a series of models that included prey switching to simulate a process where predators may switch to more abundant prey items when menhaden abundance is low, thereby mitigating some of the negative effects that menhaden harvest may have on predator populations. Separate NWACS-MICE models were fit with prey switching power Pj values of 0.5, 1, and 1.5 applied to all menhaden predators. Of the values considered, Pj = 1 (run 5) resulted in the lowest SS and was the setting used in the base run.
To determine whether the estimated Vij’s might cause dynamic instability, we also inspected emergent properties of the model as additional diagnostics to the Ecosim SS, following best practices of Heymans et al. (2016). This included an equilibrium FMSY analysis (Walters et al., 2005) applied to each species in the ERP complex by running long term simulations over a range of F values (see Supplementary Materials); an evaluation of emergent stock recruit curves in Ecosim (Walters and Martell, 2004); and checking whether Ecosim could generate expected biomass responses when species were fished at their proxy single-species reference points.
The final base run (run 8) was fitted with prey switching power Pj = 1 and vulnerability limits applied (lower Vij = 1.02 and upper Vij with M2cap = 1), plus a few manual adjustments to parameters that improved model stability and emergent property diagnostics. The manual changes were arrived at through an iterative process and included: setting the proportion of other mortality (M0) sensitive to foraging time equal to zero and predator effect on foraging time equal to 1 for juvenile striped bass (e.g., risk-sensitive foraging time and lower density-dependence in M); and raising the minimum Vij limit slightly from 1.02 to 1.3 for the menhaden-zooplankton interactions, to 1.05 for spiny dogfish, to 1.1 for bluefish, and 1.5 for weakfish. These small increases in the minimum Vij were found to improve diagnostics in the single species projection scenarios and equilibrium FMSY analysis.
Management Scenarios
Establishing the ERPs
Of the species in the ERP complex, striped bass was the most responsive to changes in Atlantic menhaden F. This was supported by analysis from the original NWACS model that evaluated a broader suite of species and found that striped bass and nearshore piscivorous birds were the most sensitive menhaden predators, with both showing similar responses to increases in menhaden F (Buchheister et al., 2017a). Therefore, striped bass was used as an indicator of the impacts of Atlantic menhaden fishing pressure on the ecosystem for the development of ERPs using the NWACS-MICE model. ERPs based on striped bass biomass were assumed to also sustain other species in the ecosystem that were less sensitive to levels of Atlantic menhaden removals.
Projections were run with the NWACS-MICE Ecosim model from 2018 to 2057 over a range of Atlantic menhaden and striped bass F. In these simulations, striped bass F ranged from 0 to 2 times F2017, and Atlantic menhaden F ranged from 0 to 10 times F2017. Bluefish, weakfish, spiny dogfish, and Atlantic herring were held constant at F2017 in these projections. For striped bass, which has two harvested age stanzas, the F multipliers were applied to each stanza (i.e., a F multiplier of 0.5 would be a 50% reduction in F2017 for all harvested age stanzas). For each simulation, a biomass ratio for striped bass was calculated as age 6+ biomass in the terminal year of the projection divided by the Ecosim target age 6+ biomass, where the Ecosim biomass target was based on the ratio of Btarget/B2017 = 1.58 from the stock assessment (Northeast Fisheries Science Center [NEFSC], 2019a). Biomass of striped bass age 6+ from the NWACS-MICE model was treated as a proxy for spawning stock biomass reference points, since females mature between ages 4 to 8. Similarly, the biomass of bluefish and weakfish were predicted as a function of striped bass and Atlantic menhaden F and expressed as ratios to their single species reference points. For bluefish we used the biomass target (2.06∗B2017) and for weakfish we used the biomass threshold (3.58∗B2017) from their respective stock assessments (ASMFC, 2019b; Northeast Fisheries Science Center [NEFSC], 2019b) as the single species reference points.
The menhaden ERPs were based on the relationship of striped bass biomass to menhaden fishing mortality, when striped bass are fished at their single-species Ftarget (0.635∗F2017) and all other species in the ERP complex were held constant at F2017. Thus, we defined the ERP Ftarget as the maximum Atlantic menhaden F that maintains striped bass at their biomass target, when striped bass are fished at Ftarget and all other species were fished at 2017 rates. The ERP Fthreshold was defined as the maximum Atlantic menhaden F that maintains striped bass at their biomass threshold when striped bass are fished at Ftarget.
Total Allowable Catch Projections
Atlantic menhaden are managed using a coastwide total allowable catch (TAC); as a consequence, the menhaden ERPs must provide decision support for setting the coastwide TAC. Therefore, we used stock assessment model projections to determine the probability that the single species Ftarget and Fthreshold would exceed the ERP F rates from Ecosim and to estimate the TAC with a 50% probability of exceeding the ERP Ftarget. The single species stock assessment for Atlantic menhaden was conducted using the Beaufort Assessment Model (BAM), which is an age-structured statistical catch-at-age model fitted to landings, age composition, length composition, and index data (SEDAR, 2020a). Uncertainty in the single species assessment was determined through a Monte Carlo bootstrapping (MCB) procedure, whereby uncertainty in input data and model parameters such as M were bootstrapped to provide distributions around estimated time series such as recruitment, biomass, and estimated parameters. The projections used the base run of the BAM model, as well as the individual runs from the MCB procedure, to forward project abundance at age from the terminal year of the assessment, using total instantaneous mortality, Z. Total instantaneous mortality was the sum of natural mortality, a specified input, and fishing mortality, a value that was solved for during the projection analyses. Recruitment was projected using non-linear time series analysis (Deyle et al., 2018). The projections allowed for determining the risk of exceeding a value of F under specified TAC values. Annual TACs were established using MCB runs from the BAM with a specified probability (usually 50%) of exceeding the single species and ERP Ftarget or Fthreshold values (SEDAR, 2020a). Projections were run from 2018 to 2022, using actual landings in 2018–2019 and applying the 216,000 mt TAC in 2020 to project the TAC for 2021–2022. Lastly, menhaden stock status is based on reproductive output. Therefore, fecundity-based biological reference points were also generated for the associated Ftarget and Fthreshold using equilibrium calculations for spawning potential ratio (SPR) where population fecundity was calculated based on a function of mean weight-at-age, spawning frequency, and maturity (Gartland et al., 2019; SEDAR, 2020a).
Results
Ecopath Mortality Rates and the Ecotrophic Efficiency of Menhaden
Predation mortality (M2) for Atlantic menhaden calculated by the NWACS-MICE Ecopath for 1985 conditions was 0.121 for juveniles and 0.031 for adults age 1+ (Table 1 and Figure 1). Striped bass (all ages combined) and adult bluefish accounted for 36% and 55% of juvenile menhaden M2, respectively, with the other two predators (dogfish and weakfish) accounting for the remaining 9% of menhaden M2 (Figure 1). Predation mortality of adult menhaden was partitioned to 64% adult bluefish and 30% striped bass (Figure 1). The low M2 of Atlantic menhaden in the NWACS-MICE model resulted in ecotrophic efficiencies of 0.08 and 0.15 for juvenile and age 1+ menhaden (Table 1), respectively, meaning that 92% and 85% of the total mortality is unexplained in the model. Bluefish, spiny dogfish, and striped bass accounted for most of the predation mortality overall in the Ecopath model (Figure 1). In fact, bluefish accounted for the largest percentage of M2 on menhaden, juvenile bluefish, and weakfish. Striped bass contributed to at least 20% of the M2 on juvenile striped bass, menhaden, and juvenile weakfish. Predation mortality for the other forage group in the ERP complex, Atlantic herring, was higher than menhaden, with 0.895 for juveniles and 0.377 for adults (Table 1), with most of the mortality coming from spiny dogfish and bluefish (Figure 1). Even though Atlantic herring contribute to a smaller portion of the predator diets compared to menhaden, their M2 rates are higher because biomass is an order of magnitude lower than menhaden (Table 1).
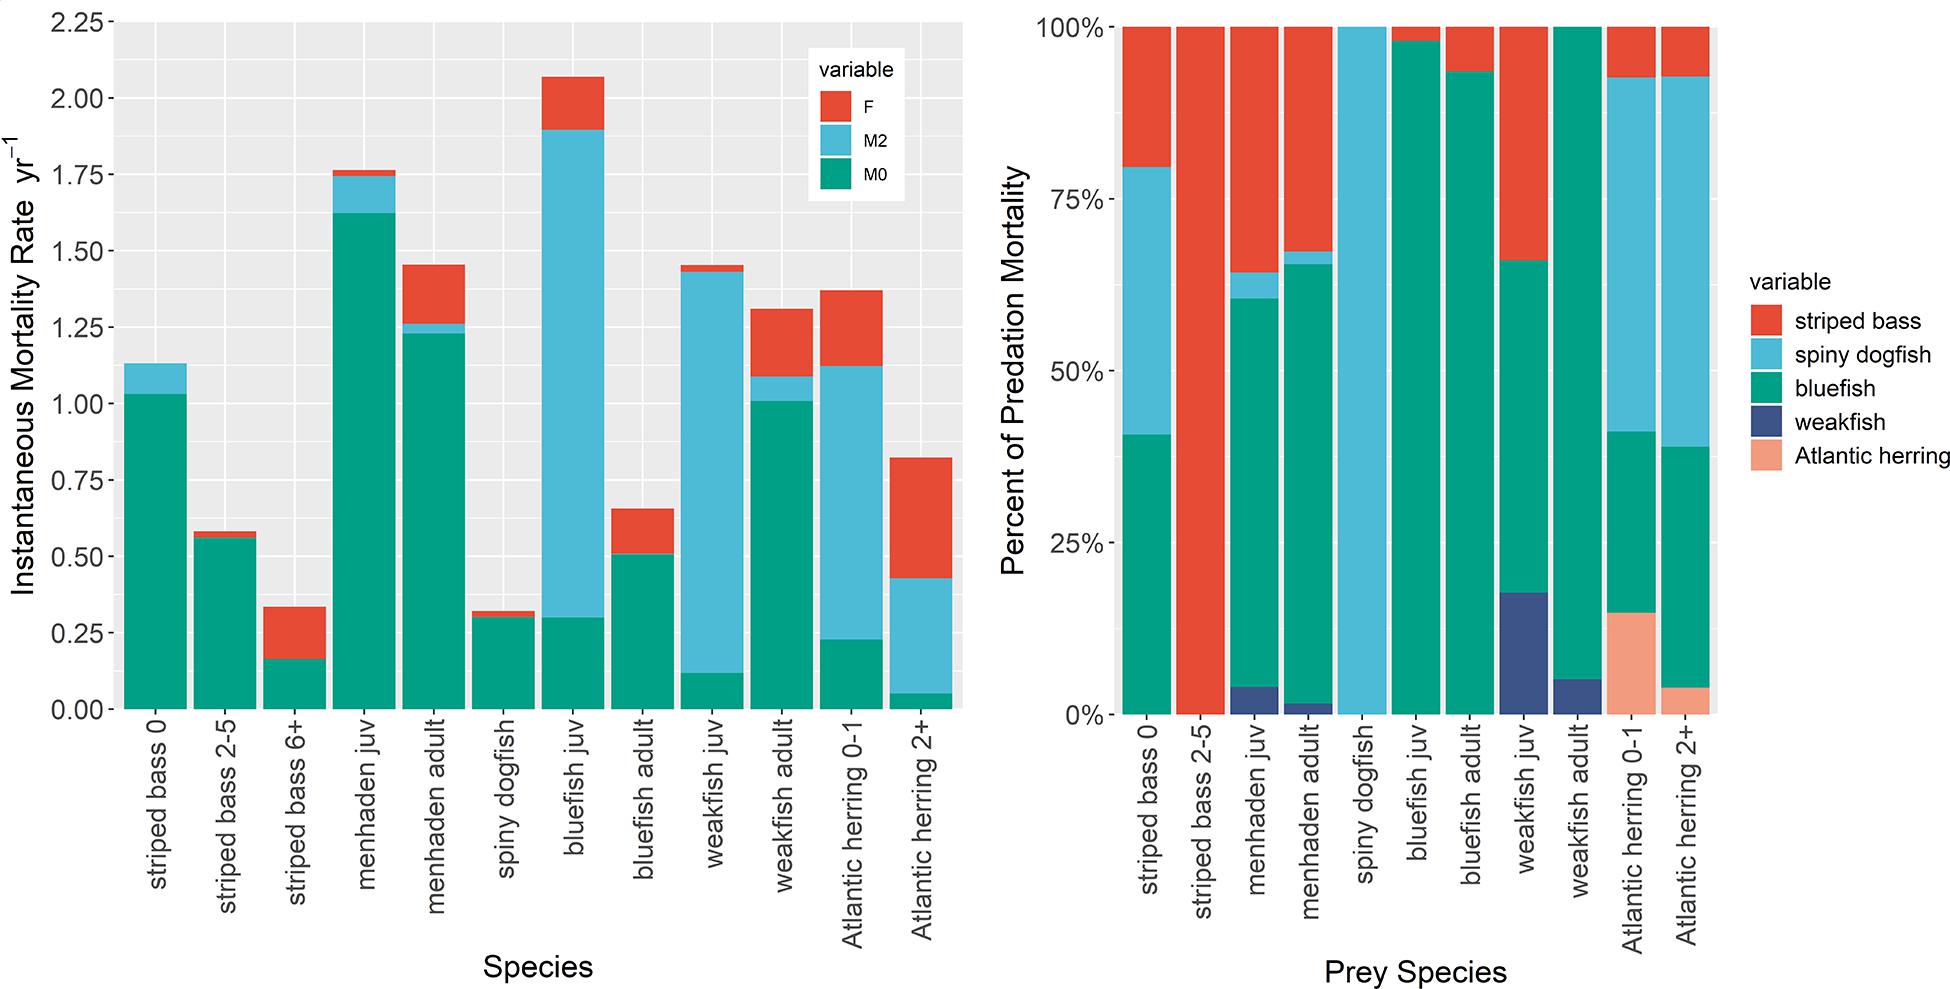
Figure 1. Mortality components of species in the ERP complex from the NWACS-MICE Ecopath model describing (Left) how mortality is partitioned among fishing (F), predation (M2), and other ‘unexplained’ mortalities (M0). The predation mortality component is further partitioned into predator species, combined over age stanzas (Right).
Predation mortality rates were low (<0.002) for the adult age stanzas of predator species in the ERP complex (striped bass, dogfish, and bluefish; Table 1), which is expected for these larger species that have fewer predators, many of which were excluded from the NWACS-MICE model. Predation mortality on juvenile stanzas was generally higher than adults, with juvenile bluefish and weakfish having a high M2, 1.6, and 1.3, respectively (Figure 2). Predation on striped bass juveniles was poorly explained by the model and represented only about 10% of the total mortality, with virtually no predation on the sub-adults. Weakfish, which function in the model as both predator and prey, had a slightly higher M2 in the adult stanza (M2 = 0.08) than the other ERP predator species (Table 1).
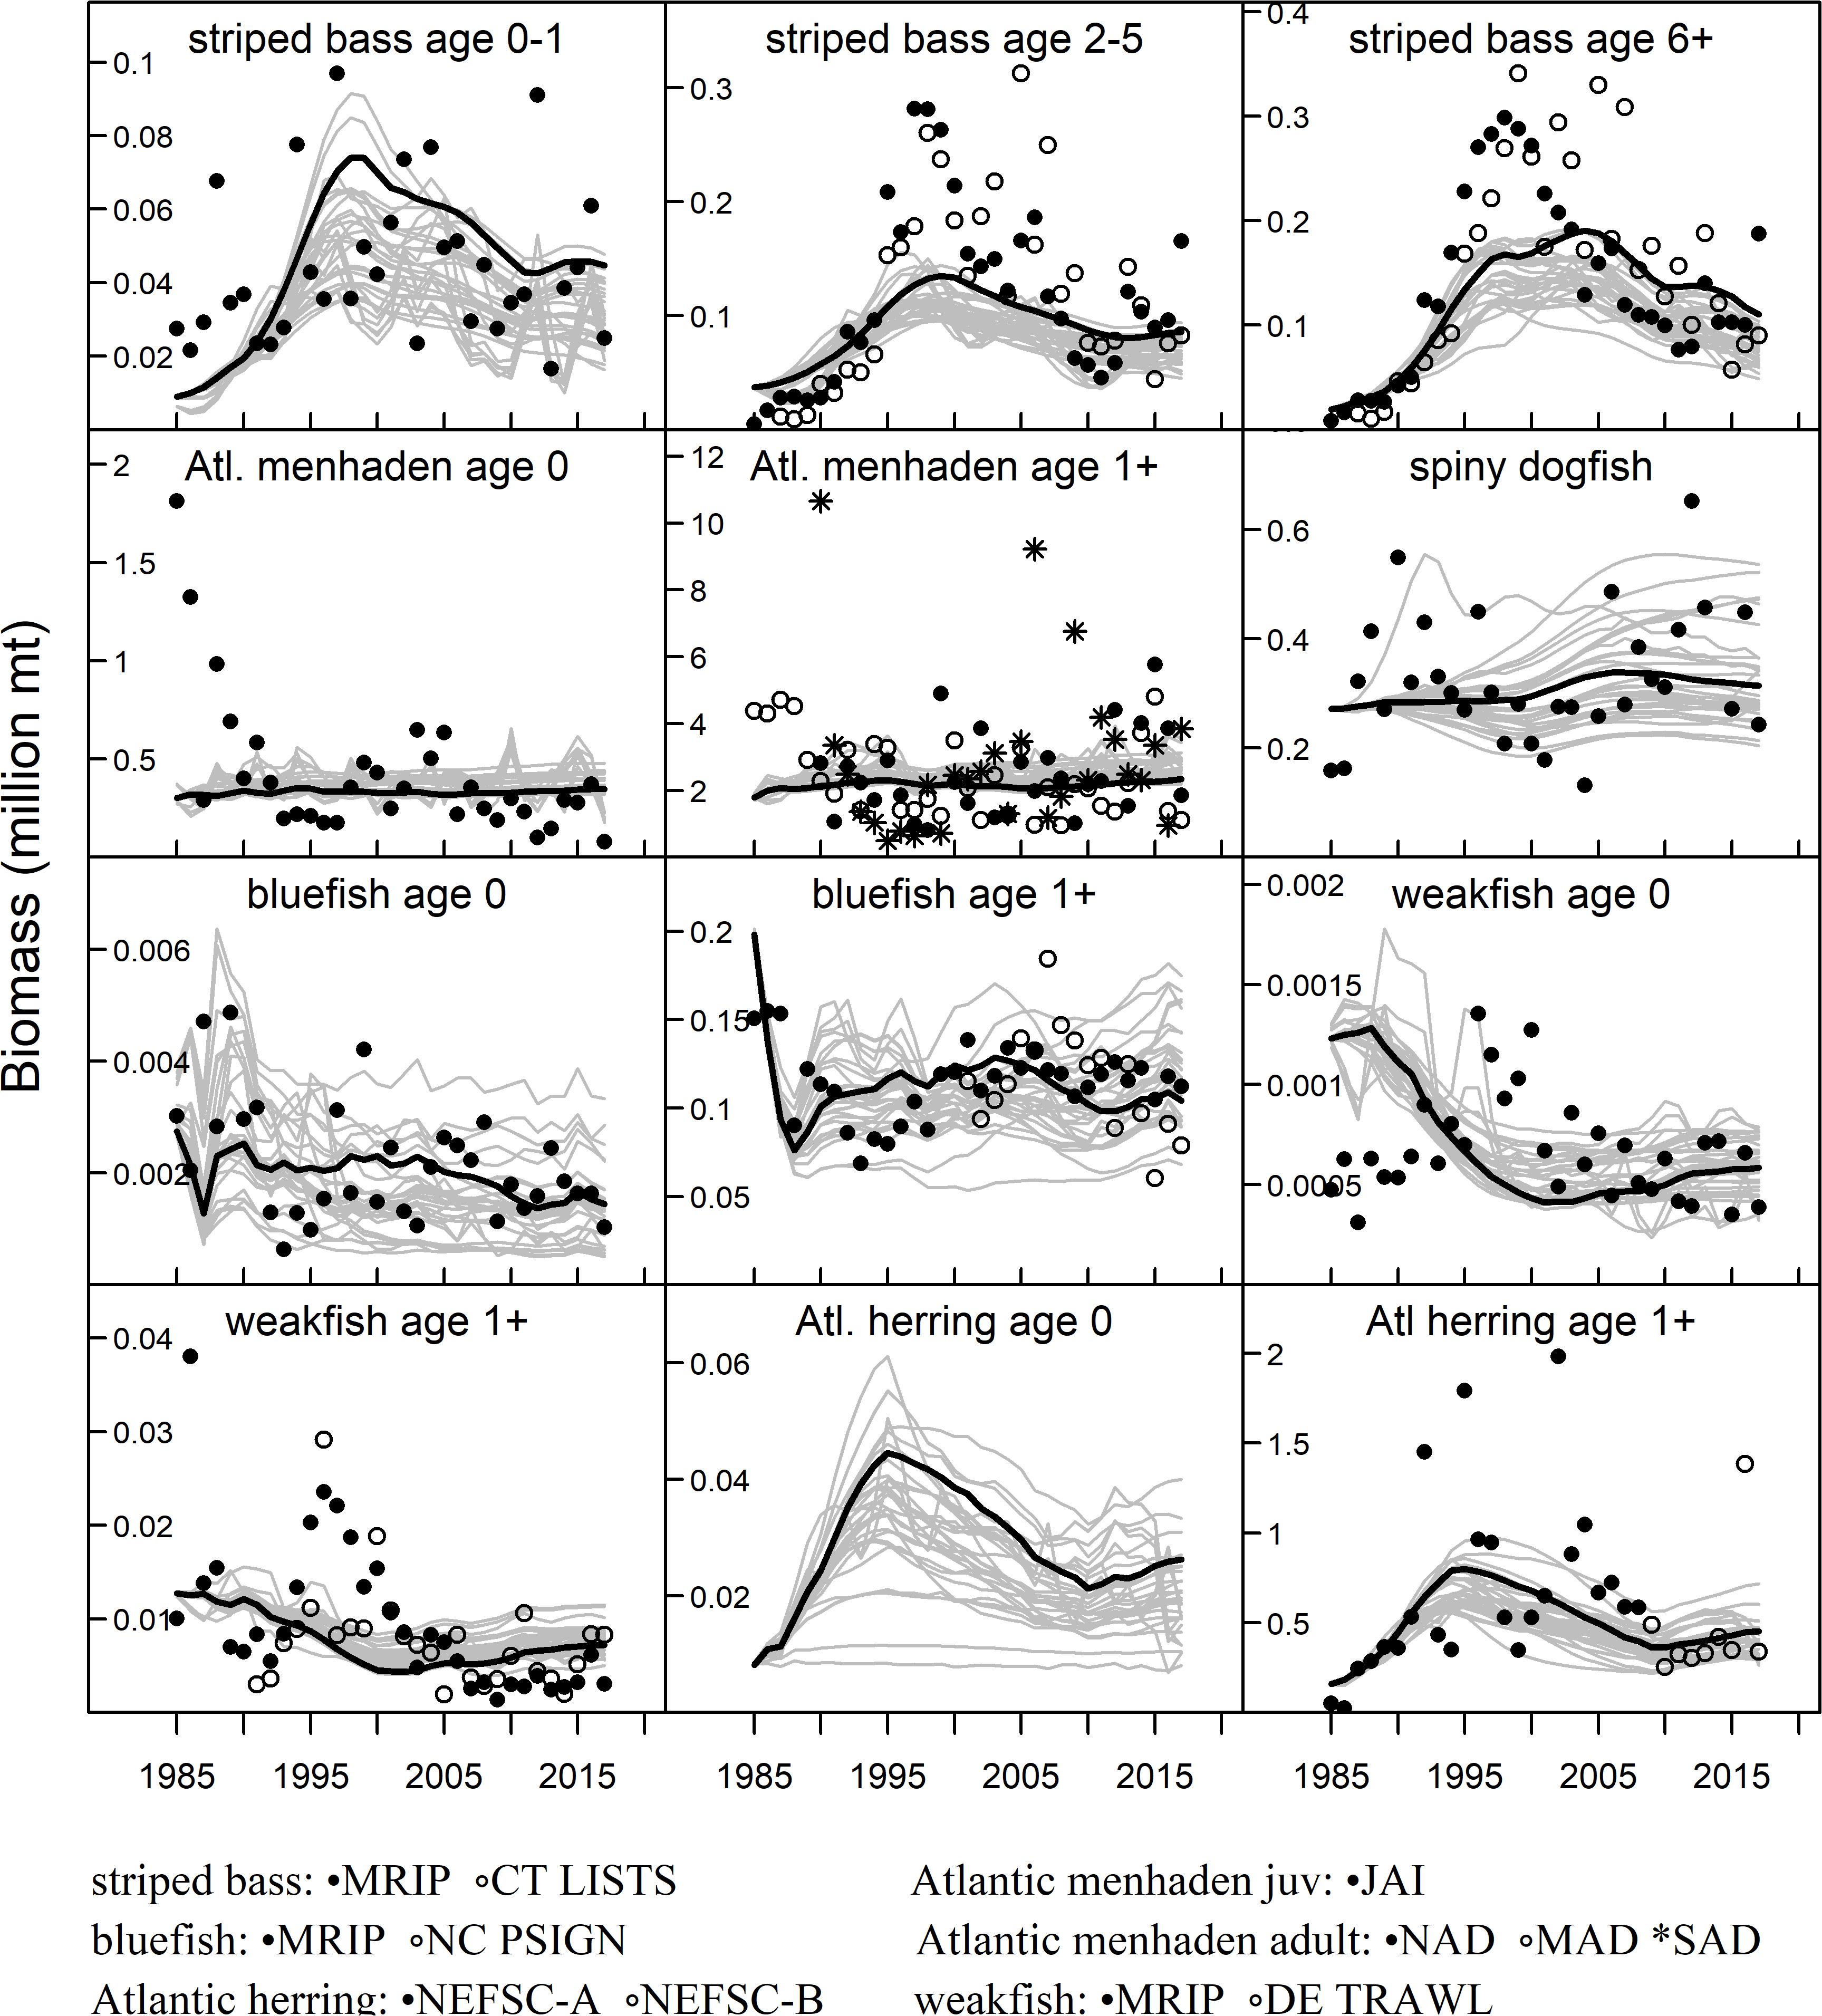
Figure 2. NWACS-MICE Ecosim model fits to relative abundance indices for species in the ERP complex. The solid black line is the base run model (run 8) and the gray lines are the biomass trajectories from all 32 fitted Ecosim models. Observed data are from the Marine Recreational Information Program (MRIP), the Connecticut Long Island Sound Trawl Survey (CT LISTS), the North Carolina Pamlico Sound Inshore Gillnet survey (NC PSIGN), a combined menhaden juvenile abundance index (JAI), combined menhaden adult indices for the northern, mid-Atlantic, and southern regions (NAD, MAD, SAD), the Northeast Fisheries Science Center trawl survey (NEFSC, 2 time periods), and the Delaware Sound Trawl Survey (DE TRAWL).
Model Fits to Time Series
The NWACS-MICE Ecosim model produced reasonably good fits to the observed indices of abundance and catch data (Figures 2, 3). The weighted sum of squares (SS) from all 32 fitted models ranged between 1031 and 1327, with the base run SS = 1186 (Supplementary Table S3). Six of the seven lowest SS were obtained from exploratory scenarios that included annual primary production anomalies or forced annual deviations in juvenile survival that allowed the model to better track interannual variability. Of the models developed for management (runs 1–14), the lowest SS was for run 5 (SS = 1088) with prey switching Pj = 1 and no vulnerability limits applied. However, the equilibrium FMSY output for run 5 (Supplementary Figure S1) demonstrated model instability at high fishing mortality rates on Atlantic menhaden and striped bass, as well as a general lack of sensitivity to fishing for weakfish and bluefish. As previously mentioned, this instability was associated with vulnerability parameters estimated at the lower bound of 1.0. Subsequently, manual adjustments were made to the vulnerabilities and foraging time adjustment parameters in runs 6 and 7 (Supplementary Table S3), eventually leading to the base run 8 that had a higher SS but improved stability at high menhaden F in the equilibrium FMSY analysis.
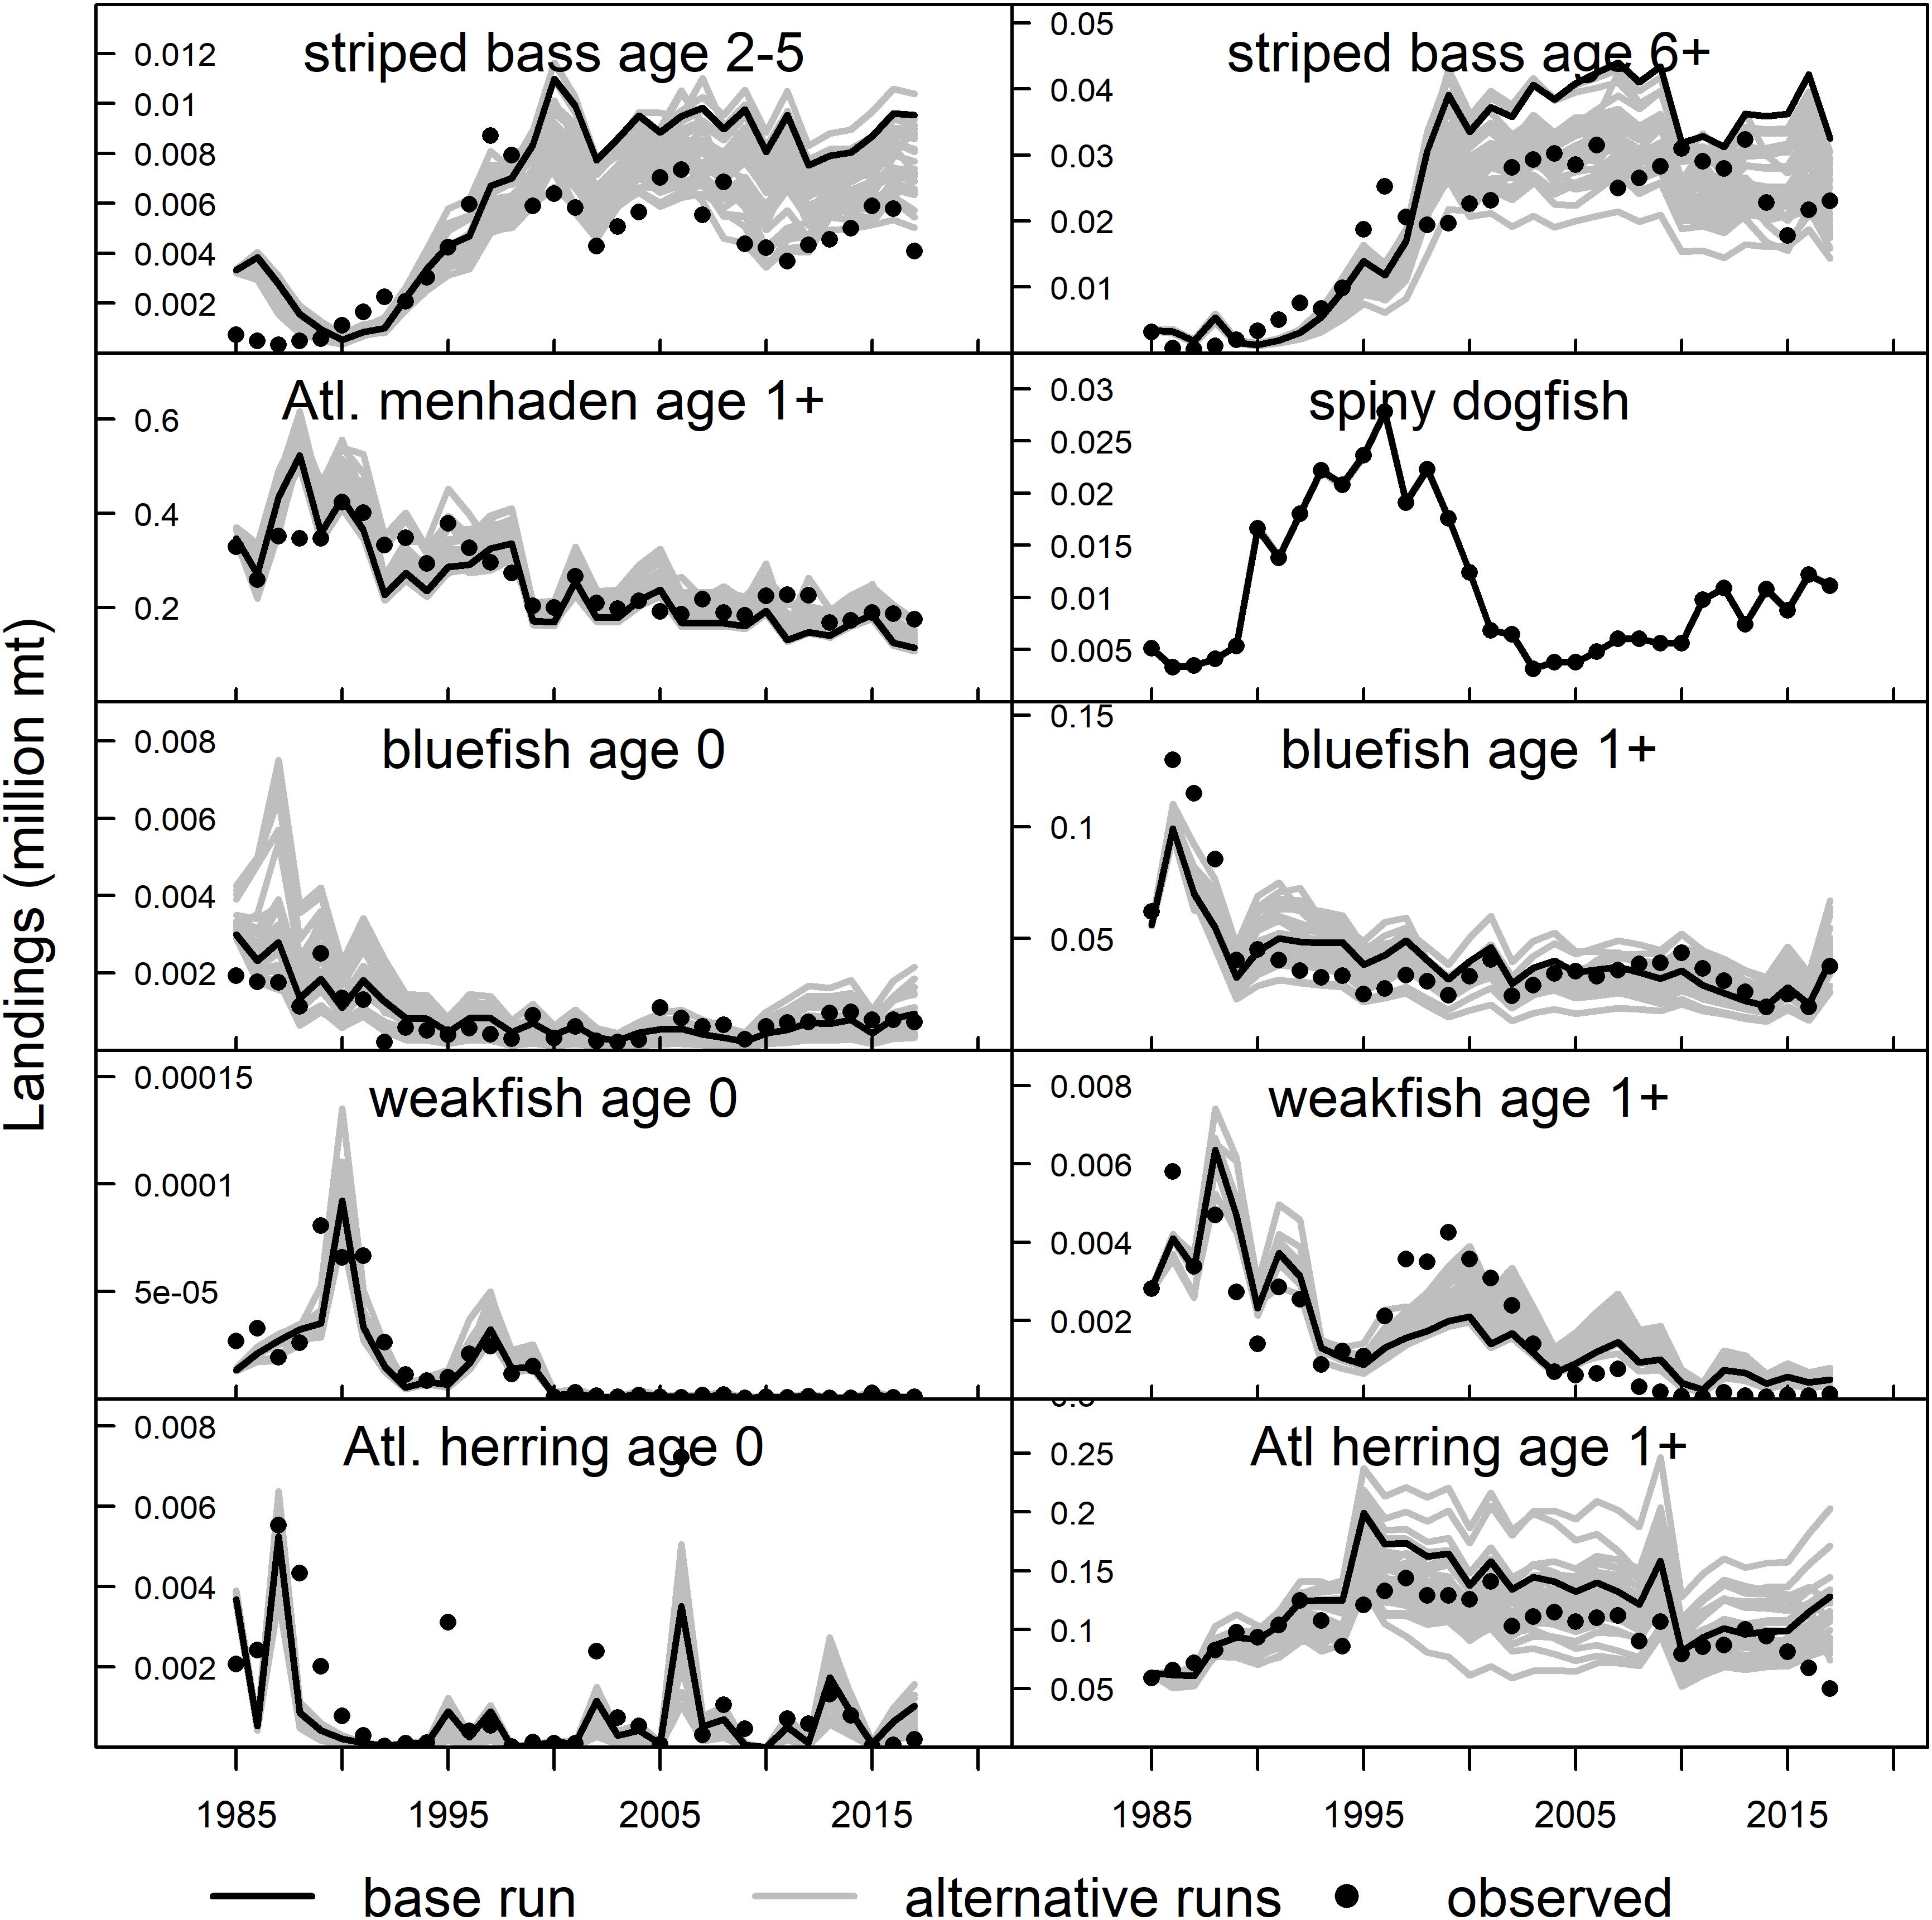
Figure 3. NWACS-MICE Ecosim model fits to landings for species in the ERP complex. The solid black line is the base run model (run 8) and the gray lines are the biomass trajectories from all 32 fitted Ecosim models. The observed catch time series were aggregated from the stock assessment models.
In general, the NWACS-MICE Ecosim model was better at capturing the overall trends in observed abundance data rather than the interannual variability. The predicted biomass of striped bass followed the general trend in the data, capturing the recovery during the 1990s and gradual decline that has followed since (Figure 2). The high interannual variability in the observed data for both menhaden groups was not captured well by the model, nor was the steep decline in the combined juvenile menhaden index observed in 1985–1990. The spiny dogfish observed index was highly variable without trend, but the model predictions were flatter. Bluefish juveniles and adults fit the data well whereas weakfish did not fit the observed spike in abundance that occurred in the late 1990s. Lastly, Atlantic herring fit the overall trend but did not predict the high values observed during 1992, 1995, and 2002 or the lows observed during 1998–2000. The Ecosim model was also able to fit the observed catch trends well (Figure 3), although the predicted catch of striped bass was slightly higher than observed catches after 2000.
Predator–Prey Surface Plots
The analysis of menhaden and striped bass F combinations showed that under current striped bass and menhaden F rates, striped bass will remain below their biomass target and threshold and reach equilibrium at a B/Btarget ratio of 0.66 (Figure 4). At current striped bass F, the model predicted the striped bass biomass ratio would range between 0.74 (near the striped bass Bthreshold) when menhaden F = 0 down to 0.42 when menhaden F is 10x the current value. When striped bass are fished at their Ftarget of 0.2, the model predicted their biomass ratio to range from 1.15 to 0.54 over the range of menhaden F rates considered. Under this scenario, striped bass reached their biomass target at current menhaden F rates, and remained above their biomass threshold for menhaden F rates ranging from zero to approximately four times F2017 (Figure 4). When both striped bass and Atlantic menhaden were fished at their single species Ftarget rates, the equilibrium striped bass biomass ratio was 0.90, which is above the threshold and below the target.
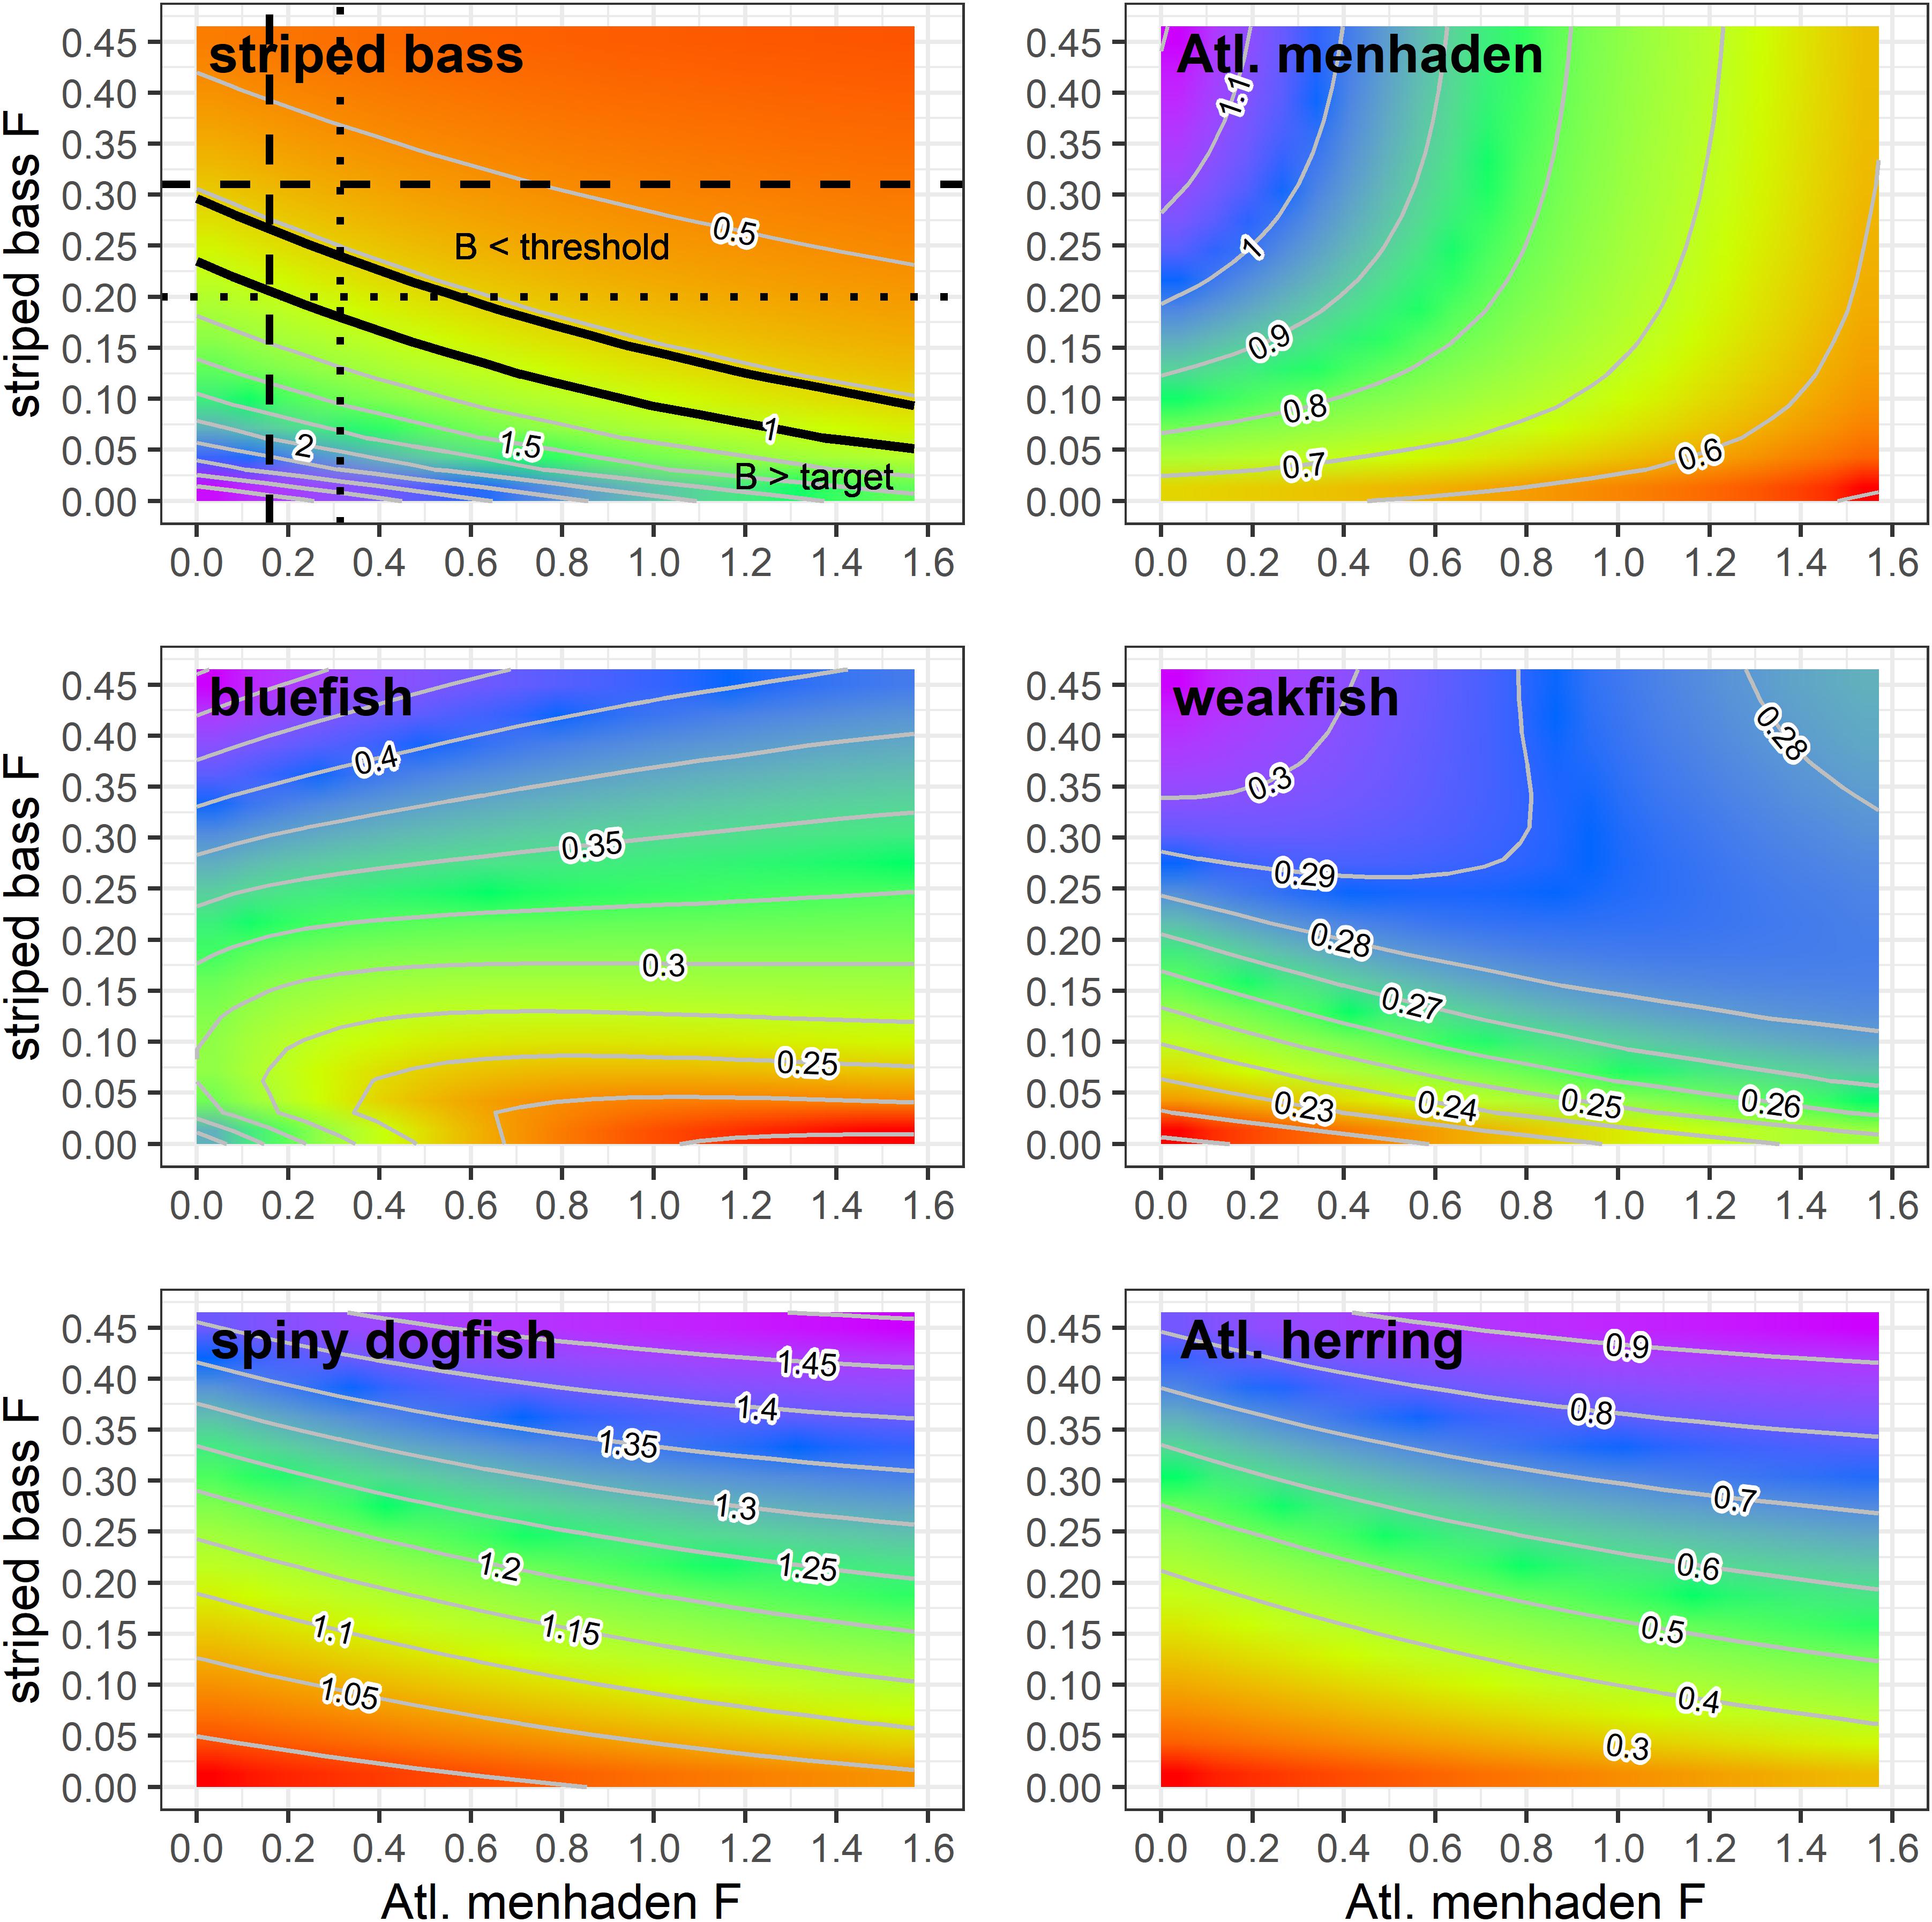
Figure 4. Equilibrium biomass ratios of ERP species as a function of Atlantic menhaden and striped bass F combinations generated by the NWACS-MICE Ecosim model base run. In the striped bass panel, the dashed lines indicate the current F rates, the dotted lines are the target F rates, and the solid black lines indicate the location of the target and threshold biomass ratio contours. All ratios are expressed relative to their single species targets, except for menhaden, which is expressed relative to current (2017) biomass because biomass targets are not defined.
The menhaden and striped bass F combinations explored here resulted in changes to the biomass of other species in the ERP complex, such as bluefish and weakfish that also eat menhaden, are preyed upon by striped bass, or compete with striped bass for food. Bluefish, which was experiencing overfishing in 2017, was predicted to remain below their biomass target across all menhaden and striped bass F combinations (Figure 4). Under current striped bass and menhaden harvest rates, bluefish were predicted to reach equilibrium at a biomass ratio of 0.38. The maximum predicted bluefish biomass ratio was 0.59, which occurred when menhaden F = 0 and striped bass F was 2x Fcurrent. Higher F rates on striped bass led to higher biomass of bluefish due to reduced predation and competition (striped bass prey on juvenile bluefish and have diet overlap with bluefish). When striped bass F is reduced, the biomass of bluefish was predicted to decline, with the lowest biomass ratio of 0.19 predicted in scenarios with high menhaden F and low striped bass F (Figure 4).
Weakfish biomass was also predicted to remain below their threshold across all striped bass and menhaden F combinations, and would reach equilibrium at a biomass ratio of 0.30 under current F rates (Figure 4). Similar to bluefish, the maximum biomass ratio of 0.33 for weakfish occurred when menhaden F = 0 and striped bass F is 2x the current value. However, when striped bass F was low, weakfish biomass increased slightly under higher menhaden F rates, going from 0.21 at menhaden F = 0 to 0.25 at Fx10. This is because the indirect positive effects (i.e., lower predation and competition) resulting from the impact of menhaden harvest on striped bass and bluefish (Figure 4) outweighed the direct negative effects of menhaden harvest on weakfish. In contrast, when striped bass F is high, weakfish biomass ratios declined with menhaden F, going from 0.33 when menhaden F = 0 to 0.27 at maximum menhaden F (Figure 4).
Spiny dogfish and Atlantic herring biomass ratios were highest when menhaden F and striped bass F were both high (Figure 4). Spiny dogfish equilibrium biomass ratio was predicted to be 1.24 under current F rates and remained above their biomass target across nearly all F combinations. Atlantic herring equilibrium biomass ratio under current F was equal to 0.6, and remained below the target over all menhaden and striped bass F rates (Figure 4).
Atlantic Menhaden Ecological Reference Points
Atlantic menhaden ERPs were estimated based on the relationship between menhaden F and striped bass biomass ratios when striped bass was fished at their biomass target and all other species are fished at their 2017 status quo levels. The ERPs are located within the striped bass surface plot where the horizontal dotted line (at striped bass Ftarget = 0.2) intersects the target and threshold B ratio contours (Figure 4), and in Figure 5 where the tradeoff curve crosses the biomass target and threshold. The ERP Ftarget is the menhaden F that maintains striped bass at their biomass target when striped bass are fished at their Ftarget, and it marks the point where the tradeoff curve crosses the target biomass ratio of 1 (Figure 5). The ERP Ftarget was estimated to be 0.19, which was about 20% higher than the current 2017 Atlantic menhaden F of 0.16 and 40% lower than the menhaden single species Ftarget of 0.31 from the stock assessment (Table 2). The ERP Fthreshold is the menhaden F that maintains striped bass at their biomass threshold (when striped bass are fished at Ftarget), and is the point where the tradeoff curve crosses the threshold biomass ratio of 0.78 (Figure 5). The ERP Fthreshold was estimated to be 0.57, which is over 260% higher than the current menhaden F, and is about 30% lower than the single species menhaden Fthreshold of 0.86 from the stock assessment (Table 2). For the projections at the current TAC value, there was 0% probability that the TAC will exceed the ERP Fthreshold and a moderate (60–66%) chance it will exceed the ERP Ftarget in the short-term. TAC values of 176,800 mt and 187,400 mt for 2021 and 2022, respectively, were associated with a 50% probability of attaining the ERP Ftarget (Table 2). Fecundity-based reference points, in numbers of eggs, associated with the ERP Ftarget and Fthreshold were 2.00 × 10¹⁵ and 1.49 × 10¹⁵, which were higher than their single species counterparts by just 3% and 2%, respectively, and below the current fecundity of 2.60 × 10¹⁵ eggs (Table 2).
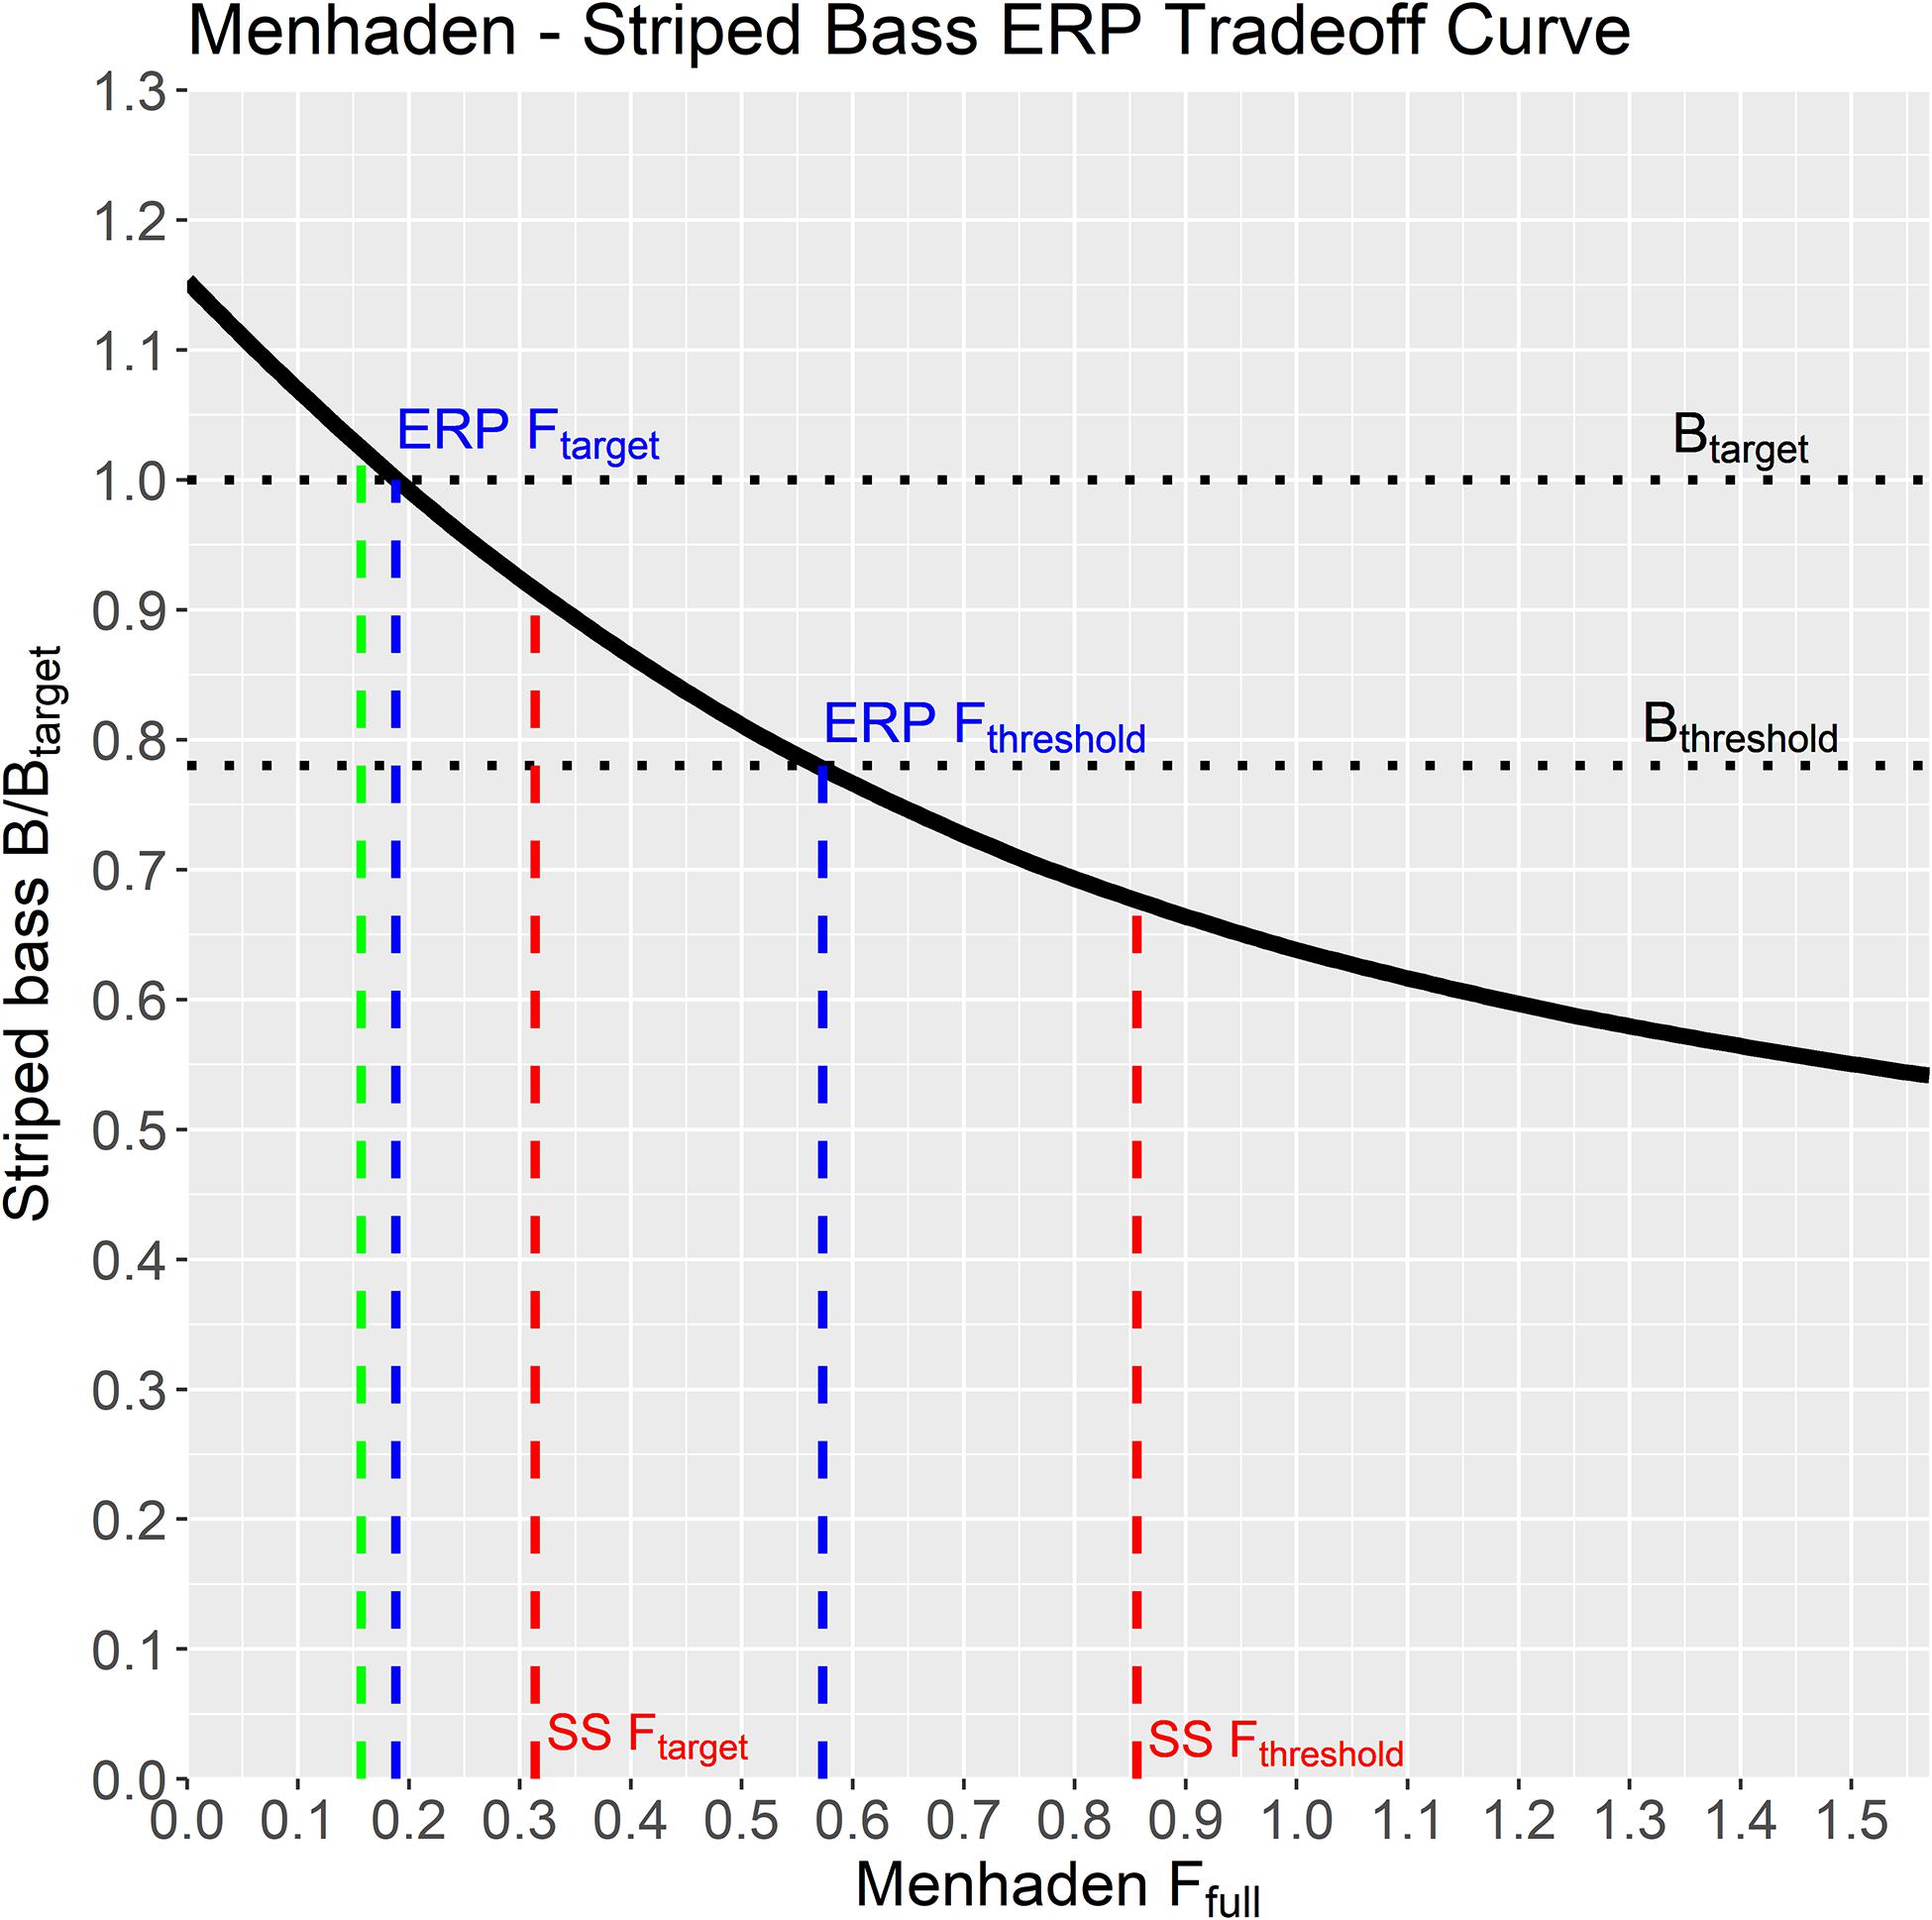
Figure 5. Equilibrium striped bass biomass ratio when fished at Ftarget = 0.2, over a range of menhaden F rates, generated by the NWACS-MICE Ecosim model. The solid black line is the tradeoff curve used to establish the ecological reference points (ERPs). The ERP Ftarget and ERP Fthreshold are the menhaden F rates where the curve crosses the biomass target and threshold, respectively. Target and threshold F rates from the single-species (SS) stock assessment are included for comparison along with the current menhaden F rate (green line).
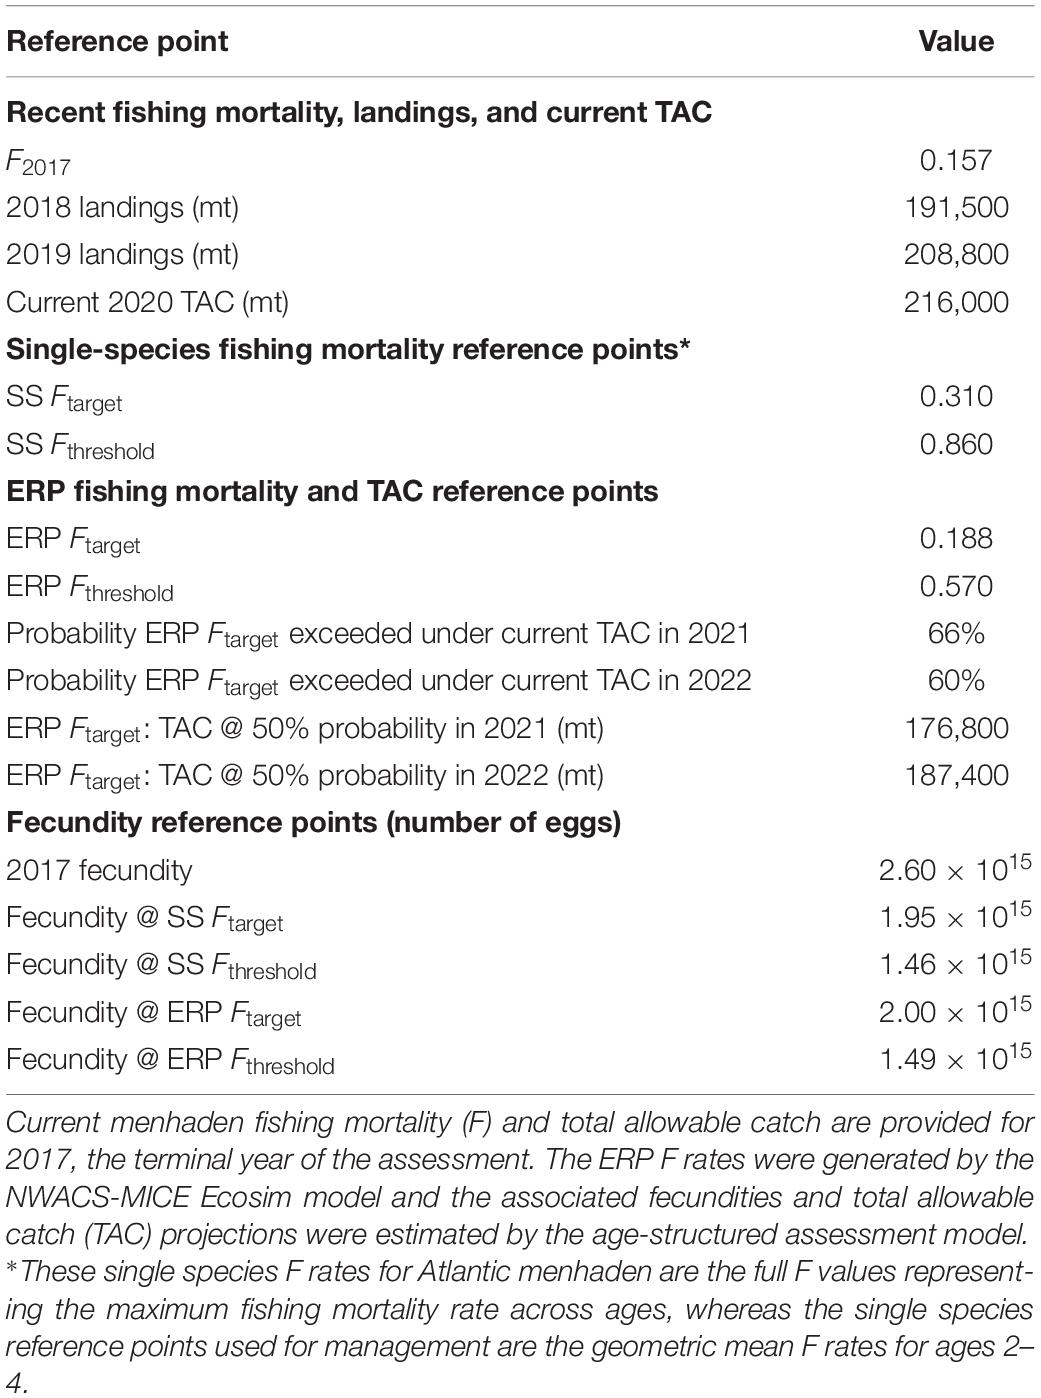
Table 2. Single species and ecological-based reference points (ERP) for Atlantic menhaden.
Discussion
Ecological Reference Points
Atlantic menhaden ERPs were established using an ecosystem model of intermediate complexity and were based on the tradeoff between menhaden harvest and striped bass biomass. This type of tradeoff relationship is central to any forage fish management system. Recent analyses have focused on understanding these forage fish tradeoffs in both real-world (Koehn et al., 2017) and simulated systems (Essington et al., 2015). However, our approach is the first to use these tradeoff relationships in actual management of a forage fish. The tradeoff relationship between Atlantic menhaden and striped bass was concaved, meaning that small increases in menhaden F resulted in disproportionate drops in striped bass biomass (Walters and Martell, 2004). In addition, the current status of striped bass (B2017/Btarget = 0.6) and menhaden F (F2017 = 0.16) is suboptimal, i.e., it is below the tradeoff curve, and there is a set of solutions along the tradeoff frontier where both menhaden harvest and striped bass biomass are higher. By extension, striped bass catch would also be higher at their single-species Ftarget under an optimal configuration. According to the NWACS-MICE model, moving toward an optimal condition first requires a reduction in striped bass F, because biomass was below the threshold across all menhaden F rates. Striped bass was determined to be overfished and experiencing overfishing in the latest stock assessment (Northeast Fisheries Science Center [NEFSC], 2019a) and regulatory changes have already been implemented to reduce F and rebuild the stock (ASMFC, 2019a). The ERPs were developed assuming efforts to reduce striped bass F are successful and would therefore provide enough Atlantic menhaden to support a rebuilt striped bass population. That is, these ERPs do not compromise the performance of striped bass management actions. This satisfied two fundamental ERP objectives previously defined by managers to (1) sustain menhaden for directed fisheries and (2) sustain menhaden for predator species (ASMFC, 2015b).
The ERP target and threshold values were found to be 40% and 30% lower than their single species counterparts, respectively. Through a meta-analysis using ecosystem models, Pikitch et al. (2012) recommended that to sustain forage fish populations and their predators, fishing mortality on forage fish should not exceed 50% of FMSY or 50% of natural mortality. In a study that examined collapsed forage fisheries, Patterson (1992) found that sustainability was likely to be achieved when fishing mortality did not exceed 67% of natural mortality. MSY based reference points were not estimable in the menhaden stock assessment model, but if we assume the single species F reference points are below FMSY, then the ERP F rates could easily be 50% of FMSY or lower. When we compare the ERPs to output from the NWACS-MICE equilibrium analysis (FMSY = 0.81, Supplementary Table S4) or a FMSY proxy from the BAM that achieves a SPR of 40% (F40%SPR = 1.57), then both ERPs would be well below the 0.5FMSY rule-of-thumb (Pikitch et al., 2012). Compared to a natural mortality rate of 1.17 (Liljestrand et al., 2019), the ERP target and threshold are, respectively, 16% and 49% of M, also below the rules-of-thumb (Patterson, 1992; Pikitch et al., 2012). Therefore, the menhaden ERPs, which were explicitly related to the performance of a single predator, striped bass, were within the range of forage fish harvest rates that have been recommended to enhance forage fish sustainability and provide benefits to the broader ecosystem.
Our study uniquely integrated an ecosystem model with an age-structured single species model to provide tactical management advice for a forage species, combining the strengths of both approaches. The NWACS-MICE tool provided strategic advice about the long-term effects of Atlantic menhaden harvest on a limited set of predators and allowed managers to evaluate trade-offs between forage fish harvest and predator biomass. However, the NWACS-MICE model does not capture the short-term interannual variability in Atlantic menhaden population dynamics, especially with regards to recruitment. The single species model includes variable recruitment in the projection scenarios and is well suited for providing short-term (3–5 years) tactical advice on TAC levels, but does not provide information on ecosystem responses. This integration of models allows for long-term ecosystem-level planning, while also providing decision support in the form of annual TACs that fits the existing single-species management framework. While the integration of the models may appear straight forward, translation between two models with different levels of complexity, such as different age structures and recruitment assumptions, presented a challenge. Ultimately, a ratio approach was used to convert fishing mortality rates and biomass ratios between the two modeling types. Further propagation of uncertainty from the ecosystem model to the TAC projections will be necessary to fully quantify risk. One possible approach is to apply natural mortality rates from the ecosystem model in the TAC projections to account for any future changes in predation mortality.
Uncertainties, Assumptions, and Limitations
There remained a substantial amount of unexplained mortality for Atlantic menhaden in the NWACS-MICE model, which was somewhat expected given the limited field of predator species that were included. Similarly, the original NWACS model (Buchheister et al., 2017a), also resulted in high unexplained mortality rates, which was not expected given the inclusion of many more predators. There are several potential explanations for this pattern. First, although many thousand stomach samples were included when creating the Ecopath diet matrices (Buchheister et al., 2017b; SEDAR, 2020b), the dietary contribution of Atlantic menhaden to their predators could be underestimated if, for example, there are intensive spatial-temporal predation events that were not sampled in the diet surveys. Second, the estimated biomass of Atlantic menhaden in the 2019 assessment (SEDAR, 2020a) was more than double the estimate from the previous assessment (SEDAR, 2015), which was due to new, empirical estimates of higher menhaden natural mortality (Liljestrand et al., 2019). If the NWACS-MICE model has used lower biomass estimates and/or mortality rates from previous assessments, menhaden would have a higher EE and lower proportion of unexplained mortality. The uncertainty surrounding menhaden EE and the contribution to predator diets was the basis for a sensitivity run requested by a technical review panel (runs 15–22 in Supplementary Table S3). This configuration resulted in slightly lower ERPs and a steeper tradeoff curve. It is also possible that the models are correct, and menhaden do have high rates of non-predation natural mortality since they are prone to large fish kills related to hypoxia (Paerl et al., 1998; Smith, 1999) and epizootic infections (Dykstra et al., 1989; Reimschuessel et al., 2003). The truth is likely some combination of these factors, and future work is needed to empirically validate the current estimates of menhaden natural mortality and understand how it is partitioned into sources of fishing, predation, and other causes.
The NWACS-MICE model was found to be highly sensitive to the Ecosim vulnerability parameters, which were often estimated at upper and lower bounds. Vulnerability parameters estimated at the bounds may arise due to lack of contrast in the data, omission of key environmental forcing functions, or overly precise optimization criteria. For instance, Ecosim may attempt to explain patterns in the data using predator–prey vulnerabilities that would have been naturally explained by some environmental drivers. Additionally, the vulnerability parameters, along with foraging time adjustment settings, impact the degree of compensation in recruitment, growth, and survival (Christensen and Walters, 2004a), which in turn determine how sensitive a species is to harvest. This is evident in the wide range of FMSY arising from alternative model configurations (Supplementary Table S4 and Supplementary Figure S1). Models with higher FMSY for menhaden would likely result in a flatter tradeoff relationship and vice versa. However, not all parameter settings produced satisfactory fits to the data. Applying minimum and maximum vulnerability caps resulted in slightly worse fits to the data, but drastically improved projection scenarios at high menhaden F leading to more reasonable FMSY estimates, and constrained theoretical maximum predation mortality rates to values that are compatible with natural mortality rates of the prey species. The parameter space in Ecosim models is large and must be evaluated fully to capture the uncertainty in the model (Gaichas et al., 2012). Potential improvements to parameter estimation in Ecosim could apply the vulnerability caps described here as penalized bounds (Bolker et al., 2013; Kinzey et al., 2018) or a constrained minimization approach (Vallino, 2000; Senina et al., 2008) that would prevent the vulnerabilities from being estimated at the upper and lower bounds.
Due to the reduced age structure and the combining of fleets in the NWACS-MICE model, asymptotic selectivity was assumed for all species in the ERP complex. In contrast, recent stock assessments of menhaden, bluefish, weakfish, and Atlantic herring assume dome-shaped selectivity for some or all fleets and may allow selectivity to change over time. Flat-topped selectivity generally results in a stronger response to increasing F than dome-shaped selectivity, because older fish are vulnerable to harvest. For the ERPs, we expect that a dome-shaped selectivity for menhaden would lead to higher ERP F rates, i.e., a flatter tradeoff curve. However, to implement dome-shaped selectivity for menhaden, NWACS-MICE would require finer age structure and difficult assumptions about age-specific predation from the diet studies. Nevertheless, improving consistency between NWACS-MICE and the stock assessments has advantages, and the implications of model structure as it relates to selectivity should be explored in future iterations.
The current configuration of the NWACS-MICE model does not include any environmental drivers that might help explain the inter-annual variability in the system. Rather, the model attempts to replicate observed trends in abundance and catch using fishing and trophic processes only. This is a glaring limitation for an ecosystem model centered around a species that is recruitment driven and related to several environmental drivers such as physical transport processes (Checkley et al., 1988; Quinlan et al., 1999) and larger-scale climatic drivers like the Atlantic Multidecal Oscillation (Buchheister et al., 2016). It’s also possible that delivery and transport of nutrients from coastal rivers might impact Atlantic menhaden dynamics as it does for Gulf menhaden (Brevoortia patronus) (Govoni, 1997; Leaf, 2017) and Atlantic thread herring (Opisthonema oglinum) (Chagaris et al., 2015), two other members of the family Clupeidae with similar life histories. Stock assessment models also do not explicitly account for environmental drivers either, but they do estimate annual recruitment deviations. Analogous to this, Ecosim has the ability to estimate annual primary production anomalies (runs 23–25), however, those anomalies were not correlated with other information on primary production and were not considered for inclusion. Work is underway to assemble a time series of bottom-up forcing to account for changes in primary productivity and other environmental factors that drive Atlantic menhaden populations.
Research and Modeling Recommendations
This NWACS-MICE model and the adopted ERPs serve as a step forward in EBFM, but additional research and model development will be beneficial. Expanding the collection of diet and abundance data for the key predators, particularly across seasons and regions, would improve our understanding of the spatiotemporal dynamics of trophic interactions and predator–prey overlap. Accounting for seasonal and spatial migration patterns is also important in this system. For example, we found the ERP tradeoff curve to be sensitive to assumptions about the seasonal availability of Atlantic herring as prey to striped bass. More work is needed to synthesize data to parameterize and validate a spatial-temporal dynamic Ecospace model (Steenbeek et al., 2013). We also recommend improved monitoring of population trends and diet data in non-finfish predators (e.g., birds, marine mammals) and data-poor prey species (e.g., bay anchovies, sand eels, benthic invertebrates, zooplankton, and phytoplankton) to better characterize the importance of Atlantic menhaden and other forage species to the ecosystem dynamics. Future iterations of the NWACS model should explore annual recruitment deviations (from external models), primary production time series, and environmental drivers to better represent interannual variability in the system.
An obvious next step in refining the menhaden ERPs is to incorporate additional predators, such as birds, mammals, and other piscivorous fishes that were found to contribute to menhaden mortality in the original NWACS model and/or were sensitive to menhaden harvest. The decision not to include additional predators was primarily a practical one, that aimed to balance model complexity with the added uncertainty that comes with including more species for which we have few data. Due to time constraints, a fair comparison of the ERPs generated by the original NWACS and the NWACS-MICE models was not possible during the development of these ERPs. If the full model suggests that the ERPs were severely biased due to model simplification, then that would be grounds to expand the MICE model to include additional species. As Collie et al. (2016) concluded, the “sweet spot” in model complexity strikes a balance between bias and uncertainty, and also depends on the key management questions and the effort required to update and maintain the models for routine operational use. Understanding how model complexity influences the management advice is considered a high priority moving forward.
With regards to management advice using the NWACS-MICE model, additional work is needed to characterize uncertainty in model projections and the resulting tradeoff frontier using Monte-Carlo simulations and alternate mass-balance parameterizations (Steenbeek et al., 2018). Management strategy evaluation (MSE) presents a more robust technique of incorporating uncertainty and evaluating strategic harvest strategies (Punt et al., 2016; Mackinson et al., 2018; Surma et al., 2018). Any ecosystem-level MSE should be carefully planned and incorporate input from stakeholders and managers of all species considered. Additionally, the optimal solution along the tradeoff frontier can be solved for in Ecosim while considering the socio-economic value of the competing fisheries (Christensen and Walters, 2004b; Heymans et al., 2009; Essington et al., 2015). Given that models of different types or complexities can address slightly different aspects of the tradeoffs in menhaden harvest management, we have also advocated for the continued development of other multispecies models, especially a multispecies statistical catch at age model developed as part of the ERP process (Curti et al., 2013; McNamee, 2018).
Moving Toward EBFM
The adoption of ERPs developed with the NWACS-MICE tool represents a significant step in incorporating quantitative ecosystem considerations into fisheries management on the US East Coast. ASMFC has sole management authority for Atlantic menhaden, striped bass, and weakfish, and so an ecosystem management approach that considers reference points, management objectives, and trade-offs for all three species together, using a tool like this, is a feasible next step to move EBFM forward in this system. Conceptually, our approach to establishing ERPs is transferable to other predator–prey systems and other multi-species modeling approaches. In fact, ecosystem models already exist in many systems around the world where large forage fisheries are prosecuted. However, the capabilities of this tool to provide broader EBFM advice are somewhat limited by current single-species management frameworks, in which species reference points are set independently, without consideration of ecosystem dynamics or trade-offs with other species. Progress toward true EBFM will require not just strong scientific tools, but also a shift in the management framework to better coordinate stock assessments and ecosystem modeling efforts with management actions. Additionally, stakeholders and managers of all species must come together to define objectives for the ecosystem as a whole and set reference points. A sea change in fisheries management may not be possible overnight, but incremental some steps such as this can be taken to move ecosystem-based management forward.
Data Availability Statement
The raw data supporting the conclusions of this article will be made available by the authors, upon reasonable request.
Author Contributions
DC, AB, and JB developed the NWACS-MICE model. KD provided data inputs and processed model output for management use. MC chaired the ERP workgroup and provided critical strategic and conceptual advice during model development. AS provided data inputs and conducted the single species projections. All authors contributed to model review and writing of the manuscript.
Funding
This work was supported by a grant from the Lenfest Ocean Program grant number 00032187.
Conflict of Interest
The authors declare that the research was conducted in the absence of any commercial or financial relationships that could be construed as a potential conflict of interest.
Acknowledgments
We would like to acknowledge all current and past members of the ASMFC Ecological Reference Points Workgroup and Commission staff who contributed to this effort, including: Kristen Anstead, Mike Celestino, Micah Dean, Shanna Madsen, Jason McNamee, Sarah Murray, Alexei Sharov, Howard Townsend, Jim Uphoff, and Genevieve Nesslage. We also recognize Max Grezlik, Ed Houde, and Tom Miller for their contribution to the development of the NWACS EwE models. Lastly, we thank all federal, state, and academic partners who provided data in support of this work.
Supplementary Material
The Supplementary Material for this article can be found online at: https://www.frontiersin.org/articles/10.3389/fmars.2020.606417/full#supplementary-material
Footnotes
References
Ahrenholz, D. W. (1991). Population biology and life history of the North American menhadens, Brevoortia spp. Mar. Fish. Rev. 53, 3–19.
Ahrenholz, D. W., Nelson, W. R., and Epperly, S. P. (1987). Population and fishery characteristics of Atlantic menhaden, Brevoortia tyrannus. Fish. Bull. 85, 569–600.
Ahrens, R. N. M., Walters, C. J., and Christensen, V. (2012). Foraging arena theory. Fish Fish. 13, 41–59. doi: 10.1111/j.1467-2979.2011.00432.x
Allen, K. R. (1971). Relation between production and biomass. J. Fish. Board Can. 28, 1573–1581. doi: 10.1139/f71-236
ASMFC, (2005). Addendum II to Amendment 1 to the Interstate Fishery Management Plan for Atlantic menhaden. Arlington, VA: ASMFC.
ASMFC, (2015a). Bluefish Benchmark Stock Assessment for 2015. Atlantic States Marine Fisheries Commission. Arlington, VA: ASMFC.
ASMFC, (2017). Amendment 3 to the Interstate Fishery Management Plan for Atlantic Menhaden. Arlington, VA: ASMFC.
ASMFC, (2019a). Addendum VI to Amendment 6 to the Atlantic Striped Bass Interstate Fishery Management Plan. Atlantic States Marine Fisheries Commission. Arlington, VA: ASMFC.
ASMFC, (2019b). Weakfish Stock Assessment Update Report. Atlantic States Marine Fisheries Commission. Arlington, VA: ASMFC.
Bolker, B. M., Gardner, B., Maunder, M., Berg, C. W., Brooks, M., Comita, L., et al. (2013). Strategies for fitting nonlinear ecological models in R, AD Model B uilder, and BUGS. Methods Ecol. Evol. 4, 501–512. doi: 10.1111/2041-210x.12044
Buchheister, A., Miller, T. J., and Houde, E. D. (2017a). Evaluating ecosystem-based reference points for Atlantic Menhaden. Mar. Coast. Fish. 9, 457–478. doi: 10.1080/19425120.2017.1360420
Buchheister, A., Miller, T. J., Houde, E. D., and Loewensteiner, D. A. (2017b). Technical Documentation of the Northwest Atlantic Continental Shelf (NWACS) Ecosystem Model. Report to the Lenfest Ocean Program University of Maryland Center for Environmental Sciences Report TS-694-17. Washington, DC: University of Maryland.
Buchheister, A., Miller, T. J., Houde, E. D., Secor, D. H., and Latour, R. J. (2016). Spatial and temporal dynamics of Atlantic menhaden (Brevoortia tyrannus) recruitment in the Northwest Atlantic Ocean. ICES J. Mar. Sci. 73, 1147–1159. doi: 10.1093/icesjms/fsv260
Butler, C. M., Rudershausen, P. J., and Buckel, J. A. (2010). Feeding ecology of Atlantic bluefin tuna (Thunnus thynnus) in North Carolina: diet, daily ration, and consumption of Atlantic menhaden (Brevoortia tyrannus). Fish. Bull. 108, 50–69.
Chagaris, D., Mahmoudi, B., Muller-Karger, F., Cooper, W., and Fischer, K. (2015). Temporal and spatial availability of A tlantic T hread H erring, O pisthonema oglinum, in relation to oceanographic drivers and fishery landings on the Florida Panhandle. Fish. Oceanogr. 24, 257–273. doi: 10.1111/fog.12104
Checkley, D. M., Raman, S., Maillet, G. L., and Mason, K. M. (1988). Winter storm effects on the spawning and larval drift of a pelagic fish. Nature 335, 346–348. doi: 10.1038/335346a0
Christensen, V., and Walters, C. (2004a). Ecopath with Ecosim: methods, capabilities, and limitations. Ecol. Model. 172, 109–139. doi: 10.1016/j.ecolmodel.2003.09.003
Christensen, V., and Walters, C. J. (2004b). Trade-offs in ecosystem-scale optimization of fisheries management policies. Bull. Mar. Sci. 74, 549–562.
Christensen, V., Walters, C. J., and Pauly, D. (2005). Ecopath with Ecosim: A User’s Guide. Vancouver: Fisheries Centre, University of British Columbia.
Colléter, M., Valls, A., Guitton, J., Gascuel, D., Pauly, D., and Christensen, V. (2015). Global overview of the applications of the Ecopath with Ecosim modeling approach using the EcoBase models repository. Ecol. Model. 302, 42–53. doi: 10.1016/j.ecolmodel.2015.01.025
Collie, J. S., Botsford, L. W., Hastings, A., Kaplan, I. C., Largier, J. L., Livingston, P. A., et al. (2016). Ecosystem models for fisheries management: finding the sweet spot. Fish Fish. 17, 101–125. doi: 10.1111/faf.12093
Constable, A. J., de la Mare, W. K., Agnew, D. J., Everson, I., and Miller, D. (2000). Managing fisheries to conserve the antarctic marine ecosystem: practical implementation of the convention on the conservation of antarctic marine living resources (CCAMLR). ICES J. Mar. Sci. 57, 778–791. doi: 10.1006/jmsc.2000.0725
Curti, K. L., Collie, J. S., Legault, C. M., and Link, J. S. (2013). Evaluating the performance of a multispecies statistical catch-at-age model. Can. J. Fish. Aquat. Sci. 70, 470–484. doi: 10.1139/cjfas-2012-0229
Cury, P. M., Boyd, I. L., Bonhommeau, S., Anker-Nilssen, T., Crawford, R. J., Furness, R. W., et al. (2011). Global seabird response to forage fish depletion—one-third for the birds. Science 334, 1703–1706. doi: 10.1126/science.1212928
Deroba, J. (2015). Atlantic Herring Operational Assessment Report 2015. US Dept Commer, Northeast Fish Sci Cent Ref Doc. 15-16. Available at: http://www.nefsc.noaa.gov/publications/ (accessed October 3, 2019).
Deyle, E., Schueller, A. M., Ye, H., Pao, G. M., and Sugihara, G. (2018). Ecosystem-based forecasts of recruitment in two menhaden species. Fish Fish. 19, 769–781. doi: 10.1111/faf.12287
Dickey-Collas, M., Engelhard, G. H., Rindorf, A., Raab, K., Smout, S., Aarts, G., et al. (2014). Ecosystem-based management objectives for the North Sea: riding the forage fish rollercoaster. ICES J. Mar. Sci. 71, 128–142. doi: 10.1093/icesjms/fst075
Dykstra, M., Levine, J., Noga, E., Hawkins, J., Gerdes, P., Grier, H., et al. (1989). Ulcerative mycosis: a serious menhaden disease of the southeastern coastal fisheries of the United States. J. Fish Dis. 12, 175–178. doi: 10.1111/j.1365-2761.1989.tb00289.x
Essington, T. E., Baskett, M. L., Sanchirico, J. N., and Walters, C. (2015). A novel model of predator–prey interactions reveals the sensitivity of forage fish: piscivore fishery trade-offs to ecological conditions. ICES J. Mar. Sci. 72, 1349–1358. doi: 10.1093/icesjms/fsu242
Gaichas, S. K., Odell, G., Aydin, K. Y., and Francis, R. C. (2012). Beyond the defaults: functional response parameter space and ecosystem-level fishing thresholds in dynamic food web model simulations. Can. J. Fish. Aquat. Sci. 69, 2077–2094. doi: 10.1139/f2012-099
Gannon, D. P., and Waples, D. M. (2004). Diets of coastal bottlenose dolphins from the US mid-Atlantic coast differ by habitat. Mar. Mamm. Sci. 20, 527–545. doi: 10.1111/j.1748-7692.2004.tb01177.x
Garrison, L. P., Link, J. S., Kilduff, D. P., Cieri, M. D., Muffley, B., Vaughan, D. S., et al. (2010). An expansion of the MSVPA approach for quantifying predator–prey interactions in exploited fish communities. ICES J. Mar. Sci. J. du Conseil 67, 856–870. doi: 10.1093/icesjms/fsq005
Gartland, J., Latour, R. J., and Vogelbein, W. K. (2019). Reproductive Biology & Fecundity of Atlantic Menhaden. Alexandria: National Science Foundation Science Center for Marine Fisheries.
Glass, K. A., and Watts, B. D. (2009). Osprey diet composition and quality in high-and low-salinity areas of lower Chesapeake Bay. J. Raptor Res. 43, 27–36. doi: 10.3356/jrr-08-22.1
Govoni, J. J. (1997). The association of the population recruitment of gulf menhaden, Brevoortia patronus, with Mississippi River discharge. J. Mar. Syst. 12, 101–108. doi: 10.1016/s0924-7963(96)00091-7
Hartman, K. J., and Brandt, S. B. (1995). Predatory demand and impact of striped bass, bluefish, and weakfish in the Chesapeake Bay: applications of bioenergetics models. Can. J. Fish. Aquat. Sci. 52, 1667–1687. doi: 10.1139/f95-760
Heymans, J. J., Coll, M., Link, J. S., Mackinson, S., Steenbeek, J., Walters, C., et al. (2016). Best practice in Ecopath with Ecosim food-web models for ecosystem-based management. Ecol. Model. 331, 173–184. doi: 10.1016/j.ecolmodel.2015.12.007
Heymans, J. J., Sumaila, U. R., and Christensen, V. (2009). Policy options for the northern Benguela ecosystem using a multispecies, multifleet ecosystem model. Prog. Oceanogr. 83, 417–425. doi: 10.1016/j.pocean.2009.07.013
Hilborn, R., Amoroso, R. O., Bogazzi, E., Jensen, O. P., Parma, A. M., Szuwalski, C., et al. (2017). When does fishing forage species affect their predators? Fish. Res. 191, 211–221. doi: 10.1016/j.fishres.2017.01.008
Kaplan, I. C., Francis, T. B., Punt, A. E., Koehn, L. E., Curchitser, E., Hurtado-Ferro, F., et al. (2019). A multi-model approach to understanding the role of Pacific sardine in the California current food web. Mar. Ecol. Prog. Ser. 617, 307–321. doi: 10.3354/meps12504
Kinzey, D., Watters, G. M., and Reiss, C. S. (2018). Parameter estimation using randomized phases in an integrated assessment model for Antarctic krill. PLoS One 13:e0202545. doi: 10.1371/journal.pone.0202545
Koehn, L. E., Essington, T. E., Marshall, K. N., Sydeman, W. J., Szoboszlai, A. I., and Thayer, J. A. (2017). Trade-offs between forage fish fisheries and their predators in the California current. ICES J. Mar. Sci. 74, 2448–2458. doi: 10.1093/icesjms/fsx072
Leaf, R. T. (2017). Environmental determinants of Gulf menhaden (Brevoortia patronus) oil content in the northern Gulf of Mexico. Ecol. Indic. 82, 551–557. doi: 10.1016/j.ecolind.2017.07.031
Liljestrand, E. M., Wilberg, M. J., and Schueller, A. M. (2019). Estimation of movement and mortality of Atlantic menhaden during 1966–1969 using a Bayesian multi-state mark-recovery model. Fish. Res. 210, 204–213. doi: 10.1016/j.fishres.2018.10.015
Link, J., Overholtz, W., O’Reilly, J., Green, J., Dow, D., Palka, D., et al. (2008). The Northeast US continental shelf Energy Modeling and Analysis exercise (EMAX): ecological network model development and basic ecosystem metrics. J. Mar. Syst. 74, 453–474. doi: 10.1016/j.jmarsys.2008.03.007
Link, J. S., Fulton, E. A., and Gamble, R. J. (2010). The northeast US application of ATLANTIS: a full system model exploring marine ecosystem dynamics in a living marine resource management context. Prog. Oceanogr. 87, 214–234. doi: 10.1016/j.pocean.2010.09.020
Lorenzen, K. (1996). The relationship between body weight and natural mortality in juvenile and adult fish: a comparison of natural ecosystems and aquaculture. J. Fish Biol. 49, 627–647. doi: 10.1111/j.1095-8649.1996.tb00060.x
Mackinson, S., Platts, M., Garcia, C., and Lynam, C. (2018). Evaluating the fishery and ecological consequences of the proposed North Sea multi-annual plan. PLoS One 13:e0190015. doi: 10.1371/journal.pone.0190015
McNamee, J. E. (2018). A Multispecies Statistical Catch-At-Age (MSSCAA) Model for a Mid-Atlantic Species Complex. Kingston, RI: University of Rhode Island.
Mersmann, T. J. (1989). Foraging Ecology of Bald Eagles on the Northern Chesapeake Bay With an Examination of Techniques Used in the Study of Bald Eagle Food Habits. Blacksburg: Virginia Tech.
National Marine Fisheries Service [NMFS], (2016). Ecosystem-Based Fisheries Management Policy of the National Marine Fisheries Service National Oceanic and Atmospheric Administration. NMFS Policy Directive 01-120. Beaufort, NC: NMFS.
National Marine Fisheries Service [NMFS], (2019). Forecast for the 2019 Gulf and Atlantic Menhaden Purse-Seine Fisheries and Review of the 2018 Fishing Season. Beaufort, NC: National Marine Fisheries Service Sustainable Fisheries Branch.
Nesslage, G. M., and Wilberg, M. J. (2019). A performance evaluation of surplus production models with time-varying intrinsic growth in dynamic ecosystems. Can. J. Fish. Aquat. Sci. 76, 2245–2255. doi: 10.1139/cjfas-2018-0292
Northeast Fisheries Science Center [NEFSC], (2018). 65th Northeast Regional Stock Assessment Workshop (65th SAW) Assessment Summary Report. US Dept Commer, Northeast Fish Sci Cent Ref Doc. 18-08. Woods Hole, MA: NEFSC.
Northeast Fisheries Science Center [NEFSC], (2019a). 66th Northeast Regional Stock Assessment Workshop (66th SAW) Assessment Report. US Dept Commer, Northeast Fish Sci Cent Ref Doc. 19-08. Woods Hole, MA: NEFSC.
Northeast Fisheries Science Center [NEFSC], (2019b). Operational Assessment of The Black Sea Bass, Scup, Bluefish, and Monkfish Stocks, Updated Through 2018. Prepublcation Copy (9-4-2019). Woods Hole, MA: NEFSC.
Paerl, H. W., Pinckney, J., Fear, J. M., and Peierls, B. L. (1998). Ecosystem responses to internal and watershed organic matter loading: consequences for hypoxia in the eutrophying Neuse River Estuary, North Carolina, USA. Mar. Ecol. Prog. Ser. 166, 17–25. doi: 10.3354/meps166017
Patterson, K. (1992). Fisheries for small pelagic species: an empirical approach to management targets. Rev. Fish Biol. Fish. 2, 321–338. doi: 10.1007/bf00043521
Pauly, D., Christensen, V., and Walters, C. (2000). Ecopath, Ecosim, and Ecospace as tools for evaluating ecosystem impact of fisheries. ICES J. Mar. Sci. 57, 1–10. doi: 10.1007/s00773-016-0388-8
Pikitch, E. K., Boersma, P. D., Boyd, I. L., Conover, D. O., Cury, P., Essington, T. E., et al. (2012). Little Fish, Big Impact: Managing a Crucial Link in Ocean Food Webs. Washington, DC: Lenfest Ocean Program.
Pikitch, E. K., Boersma, P. D., Boyd, I. L., Conover, D. O., Cury, P., Essington, T. E., et al. (2018). The strong connection between forage fish and their predators: a response to Hilborn et al. (2017). Fish. Res. 198, 220–223. doi: 10.1016/j.fishres.2017.07.022
Pikitch, E. K., Santora, C., Babcock, E. A., Bakun, A., Bonfil, R., Conover, D. O., et al. (2004). Ecosystem-based fishery management. Science 305, 346–347. doi: 10.1126/science.1098222
Plagányi, É. E., Punt, A. E., Hillary, R., Morello, E. B., Thébaud, O., Hutton, T., et al. (2014). Multispecies fisheries management and conservation: tactical applications using models of intermediate complexity. Fish Fish. 15, 1–22. doi: 10.1111/j.1467-2979.2012.00488.x
Punt, A. E., MacCall, A. D., Essington, T. E., Francis, T. B., Hurtado-Ferro, F., Johnson, K. F., et al. (2016). Exploring the implications of the harvest control rule for Pacific sardine, accounting for predator dynamics: a MICE model. Ecol. Model. 337, 79–95. doi: 10.1016/j.ecolmodel.2016.06.004
Quinlan, J. A., Blanton, Miller, and Werner (1999). From spawning grounds to the estuary: using linked individual-based and hydrodynamic models to interpret patterns and processes in the oceanic phase of Atlantic menhaden Brevoortia tyrannus life history. Fish. Oceanogr. 8, 224–246. doi: 10.1046/j.1365-2419.1999.00033.x
Reimschuessel, R., Gieseker, C., Driscoll, C., Baya, A., Kane, A., Blazer, V. S., et al. (2003). Myxosporean plasmodial infection associated with ulcerative lesions in young-of-the-year Atlantic menhaden in a tributary of the Chesapeake Bay, and possible links to Kudoa clupeidae. Dis. Aquat. Organ. 53, 143–166. doi: 10.3354/dao053143
Rice, J., and Duplisea, D. (2014). Management of fisheries on forage species: the test-bed for ecosystem approaches to fisheries. ICES J. Mar. Sci. 71, 143–152. doi: 10.1093/icesjms/fst151
SEDAR, (2020a). SEDAR 69 – Atlantic Menhaden Benchmark Stock Assessment Report. North Charleston, SC: SEDAR.
SEDAR, (2020b). SEDAR 69 – Atlantic Menhaden Ecological Reference Points Stock Assessment Report. North Charleston, SC: SEDAR.
Senina, I., Sibert, J., and Lehodey, P. (2008). Parameter estimation for basin-scale ecosystem-linked population models of large pelagic predators: application to skipjack tuna. Prog. Oceanogr. 78, 319–335. doi: 10.1016/j.pocean.2008.06.003
Siple, M. C., Essington, T. E., and Plagányi, E. É (2019). Forage fish fisheries management requires a tailored approach to balance trade-offs. Fish Fish. 20, 110–124. doi: 10.1111/faf.12326
Smith, A. D. M., Brown, C. J., Bulman, C. M., Fulton, E. A., Johnson, P., Kaplan, I. C., et al. (2011). Impacts of fishing low-trophic level species on marine ecosystems. Science 333, 1147–1150. doi: 10.1126/science.1209395
Smith, J. W. (1999). A large fish kill of Atlantic menhaden, Brevoortia tyrannus, on the North Carolina coast. J. Elisha Mitchell Sci. Soc. 115, 157–163.
Steenbeek, J., Coll, M., Gurney, L., Hoepffner, N., Buszowski, J., and Christensen, V. (2013). Bridging the gap between ecosystem modeling tools and geographic information systems: driving a food web model with external spatial–temporal data. Ecol. Model. 263, 139–151. doi: 10.1016/j.ecolmodel.2013.04.027
Steenbeek, J., Corrales, X., Platts, M., and Coll, M. (2018). Ecosampler: a new approach to assessing parameter uncertainty in Ecopath with Ecosim. SoftwareX 7, 198–204. doi: 10.1016/j.softx.2018.06.004
Surma, S., Pitcher, T. J., Kumar, R., Varkey, D., Pakhomov, E. A., and Lam, M. E. (2018). Herring supports Northeast Pacific predators and fisheries: insights from ecosystem modelling and management strategy evaluation. PLoS One 13:e0196307. doi: 10.1371/journal.pone.0196307
Uphoff, J. H. Jr., and Sharov, A. (2018). Striped bass and atlantic menhaden predator–prey dynamics: model choice makes the difference. Mar. Coast. Fish. 10, 370–385. doi: 10.1002/mcf2.10030
Vallino, J. (2000). Improving marine ecosystem models: use of data assimilation and mesocosm experiments. J. Mar. Res. 58, 117–164. doi: 10.1357/002224000321511223
Walters, C., Christensen, V., Martell, S. J. D., and Kitchell, J. F. (2005). Possible ecosystem impacts of applying MSY policies from single-species assessment. ICES J. Mar. Sci. 62, 558–568. doi: 10.1016/j.icesjms.2004.12.005
Walters, C., Christensen, V., and Pauly, D. (1997). Structuring dynamic models of exploited ecosystems from trophic mass-balance assessments. Rev. Fish Biol. Fish. 7, 139–172.
Keywords: Ecopath with Ecosim, ecosystem based fishery management, ecosystem model, forage fish, tradeoffs
Citation: Chagaris D, Drew K, Schueller A, Cieri M, Brito J and Buchheister A (2020) Ecological Reference Points for Atlantic Menhaden Established Using an Ecosystem Model of Intermediate Complexity. Front. Mar. Sci. 7:606417. doi: 10.3389/fmars.2020.606417
Received: 14 September 2020; Accepted: 10 November 2020;
Published: 27 November 2020.
Edited by:
Chiara Piroddi, Joint Research Centre (Italy), ItalyReviewed by:
Isaac C. Kaplan, National Oceanic and Atmospheric Administration (NOAA), United StatesChris Harvey, National Oceanic and Atmospheric Administration (NOAA), United States
Copyright © 2020 Chagaris, Drew, Schueller, Cieri, Brito and Buchheister. This is an open-access article distributed under the terms of the Creative Commons Attribution License (CC BY). The use, distribution or reproduction in other forums is permitted, provided the original author(s) and the copyright owner(s) are credited and that the original publication in this journal is cited, in accordance with accepted academic practice. No use, distribution or reproduction is permitted which does not comply with these terms.
*Correspondence: David Chagaris, dchagaris@ufl.edu