Relative Conservation Status of Bird Orders With Special Attention to Raptors
 Christopher J. W. McClure
 Brian W. Rolek
- The Peregrine Fund, Boise, ID, United States
Birds, especially raptors, play important roles in ecosystems. We examine the International Union for the Conservation of Nature’s (IUCN) Red List to determine which orders of birds have proportionally more or fewer species listed as threatened or declining compared to the Class-wide average. We further examine whether raptors are more threatened or declining than non-raptors and whether the order Accipitriformes is particularly threatened even when excluding Old World vultures – which are especially imperiled. Our results reveal heterogeneity across bird orders in proportions of threatened and declining species, with some orders having greater or lower proportions than the Class-wide proportion. We also show that the proportions of threatened species in each order are correlated with the proportion of declining species. Raptors have both greater proportions of threatened and declining species than non-raptors and Accipitriformes has greater-than-average proportions of threatened and declining species, even if Old World vultures are removed from the analysis. Our results should serve as a framework for discussion of the relative conservation status of bird orders, especially raptors, which are in need of increased conservation attention.
Introduction
Earth is experiencing a sixth mass extinction – losing species at a rate thousands of times higher than between extinction events (Ceballos et al., 2010, 2015). Birds have not been spared from such defaunation (Dirzo et al., 2014; Ceballos et al., 2017). Since the year 1500, a minimum of 159 species of birds have gone extinct and many populations of extant species have been lost (Ceballos et al., 2017; BirdLife International, 2019). Even common species are experiencing declines (Ceballos et al., 2017), with bird populations declining by an estimated 29% across North America declining since 1970 (Rosenberg et al., 2019).
Such bird declines lessen ecosystem function (Şekercioğlu et al., 2004), because birds play important roles including as pollinators, dispersers, scavengers, and predators (Whelan et al., 2008). Raptors (orders Accipitriformes, Cathartiformes, Falconiformes, Strigiformes, and Cariamiformes; Iriarte et al., 2019; McClure et al., 2019) particularly perform important cultural and ecosystem services (Markandya et al., 2008; Donázar et al., 2016; O’Bryan et al., 2018; Aguilera-Alcalá et al., 2020). For example, Turkey Vultures (Cathartes aura) provide an estimated $700 million in ecosystem services by consuming roughly 1,000 tons of carrion per year (Grilli et al., 2019).
Raptor populations are currently of conservation concern. Over half of raptor species are experiencing population declines and 18% are threatened with extinction (McClure et al., 2018). Even of raptor species listed as Least Concern by the International Union for the Conservation of Nature (IUCN), 38% are in decline (McClure et al., 2018). Raptors remain understudied with ten species receiving one-third of research attention and one-fifth of species being virtually unstudied (Buechley et al., 2019). Further, most groups of raptors have lower Red List Indices (Butchart et al., 2007) than birds do generally (McClure et al., 2018) – thus the average raptor is at greater risk of extinction than the average bird.
Old World vultures are especially imperiled, mostly because of intentional and unintentional poisoning (Buechley and Şekercioğlu, 2016; Ogada et al., 2016; McClure et al., 2018). The obligate scavenging behavior of vultures particularly exposes them to dietary toxins while their slow life histories prevent populations from rebounding quickly (Buechley and Şekercioğlu, 2016). Indeed, Africa and Asia are experiencing concurrent vulture crises (Pain et al., 2008; Ogada et al., 2016), which contribute to obligate scavengers being the most threatened avian feeding guild, globally (Buechley and Şekercioğlu, 2016).
Here, we examine the IUCN Red List assessments of bird species (BirdLife International, 2019) to compare the number of threatened and declining species per order, with special attention to raptors. We predict that there will be heterogeneity across Class Aves in extinction risk and population declines, such that some orders are proportionally more or less threatened or declining than others. We further predict that across Class Aves, the proportions of species listed as threatened will correlate with the proportions of species listed as declining in population size. We predict that raptor orders will proportionally have more species listed as threatened and declining than non-raptor orders. We also predict that Accipitriformes will have proportionally higher-than-average numbers of threatened and declining species, even if Old World vultures are not considered.
Methods
BirdLife International is the Red List Authority for all birds on the IUCN Red List. We therefore obtained data from BirdLife International’s database of Red List assessments (BirdLife International, 2019) for all species of birds. For information regarding the assessment process see documentation from the IUCN Standards and Petitions Subcommittee (2017).
Following Bennett and Owens (1997) we used simulations to determine whether there was heterogeneity in extinction risk and declining populations across Class Aves. To determine what the distribution of threatened species would be if those species were distributed randomly across orders, we drew the number of threatened species (see below) at random from the full list of species and noted which orders the randomly-drawn species were within. Next, we calculated the proportion of species within each order that were randomly selected and repeated this simulation 10,000 times. We then created a predicted (or, expected) distribution represented by a histogram of the average number of orders in each frequency bin across all simulations. Frequency bins ranged from zero to one by 0.1. Threatened species were assumed to be randomly distributed among orders when the observed data matched this histogram. We tested whether observed data matched the expected distribution using a X2 test and followed the same simulation methodology above to examine proportions of declining species.
We used logistic regression to examine the proportion of species in each Avian order that is threatened or declining. Under a Bayesian framework, we built a model where species (i) are input as binary data (zeroes or ones, y) and order j = {1,2,3,…,36} is estimated using a y-intercept (α) that varied as a fixed effect: yi∼Bernoulli(Ψi) and logit(Ψi) = αj. The model also calculated the average proportion across Class Aves as a derived parameter. We ran the model separately to examine threatened (threatened = 1, non-threatened = 0) and declining (declining = 1; stable, increasing, or unknown = 0). We coded species to be threatened with extinction if they were listed as Vulnerable, Endangered, Critically Endangered, or Extinct in the Wild. We subtracted the proportions of each order from the average across Class Aves to determine which orders have statistically higher or lower than average proportions of threatened or declining species. We considered orders to have proportions different from average if the 95% credible interval of the difference between the proportion of a given order and the average proportion across all Aves excluded zero.
We also built a model that included whether or not a species is a raptor as a binary covariate and estimated the difference between the proportions of threatened or declining species between raptors and non-raptors. We considered there to be a difference between the raptor proportion and the non-raptor proportion if 95% credible interval of the difference excluded zero.
We implemented models using JAGS (Plummer, 2003) and the package jagsUI (Kellner, 2016) in R (R Core Team, 2019) and implemented three MCMC chains each having 5,000 posterior iterations with burn-in of 1,000 and thinning rate of two. We calculated the Gelman-Rubin statistic (Gelman and Rubin, 1992) and considered convergence of chains when parameters had an < 1.1. We visually assessed trace plots of parameter chains to check for convergence and used vague priors for all parameters (Kéry and Schaub, 2012), and specified priors for coefficients of covariates as normal(0,τ = 0.001).
To examine correlations between proportions of threatened and declining species per order, we used the lm() function in R to conduct regressions of posterior draws (Benson and McClure, 2019) of the of the two proportions. We considered there to be a correlation between proportions of threatened and declining species if the 95% credible interval of the slope parameter excluded zero.
Results
Of the 10,988 species of extant birds recognized by BirdLife International, 1,491 (14%) are threatened with extinction and 5,108 (47%) have declining global populations. Simulations revealed the numbers of threatened (X2 = 31.95, df = 2, p < 0.001; Figure 1) and declining (X2 = 18.94, df = 2, p < 0.001; Figure 1) species are non-randomly distributed among bird orders.
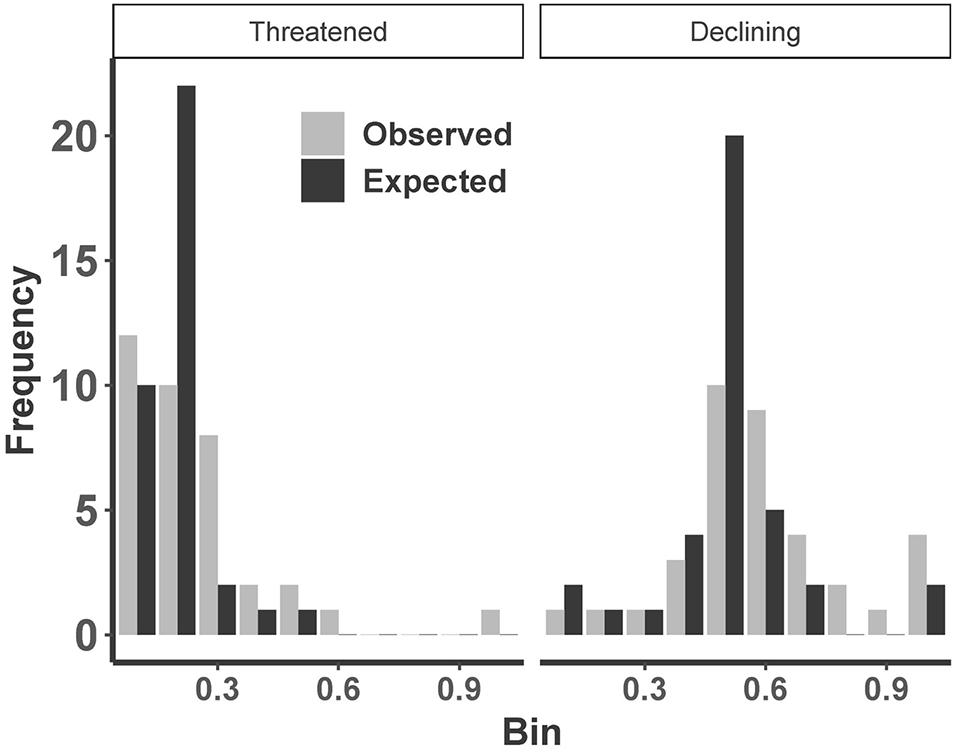
Figure 1. Frequency histogram across bird orders of proportion of species that are threatened or declining. The expected distributions are based on simulations.
Of the 36 bird orders, six (17%) had statistically lower proportions of threatened species than average (i.e., the Class-wide proportion) while 12 (33%) had statistically higher proportions than average (Figure 2). Regarding proportions of declining species, three (8%) orders had lower proportions than average while 12 (33%) had statistically higher proportions than average (Figure 2). Eight (22%) orders had higher proportions of both threatened and declining species (Figure 2), and two (6%) orders had fewer threatened and declining species than average. Per bird order, the proportions of threatened species were generally correlated with the proportions of declining species with linear models having a median R2 of 0.18 (CRI = 0.03–0.38) and slope of 0.37 (CRI = 0.15–0.61; Figure 3).
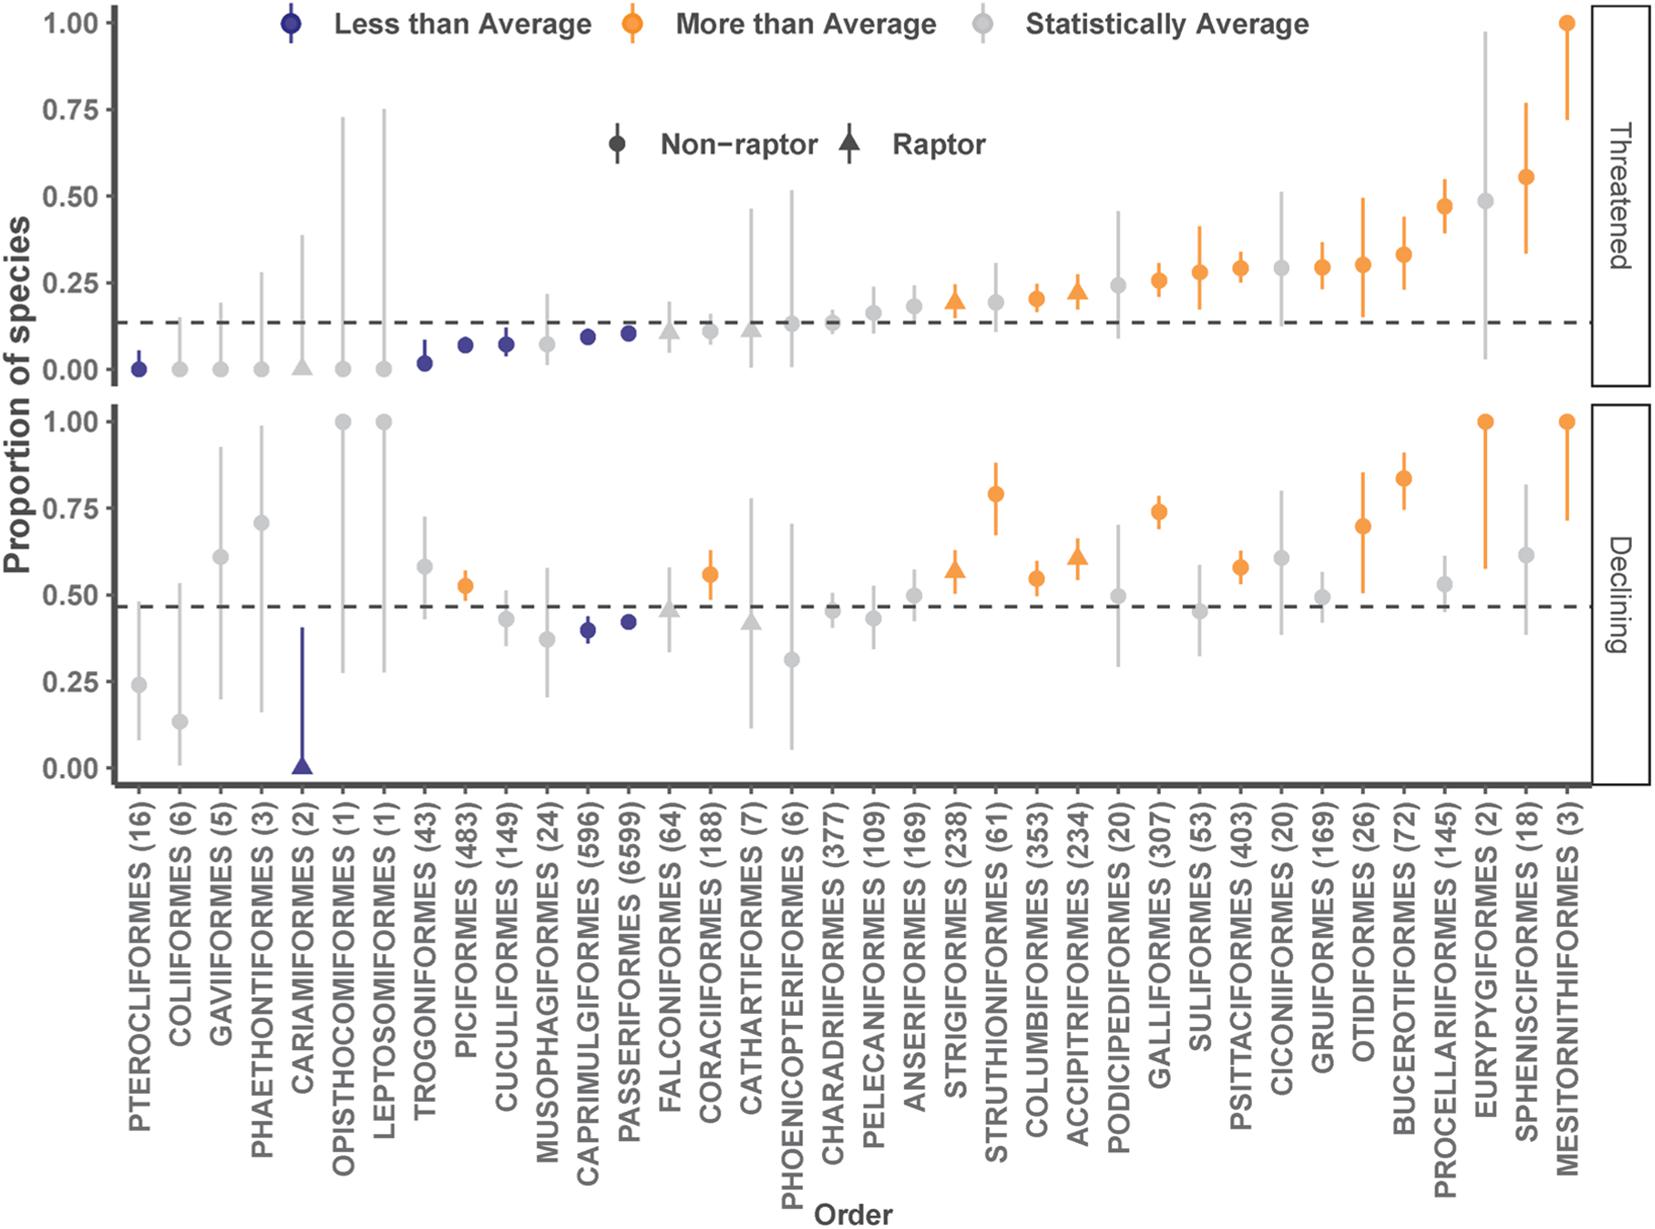
Figure 2. Median (points) and 95% CRI (lines) of proportions of threatened and declining species per bird order. Horizontal dashed lines represent the Class-wide proportion (i.e., Average). Orders are more than average (orange) if the 95% CRI of the difference between the order’s proportion and the average is negative, and less than average (blue) if that value is positive. Moving from left to right, orders are ranked by median proportion of threatened species. The parenthetical numbers in the x-axis labels are the number of species per order.
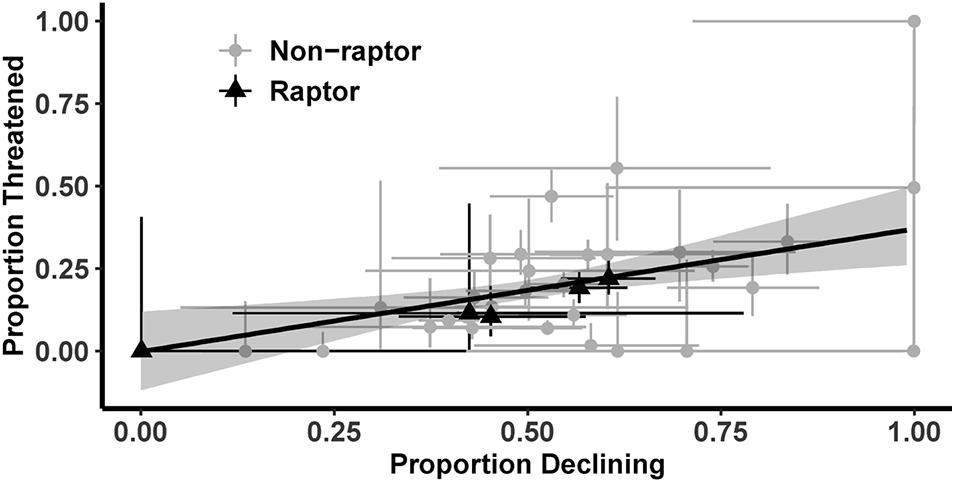
Figure 3. Results of a linear regression between the proportions of threatened and declining species per order. Black line is the median prediction and gray shading is the 95% CRI.
The proportion of Old World vultures that were threatened with extinction was 0.69 (CRI = 0.44–0.89) and that of other Accipitriformes was 0.19 (CRI = 0.14–0.24; Figure 4). These proportions for Old World vultures and other Accipitriformes were therefore both different from average with those differences being 0.56 (CRI = 0.30–0.75) and 0.05 (CRI = 0.004–0.11), respectively. Regarding proportions of declining species, the value for Old World vultures was 0.83 (CRI = 0.56–0.96) and other Accipitriformes was 0.59 (CRI = 0.53–0.61; Figure 4). The differences between these proportions and the Class-wide proportion was 0.36 (CRI = 0.13–0.43) and 0.13 (CRI = 0.06–0.19).
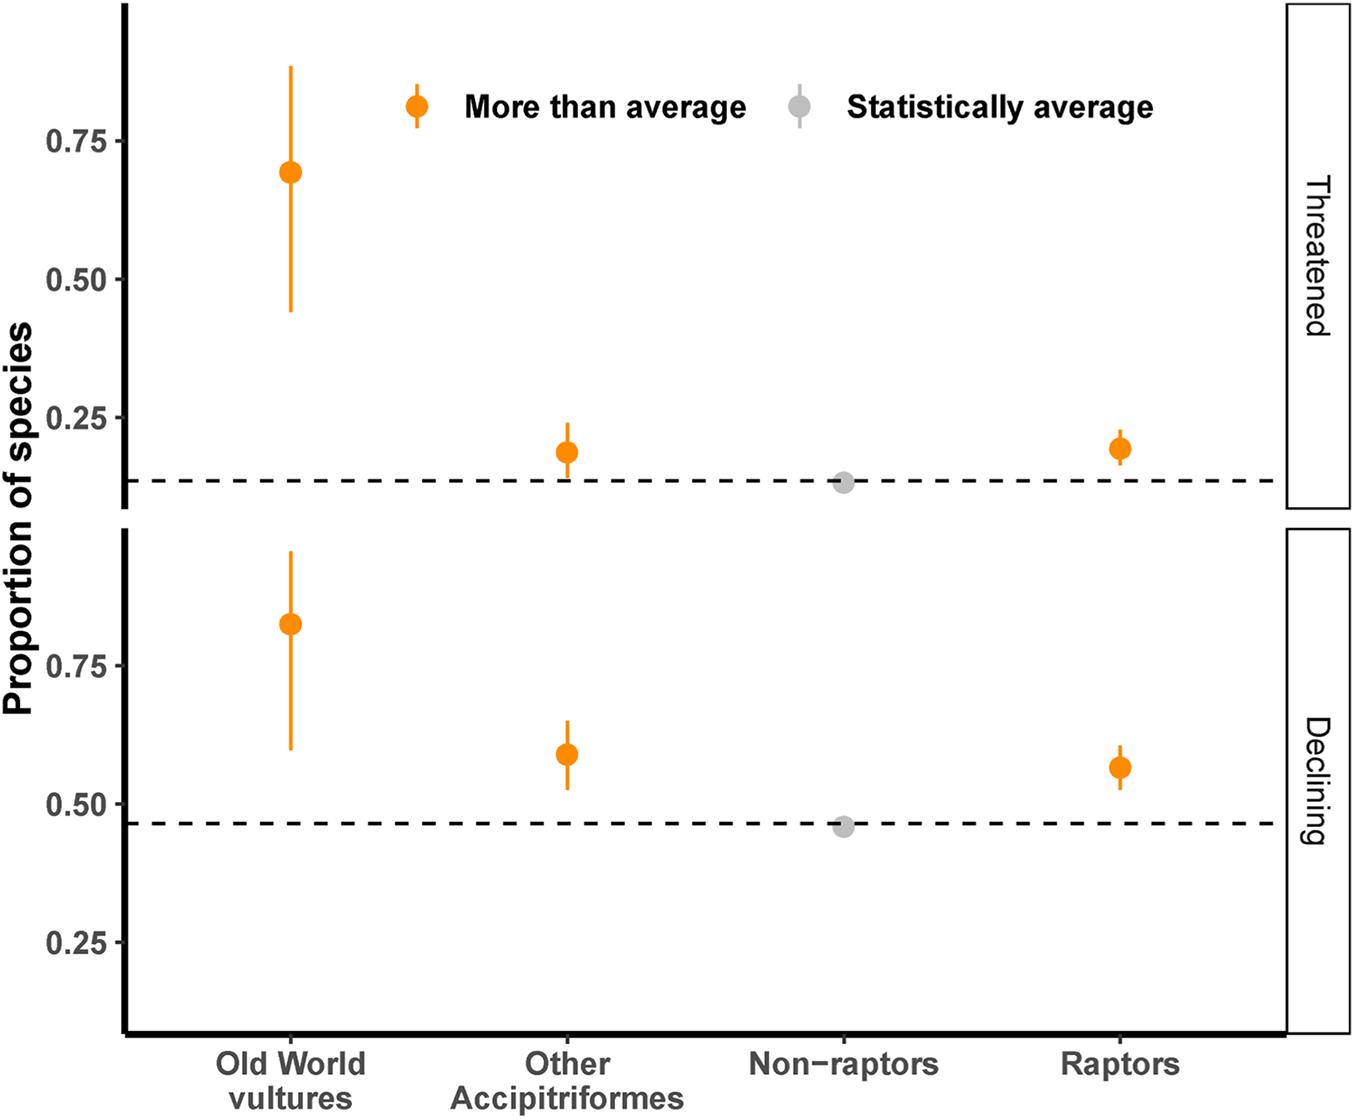
Figure 4. Median (points) and 95% CRI (lines) of proportions of threatened and declining species per group of birds. Horizontal dashed lines represent the Class-wide proportion (i.e., Orders are more than average (orange) if the 95% CRI of the difference between the order’s proportion and the average is negative).
The proportion of raptor species threatened with extinction was 0.19 (CRI = 0.16–0.23) whereas that proportion for non-raptors was 0.13 (CRI = 0.12–0.14; Figure 4). The proportion of raptors that are threatened was therefore 0.06 (CRI = 0.03–0.10) greater than that of non-raptors. Results were similar for the proportions of declining species with raptors having 0.57 (CRI = 0.53–0.61) and non-raptors having 0.46 (CRI = 0.45–0.47), resulting in a difference of 0.11 (CRI = 0.07–0.15; Figure 4).
Discussion
During the 1990s, Bennett and Owens (1997) demonstrated variation in bird extinction risk across families. We demonstrate that this heterogeneity continues today across orders and that variation also exists regarding proportions of declining species. We further show that several orders have proportionally different numbers of threatened or declining species than average, especially highlighting entire orders of conservation concern. These orders are in need of especially increased conservation attention. For example, all three members of Mesitornithiformes (mesites) are threatened with extinction whereas none of the 16 species of Pterocliformes (sandgrouse) are threatened. The eight orders containing both proportionally more threatened species and more declining species deserve special emphasis (Table 1). Psittaciformes (parrots) are the most speciose of these eight orders, are especially endangered (Olah et al., 2016), and are considered umbrella species (Vergara-Tabares et al., 2020). Our results suggest parrots are declining more than most birds. Galliformes (pheasants and allies) – considered both flagship and umbrella taxa (McGowan et al., 2009) – also have high proportions of threatened and declining species.

Table 1. Median of proportions of threatened and declining species per bird order. Orders are more than average (orange) if the 95% CRI of the difference between the order’s proportion and the average is negative, and less than average (blue) if that value is positive.
Both the proportion of raptor species that were threatened and the proportion that were declining were greater than that of non-raptors. Our results therefore support recent work expressing concern over the conservation status of raptors (McClure et al., 2018; Sarasola et al., 2018; Buechley et al., 2019). The two most speciose raptor orders had higher-than-average proportions both of threatened and declining species. Accipitriformes (hawks, eagles, and Old World vultures) contain the Old World vultures, which are victims of the African and Asian vulture crises (Pain et al., 2008; Ogada et al., 2016). Yet, even the proportions of both threatened and declining species of the other (non-vulture) species of Accipitriformes were higher than average. Thus, even though Old World vultures are indeed particularly imperiled, Accipitriformes, in general, should be considered of conservation concern. Strigiformes (owls) also had greater proportions of threatened and declining species than average. Owls are particularly understudied (Buechley et al., 2019; McClure et al., 2020) and therefore should be targets of both conservation and research efforts.
Raptor orders generally conformed to the pattern of correlation between the proportions of orders that are threatened and declining. We expected this correlation between threatened and declining proportions because severe population declines are one of the criteria that warrant threatened status (IUCN Standards and Petitions Subcommittee, 2017). However, species can be declining gradually such that they do not warrant threatened status, and other criteria such as small or isolated populations can result in a threatened listing. Exceptions to this pattern therefore especially deserve mention. For example, Leptosomiformes (Cuckoo Roller) and Opisthocomiformes (Hoatzin) are single-species orders where the representative species are non-threatened yet declining. Similarly, Piciformes (woodpeckers and allies) was the only order to be statistically lower than average in proportion of threatened species (also see Bennett and Owens, 1997), yet statistically higher than average in proportion of declining species. Therefore, the relatively non-threatened status of Piciformes might not continue if population declines persist into the future.
Unsurprisingly, most orders were statistically average, and some were proportionally more secure. Particularly, the two most speciose orders of birds – Passeriformes (perching birds) and Caprimulgiformes (hummingbirds, nightjars, and allies) – have lower-than-average proportions of threatened and declining species. The only raptor order with any proportion that was statistically less than average was Cariamiformes (seriemas), which consists of two species that are both non-threatened with stable populations. Falconiformes (falcons and caracaras) and Cathartiformes (New World vultures) are raptor orders that had statistically average proportions of threatened and declining species, indicating that these orders are generally equal with most others regarding conservation need.
We analyzed Class Aves mostly at the order level, while particularly examining the evolutionary grade that constitutes raptors (Jarvis et al., 2014; Iriarte et al., 2019; McClure et al., 2019). Other polyphyletic groups of birds have received recent concern. For example, 15% of non-excavating tree-cavity nesting birds are threatened with extinction (van der Hoek et al., 2017). Croxall et al. (2012) reported that 28% of seabirds are threatened. Our results support Croxall et al. (2012) with the two orders that constitute almost half of all seabirds – Sphenisciformes (penguins) and Procellariiformes (albatrosses and petrels) – having higher-than-average proportions of threatened species.
Our analysis is a framework for discussion of the relative conservation status of bird orders, especially raptors, but caution is needed when using these results to guide conservation action. Because we considered birds with unknown population trends to be non-declining, and many species of birds are poorly monitored, our results should be viewed as conservative with a possible bias against orders with a large percentage of poorly studied species. Indeed, it is possible, perhaps likely, that many of the species with unknown population trends are in decline. Further, similar to the binomial tests performed by Bennett and Owens (1997), our binomial model is sensitive to the number of species in an order such that larger numbers of species increase the likelihood of an order’s proportion being different from the Class-wide proportion. Put differently, our model has low power to detect differences when the number of species in an order is small. So, the Cuckoo Roller and Hoatzin orders are not significantly different from the class-wide proportions of declining species, even though 100% of those orders (i.e., the single species) are declining. Further, even though there were several orders with below-average proportions of threatened or declining species, individual threatened or declining species within them still deserve conservation action. For example, the critically endangered California Condor (Gymnogyps californianus) should be actively managed despite the rest of Cathartiformes being non-threatened. And, even though Passeriformes contained relatively few threatened and declining species by proportion, it contained the largest absolute count of these species – such that most declining species and a plurality of threatened species are passerines.
Birds serve well as indicators of biodiversity because they are sensitive to environmental change, widespread, diverse, and relatively easy to monitor (Gregory and van Strien, 2010). As top predators, raptors especially reflect the health of ecosystems (Sergio et al., 2005, 2006). Indeed, as populations of scavengers such as Old World vultures are lost, human health might suffer (Markandya et al., 2008). The proportions of threatened and declining species that we report therefore likely reflect underlying problems with ecosystem function. As the Anthropocene continues, conservation action to protect birds and their ecosystems must be made a top international priority.
Data Availability Statement
Publicly available datasets were analyzed in this study. These data can be found here: http://datazone.birdlife.org.
Author Contributions
CM conceived the study and wrote the first draft. Both authors performed analysis and edited the manuscript.
Conflict of Interest
The authors declare that the research was conducted in the absence of any commercial or financial relationships that could be construed as a potential conflict of interest.
Acknowledgments
We thank donors to The Peregrine Fund and the M. J. Murdock Charitable Trust for funding. We also appreciate Birdlife International for conducting and sharing Red List assessments.
References
Aguilera-Alcalá, N., Morales-Reyes, Z., Martín-López, B., Moleón, M., and Sánchez-Zapata, J. A. (2020). Role of scavengers in providing non-material contributions to people. Ecol. Indicat. 117:106643. doi: 10.1016/j.ecolind.2020.106643
Bennett, P. M., and Owens, I. P. F. (1997). Variation in extinction risk among birds: chance or evolutionary predisposition? Proc. Royal Soc. B Biol. Sci. 264, 401–408. doi: 10.1098/rspb.1997.0057
Benson, P. C., and McClure, C. J. W. (2019). The decline and rise of the Kransberg Cape Vulture colony over 35 years has implications for composite population indices and survey frequency. IBIS 162, 863–872. doi: 10.1111/ibi.12782
BirdLife International. (2019). IUCN Red List for Birds. Available at http://www.birdlife.org (accessed January 21, 2019).
Buechley, E. R., Santangeli, A., Girardello, M., Neate-Clegg, M. H., Oleyar, D., McClure, C. J. W., et al. (2019). Global raptor research and conservation priorities: tropical raptors fall prey to knowledge gaps. Div. Distrib. 25, 856–869. doi: 10.1111/ddi.12901
Buechley, E. R., and Şekercioğlu, ÇH. (2016). The avian scavenger crisis: Looming extinctions, trophic cascades, and loss of critical ecosystem functions. Biol. Conserv. 198, 220–228. doi: 10.1016/j.biocon.2016.04.001
Butchart, S. H. M., Akçakaya, H. R., Chanson, J., Baillie, J. E. M., Collen, B., Quader, S., et al. (2007). Improvements to the Red List Index. PLoS One 2:e140. doi: 10.1371/journal.pone.0000140
Ceballos, G., Ehrlich, P. R., Barnosky, A. D., Garcia, A., Pringle, R. M., and Palmer, T. M. (2015). Accelerated modern human-induced species losses: entering the sixth mass extinction. Sci. Adv. 1:e1400253. doi: 10.1126/sciadv.1400253
Ceballos, G., Ehrlich, P. R., and Dirzo, R. (2017). Biological annihilation via the ongoing sixth mass extinction signaled by vertebrate population losses and declines. Proc. Natl. Acad. Sci. U.S.A. 114, E6089–E6096. doi: 10.1073/pnas.1704949114
Ceballos, G., Garcia, A., and Ehrlich, P. R. (2010). The sixth extinction crisis: loss of animal populations and species. J. Cosmol. 8, 1821–1831.
Croxall, J. P., Butchart, S. H. M., Lascelles, B., Stattersfield, A. J., Sullivan, B., Symes, A., et al. (2012). Seabird conservation status, threats and priority actions: a global assessment. Bird Conserv. Int. 22, 1–34. doi: 10.1017/S0959270912000020
Dirzo, R., Young, H. S., Galetti, M., Ceballos, G., Isaac, N. J. B., and Collen, B. (2014). Defaunation in the Anthropocene. Science 345, 401–406. doi: 10.1126/science.1251817
Donázar, J. A., Cortés-Avizanda, A., Fargallo, J. A., Margalida, A., Moleón, M., Morales-Reyes, Z., et al. (2016). Roles of raptors in a changing world: from flagships to providers of key ecosystem services. Ardeola 63, 181–234. doi: 10.13157/arla.63.1.2016.rp8
Gelman, A., and Rubin, D. (1992). Inference from iterative simulation using multiple sequences. Statist. Sci. 7, 457–472. doi: 10.1214/ss/1177011136
Gregory, R. D., and van Strien, A. (2010). Wild bird indicators: using composite population trends of birds as measures of environmental health. Ornithol. Sci. 9, 3–22. doi: 10.2326/osj.9.3
Grilli, M. G., Bildstein, K. L., and Lambertucci, S. A. (2019). Nature’s clean-up crew: quantifying ecosystem services offered by a migratory avian scavenger on a continental scale. Ecosyst. Serv. 39:100990. doi: 10.1016/j.ecoser.2019.100990
Iriarte, J. A., Rivas-Fuenzalida, T., and Jaksic, F. M. (2019). Las Aves Rapaces De Chile. Santiago, CH: Ocho Libros.
Jarvis, E. D., Mirarab, S., Aberer, A. J., Li, B., Houde, P., Li, C., et al. (2014). Whole-genome analyses resolve early branches in the tree of life of modern birds. Science 346, 1320–1331. doi: 10.1126/science.1253451
Kellner, K. (2016). jagsUI: A Wrapper Around “rjags” to Streamline “JAGS” Analyses. R package version 1.4.2. https://CRAN.R-project.org/package=jagsUI (accessed November 17, 2020).
Kéry, M., and Schaub, M. (2012). Bayesian Population Analysis Using WinBUGS: A Hierarchical Perspective. London: Elsevier.
Markandya, A., Taylor, T., and Longo, A. (2008). Counting the cost of vulture declines – economic appraisal of the benefits of the Gyps vulture in India 1. Ecol. Econ. 67, 194–204.
McClure, C. J. W., Lepage, D., Dunn, L., Anderson, D. L., Schulwitz, S. E., Camacho, L., et al. (2020). Towards reconciliation of the four world bird lists: hotspots of disagreement in taxonomy of raptors. Proc. Biol. Sci. 287:20200683. doi: 10.1098/rspb.2020.0683
McClure, C. J. W., Schulwitz, S. E., Anderson, D. L., Robinson, B. W., Mojica, E. K., Therrien, J.-F., et al. (2019). Commentary: defining raptors and birds of prey. J. Raptor Res. 53, 419–430.
McClure, C. J. W., Westrip, J. R. S., Johnson, J. A., Schulwitz, S. E., Virani, M. Z., Davies, R., et al. (2018). State of the world’s raptors: distributions, threats, and conservation recommendations. Biol. Conserv. 227, 390–402. doi: 10.1016/j.biocon.2018.08.012
McGowan, P. J. K., Zhang, Y. Y., and Zhang, Z. W. (2009). Galliformes - Barometers of the state of applied ecology and wildlife conservation in China. J. Appl. Ecol. 46, 524–526. doi: 10.1111/j.1365-2664.2009.01631.x
O’Bryan, C. J., Braczkowski, A. R., Beyer, H. L., Carter, N. H., Watson, J. E. M., and McDonald-Madden, E. (2018). The contribution of predators and scavengers to human well-being. Nat. Ecol. Evol. 2, 229–236. doi: 10.1038/s41559-017-0421-2
Ogada, D., Shaw, P., Beyers, R. L., Buij, R., Murn, C., Thiollay, J. M., et al. (2016). Another continental vulture crisis: Africa’s vultures collapsing toward extinction. Conserv. Lett. 9, 89–97. doi: 10.1111/conl.12182
Olah, G., Butchart, S. H. M., Symes, A., Guzmán, I. M., Cunningham, R., Brightsmith, D. J., et al. (2016). Ecological and socio-economic factors affecting extinction risk in parrots. Biodiv. Conserv. 25, 205–223. doi: 10.1007/s10531-015-1036-z
Pain, D. J., Bowden, C. G. R., Cunningham, A. A., Cuthbert, R., Das, D., Gilbert, M., et al. (2008). The race to prevent the extinction of south asian vultures. Bird Conserv. Int. 18, S30–S48. doi: 10.1017/s0959270908000324
Plummer, M. (2003). “JAGS: A program for analysis of Bayesian graphical models using Gibbs sampling,” in Proceedings of the 3rd International Workshop on Distributed Statistical Computing, Vienna, 1–10.
R Core Team (2019). R: A Language and Environment for Statistical Computing. Vienna: R Foundation for Statistical Computing.
Rosenberg, K. V., Dokter, A. M., Blancher, P. J., Sauer, J. R., Smith, A. C., Smith, P. A., et al. (2019). Decline of the north American avifauna. Science 366, 120–124. doi: 10.1126/science.aaw1313
Sarasola, J. H., Grande, J. M., and Negro, J. J. (2018). Birds of Prey: Biology and Conservation in the XXI Century. New York, NY: Springer-Verlag.
Şekercioğlu, ÇH., Daily, G. C., and Ehrlich, P. R. (2004). Ecosystem consequences of bird declines. Proc. Natl. Acad. Sci. U.S.A. 101, 18042–18047. doi: 10.1073/pnas.0408049101
Sergio, F., Newton, I., and Marchesi, L. (2005). Top predators and biodiversity. Nature 436:192. doi: 10.1038/436192a
Sergio, F., Newton, I., Marchesi, L., and Pedrini, P. (2006). Ecologically justified charisma: preservation of top predators delivers biodiversity conservation. J. Appl. Ecol. 43, 1049–1055. doi: 10.1111/j.1365-2664.2006.01218.x
IUCN Standards and Petitions Subcommittee (2017). Guidelines for Using the IUCN Red List Categories and Criteria. Version 13. Available online at: http://www.iucnredlist.org/documents/RedListGuidelines.pdf (accessed November 17, 2020).
van der Hoek, Y., Gaona, G. V., and Martin, K. (2017). The diversity, distribution and conservation status of the tree-cavity-nesting birds of the world. Divers. Distrib. 23, 1120–1131. doi: 10.1111/ddi.12601
Vergara-Tabares, D. L., Cordier, J. M., Landi, M. A., Olah, G., and Nori, J. (2020). Global trends of habitat destruction and consequences for parrot conservation. Glob Change Biol. 26, 4251–4262. doi: 10.1111/gcb.15135
Keywords: bird of prey, population decline, raptor, Red List, threatened species, vulture
Citation: McClure CJW and Rolek BW (2020) Relative Conservation Status of Bird Orders With Special Attention to Raptors. Front. Ecol. Evol. 8:593941. doi: 10.3389/fevo.2020.593941
Received: 11 August 2020; Accepted: 09 November 2020;
Published: 27 November 2020.
Edited by:
Bruktawit Abdu Mahamued, Kotebe Metropolitan University (KMU), EthiopiaReviewed by:
Marcelo Bertellotti, CONICET Center for the Study of Marine Systems (CESIMAR), ArgentinaRichard Patrick Reading, Independent Researcher,
Copyright © 2020 McClure and Rolek. This is an open-access article distributed under the terms of the Creative Commons Attribution License (CC BY). The use, distribution or reproduction in other forums is permitted, provided the original author(s) and the copyright owner(s) are credited and that the original publication in this journal is cited, in accordance with accepted academic practice. No use, distribution or reproduction is permitted which does not comply with these terms.
*Correspondence: Christopher J. W. McClure, cmcclure@peregrinefund.org