Exploring the Variability of Tropical Savanna Tree Structural Allometry with Terrestrial Laser Scanning


1
Research Institute for the Environment & Livelihoods, College of Engineering, IT and Environment, Charles Darwin University, Casuarina, NT 0909, Australia
2
CSIRO Land and Water, PMB 44, Winnellie, NT 0822, Australia
3
CAVElab—Computational and Applied Vegetation Ecology, Faculty of Bioscience Engineering, Ghent University, 9000 Gent, Belgium
*
Author to whom correspondence should be addressed.
Remote Sens. 2020, 12(23), 3893; https://doi.org/10.3390/rs12233893
Submission received: 31 August 2020
/
Revised: 25 September 2020
/
Accepted: 19 November 2020
/
Published: 27 November 2020
(This article belongs to the Special Issue Remote Sensing of Savannas and Woodlands)
Abstract
:Individual tree carbon stock estimates typically rely on allometric scaling relationships established between field-measured stem diameter (DBH) and destructively harvested biomass. The use of DBH-based allometric equations to estimate the carbon stored over larger areas therefore, assumes that tree architecture, including branching and crown structures, are consistent for a given DBH, and that minor variations cancel out at the plot scale. We aimed to explore the degree of structural variation present at the individual tree level across a range of size-classes. We used terrestrial laser scanning (TLS) to measure the 3D structure of each tree in a 1 ha savanna plot, with coincident field-inventory. We found that stem reconstructions from TLS captured both the spatial distribution pattern and the DBH of individual trees with high confidence when compared with manual measurements (R = 0.98, RMSE = 0.0102 m). Our exploration of the relationship between DBH, crown size and tree height revealed significant variability in savanna tree crown structure (measured as crown area). These findings question the reliability of DBH-based allometric equations for adequately representing diversity in tree architecture, and therefore carbon storage, in tropical savannas. However, adoption of TLS outside environmental research has been slow due to considerable capital cost and monitoring programs often continue to rely on sub-plot monitoring and traditional allometric equations. A central aspect of our study explores the utility of a lower-cost TLS system not generally used for vegetation surveys. We discuss the potential benefits of alternative TLS-based approaches, such as explicit modelling of tree structure or voxel-based analyses, to capture the diverse 3D structures of savanna trees. Our research highlights structural heterogeneity as a source of uncertainty in savanna tree carbon estimates and demonstrates the potential for greater inclusion of cost-effective TLS technology in national monitoring programs.
1. Introduction
Savanna vegetation structure and biomass are shaped by the scale-dependent interaction of resource and disturbance drivers. Whilst limited by abiotic resource factors such as climatic conditions, moisture availability [1] and topoedaphic controls [2,3], savanna vegetation is also modulated by disturbance factors such as fire regime (frequency, severity) and storm damage, herbivory and human utilization [4,5,6,7]. The interaction and relative importance of these drivers differ at contrasting scales and their impact on above-ground biomass (AGB) can be localised and patchy, varying even at individual tree level [5,8]. A commonly referenced estimate approximates savanna vegetation at of global production; however, the range of 1–12 t C ha yr net primary productivity [9] provided with this estimate indicates large unresolved uncertainty and considerable opportunity to improve those estimates [10]. Global carbon models have long been challenged by poor representation of the structural heterogeneity in tropical savannas [11] and our understanding of savanna carbon dynamics remains limited [12,13,14].
At the individual tree level, resource constraints and disturbance drivers may result in strong variability of individual tree architecture and therefore AGB. Fire and herbivory are the two main drivers dramatically altering the vertical structure of savanna trees in African savannas [15,16]. In the tropical savannas of northern Australia however, termites in particular are a significant source of biomass consumption [17] and the activity of wood-eating termites results in stem and branch hollowing, increasing the susceptibility of woody vegetation to storm and fire damage. The resulting asymmetric tree architecture is particularly evident in the crown structure of large trees [18,19]. Tree crowns in north Australian savanna vegetation are estimated to account for up to nearly of total tree AGB, where destructive sampling of a small number of trees (n = 48) has shown considerable variation in the proportion of AGB stored in the crown (Eucalypts: branch biomass and leaf biomass ; non-Eucalypts: branch biomass and leaf biomass ) [20]. However, allometric models commonly rely only on stem diameter (DBH), or DBH and height, to estimate AGB as these are relatively easy to measure in the field. Recent studies have shown that adding crown diameter as a predictive variable to estimate AGB provides more robust allometric models [21]. However, estimating crown dimensions by means of measuring vertical crown projection is generally omitted from field inventories due to time constraints and the inherent inaccuracy of such ground-based measures. Not accounting for variations in individual tree architecture could be particularly problematic in tropical savannas, where tree crown structure has the potential to vary significantly for a given DBH [22], however, the extent of heterogeneity in savanna crown architecture is yet to be established.
LiDAR scanning has become a well-recognised and rapidly developing approach to quantify forest structure in great detail, as it enables us to produce detailed 3D reconstructions of individual trees and their structure [23,24]. Of the range of LiDAR platforms, terrestrial laser scanning (TLS) has been increasingly used for investigating heterogeneity in tree and stand structure in space and time, due to its high point densities and scan collections from beneath the canopy [25,26]. TLS data allows us to extract traditional field measured variables such as DBH, stand basal area and tree canopy height with a high degree of precision [27]. In addition, TLS also enables new metrics, such as detailed vertical profiles [28] of tree and canopy structure [29,30,31] and individual crown-morphology to be quantified [32], thus providing a powerful tool to better quantify heterogeneity in tree crown structure in tropical savannas.
When applied in temperate Eucalypt open forest, TLS data was able to show a weakening allometric relationship between DBH and AGB with increasing DBH [33]. We hypothesise that in tropical savanna, given the cumulative effect of disturbance on tree architecture, variance in crown size is a major driver of this weakening relationship and a similar trend can therefore be observed between DBH and crown area. TLS now allows us to measure large numbers of individual trees to investigate the relationship between crown size and DBH as a potential source of uncertainty impacting the stability of savanna tree allometric relationships.
A major limiting factor to the adoption of TLS for vegetation surveys is the budgetary implications of purchasing high-quality scanners (>USD 100,000) generally used for geomorphological and ecological surveys [34]. Such scanners generally have small beam divergence, high signal-to-noise ratio and in-built GPS systems. These scanners also have a minimum scanning range of several hundred meters. However, for the purpose of vegetation surveys, scan points are generally located less than 50 m apart to avoid data loss through occlusion. Smaller, less precise and lower-powered TLS units generally used in architecture can technically obtain point clouds within that range, however, their efficacy in surveying savanna vegetation structure has not yet been investigated. While increasingly adopted in environmental research, the acquisition cost is a major barrier to the adoption of TLS scanning in vegetation monitoring programs, and the advantages of TLS need to be replicable using more affordable options to enable wider adoption [35].
As such, the aim of this study is to explore the potential of lower-cost (~USD 20,000) TLS in capturing diverse tree architecture in tropical savanna ecosystems. Using this technology, our primary research objective is to determine the degree of variability present in the tree crown area for a given DBH across many hundreds of individual trees. We approached this by coupling a lower-cost, light-weight TLS scanning system with traditional field-inventory surveys at a research site in the tropical savanna of northern Australia.
2. Materials and Methods
2.1. Study Site
The study was carried out in August 2018 in open woodland savanna at the Terrestrial Ecosystem Research Network (TERN) Savanna Supersite at Litchfield National Park in the Northern Territory, Australia [36] (Figure 1). Litchfield National Park (13.17S, 130.79E), located 100 km south of Darwin, is subject to a wet–dry tropical climate with the majority of annual rainfall (1750 mm average annual rainfall at Buley rockhole, 7.4 km [37]) occurring between November and April. The survey area was a 1 ha plot and is dominated by Eucalyptus miniata with moderate stem density of 492 trees ha (>0.05 m DBH) and DBH values (up to 0.49 m). Most crowns are not overlapping, and leaves of local eucalypt species are largely near-vertically aligned, allowing good TLS coverage of tree crowns.
2.2. Data Acquisition
A manual field inventory survey was conducted at the 1 ha site where DBH, tree species and a tree health rating were recorded for every tree with DBH > 0.05 m. The trunks of multi-stemmed trees were measured individually if DBH exceeded 0.05 m. DBH was measured over-bark at 1.3 m above ground level. Tree health was assessed by a single assessor on a scale of 1 to 5 with 1 representing undamaged and 5 representing dead [38]. To correlate individual measurements to those obtained by the TLS survey, a stem map was produced using a real-time kinematic (RTK) positioning system (Leica GS16 with SmartLink). TLS point cloud data was collected during the same field campaign using a Leica BLK360 (wavelength 830 nm, maximum range 60 m at 78% albedo, beam divergence 0.4 mrad, range accuracy 4 mm at 10 m and 7 mm at 20 m [39]) in high point density collection mode (resolution 5 mm at 10 m, scan size approx. 65 mio points) taking less than four minutes for each scan (Figure 2). The plot was scanned in a regular grid fashion from 25 points with 25 m spacing between scan locations to minimise occlusion. A reflector was placed to the north of each scan to aid manual visual alignment of individual scans. Scanning took place in the morning and later afternoon to avoid strong midday breezes and was completed in one day.
2.3. Point Cloud Processing
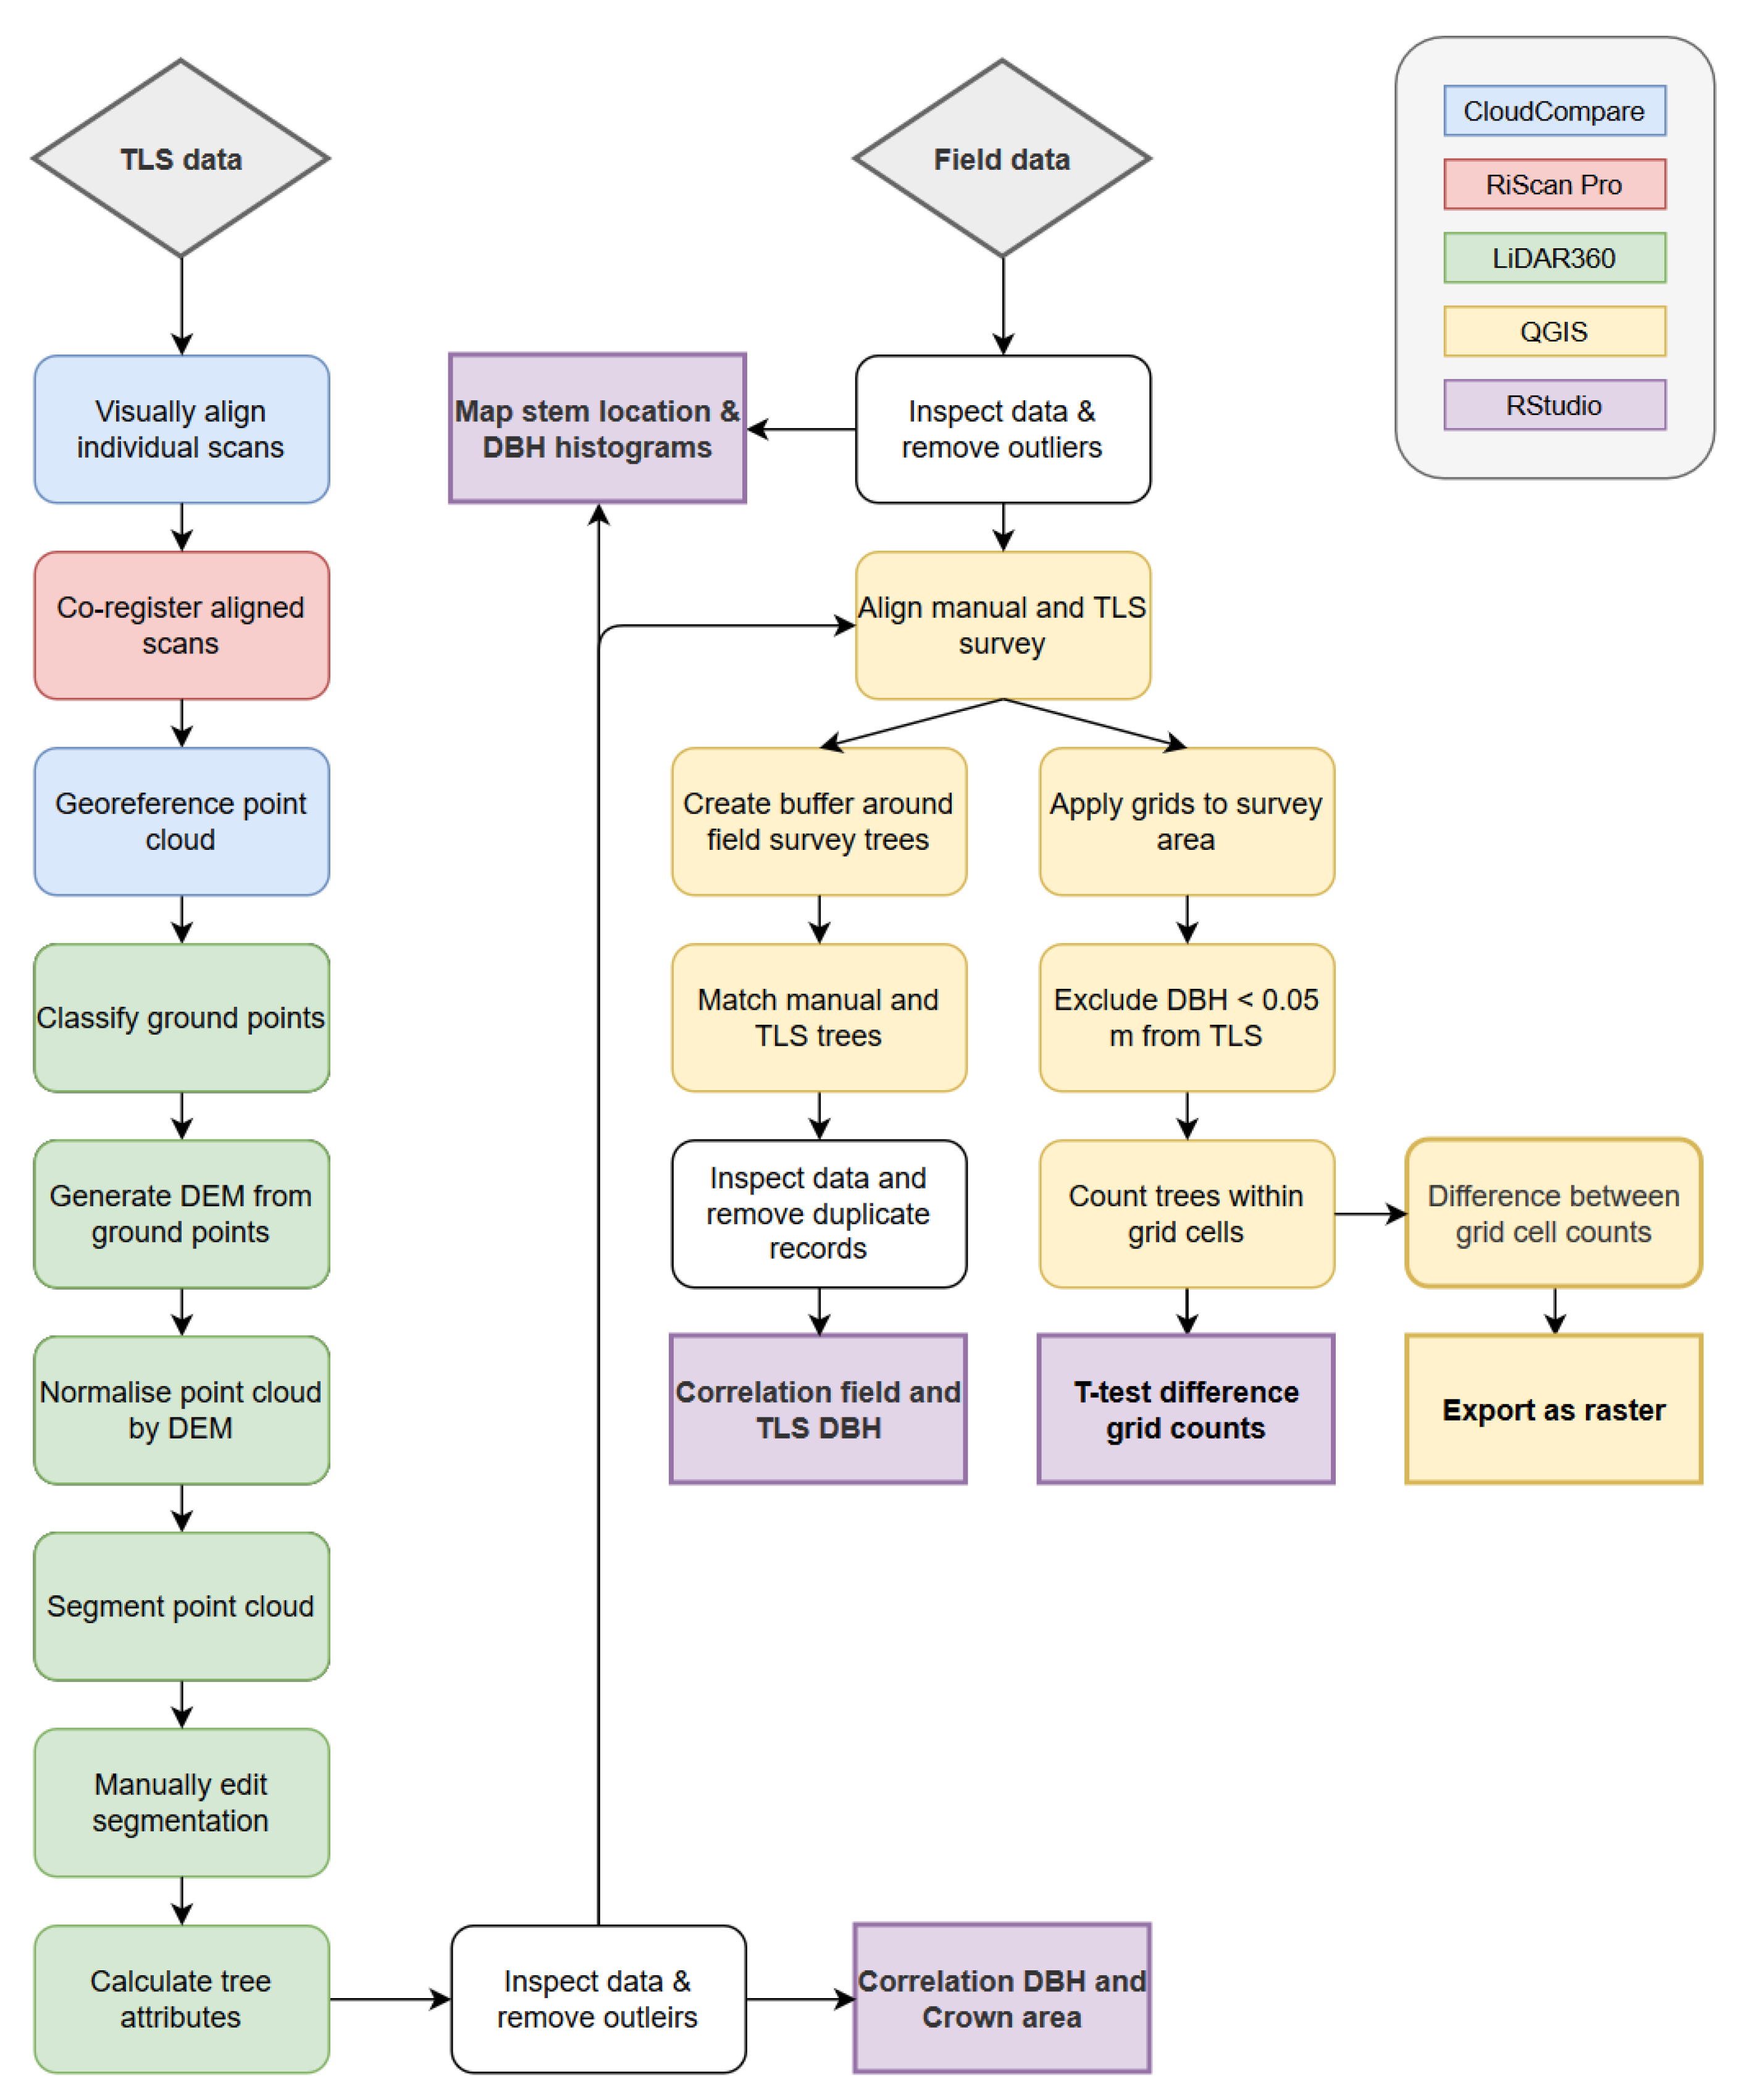
The raw data was sub-sampled into a uniform point-spacing using an octree filter of 0.01 m. The individual point clouds were visually aligned using CloudCompare v 2.10.2 (Zephyrus), and co-registered using the Multi-station Adjustment module in RIEGL RiSCAN PRO v 2.9. The co-registered point cloud was georeferenced to the WGS84/UTM52S coordinate system using CloudCompare where RTK points of the flux tower and anchor points for its three guy ropes were used as a reference. Point cloud segmentation and extraction of tree attributes (DBH, tree height, crown area) was performed using LiDAR360 v 4.0. Spatial analysis was performed using QGIS v 3.8.0 and statistical analysis using RStudio. An overview of the workflow is shown in Figure 3 and described in detail below. Crown area was chosen as a representative measurement for crown size as it is readily replicated and commonly used in airborne LiDAR surveys (e.g., [40,41]) and is therefore scalable.
2.3.1. Point Cloud Segmentation
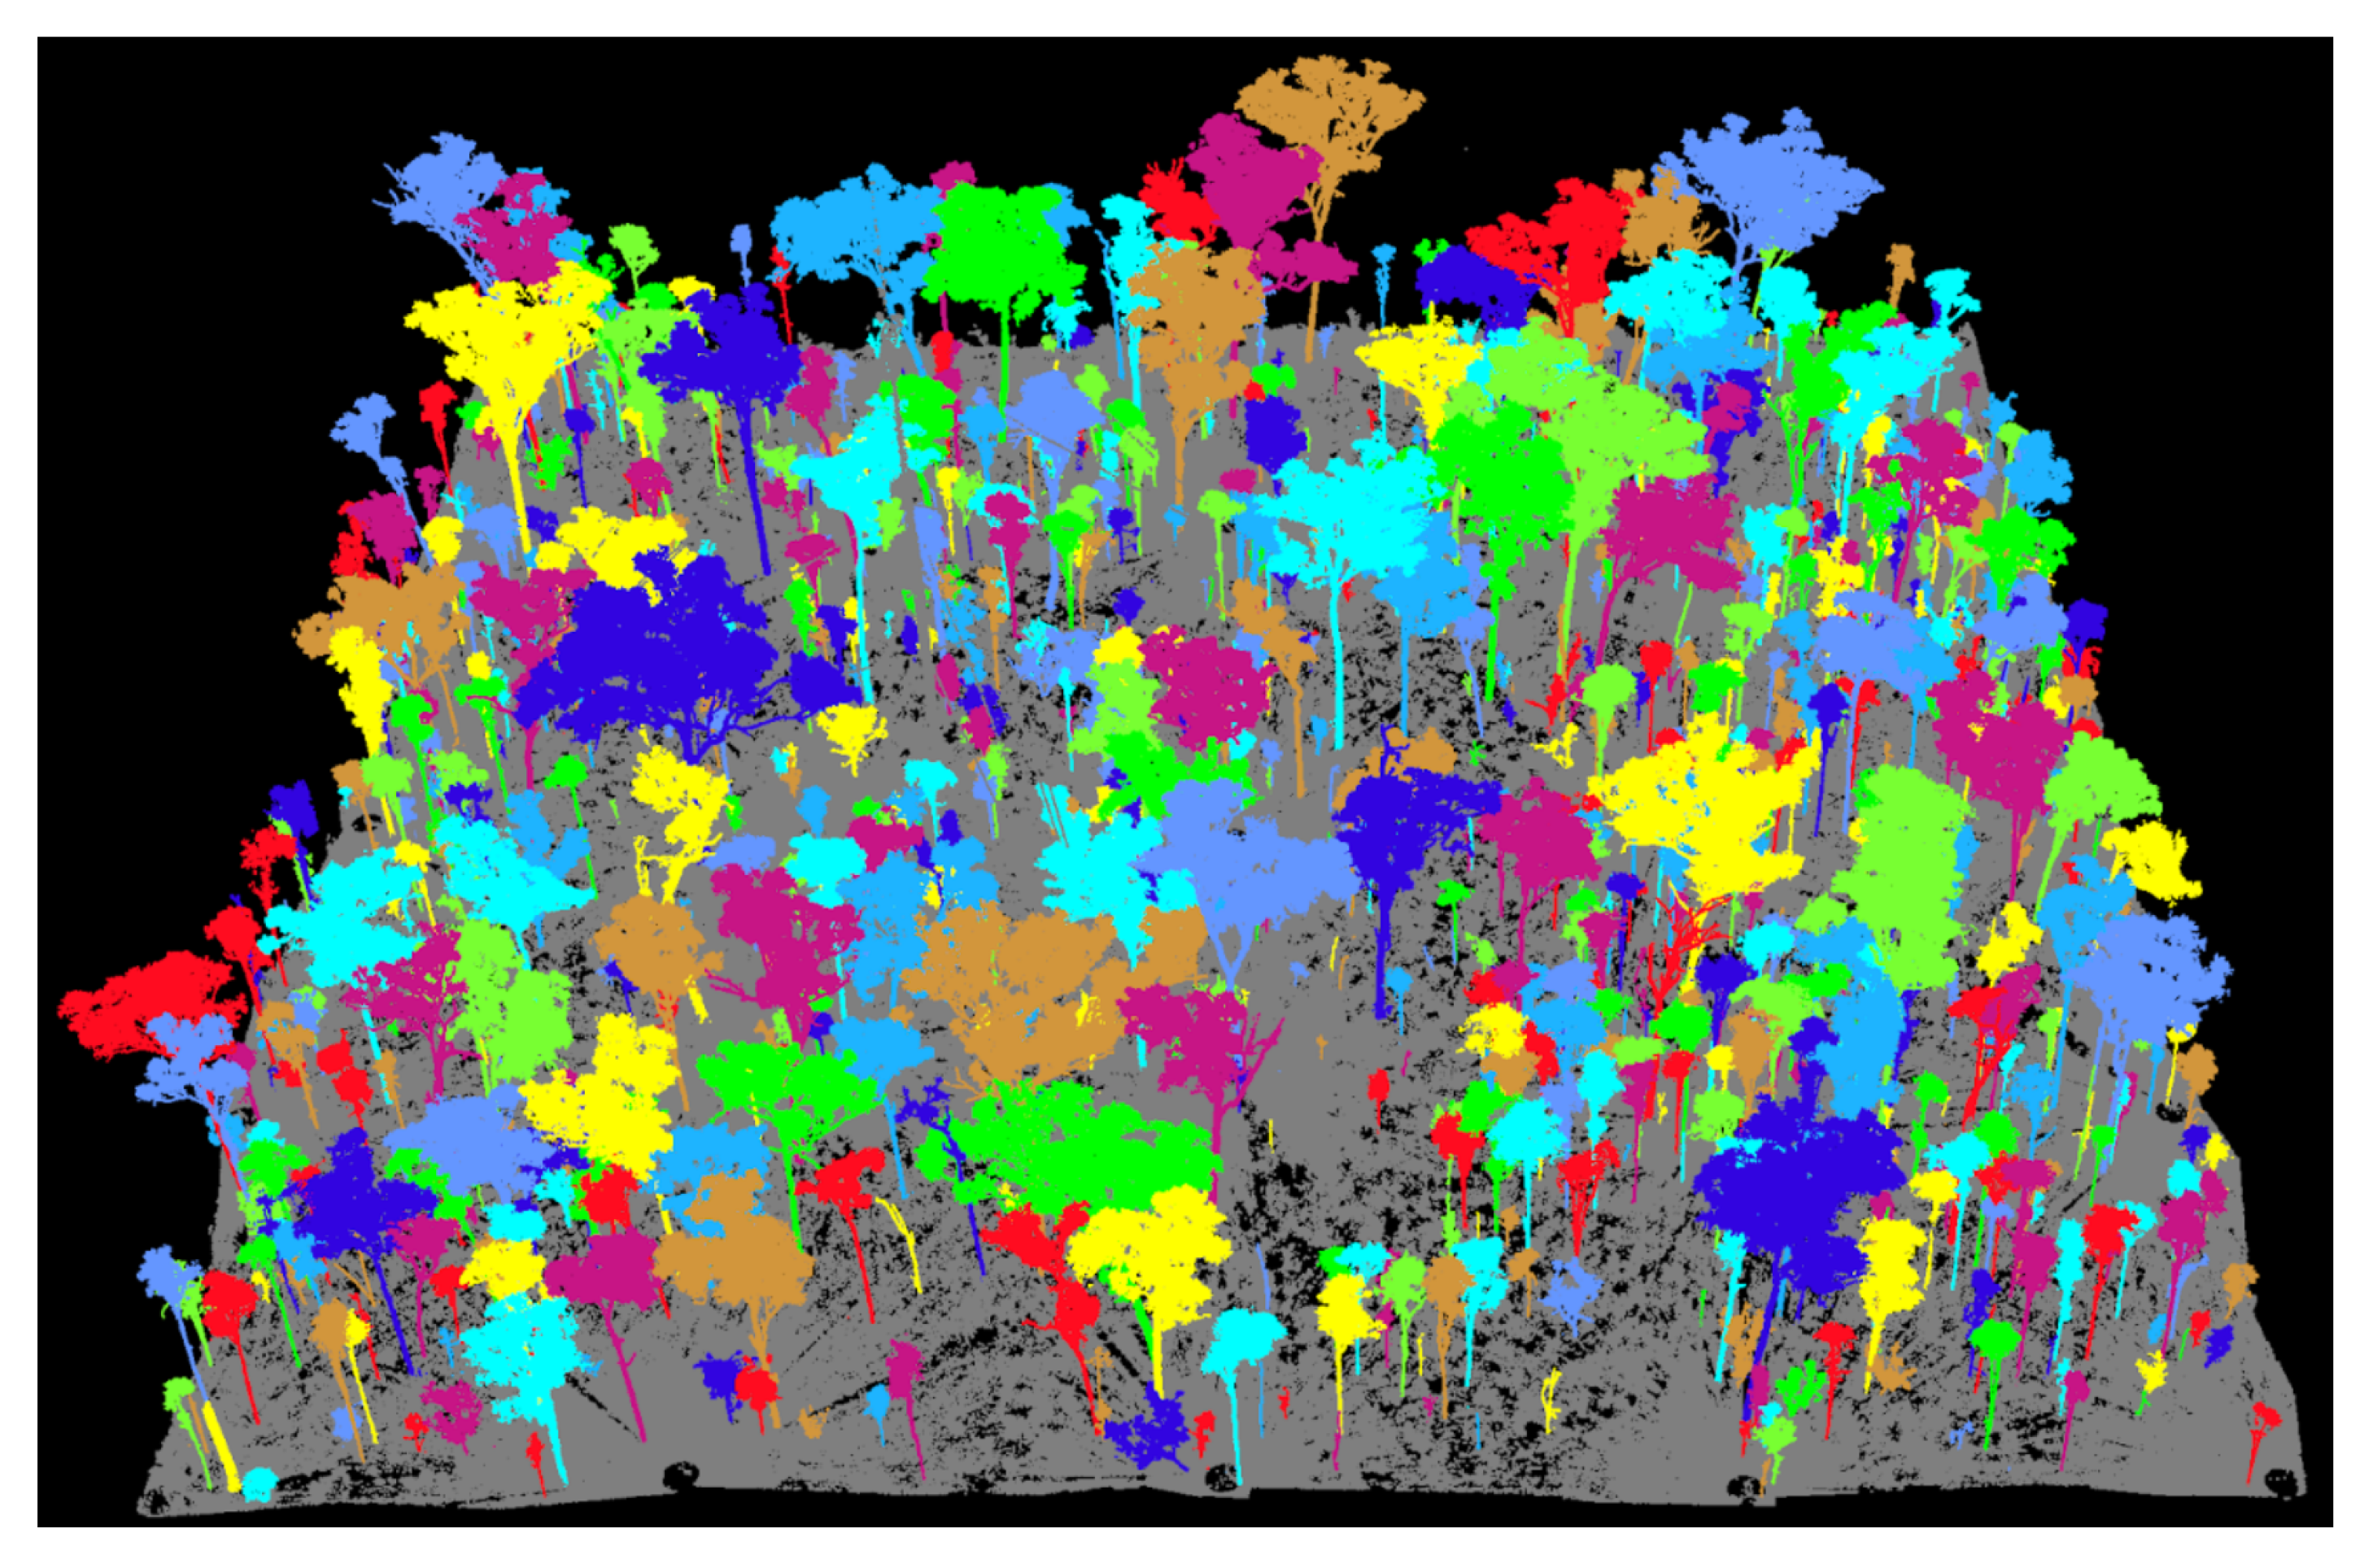
The co-registered point-cloud was filtered for outliers and ground points were classified based on morphometric properties. A digital elevation model (DEM) was generated from the ground points and was then used to normalise the remaining point cloud to height above ground level. A mean shift algorithm, implemented within LiDAR360 TLS Forest Point Cloud Segmentation tool, was used for automatic segmentation of the normalised point cloud into individual tree clouds. The Individual Tree Editor tool was then used to manually edit falsely classified trees (Figure 4). The resulting tree attribute dataset (n = 976) was inspected for errors and a DBH to height ratio was used to flag any potentially false DBH measurements. Flagged entries were inspected in the segmented point cloud and trees where DBH could not be reliably established due to foliage present at 1.3 m above ground were excluded from the dataset. This process led to the exclusion of 169 unusable segments. Individual tree structural attributes were recalculated after the completion of the manual editing and quality control steps. The automated segmentation and manual editing tools allow for a streamlined and user-friendly segmentation process.
2.3.2. Matching of Field and TLS Survey
The manual and TLS survey data were overlaid as shapefiles in QGIS and corresponding trees were matched spatially. This was achieved by applying a 1 m buffer around points in the manual field survey data set. Offsets in the stem manual positioning due to signal drift was accounted for by moving TLS points into the buffer of corresponding manual points where a match could be confidently observed. Of the 492 trees manually surveyed, 450 could be matched in the TLS dataset. Attributes were then joined by spatial location and checked for duplicate records (indicating joins of two or more trees from one layer to one tree of the other).
To compare the spatial distribution of trees captured in both surveys, the plot was overlaid with a 10 m and a 20 m grid. For the TLS data, DBH values below 0.05 m DBH (less 0.07 m mean absolute error (MAE)) were excluded using the query builder. The number of trees located within each grid cell were counted for both surveys. The resulting polygons were converted to a raster and the difference between TLS and field tree count calculated using the raster calculator.
2.4. Statistical Analysis
All statistical analyses were performed in the R environment [42] v 3.6.0. Correlation of field and TLS-derived DBH was performed using linear regression (Figure 7). Visual inspection of the relationship between DBH and crown area suggested an inflection point beyond which the relationship between crown area and DBH changes. The location of this point was identified with a change-point regression using the chngpt package [43]. As the data are heteroscedastic (the variability of the outcome is not constant across the range of the predictor, violating the assumption of linear regression), a generalised least squares (GLS) was used to interpret the correlation before and after the change point (Figure 8). A paired sample t-test was then used to assess how closely spatial distribution of detected trees matched between the surveys. For each sub-plot the number of detected trees derived from each method was compared. For this analysis, trees with DBH smaller than 0.05 m were excluded from the TLS survey (less the mean average error from the field and TLS correlation), to match the sampling scope of the manual survey (Figure 6). All R code used is available in a github repository (see Supplementary Materials).
3. Results
3.1. Tree Counts and Distribution Obtained from Field and TLS
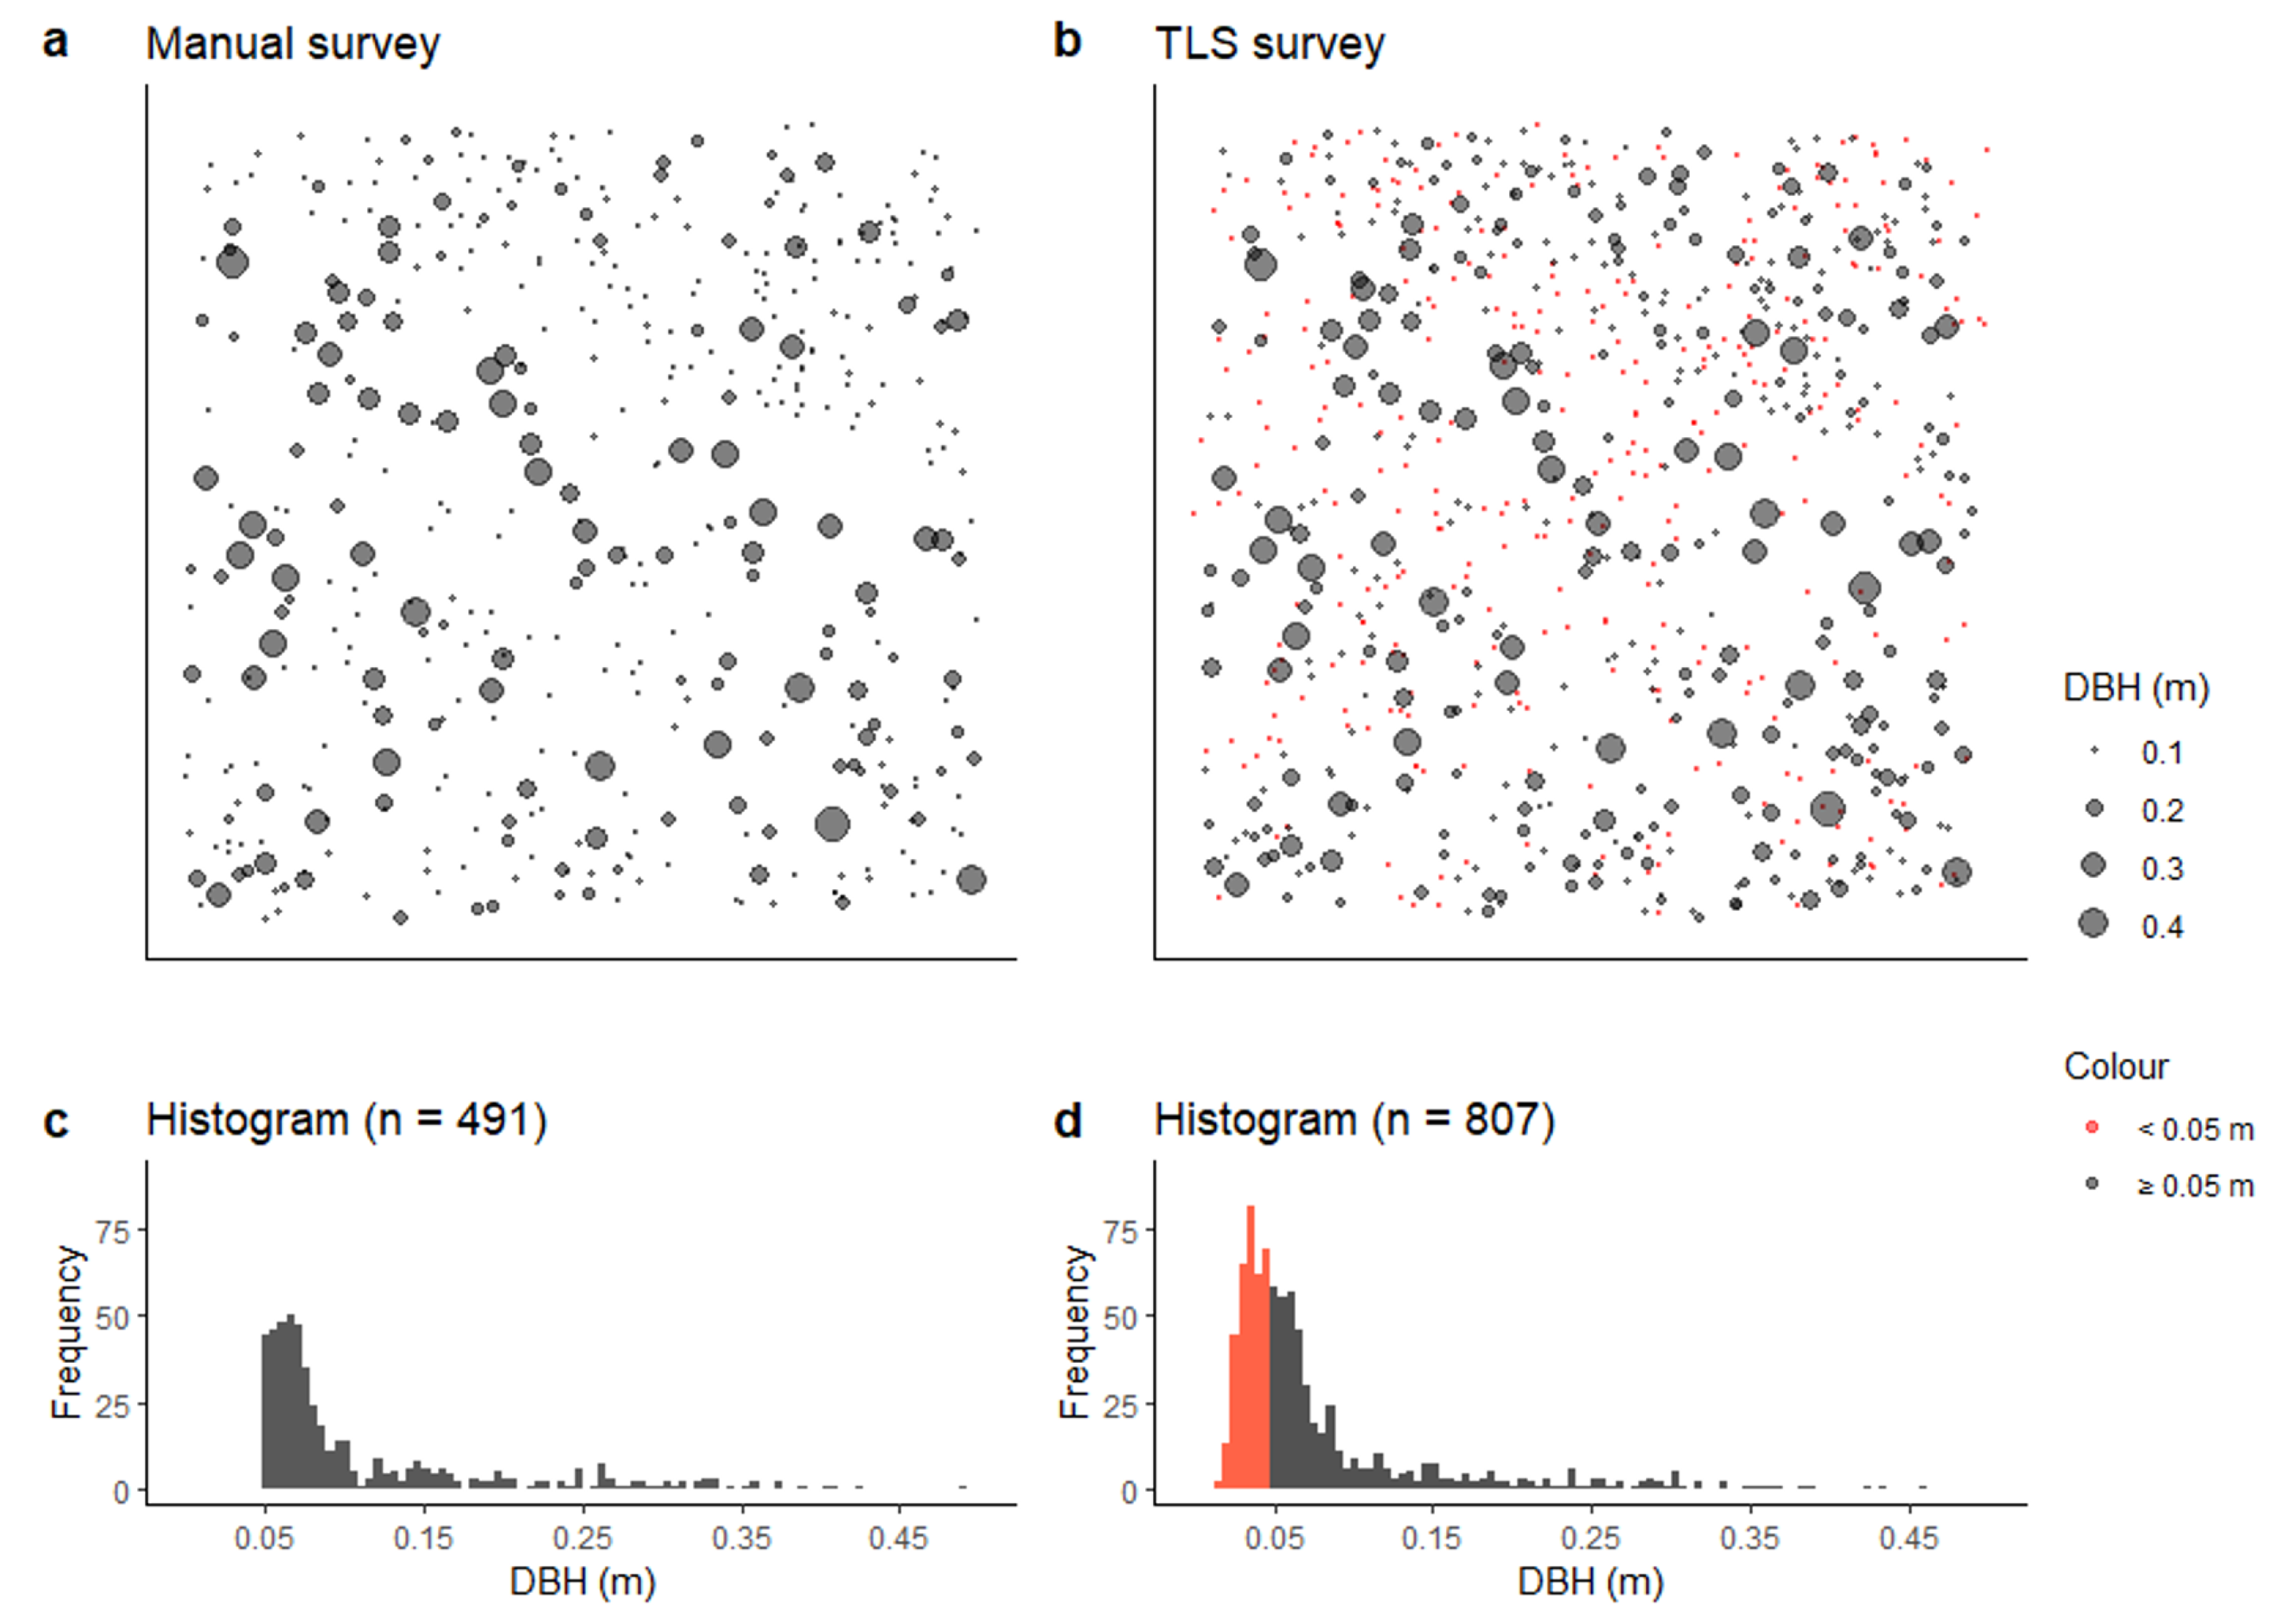
The TLS survey allowed for the capture of tree location and DBH measurements on a plot scale compatible with data collected using traditional field surveys. Visual inspection of the field inventory and TLS surveys showed similar patterns in the spatial distributions of DBH as captured by each survey method (Figure 5a,b) with a similar detection curve evident for both surveys (Figure 5c,d). Additionally, the TLS was able to detect a large number of small trees (DBH 0.02–0.04 m) which are often excluded from manual field inventory, as this sampling scale takes considerable time to undertake.
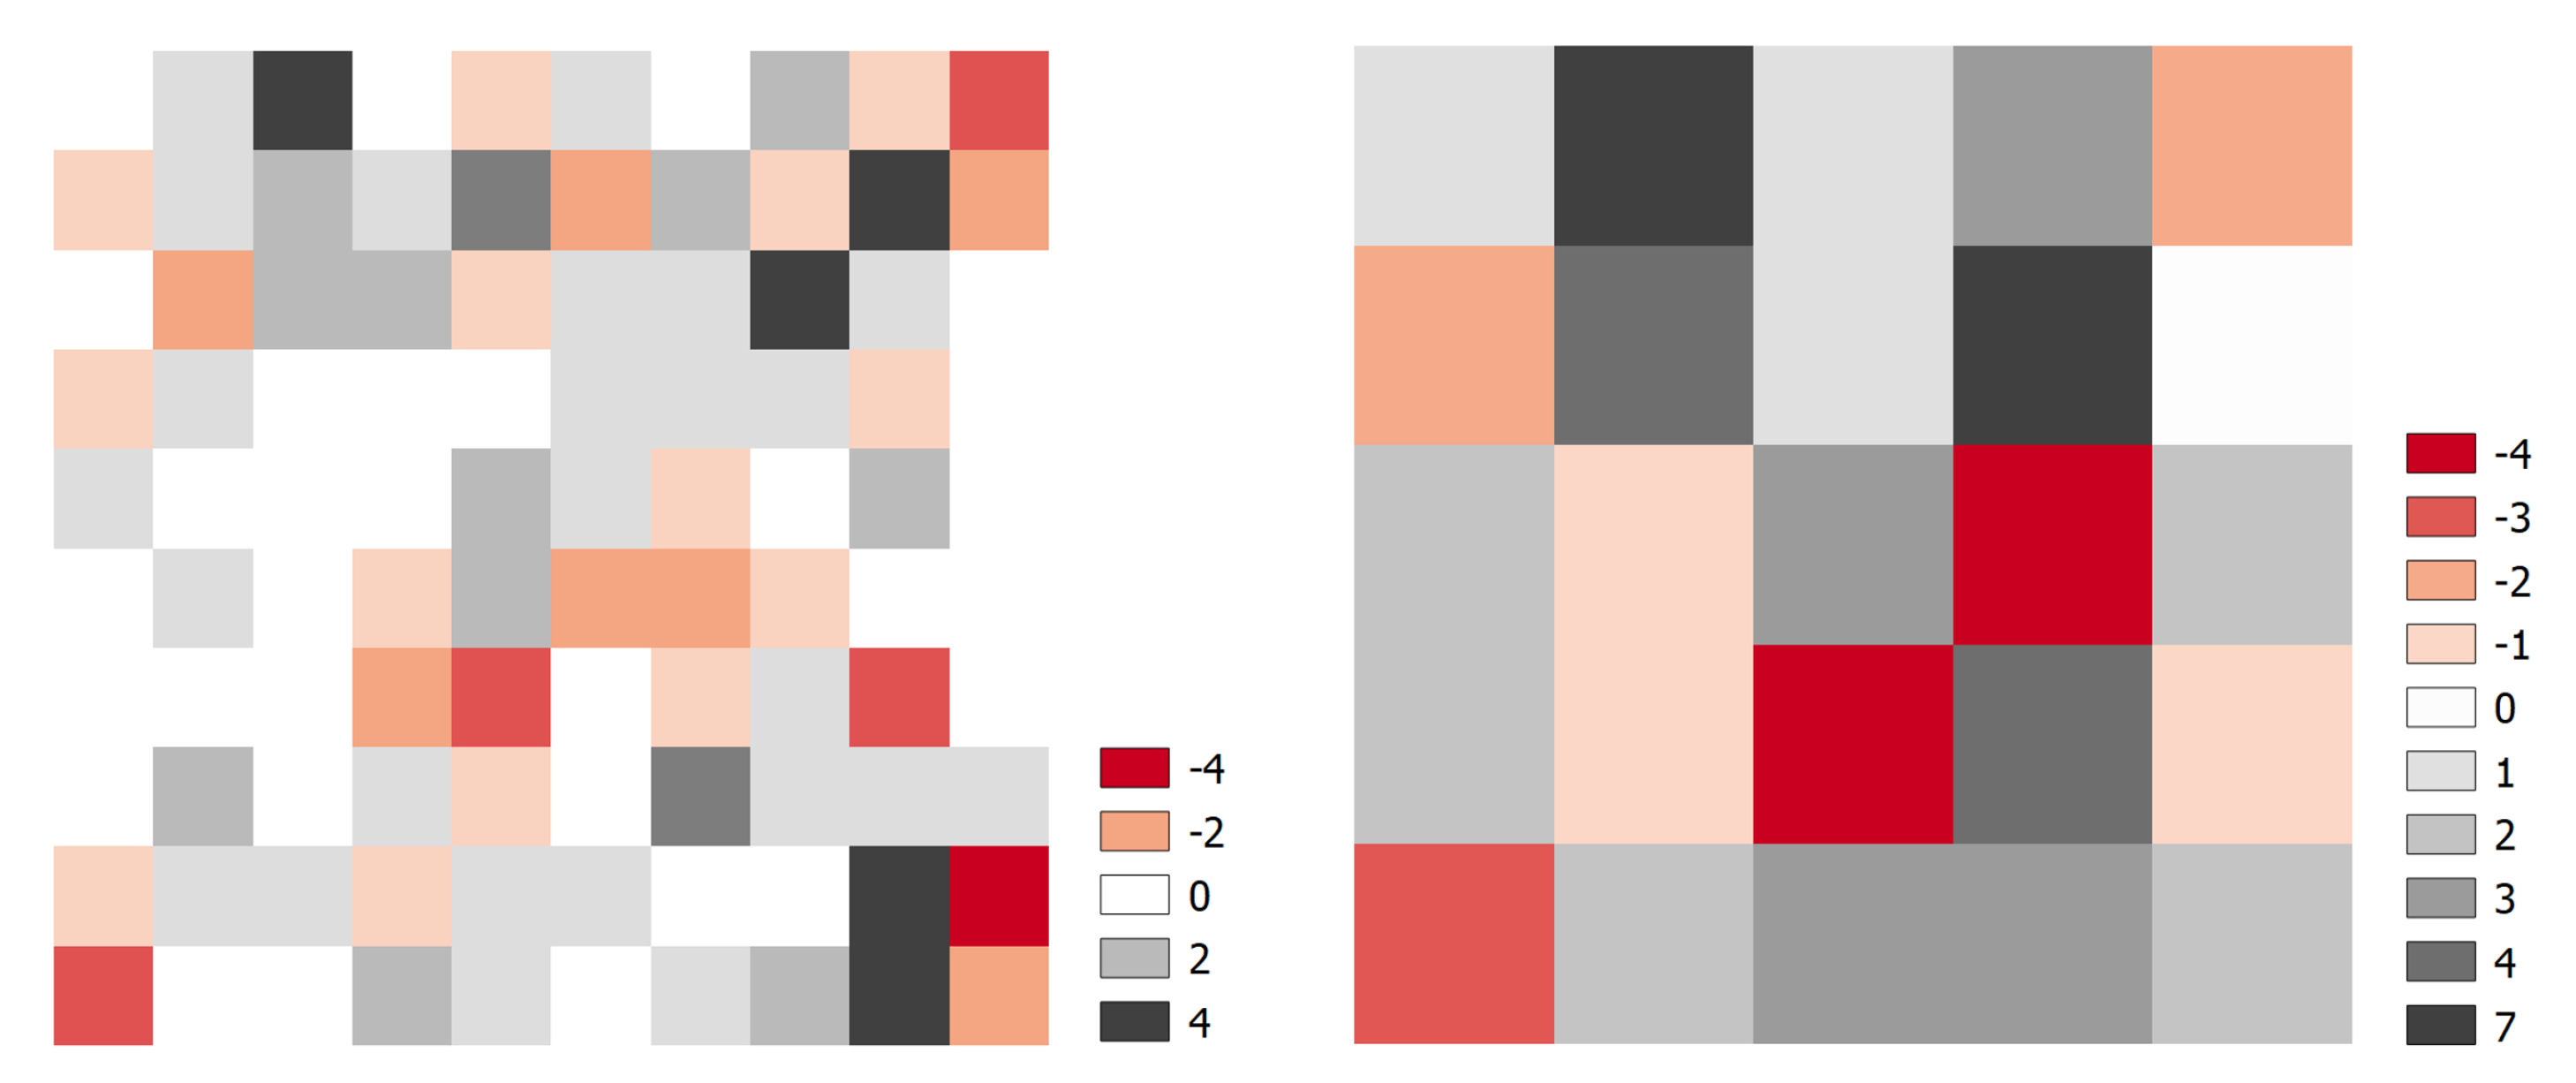
Comparing the spatial distribution of tree detections in each survey highlights the potential impact of edge effect on small sub-plots (10 and 20 m). Across all sub-plots there was no significant difference between the TLS and field inventory for tree detection (Paired samples t-test 10 m grid: t(99) = −1.815, p = 0.07, 20 m grid: t(24) = −1.97, p = 0.06) (Figure 6). However, for a number of sub-plots there was clear over- or under- estimation observed and are likely due to edge effects and/or GPS drift. Using sub-plots as simulated by the 10 m and 20 m grids may be disadvantageous, as individual trees are forced into small plots and thus not necessarily representative of tree density in the area.
3.2. DBH Obtained from Manual Survey and TLS
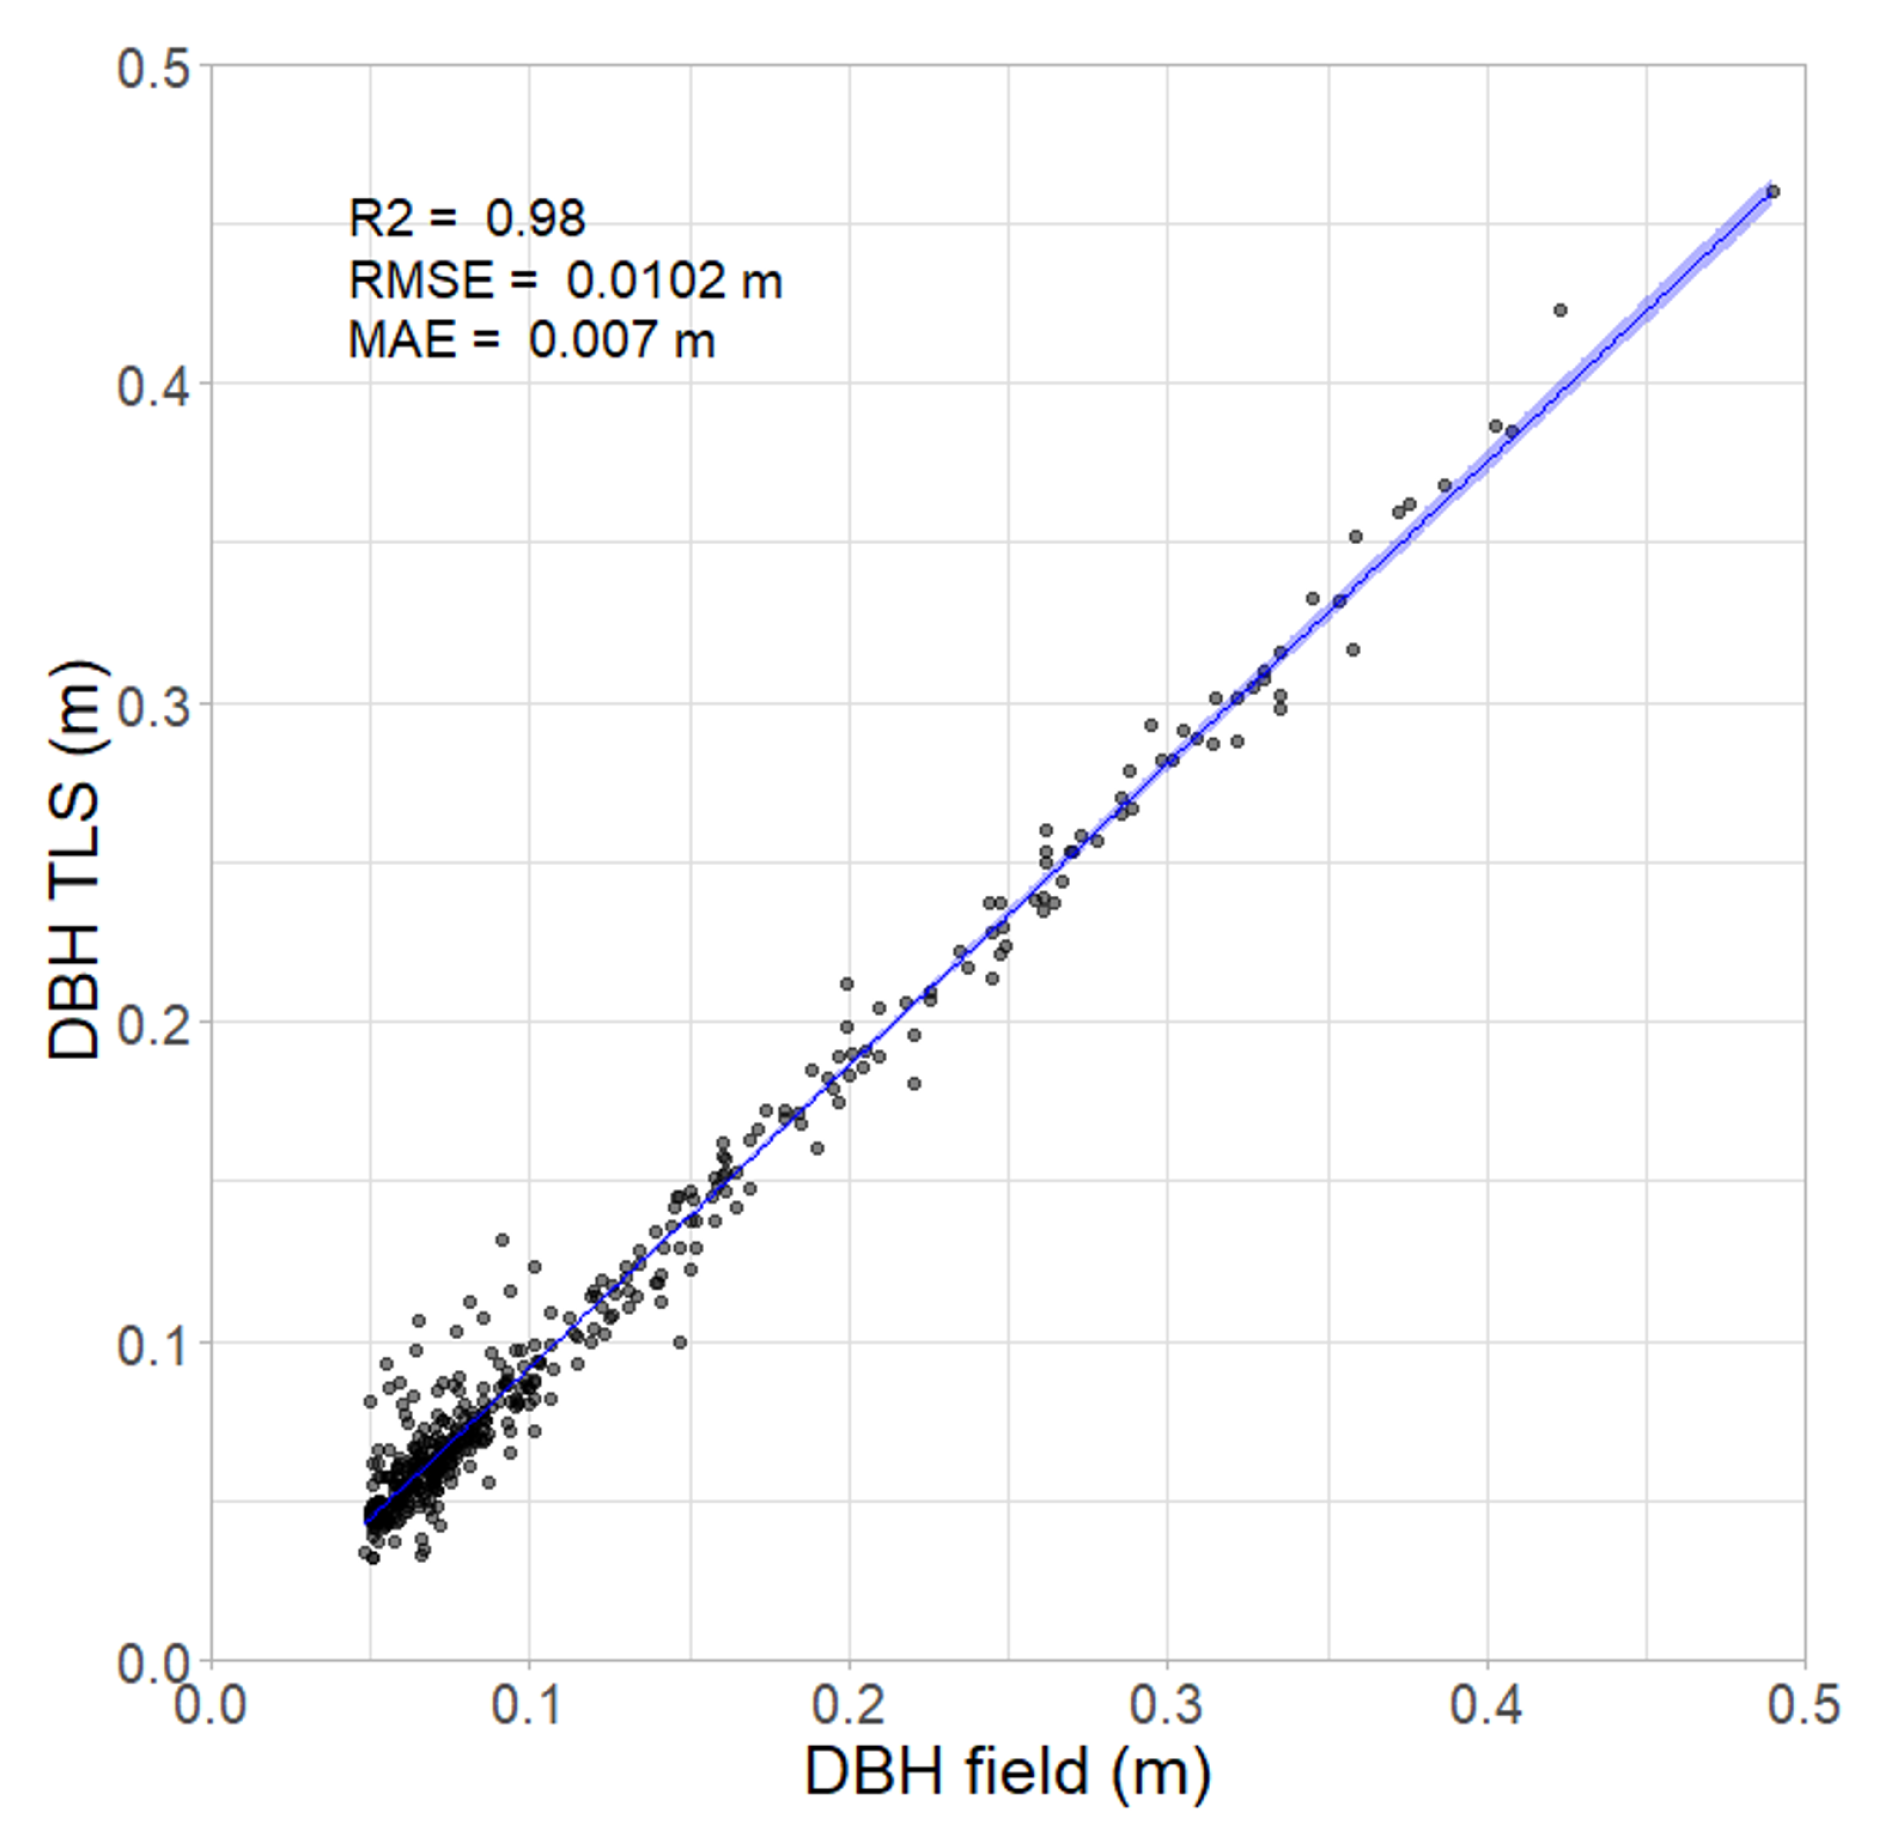
The DBH values of individual trees derived from the TLS survey were strongly correlated with those obtained manually in the field. The RTK GPS tagging of trees during the field survey ensured precise matching of a large sample of trees captured in the field survey to corresponding TLS measurements (two outliers were excluded from the analysis). There was a strong correlation between DBH measured in the field and DBH derived from the TLS point cloud (Figure 7), with R = 0.98 and MAE = 0.007 m (Spearman’s = 0.93, p < 0.001). The MAE shows the overall average of errors while the RMSE (root mean square error) highlights strong outliers as it increases with variance in the frequency distribution of error magnitudes. For this model, an RMSE value higher than the MAE indicates that the main source of error likely stems from a small number of strong outliers, rather than a systematic over or underestimation of field DBH by the TLS derived DBH.
3.3. Variability in Crown Architecture
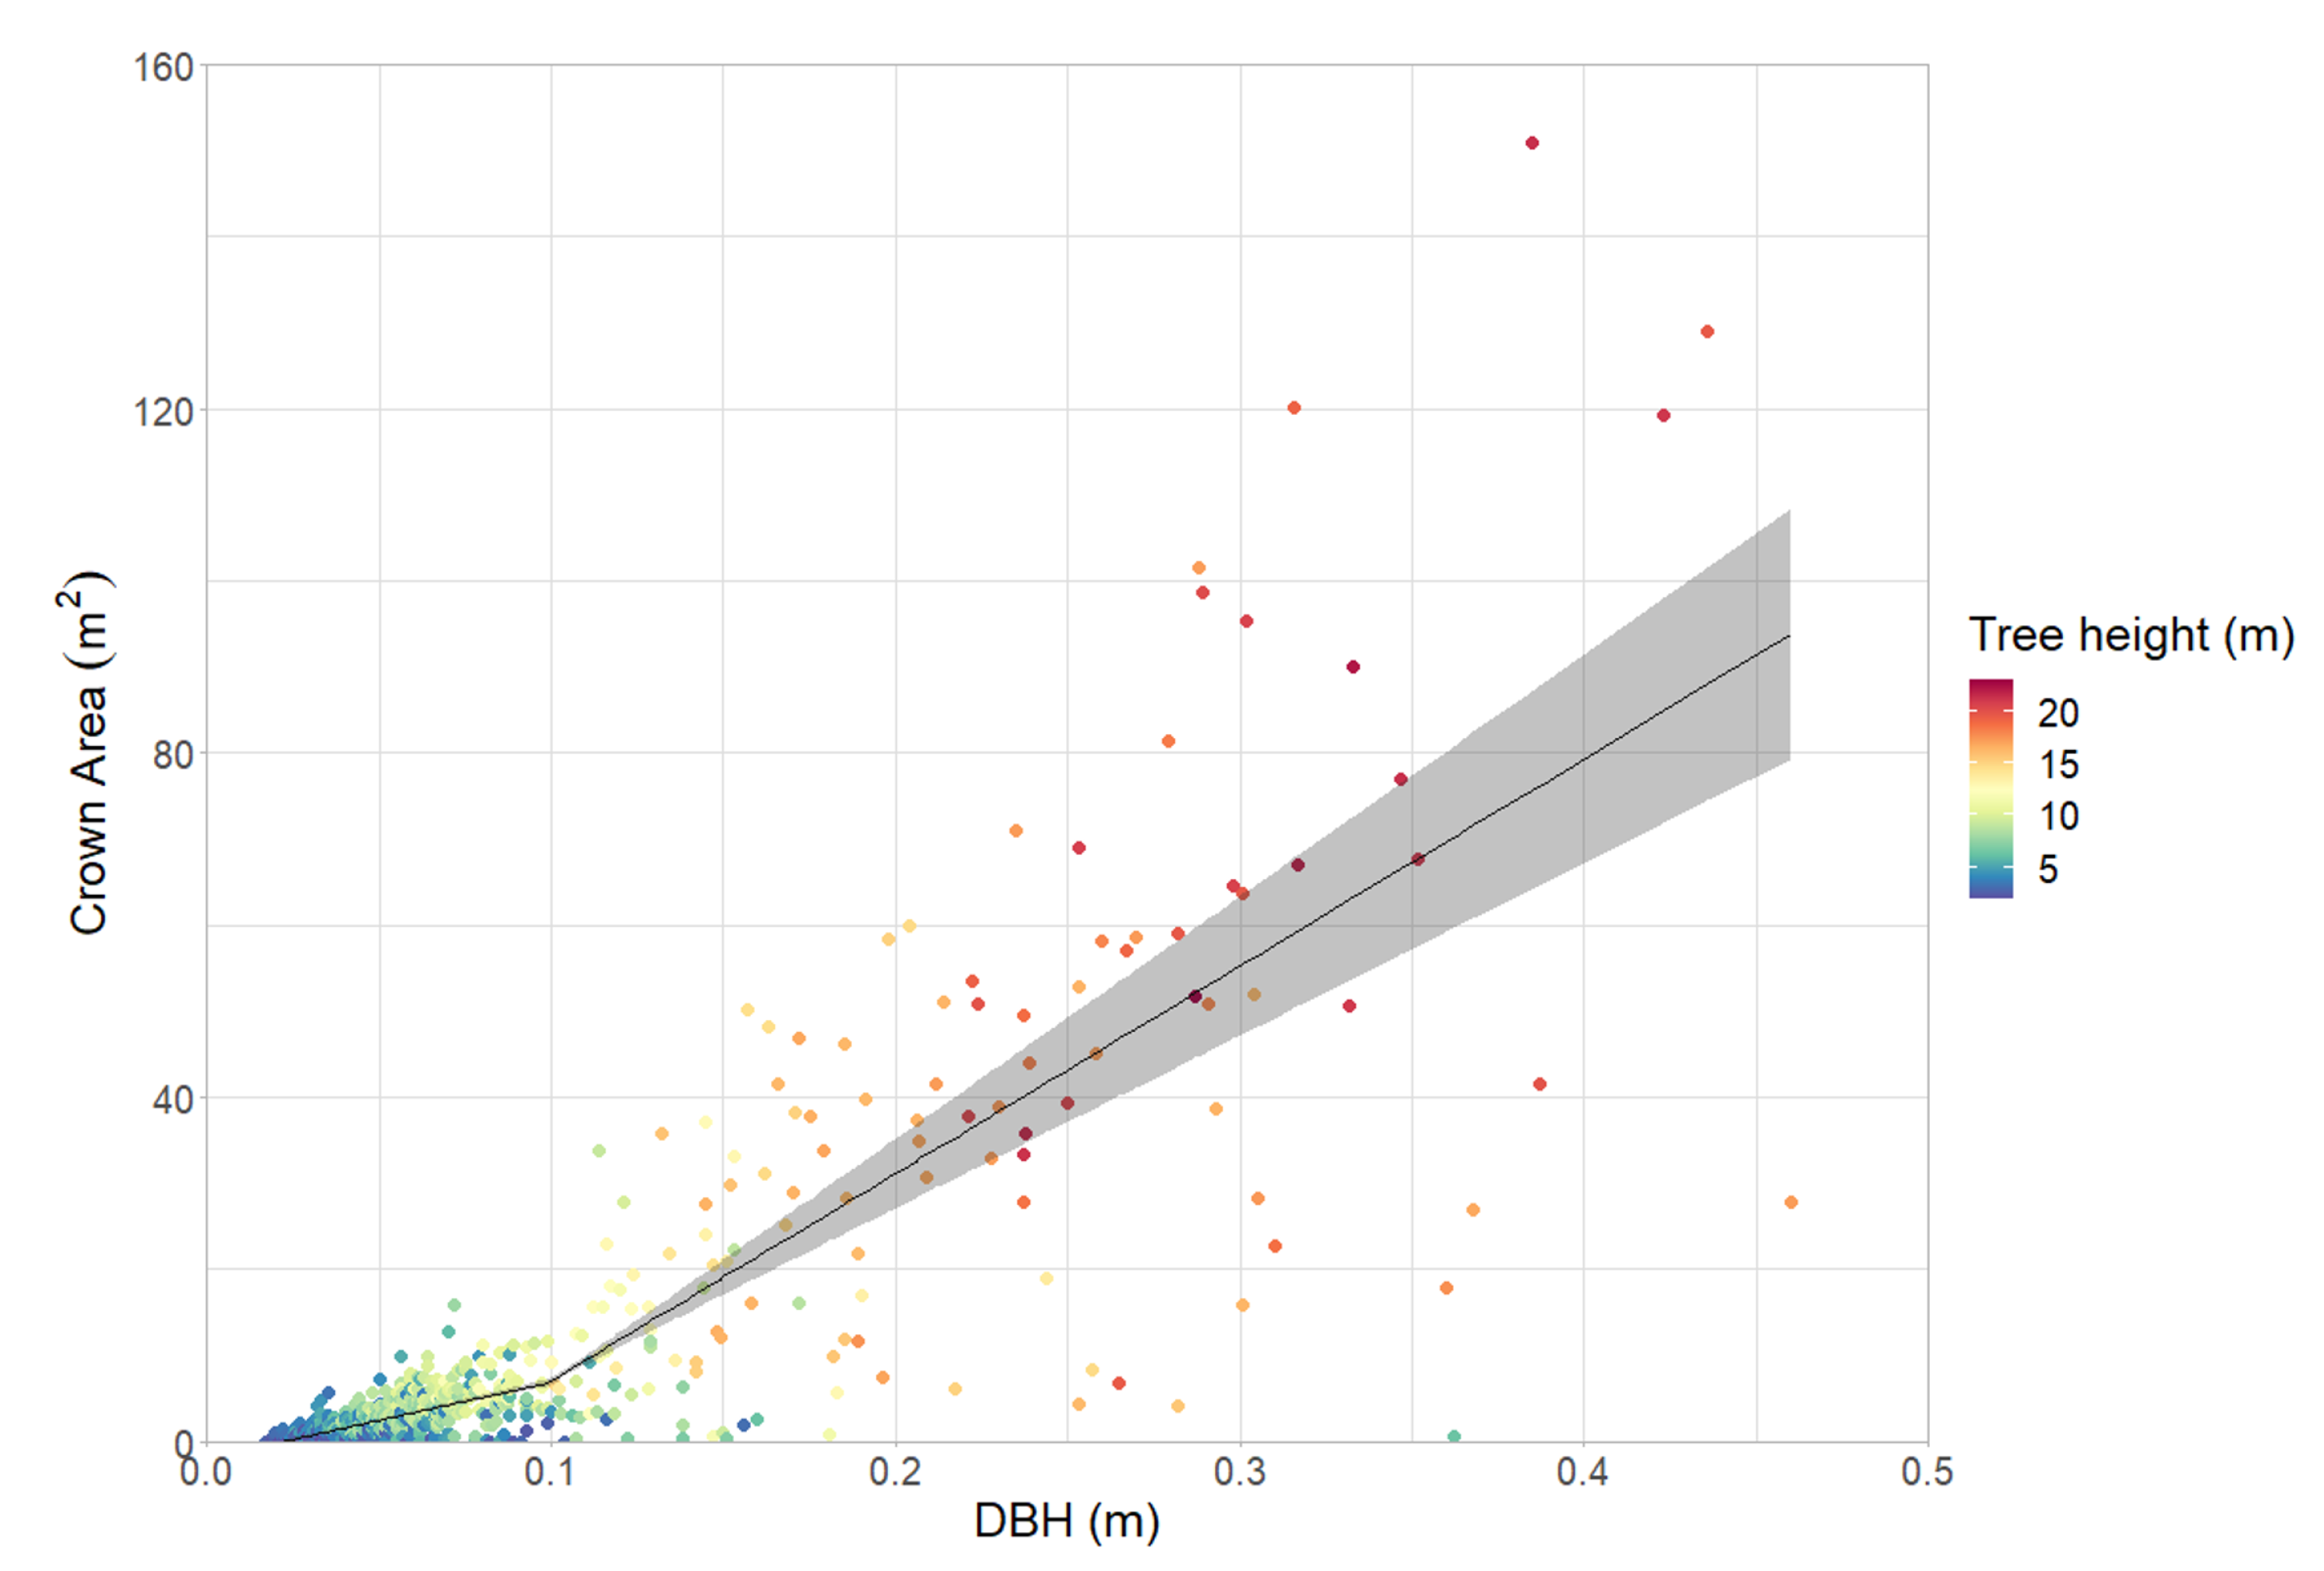
Using TLS derived data, crown size (canopy area) was plotted as a function of DBH (Figure 8) which showed a strong positive relationship with heteroscedastic variance. Deviance from the mean increases along with maximum crown area, resulting in a non-linear relationship (Table 1). Our results align with previous observations made while calibrating the local allometric model [22]. A change-point regression shows a change point at DBH of 0.099 m (95%CI 0.056–0.14, p < 0.001). For trees below the change point, for every unit (1 m) increase in DBH there is a 88.55 unit increase in the crown area (95%CI 81.56–95.50); for trees above the change point, the increase in crown area per unit DBH increases to 240.87 and the 95%CI widens to 191.75–290. Trees with poor health ratings were not excluded, as this would obscure the true variability in crown size.
4. Discussion
4.1. Heterogeneity at Landscape/Stand Level
Tropical savannas are disturbance-impacted ecosystems which result in stand-scale structural heterogeneity, introducing unquantified uncertainty to commonly used methods for estimating AGB that rely on small sub-samples of DBH-based allometry. When used in tropical savanna woodlands, TLS can provide accurate and detailed information that allows us to explore this source of uncertainty in allometric models. Furthermore, the large volume of samples obtainable using TLS allows us to negate further sources of uncertainty in traditional field surveys arising from the sampling limitations in the trees surveyed to represent a population when both calibrating and applying allometric models. Deriving stand size class distributions based on DBH measurements is commonplace in production forestry through to ecological surveys of stand biomass. Manual tree measurement and obtaining the geolocation data required to study size class distribution requires considerable resources and few studies include geolocation of individual trees within a study site [44]. Instead, a common field method for estimating the size class distribution is to extrapolate from sub-plots that may be 30 m × 30 m or less in size [45]. However, in tropical savannas, the assumption of spatial homogeneity underlying this approach is unlikely to be met, given inherent spatial variability at distances of 20 to 30 m (Figure 6). TLS data allows us to extract geolocation along with DBH for individual trees and is increasingly used to investigate ecological processes such as random vs clumped tree distributions, structural change over time following disturbance [25,30,46] and over annual to decadal scales, or woody encroachment and thickening [47]. We show that TLS data obtained using a lower-cost scanner enables fast and accurate acquisition of both, full 3D tree measurements and geographic positioning required to investigate landscape scale heterogeneity in tree size class distribution (Figure 1 and Figure 5).
4.2. Accuracy of Lower-Cost TLS Scanner for Estimating DBH
Direct comparison of DBH obtained from a manual field survey and concurrent TLS survey showed a very close fit with a mean absolute error (MAE) of less than 0.01 m, suggesting that lower-cost TLS data can provide traditional forestry and ecological metrics such as stand basal area and size class distributions with high precision. Our analysis of DBH obtained in the field as compared to TLS (Section 3.2) indicates random variation as the main source of error rather than systemic over or under-prediction of the model (Figure 7). Random errors are common in manual data collection [48,49], while errors in TLS measurements are commonly caused by wind, random errors in point acquisition, registration error or occlusion. Errors in data processing occur when measuring DBH, as the model assumes a perfect circle, which is often not the case. Our study design aimed to minimise TLS acquisition error and occlusion. Our data shows an RMSE of 1.05 cm, representing a 50% reduction compared to a similar study in temperate Eucalypt open forest where a minimum distance of 40 m between scan points was used [33]. However, the two studies also differ in stand structure, equipment and software used and the impact of either of those factors is yet to be quantified. The accuracy achieved in this study also reflects results from other vegetation types, such as mixed forests in Austria [50] and Germany [51], deciduous forest in Iran [52] and India [53], Chinese fir plantations [54], or tropical forest of Malaysia [55]. However, none of these are structurally representative of tropical savannas and the suitability of TLS for obtaining DBH was yet to be established. We show that lower-cost TLS can replicate field measured DBH and tree height, establishing the suitability of TLS to reliably capture traditional measures of vegetation structure in tropical savanna vegetation.
4.3. Heterogeneity at the Individual Tree Level
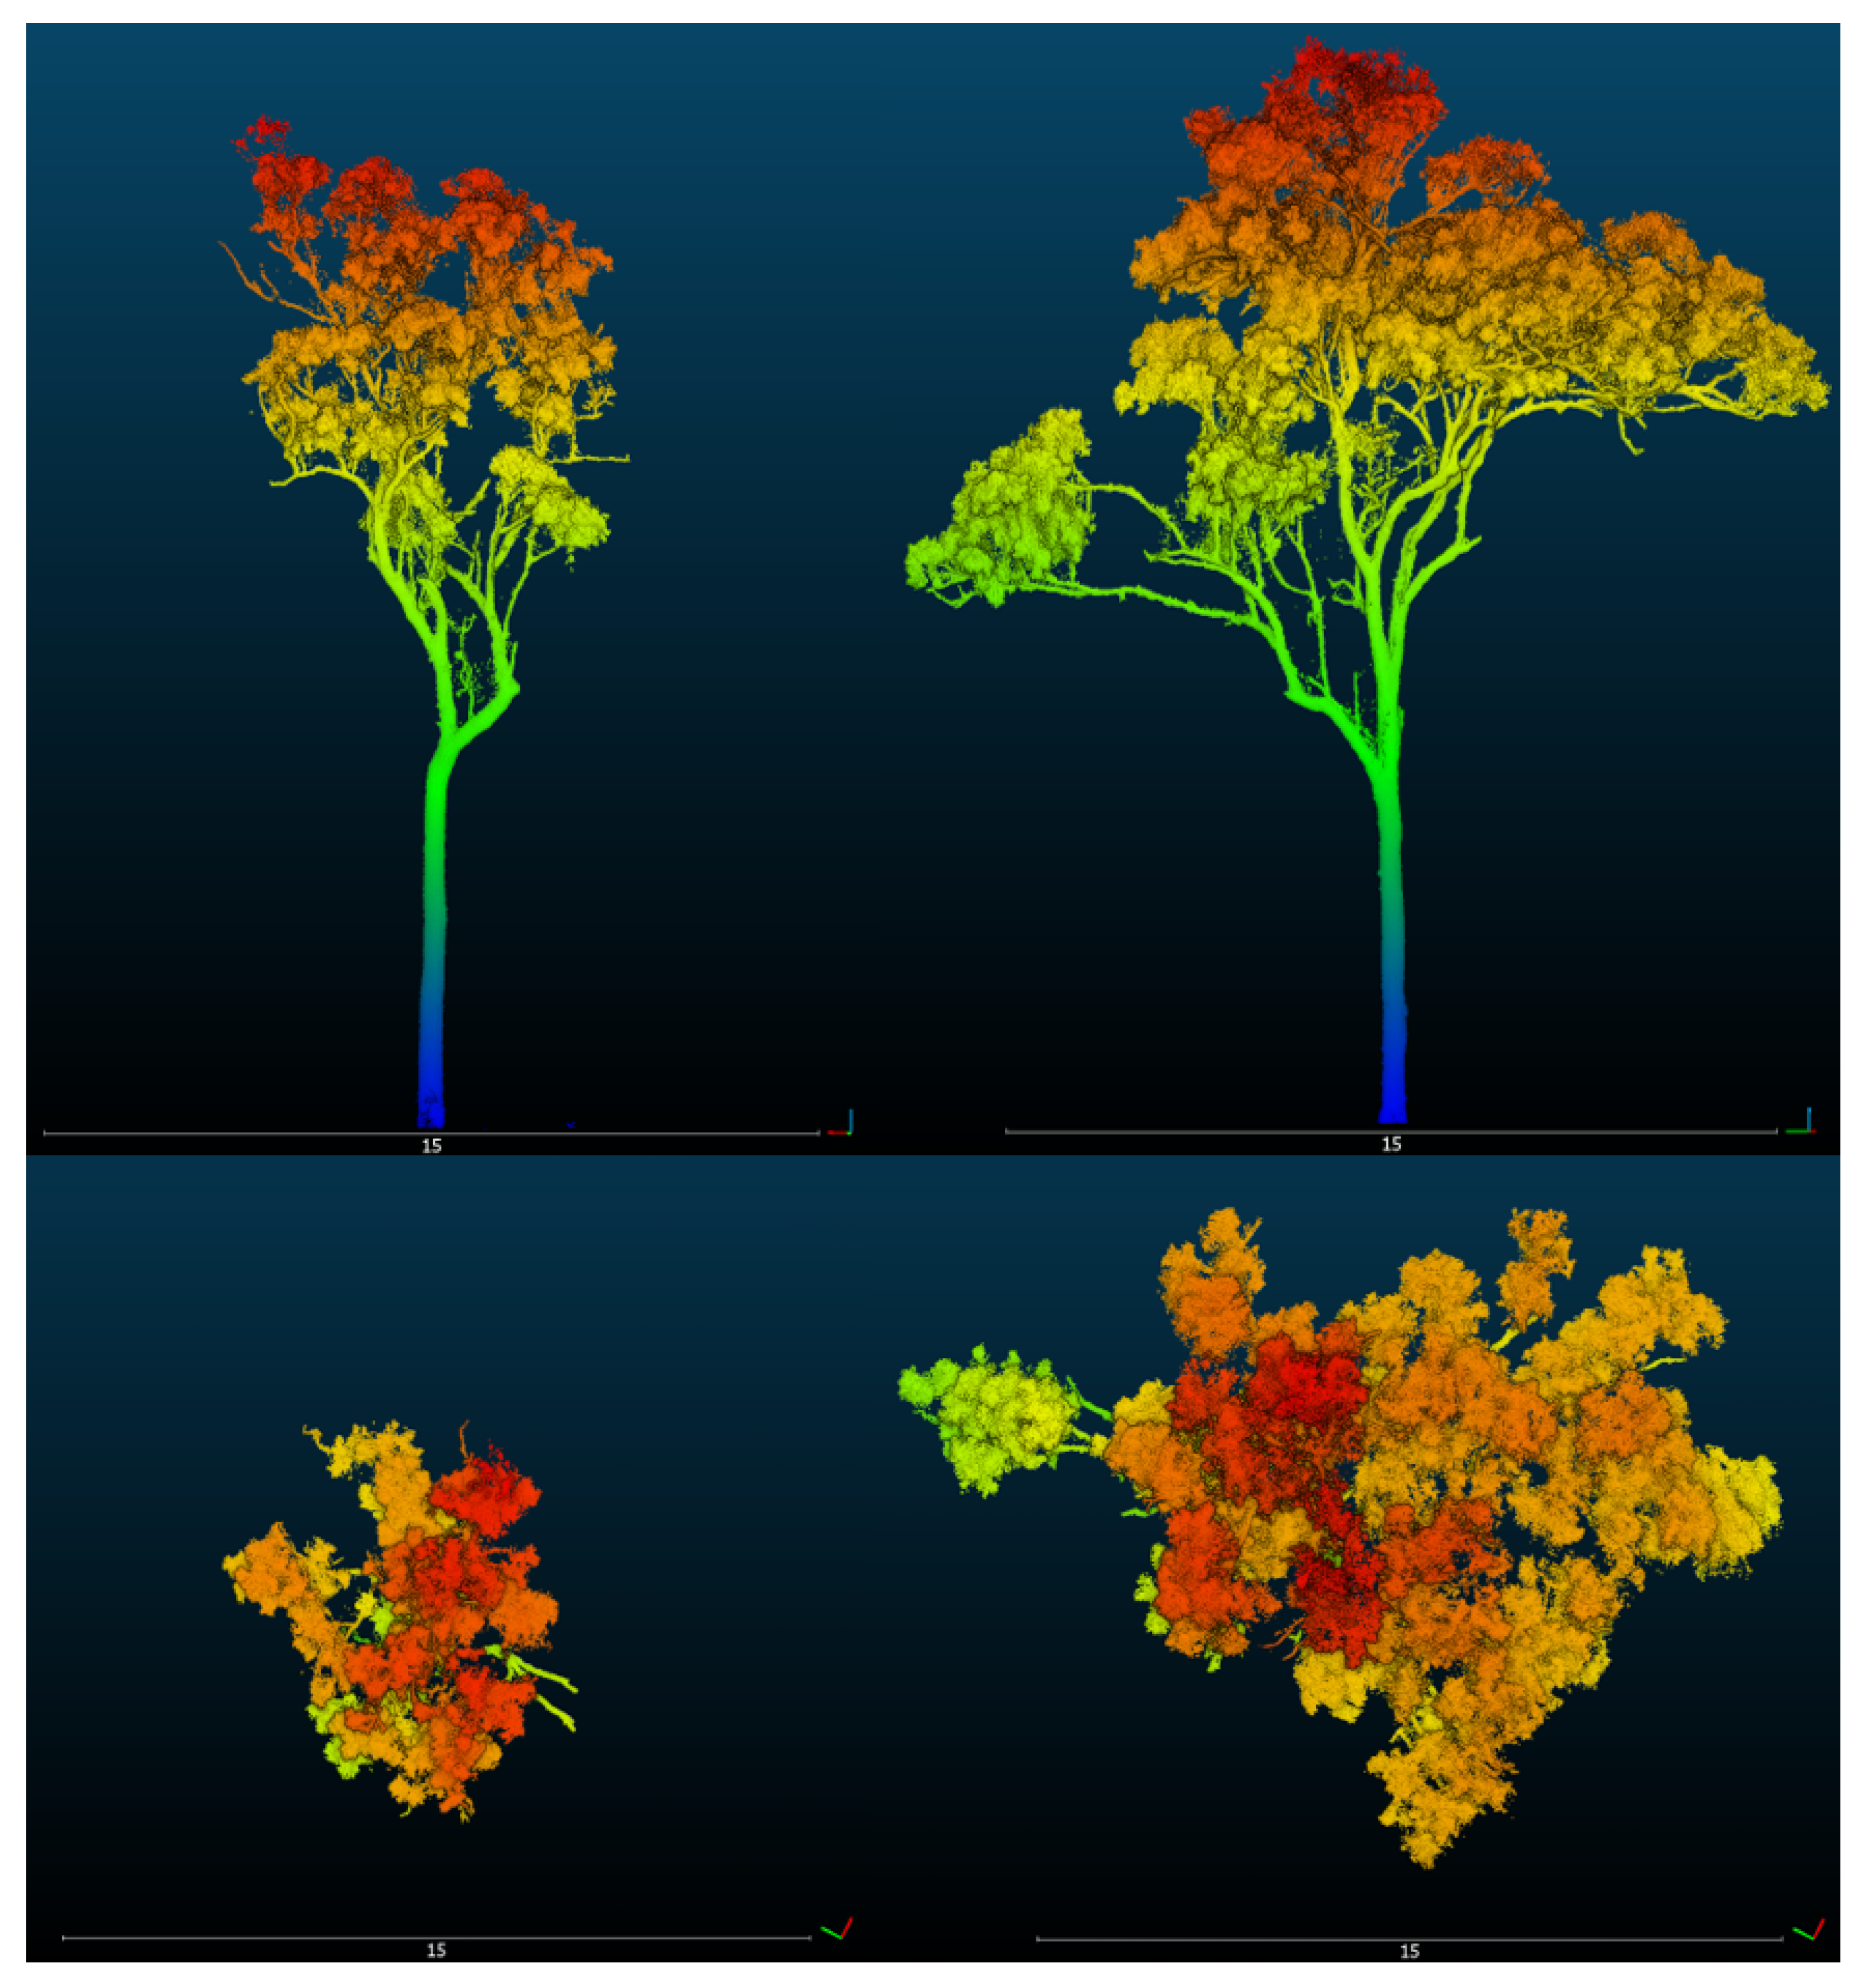
Variability in tree crown structure introduces poorly quantified and potentially significant uncertainty in allometric models predicting AGB based on DBH. Previous research shows that in north Australian savannas the proportion of biomass stored in tree crowns can vary between 12% and 45% of total tree AGB (mean ± SD of the branch and foliage components) [20]. However, this estimate is based on a very small sample size of 48 destructively harvested individuals and is unlikely to capture the true extend of variability. Our TLS analysis of over 800 individual trees confirmed and quantified a significant spread of crown area for a given DBH, increasing with DBH (Figure 8). This is in contrast to previous research published exploring the relationship between DBH and canopy diameter [56] where a linear relationship (R = 0.63) was established across a much larger area. However, investigation of the raw data shows a weaker relationship for trees surveyed within 150 km of Litchfield NP, indicating that local-scale variability arising from disturbance might exceed that of regional-scale trends. Furthermore, structural variability is not only found in overall crown size, but also architecture (Figure 9). While the addition of crown diameter as a predictive variable improves allometric models [21], the use of canopy area as a function of canopy diameter assumes a circular crown shape. Using lower-cost TLS we were able to highlight the impact of disturbance on tree architecture (Figure 9) and the potential effect on the stability of allometric relationships introduced by the assumption of homogeneity.
4.4. Further Applications—Capturing Change and Irregularities
The effect of fire as disturbance driver on the understory, including tree seedlings and saplings, and woody shrubs is a critical ecological process in savanna [57,58], however, detailed inventories of woody understory vegetation required to quantify this effect are not readily quantified using standard field inventory. TLS provides the potential for a more accurate inventory of understory density if high-resolution point clouds are generated. The ability to resolve the diameters of smaller stems (less than 0.05 m) provides crucial information on the recruitment potential of a stand and/or evidence of recent disturbance. This sampling detail is undertaken in some traditional inventory methods but can be extremely time consuming and costly. Furthermore, allometric equations have been calibrated for small to medium-sized trees with a small fraction of large individuals and are unlikely to be representative of seedlings and saplings.TLS allows us to capture understory vegetation such as seedlings, saplings and small shrubs (Figure 5) and use alternative volume-based analyses to estimate AGB. From the 3D point clouds, algorithms such as voxel or convex hull based approaches [59,60] can be used to estimate AGB of woody vegetation where metrics like DBH cannot easily be measured, or suitable allometric models are not available. When applied as successive scans, TLS provides detailed observations of structural changes at a stand level, such as mortality and recruitment, or at individual tree level, such as damage to branching structure and crown development [61,62]. The ability to quantify recruitment and mortality opens up the opportunity to explore disturbance dynamics such as fire impacts or storm damage impacts within the regeneration niche at unprecedented detail.
Multi-stemmed trees and shrubs can be challenging to survey manually, especially when a forking height is located below or at the designated DBH measuring height. To avoid this issue, some studies opt to measure diameter closer to the ground, e.g., 0.1 m or 0.15 m above ground level [63,64]. However, such a strong deviation from the norm will prevent comparison or integration of data from multiple studies and requires further calibration of specialised allometric models. TLS is not restricted to single-point measurements and can be used to extract a range of data to estimate AGB. For instance, Quantitative Structure Modelling (QSM) has gained popularity as an alternative to DBH-based allometric models. Individual tree AGB is estimated based on wood density and point cloud generated tree volume, avoiding the need for allometric relationships and standardised measurements [33]. The TLS approach provides the freedom to adapt sampling strategies to include stand elements that will not conform to traditional survey methods and tree allometric models.
Accounting for loss from termite consumption in susceptible tree species remains a challenge for biomass estimates based on crown and stem volumes [65]. However, if hollowing functions accounting for this loss can be developed, the use of TLS offers considerable advantages over manually sampled inventories given the sampling speed, precision, the range of metrics that can be estimated and the ability to accurately quantify structural change over time.
4.5. Negating the Cost Barrier
TLS provides clear benefits over traditional manual field surveys and is increasingly utilised in the research community. However, capital cost has been a major barrier to the wider adoption of this technology, constricting the application of research outcomes by the wider community [34,35]. We show that rapid developments in commercial scanners now enable us to cost-effectively acquire point clouds of sufficient quality for detailed vegetation surveys. We demonstrate the benefits of TLS to vegetation monitoring programs by combining traditional and new measurements obtained through TLS to explore a major source of uncertainty in traditional allometric models when applied in frequently disturbed woodlands such as tropical savannas. We also highlight and discuss further advantages of TLS to capture stand elements traditionally difficult to capture using field inventories. Limitations apply to the use of lower-cost scanners, particularly in regards to their range and therefore ability to survey trees above a height of 50 m [35], however, we have demonstrated that such commercial options provide data of sufficient quality to make state of the art vegetation survey methods more accessible.
5. Conclusions
Tropical savannas have been challenging to quantify in global carbon models. We show how heterogeneity in savanna tree structure introduces uncertainty into established protocols for estimating AGB and therefore carbon content across spatial scales. At plot scale this heterogeneity leads to sample plots rarely being representative of a larger area, while at tree scale the strength of DBH as an indicator of tree AGB is diminished by strong variability in tree architecture. Furthermore, the traditional exclusion of small understory trees (e.g. <0.05 m DBH) from field inventories omits a potentially important indicator for vegetation and carbon dynamics, including recruitment and regeneration. TLS provides a more holistic way to retrieve quantitative structural measurements that directly relate to biomass properties in tropical savanna. Using TLS we were able to reliably obtain traditional field attributes such as DBH and tree height, but also access new meaningful tree attributes such as crown size and extent, and spatial distribution of understory vegetation. However, adoption of this technology in monitoring programs has been limited due to acquisition costs of high-quality TLS scanners, and skepticism remains as to the utility of TLS in vegetation surveys. We show that in savanna vegetation a low-cost TLS scanner will produce high-quality LiDAR data and highlight the advantages and power in deriving meaningful tree attributes that will allow us to better quantify AGB at tree and plot scale. Establishing sampling protocols for highly detailed AGB surveys with reduced budgetary requirements may enable greater inclusion of TLS in national and international monitoring programs.
Supplementary Materials
The following are available online at https://github.com/LindaLuck/Luck2020Exploring, Analysis scripts for data analysis carried out in the R environment.
Author Contributions
Conceptualization: S.R.L. and L.L.; methodology: L.L., S.L; analysis: L.L.; resources: S.R.L., L.B.H.; data curation: L.L.; writing—original draft preparation: L.L.; writing—review and editing: S.R.L., L.B.H., K.C., L.L.; visualization: L.L.; supervision: S.R.L., L.B.H., K.C. All authors have read and agreed to the published version of the manuscript.
Funding
This research was funded by a Charles Darwin University (CDU) postgraduate RTP scholarship and a Commonwealth Scientific and Industrial Research Organisation (CSIRO) top-up scholarship.
Acknowledgments
We acknowledge the Ecosystem Processes facility in Australia’s Terrestrial Ecosystem Research Network (TERN) and NT Parks and Wildlife. Jodie Hayward and Jon Schatz are thanked for their field support. We also thank Mirjam Kaestli for statistical support. This manuscript was greatly improved by valuable comments from Keryn Paul and Garry Cook.
Conflicts of Interest
The authors declare no conflict of interest.
Abbreviations
The following abbreviations are used in this manuscript:
| AGB | above-ground biomass |
| DBH | diameter at breast height |
| DEM | Digital Elevation Model |
| GPS | Global Positioning System |
| LiDAR | Light detecting and ranging |
| MAE | mean absolute error |
| TERN | Terrestrial Ecosystem Research Network |
| TLS | Terrestrial laser scanning |
| QGIS | geographic information system (GIS) software |
| QSM | Quantitative Structure Model |
| RMSE | root mean square error |
| RTK | Real-time kinematic positioning |
| UTM | Universal Transverse Mercator |
| WGS | World Geodetic System |
References
- Scholes, R.; Dowty, P.; Caylor, K.; Parsons, D.; Frost, P.; Shugart, H. Trends in savanna structure and composition along an aridity gradient in the Kalahari. J. Veg. Sci. 2002, 13, 419–428. [Google Scholar] [CrossRef]
- Veenendaal, E.M.; Torello-Raventos, M.; Feldpausch, T.R.; Domingues, T.; Gerard, F.; Schrodt, F.; Saiz, G.; Quesada, C.; Djagbletey, G.; Ford, A.; et al. Structural, physiognomic and above-ground biomass variation in savanna-forest transition zones on three continents-how different are co-occurring savanna and forest formations? Biogeosciences 2015, 12, 2927–2951. [Google Scholar] [CrossRef] [Green Version]
- Levick, S.R.; Rogers, K.H. Context-dependent vegetation dynamics in an African savanna. Landsc. Ecol. 2011, 26, 515–528. [Google Scholar] [CrossRef]
- Williams, R.; Duff, G.; Bowman, D.; Cook, G. Variation in the composition and structure of tropical savannas as a function of rainfall and soil texture along a large-scale climatic gradient in the Northern Territory, Australia. J. Biogeogr. 1996, 23, 747–756. [Google Scholar] [CrossRef]
- Lehmann, C.E.R.; Anderson, T.M.; Sankaran, M.; Higgins, S.I.; Archibald, S.; Hoffmann, W.A.; Hanan, N.P.; Williams, R.J.; Fensham, R.J.; Felfili, J.; et al. Savanna Vegetation-Fire-Climate Relationships Differ Among Continents. Science 2014, 343, 548–552. [Google Scholar] [CrossRef]
- Hutley, L.B.; Setterfield, S.A. Savannas. In Encyclopaedia of Ecology, 2nd ed.; Faith, B.D., Ed.; Elsevier B.V.: Oxford, UK, 2019; Volume 2, pp. 623–633. [Google Scholar] [CrossRef]
- Hutley, L.B.; Evans, B.J.; Beringer, J.; Cook, G.D.; Maier, S.W.; Razon, E. Impacts of an extreme cyclone event on landscape-scale savanna fire, productivity and greenhouse gas emissions. Environ. Res. Lett. 2013, 8, 045023. [Google Scholar] [CrossRef]
- Oliveras, I.; Malhi, Y. Many shades of green: The dynamic tropical forest–savannah transition zones. Philos. Trans. R. Soc. Biol. Sci. 2016, 371. [Google Scholar] [CrossRef] [Green Version]
- Grace, J.; José, J.S.; Meir, P.; Miranda, H.S.; Montes, R.A. Productivity and carbon fluxes of tropical savannas. J. Biogeogr. 2006, 33, 387–400. [Google Scholar] [CrossRef]
- Kanniah, K.D.; Beringer, J.; Hutley, L.B. Environmental controls on the spatial variability of savanna productivity in the Northern Territory, Australia. Agric. For. Meteorol. 2011, 151, 1429–1439. [Google Scholar] [CrossRef]
- Schimel, D.S. Terrestrial ecosystems and the carbon cycle. Glob. Chang. Biol. 1995, 1, 77–91. [Google Scholar] [CrossRef]
- Stevens, N.; Lehmann, C.E.; Murphy, B.P.; Durigan, G. Savanna woody encroachment is widespread across three continents. Glob. Chang. Biol. 2017, 23, 235–244. [Google Scholar] [CrossRef] [PubMed] [Green Version]
- Wigley, B.J.; Bond, W.J.; Hoffman, M.T. Thicket expansion in a South African savanna under divergent land use: Local vs. global drivers? Glob. Chang. Biol. 2010, 16, 964–976. [Google Scholar] [CrossRef]
- Williams, R.J.; Hutley, L.B.; Cook, G.D.; Russell-Smith, J.; Edwards, A.; Chen, X. Assessing the carbon sequestration potential of mesic savannas in the Northern Territory, Australia: Approaches, uncertainties and potential impacts of fire. Funct. Plant Biol. 2004, 31, 415–422. [Google Scholar] [CrossRef] [PubMed]
- Moncrieff, G.R.; Chamaillé-Jammes, S.; Higgins, S.I.; O’Hara, R.B.; Bond, W.J. Tree allometries reflect a lifetime of herbivory in an African savanna. Ecology 2011, 92, 2310–2315. [Google Scholar] [CrossRef] [PubMed]
- Levick, S.R.; Asner, G.P.; Kennedy-Bowdoin, T.; Knapp, D.E. The relative influence of fire and herbivory on savanna three-dimensional vegetation structure. Biol. Conserv. 2009, 142, 1693–1700. [Google Scholar] [CrossRef]
- Jamali, H.; Livesley, S.; Hutley, L.B.; Fest, B.; Arndt, S. The relationships between termite mound CH4/CO2 emissions and internal concentration ratios are species specific. Biogeosciences 2013, 10, 2229–2240. [Google Scholar] [CrossRef] [Green Version]
- Davies, A.B.; Parr, C.L.; Janse Van Rensburg, B. Termites and Fire: Current Understanding and Future Research Directions for Improved Savanna Conservation. Austral Ecol. 2010, 35, 482–486. [Google Scholar] [CrossRef] [Green Version]
- Midgley, J.J.; Lawes, M.J.; Chamaillé-Jammes, S. Savanna woody plant dynamics: The role of fire and herbivory, separately and synergistically. Aust. J. Bot. 2010, 58, 1–11. [Google Scholar] [CrossRef]
- Chen, X. Carbon Balance of a Eucalypt Open Forest Savanna of Northern Australia. Ph.D. Thesis, Northern Territory University, Casuarina, Australia, 2002. [Google Scholar]
- Jucker, T.; Caspersen, J.; Chave, J.; Antin, C.; Barbier, N.; Bongers, F.; Dalponte, M.; van Ewijk, K.Y.; Forrester, D.I.; Haeni, M.; et al. Allometric equations for integrating remote sensing imagery into forest monitoring programmes. Glob. Chang. Biol. 2017, 23, 177–190. [Google Scholar] [CrossRef]
- Williams, R.J.; Zerihun, A.; Montagu, K.D.; Hoffman, M.; Hutley, L.B.; Chen, X. Allometry for estimating aboveground tree biomass in tropical and subtropical eucalypt woodlands: Towards general predictive equations. Aust. J. Bot. 2005, 53, 607–619. [Google Scholar] [CrossRef]
- Dassot, M.; Colin, A.; Santenoise, P.; Fournier, M.; Constant, T. Terrestrial laser scanning for measuring the solid wood volume, including branches, of adult standing trees in the forest environment. Comput. Electron. Agric. 2012, 89, 86–93. [Google Scholar] [CrossRef]
- Newnham, G.J.; Armston, J.D.; Calders, K.; Disney, M.I.; Lovell, J.L.; Schaaf, C.B.; Strahler, A.H.; Danson, F.M. Terrestrial laser scanning for plot-scale forest measurement. Curr. For. Rep. 2015, 1, 239–251. [Google Scholar] [CrossRef] [Green Version]
- Zimbres, B.; Shimbo, J.; Bustamante, M.; Levick, S.; Miranda, S.; Roitman, I.; Silvério, D.; Gomes, L.; Fagg, C.; Alencar, A. Savanna vegetation structure in the Brazilian Cerrado allows for the accurate estimation of aboveground biomass using terrestrial laser scanning. For. Ecol. Manag. 2020, 458, 117798. [Google Scholar] [CrossRef]
- Malhi, Y.; Jackson, T.; Patrick Bentley, L.; Lau, A.; Shenkin, A.; Herold, M.; Calders, K.; Bartholomeus, H.; Disney, M.I. New perspectives on the ecology of tree structure and tree communities through terrestrial laser scanning. Interface Focus 2018, 8, 20170052. [Google Scholar] [CrossRef] [Green Version]
- Strahler, A.H.; Jupp, D.L.; Woodcock, C.E.; Schaaf, C.B.; Yao, T.; Zhao, F.; Yang, X.; Lovell, J.; Culvenor, D.; Newnham, G.; et al. Retrieval of forest structural parameters using a ground-based lidar instrument (Echidna®). Can. J. Remote Sens. 2008, 34, S426–S440. [Google Scholar] [CrossRef] [Green Version]
- Calders, K.; Armston, J.; Newnham, G.; Herold, M.; Goodwin, N. Implications of sensor configuration and topography on vertical plant profiles derived from terrestrial LiDAR. Agric. For. Meteorol. 2014, 194, 104–117. [Google Scholar] [CrossRef]
- Hardiman, B.S.; LaRue, E.A.; Atkins, J.W.; Fahey, R.T.; Wagner, F.W.; Gough, C.M. Spatial variation in canopy structure across forest landscapes. Forests 2018, 9, 474. [Google Scholar] [CrossRef] [Green Version]
- Singh, J.; Levick, S.R.; Guderle, M.; Schmullius, C.; Trumbore, S.E. Variability in fire-induced change to vegetation physiognomy and biomass in semi-arid savanna. Ecosphere 2018, 9, e02514. [Google Scholar] [CrossRef] [Green Version]
- Singh, J.; Levick, S.R.; Guderle, M.; Schmullius, C. Moving from plot-based to hillslope-scale assessments of savanna vegetation structure with long-range terrestrial laser scanning (LR-TLS). Int. J. Appl. Earth Obs. Geoinf. 2020, 90, 102070. [Google Scholar] [CrossRef]
- Kunz, F.; Gamauf, A.; Zachos, F.E.; Haring, E. Mitochondrial phylogenetics of the goshawk Accipiter gentilis superspecies. J. Zool. Syst. Evol. Res. 2019, 57, 942–958. [Google Scholar] [CrossRef] [Green Version]
- Calders, K.; Newnham, G.; Burt, A.; Murphy, S.; Raumonen, P.; Herold, M.; Culvenor, D.; Avitabile, V.; Disney, M.; Armston, J.; et al. Nondestructive estimates of above-ground biomass using terrestrial laser scanning. Methods Ecol. Evol. 2015, 6, 198–208. [Google Scholar] [CrossRef]
- Calders, K.; Adams, J.; Armston, J.; Bartholomeus, H.; Bauwens, S.; Patrick Bentley, L.; Chave, J.; Danson, F.M.; Demol, M.; Disney, M.; et al. Terrestrial Laser Scanning in Forest Ecology: Expanding the Horizon. Remote Sens. Environ. 2020, in press. [Google Scholar] [CrossRef]
- Disney, M.; Burt, A.; Calders, K.; Schaaf, C.; Stovall, A. Innovations in ground and airborne technologies as reference and for training and validation: Terrestrial laser scanning (TLS). Surv. Geophys. 2019, 40, 937–958. [Google Scholar] [CrossRef] [Green Version]
- Karan, M.; Liddell, M.; Prober, S.M.; Arndt, S.; Beringer, J.; Boer, M.; Cleverly, J.; Eamus, D.; Grace, P.; Van Gorsel, E.; et al. The Australian SuperSite Network: A continental, long-term terrestrial ecosystem observatory. Sci. Total. Environ. 2016, 568, 1263–1274. [Google Scholar] [CrossRef]
- Australian Bureau of Meteorology. Monthly Rainfall, Station No. 014021; Australian Bureau of Meteorology: Melbourne, Australia. Available online: http://www.bom.gov.au/climate/data/ (accessed on 27 November 2020).
- Cook, G.D. Fire management and minesite rehabilitation in a frequently burnt tropical savanna. Austral Ecol. 2012, 37, 686–692. [Google Scholar] [CrossRef]
- Leica Geosystems, A.G. Leica BLK360 User Manual; Leica Geosystems AG: St. Gallen, Switzerland, 2017. [Google Scholar]
- Aubry-Kientz, M.; Dutrieux, R.; Ferraz, A.; Saatchi, S.; Hamraz, H.; Williams, J.; Coomes, D.; Piboule, A.; Vincent, G. A comparative assessment of the performance of individual tree crowns delineation algorithms from ALS data in tropical forests. Remote Sens. 2019, 11, 1086. [Google Scholar] [CrossRef] [Green Version]
- Barnes, C.; Balzter, H.; Barrett, K.; Eddy, J.; Milner, S.; Suárez, J.C. Individual tree crown delineation from airborne laser scanning for diseased larch forest stands. Remote Sens. 2017, 9, 231. [Google Scholar] [CrossRef] [Green Version]
- R Core Team. R: A Language and Environment for Statistical Computing; R Core Team: Vienna, Austria, 2013. [Google Scholar]
- Fong, Y.; Huang, Y.; Gilbert, P.B.; Permar, S.R. chngpt: Threshold regression model estimation and inference. BMC Bioinform. 2017, 18, 454. [Google Scholar] [CrossRef] [Green Version]
- Sasaki, T.; Konno, M.; Hasegawa, Y.; Imaji, A.; Terabaru, M.; Nakamura, R.; Ohira, N.; Matsukura, K.; Seiwa, K. Role of mycorrhizal associations in tree spatial distribution patterns based on size class in an old-growth forest. Oecologia 2019, 189, 971–980. [Google Scholar] [CrossRef]
- Moore, J.R.; Zhu, K.; Huntingford, C.; Cox, P.M. Equilibrium forest demography explains the distribution of tree sizes across North America. Environ. Res. Lett. 2018, 13, 84019. [Google Scholar] [CrossRef]
- Levick, S.R.; Richards, A.E.; Cook, G.D.; Schatz, J.; Guderle, M.; Williams, R.J.; Subedi, P.; Trumbore, S.E.; Andersen, A.N. Rapid response of habitat structure and above-ground carbon storage to altered fire regimes in tropical savanna. Biogeosciences 2019, 16, 1493–1503. [Google Scholar] [CrossRef] [Green Version]
- Cuni-Sanchez, A.; White, L.J.T.; Calders, K.; Jeffery, K.J.; Abernethy, K.; Burt, A.; Disney, M.; Gilpin, M.; Gomez-Dans, J.L.; Lewis, S.L. African Savanna-Forest Boundary Dynamics: A 20-Year Study. PLoS ONE 2016, 11, e0156934. [Google Scholar] [CrossRef] [PubMed]
- Paul, K.I.; Larmour, J.S.; Roxburgh, S.H.; England, J.R.; Davies, M.J.; Luck, H.D. Measurements of stem diameter: Implications for individual-and stand-level errors. Environ. Monit. Assess. 2017, 189, 416. [Google Scholar] [CrossRef] [PubMed]
- Bruce, D. Evaluating Accuracy of Tree Measurements made with Optical Instruments. For. Sci. 1975, 21, 421–426. [Google Scholar]
- Wang, D.; Hollaus, M.; Puttonen, E.; Pfeifer, N. Automatic and Self-Adaptive Stem Reconstruction in Landslide-Affected Forests. Remote Sens. 2016, 8, 974. [Google Scholar] [CrossRef] [Green Version]
- Bienert, A.; Georgi, L.; Kunz, M.; Maas, H.G.; Oheimb, G. Comparison and Combination of Mobile and Terrestrial Laser Scanning for Natural Forest Inventories. Forests 2018, 9, 395. [Google Scholar] [CrossRef] [Green Version]
- Pazhouhan, I.; Najafi, A.; Kamkar-Rouhani, A.; Vahidi, J.; Najafi, A. Extraction of Individual Tree Parameters by Using Terrestrial Laser Scanner Data in Hyricanian. Forest 2018. [Google Scholar] [CrossRef]
- Reddy, R.S.; Rakesh, C.S.; Rajan, K.S. Automatic estimation of tree stem attributes using terrestrial laser scanning in central Indian dry deciduous forests. Curr. Sci. 2018, 114, 201. [Google Scholar] [CrossRef]
- Sun, H.; Wang, G.; Lin, H.; Li, J.; Zhang, H.; Ju, H. Retrieval and Accuracy Assessment of Tree and Stand Parameters for Chinese Fir Plantation Using Terrestrial Laser Scanning. IEEE Geosci. Remote Sens. Lett. 2015, 12, 1993–1997. [Google Scholar] [CrossRef]
- Beyene, S.M.; Hussin, Y.A.; Kloosterman, H.E.; Ismail, M.H. Forest Inventory and Aboveground Biomass Estimation with Terrestrial LiDAR in the Tropical Forest of Malaysia. Can. J. Remote. Sens. 2020, 46, 1–16. [Google Scholar] [CrossRef]
- Cook, G.D.; Liedloff, A.C.; Cuff, N.J.; Brocklehurst, P.S.; Williams, R.J. Stocks and dynamics of carbon in trees across a rainfall gradient in a tropical savanna. Austral Ecol. 2015, 40, 845–856. [Google Scholar] [CrossRef]
- Setterfield, S.A. Seedling establishment in an Australian tropical savanna: Effects of seed supply, soil disturbance and fire. J. Appl. Ecol. 2002, 39, 949–959. [Google Scholar] [CrossRef]
- Bond, W.J.; Cook, G.D.; Williams, R.J. Which trees dominate in savannas? The escape hypothesis and eucalypts in northern Australia. Austral Ecol. 2012, 37, 678–685. [Google Scholar] [CrossRef]
- Olsoy, P.J.; Glenn, N.F.; Clark, P.E.; Derryberry, D.R. Aboveground total and green biomass of dryland shrub derived from terrestrial laser scanning. ISPRS J. Photogramm. Remote Sens. 2014, 88, 166–173. [Google Scholar] [CrossRef] [Green Version]
- Wallace, L.; Hillman, S.; Reinke, K.; Hally, B. Non-destructive estimation of above-ground surface and near-surface biomass using 3D terrestrial remote sensing techniques. Methods Ecol. Evol. 2017, 8, 1607–1616. [Google Scholar] [CrossRef] [Green Version]
- Asner, G.P.; Levick, S.R.; Kennedy-Bowdoin, T.; Knapp, D.E.; Emerson, R.; Jacobson, J.; Colgan, M.S.; Martin, R.E. Large-scale impacts of herbivores on the structural diversity of African savannas. Proc. Natl. Acad. Sci. USA 2009, 106, 4947–4952. [Google Scholar] [CrossRef] [PubMed] [Green Version]
- Asner, G.P.; Levick, S.R. Landscape-scale effects of herbivores on treefall in African savannas. Ecol. Lett. 2012, 15, 1211–1217. [Google Scholar] [CrossRef]
- Dohn, J.; Augustine, D.J.; Hanan, N.P.; Ratnam, J.; Sankaran, M. Spatial vegetation patterns and neighborhood competition among woody plants in an East African savanna. Ecology 2017, 98, 478–488. [Google Scholar] [CrossRef] [Green Version]
- Paul, K.I.; Roxburgh, S.H.; Chave, J.; England, J.R.; Zerihun, A.; Specht, A.; Lewis, T.; Bennett, L.T.; Baker, T.G.; Adams, M.A.; et al. Testing the generality of above-ground biomass allometry across plant functional types at the continent scale. Glob. Chang. Biol. 2016, 22, 2106–2124. [Google Scholar] [CrossRef]
- Cook, G.D.; Liedloff, A.C.; Eager, R.; Chen, X.; Williams, R.; O’Grady, A.P.; Hutley, L.B. The estimation of carbon budgets of frequently burnt tree stands in savannas of northern Australia, using allometric analysis and isotopic discrimination. Aust. J. Bot. 2005, 53, 621–630. [Google Scholar] [CrossRef]
Figure 1.
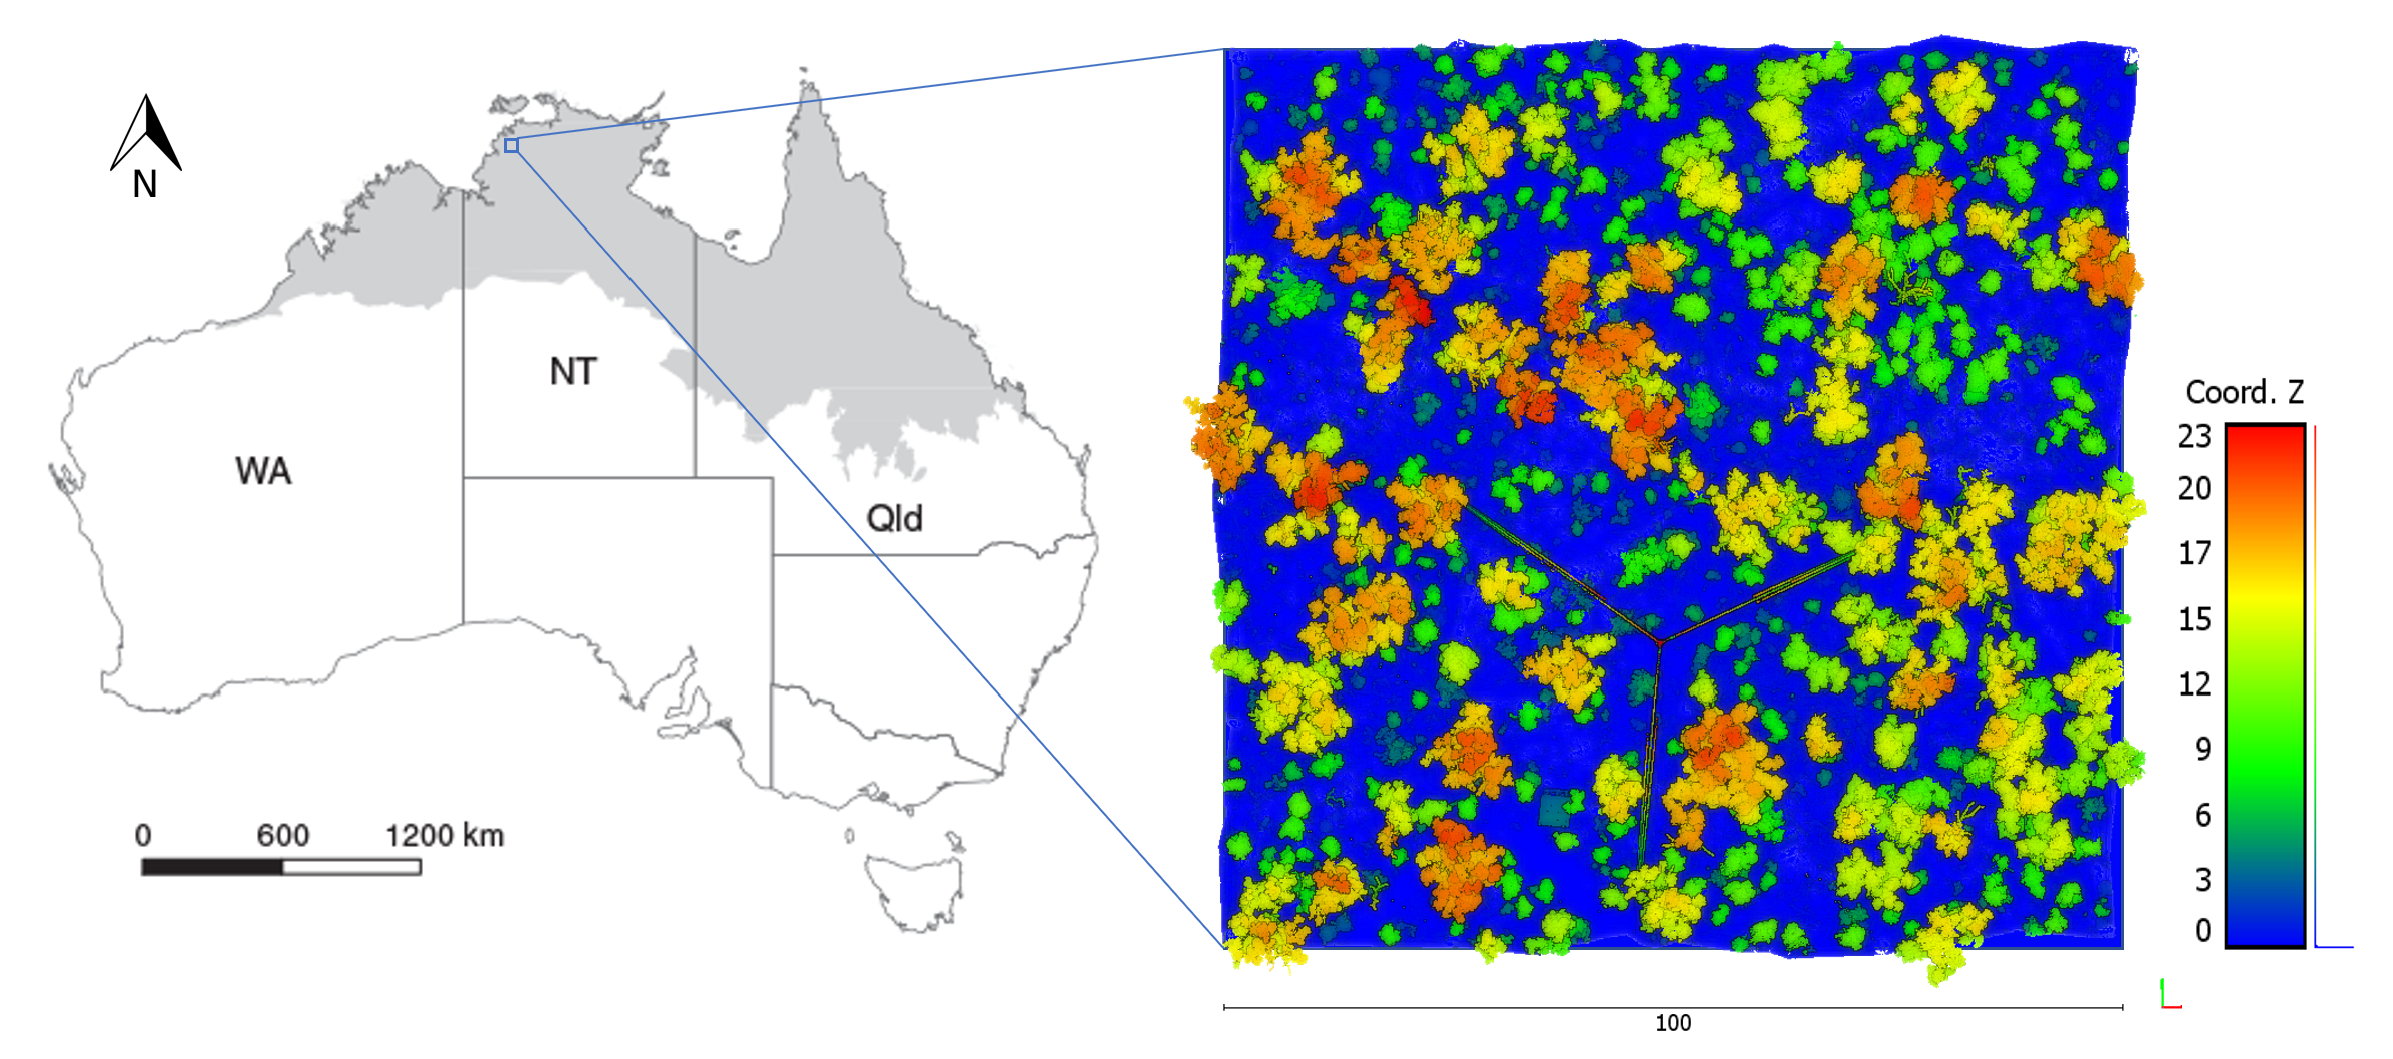
Study area. Left: The north Australian tropical zone spans across Western Australia (WA), the Northern Territory (NT), and Queensland (Qld). Right: canopy height model of the 1 ha study area from TLS (scale bar in m, color scale ranging from blue for lowest points through to red for highest points) showing heterogeneous distribution of tree size classes.
Figure 1.
Study area. Left: The north Australian tropical zone spans across Western Australia (WA), the Northern Territory (NT), and Queensland (Qld). Right: canopy height model of the 1 ha study area from TLS (scale bar in m, color scale ranging from blue for lowest points through to red for highest points) showing heterogeneous distribution of tree size classes.

Figure 2.
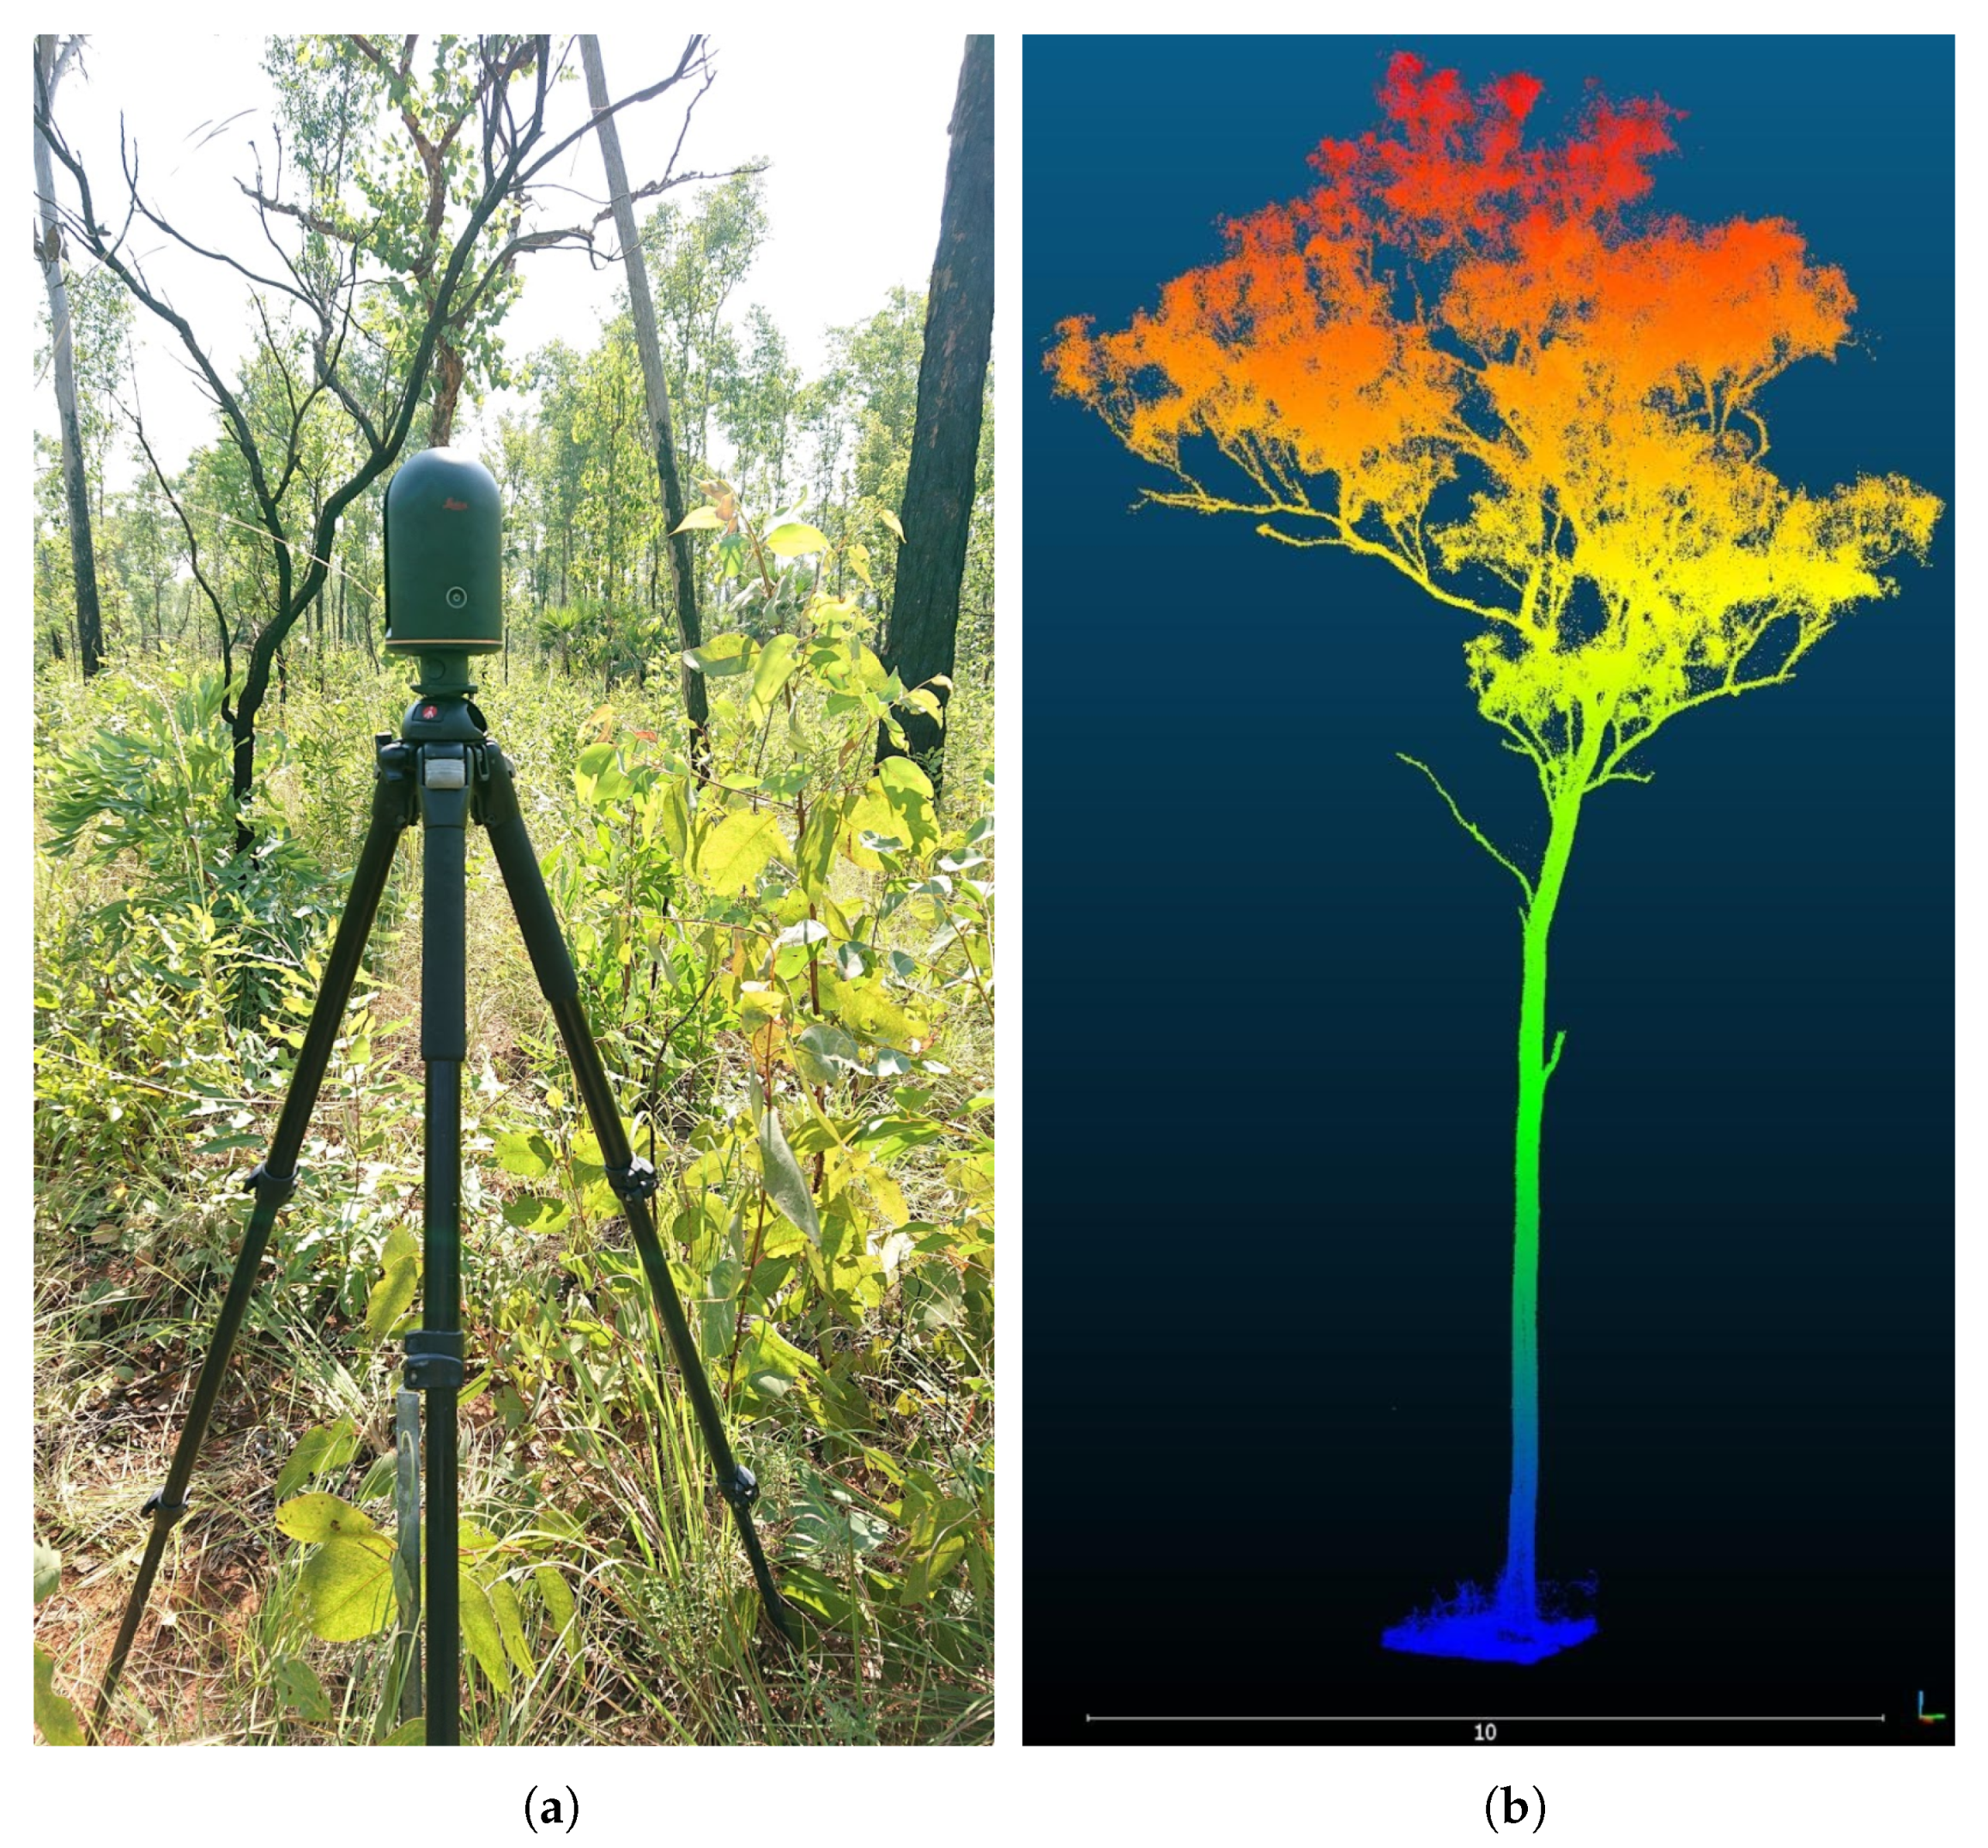
(a) Leica BLK360 set up within the study area; (b) Eucalyptus tetrodonta sub-sampled to 2 points cm, point size 1. The crown is irregularly shaped with evidence of storm and/or fire damage.
Figure 2.
(a) Leica BLK360 set up within the study area; (b) Eucalyptus tetrodonta sub-sampled to 2 points cm, point size 1. The crown is irregularly shaped with evidence of storm and/or fire damage.

Figure 3.
Workflow diagram for point cloud processing.

Figure 4.
The study site (1 ha plot) segmented into 976 individual trees. Colours are assigned randomly; automated segmentation was followed by fine scale user editing.
Figure 4.
The study site (1 ha plot) segmented into 976 individual trees. Colours are assigned randomly; automated segmentation was followed by fine scale user editing.

Figure 5.
Spatial distribution and number of trees captured in both surveys conducted in August 2018. (a) distribution map of field survey; (b) distribution map of terrestrial laser scanning (TLS) survey, red denotes trees with stem diameter (DBH) < 0.05 m not captured in the manual survey (n grey = 449, n red = 358); (c) Histogram of field survey; (d) Histogram of TLS survey. TLS surveys are able to capture small trees that are impractical to include in manual field inventories.

Figure 6.
Difference between TLS tree count and field tree count. The average tree count per grid cell in the field survey is not significantly different from the average tree count in the TLS survey (p > 0.05). For this analysis only trees with DBH > 0.05 m (−0.007 m mean absolute error (MAE)) were used.

Figure 7.
Correlation between field survey and concurrent TLS scan; ribbon showing 95% confidence interval. For every cm increase in TLS DBH there is an average 1.04 cm increase in field DBH (95% CI 1.03–1.05, p < 0.001) (n = 448).
Figure 7.
Correlation between field survey and concurrent TLS scan; ribbon showing 95% confidence interval. For every cm increase in TLS DBH there is an average 1.04 cm increase in field DBH (95% CI 1.03–1.05, p < 0.001) (n = 448).

Figure 8.
TLS derived crown area for a given DBH; ribbon showing 95% confidence interval. The spread of crown sizes increases with increasing DBH (n = 807).
Figure 8.
TLS derived crown area for a given DBH; ribbon showing 95% confidence interval. The spread of crown sizes increases with increasing DBH (n = 807).

Figure 9.
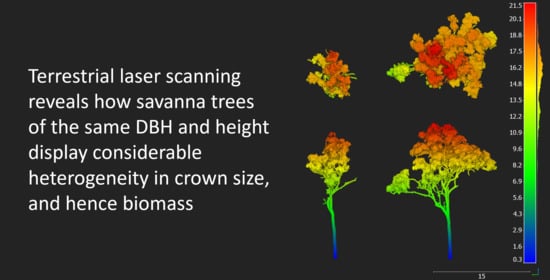
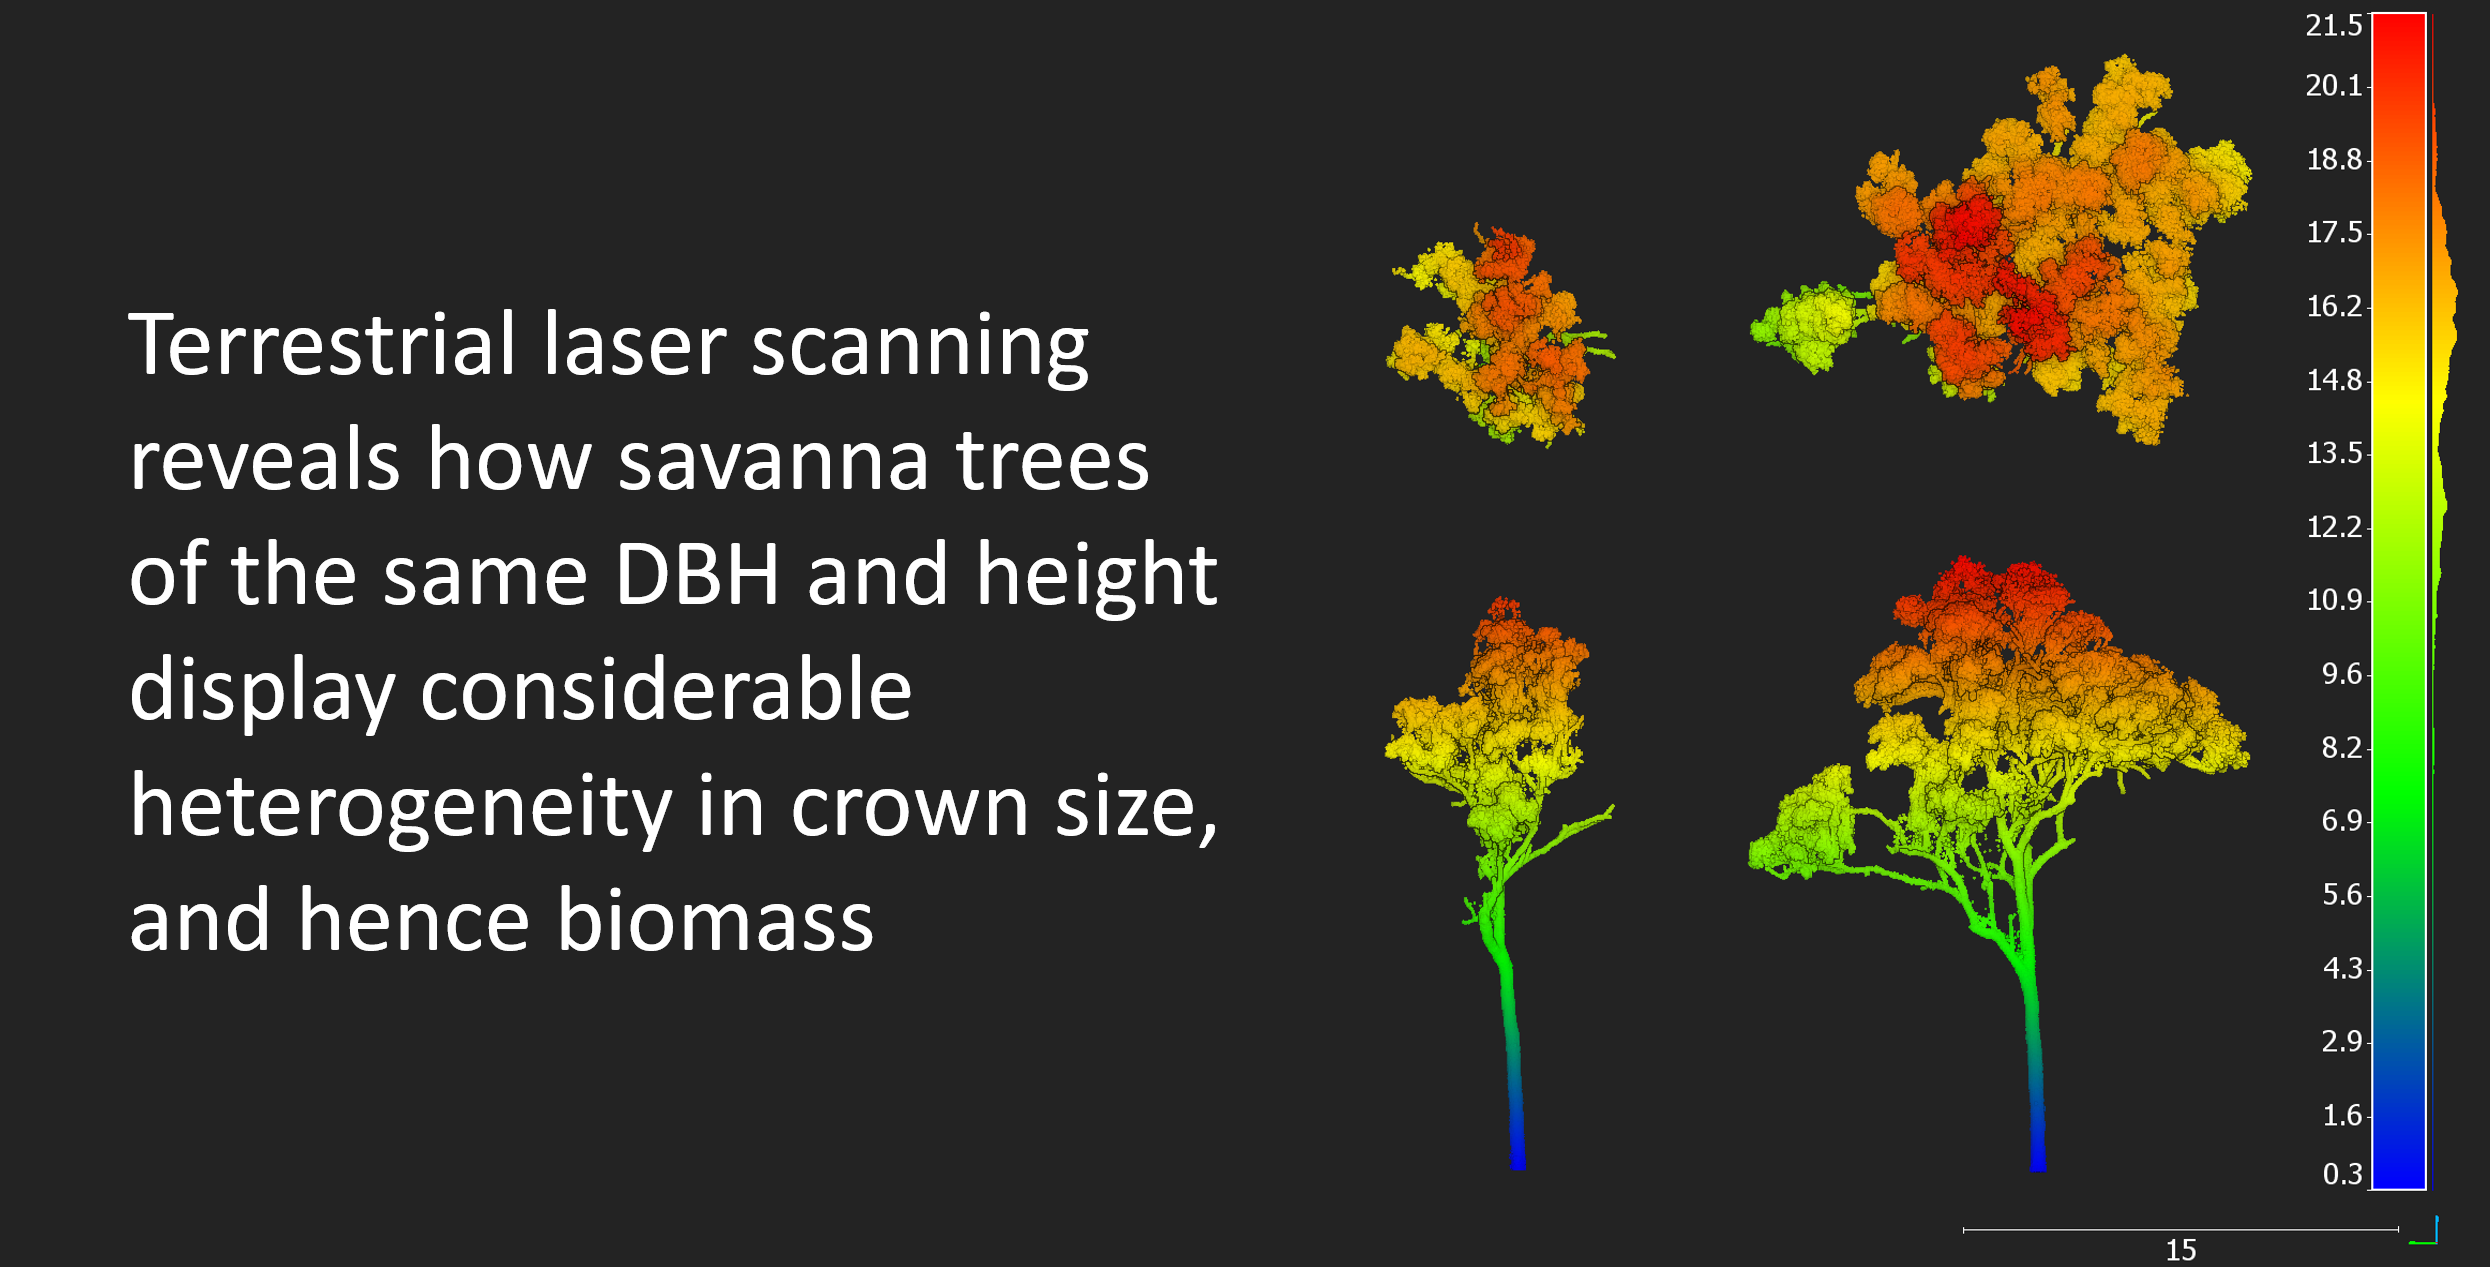
Two examples of typical mature Eucalyptus miniata individuals, both with a DBH of 0.38 m highlighting the dramatic difference in canopy structure, volume and biomass. Estimates of carbon storage of the left individual would be significantly overestimated using a manually measured DBH with allometry applied.
Figure 9.
Two examples of typical mature Eucalyptus miniata individuals, both with a DBH of 0.38 m highlighting the dramatic difference in canopy structure, volume and biomass. Estimates of carbon storage of the left individual would be significantly overestimated using a manually measured DBH with allometry applied.


Table 1.
Variability in tree crown structural parameters as a function of DBH class, showing values of the mean and standard error of the mean.
Table 1.
Variability in tree crown structural parameters as a function of DBH class, showing values of the mean and standard error of the mean.
| Canopy Height (m) | Crown Area (m) | |||
|---|---|---|---|---|
| DBH Range (m) | Mean | SE | Mean | SE |
| 0.00–0.05 | 4.37 | 0.10 | 1.19 | 0.06 |
| 0.05–0.10 | 7.89 | 0.14 | 4.22 | 0.16 |
| 0.10–0.15 | 11.10 | 0.44 | 11.45 | 1.25 |
| 0.15–0.20 | 14.02 | 0.64 | 25.30 | 2.93 |
| 0.20–0.25 | 17.96 | 0.49 | 39.79 | 3.19 |
| 0.25–0.30 | 18.30 | 0.50 | 50.62 | 6.96 |
| 0.30–0.35 | 19.58 | 0.66 | 62.09 | 9.80 |
| >0.35 | 17.89 | 1.56 | 64.64 | 18.33 |
Publisher’s Note: MDPI stays neutral with regard to jurisdictional claims in published maps and institutional affiliations. |
© 2020 by the authors. Licensee MDPI, Basel, Switzerland. This article is an open access article distributed under the terms and conditions of the Creative Commons Attribution (CC BY) license (http://creativecommons.org/licenses/by/4.0/).
Share and Cite
MDPI and ACS Style
Luck, L.; Hutley, L.B.; Calders, K.; Levick, S.R. Exploring the Variability of Tropical Savanna Tree Structural Allometry with Terrestrial Laser Scanning. Remote Sens. 2020, 12, 3893. https://doi.org/10.3390/rs12233893
AMA Style
Luck L, Hutley LB, Calders K, Levick SR. Exploring the Variability of Tropical Savanna Tree Structural Allometry with Terrestrial Laser Scanning. Remote Sensing. 2020; 12(23):3893. https://doi.org/10.3390/rs12233893
Chicago/Turabian StyleLuck, Linda, Lindsay B. Hutley, Kim Calders, and Shaun R. Levick. 2020. "Exploring the Variability of Tropical Savanna Tree Structural Allometry with Terrestrial Laser Scanning" Remote Sensing 12, no. 23: 3893. https://doi.org/10.3390/rs12233893
Note that from the first issue of 2016, this journal uses article numbers instead of page numbers. See further details here.