Formation Mechanism for Upland Low-Relief Surface Landscapes in the Three Gorges Region, China
by
 , ,
, ,
Lingyun Lv
1,2, 
Lunche Wang
1,2,*,
Chang’an Li
1,2,
Hui Li
1,2,
Xinsheng Wang
3 and
Shaoqiang Wang
1,2,4 1
Key Laboratory of Regional Ecology and Environmental Change, School of Geography and Information Engineering, China University of Geosciences, Wuhan 430074, China
2
Hubei Key Laboratory of Critical Zone Evolution, School of Geography and Information Engineering, China University of Geosciences, Wuhan 430074, China
3
Hubei Key Laboratory of Regional Development and Environmental Response, Hubei University, Wuhan 430062, China
4
Institute of Geographic Sciences and Natural Resources Research, Chinese Academy of Sciences, Beijing 100101, China
*
Author to whom correspondence should be addressed.
Remote Sens. 2020, 12(23), 3899; https://doi.org/10.3390/rs12233899
Submission received: 9 November 2020
/
Revised: 21 November 2020
/
Accepted: 26 November 2020
/
Published: 27 November 2020
Abstract
:Extensive areas with low-relief surfaces that are almost flat surfaces high in the mountain ranges constitute the dominant geomorphic feature of the Three Gorges area. However, their origin remains a matter of debate, and has been interpreted previously as the result of fluvial erosion after peneplain uplift. Here, a new formation mechanism for these low-relief surface landscapes has been proposed, based on the analyses of low-relief surface distribution, swath profiles, χ mapping, river capture landform characteristics, and a numerical analytical model. The results showed that the low-relief surfaces in the Three Gorges area could be divided into higher elevation and lower elevation surfaces, distributed mainly in the highlands between the Yangtze River and Qingjiang River. The analyses also showed that the rivers on both sides of the drainage divide have not yet reached equilibrium, with actively migrating drainage divides and river basins in the process of reorganizing. It was concluded that the low-relief surfaces in the Three Gorges area did not share a common uplift history, and neither were they peneplain relicts, but rather that the effect of “area-loss feedback” caused by river capture has promoted the formation of upland low-relief surface landscapes. A future work aims to present the contribution of accurate dating of low-relief surface landscapes.
1. Introduction
In the 19th century, Davis [1] proposed erosion cycle and quasi-plain theories, and in conformity with these, gentle rolling surfaces perched high in rugged mountain ranges, have been considered widely to be the remains of large peneplains. These remains were thought to have been formed by river dissection, after undergoing tectonic peneplain uplift, and have often been referred to as planation surfaces. These planation surfaces were often considered to be the starting points for the evolution of modern drainage and valley systems [2,3]. As a prominent regional element and an excellent reference level index, planation surfaces are important in the study of long-term geomorphologic evolution.
However, some scholars have questioned the term “quasi-plain” because the modern peneplains are either absent or exceedingly rare [4,5], with the main argument being whether tectonics could remain stable over a suitably extended period. A balanced uplift will never cause the area where such a landform is located to fall to sea level, where they have been found, and, considering climate change fluctuations, the quasi-plain seems to be an idealized landform, which has never actually been formed. More recently, when the origin and properties of a gentle geomorphologic surface have been unclear, the concept of a “low-relief surface,” which is characterized by slightly undulating mountaintop areas, has been used more often by scholars. This concept emphasizes the gently rolling topography, which is usually described quantitatively as being less than a certain slope angle [6].
There have been two main theories regarding the formation mechanism of elevated, low-relief surface landscapes. The conventional explanation has been the “quasi-plain uplift” model, which insists that these surfaces are remnants of a previously continuous landscape [7,8]. This interpretation has usually assumed that the river network has been static in structure and has ignored the impacts of divide migration and reorganization of the river basin as part of the area’s geomorphologic evolution. In contrast, more recent theory refers to a “river piracy” concept, in which it is argued that formation of an in situ, low-relief surface can be promoted by feedback from a lost drainage area [9,10]. These two views may be complementary, but it is important to determine which formation mechanism has been dominant in an active tectonic region [11].
The widely distributed, low-relief surface landscapes in the Three Gorges area have attracted geographers’ attention over the long-term. Because of the absence of dating materials, the low-relief surfaces here have been controversial, in terms of their period, formation mechanism, and age. Most previous studies interpreted the low-relief surfaces as a planation surface, and divided them into different periods. Sheng [12] thought that there were three planation surface levels in the western Hubei Mountains area, while Tian et al. [13] proposed further dividing the planation surfaces of the Three Gorges area into three phases—as represented by the E’Xi, Shan Yuan, and Yun Meng planation surfaces—and five levels. Xie et al. [14] abandoned the previous naming method, noting that there were only two planation surface levels (high and low), with a single altiplanation surface level in this area, while Li et al. [15] believed that the higher planation surface was formed at the end of the Late Tertiary, and that its age was >25 Ma. The formation of the lower planation surface started at the beginning of the Late Tertiary and ended at 3.0–3.4 Ma, with the upper time limit for development of the lowest erosive surface dated to 1.80–2.04 Ma, and the lower limit dated to 3.0–3.4 Ma.
Some scholars have questioned the view that there are planation surfaces in the Three Gorges area. Ding [16] considered that there was no multilevel denudation surface in western Hubei, and that the differential lifting that took place during the Himalayan movement divided the previously formed denudation surfaces into different elevations, before eventually destroying them, more or less. Yang and Ren [17] believed that the multilevel landform surface of the western Hubei Mountains was not correctly described as a planation surface, and that the Three Gorges area has been in the regional watershed for a long time, making it impossible for a unified peneplain–planation surface to have formed. Wang et al. [18] showed that the current, layered landforms in the Three Gorges area may have resulted from crustal uplift that started in the Early Pleistocene. Overall, it seems plausible that the actual landform evolution process may be more complicated than the ideal intermittent uplift needed to form layered landforms, with different regions perhaps having different uplift histories.
Previous research described above has made a positive contribution to understanding the development of the low-relief surface landscapes in the Three Gorges area. However, its origin, and whether it should be labeled as a planation surface remain controversial topics. This shows that analysis of the upland, low-relief surface landscape formation mechanisms is important if the topographic evolution of the Three Gorges area is to be understood. Therefore, the purpose of the study described in this paper was to use 30 m resolution digital elevation model (DEM) to identify the distribution range of low-relief surfaces in the Three Gorges area, from the perspective of geomorphic indicators. To analyze the feedback effect of river basin reorganization on the formation of the upland low-relief surface, we constructed χ maps which provide a valuable metric for the state of disequilibrium. We also selected three low-relief patches, to demonstrate that they were not remnants from previous landforms, and then used a landscape evolution model (LEM) to simulate the low-relief surface formation mechanism visually. By using these tools and morphometric criteria, we emphasized the importance of river capture and drainage adjustment in the landscape evolution. Thus, this work provides both an insight into the geomorphologic origin of the current study area and a method that may apply to other similar research areas.
2. Study Area
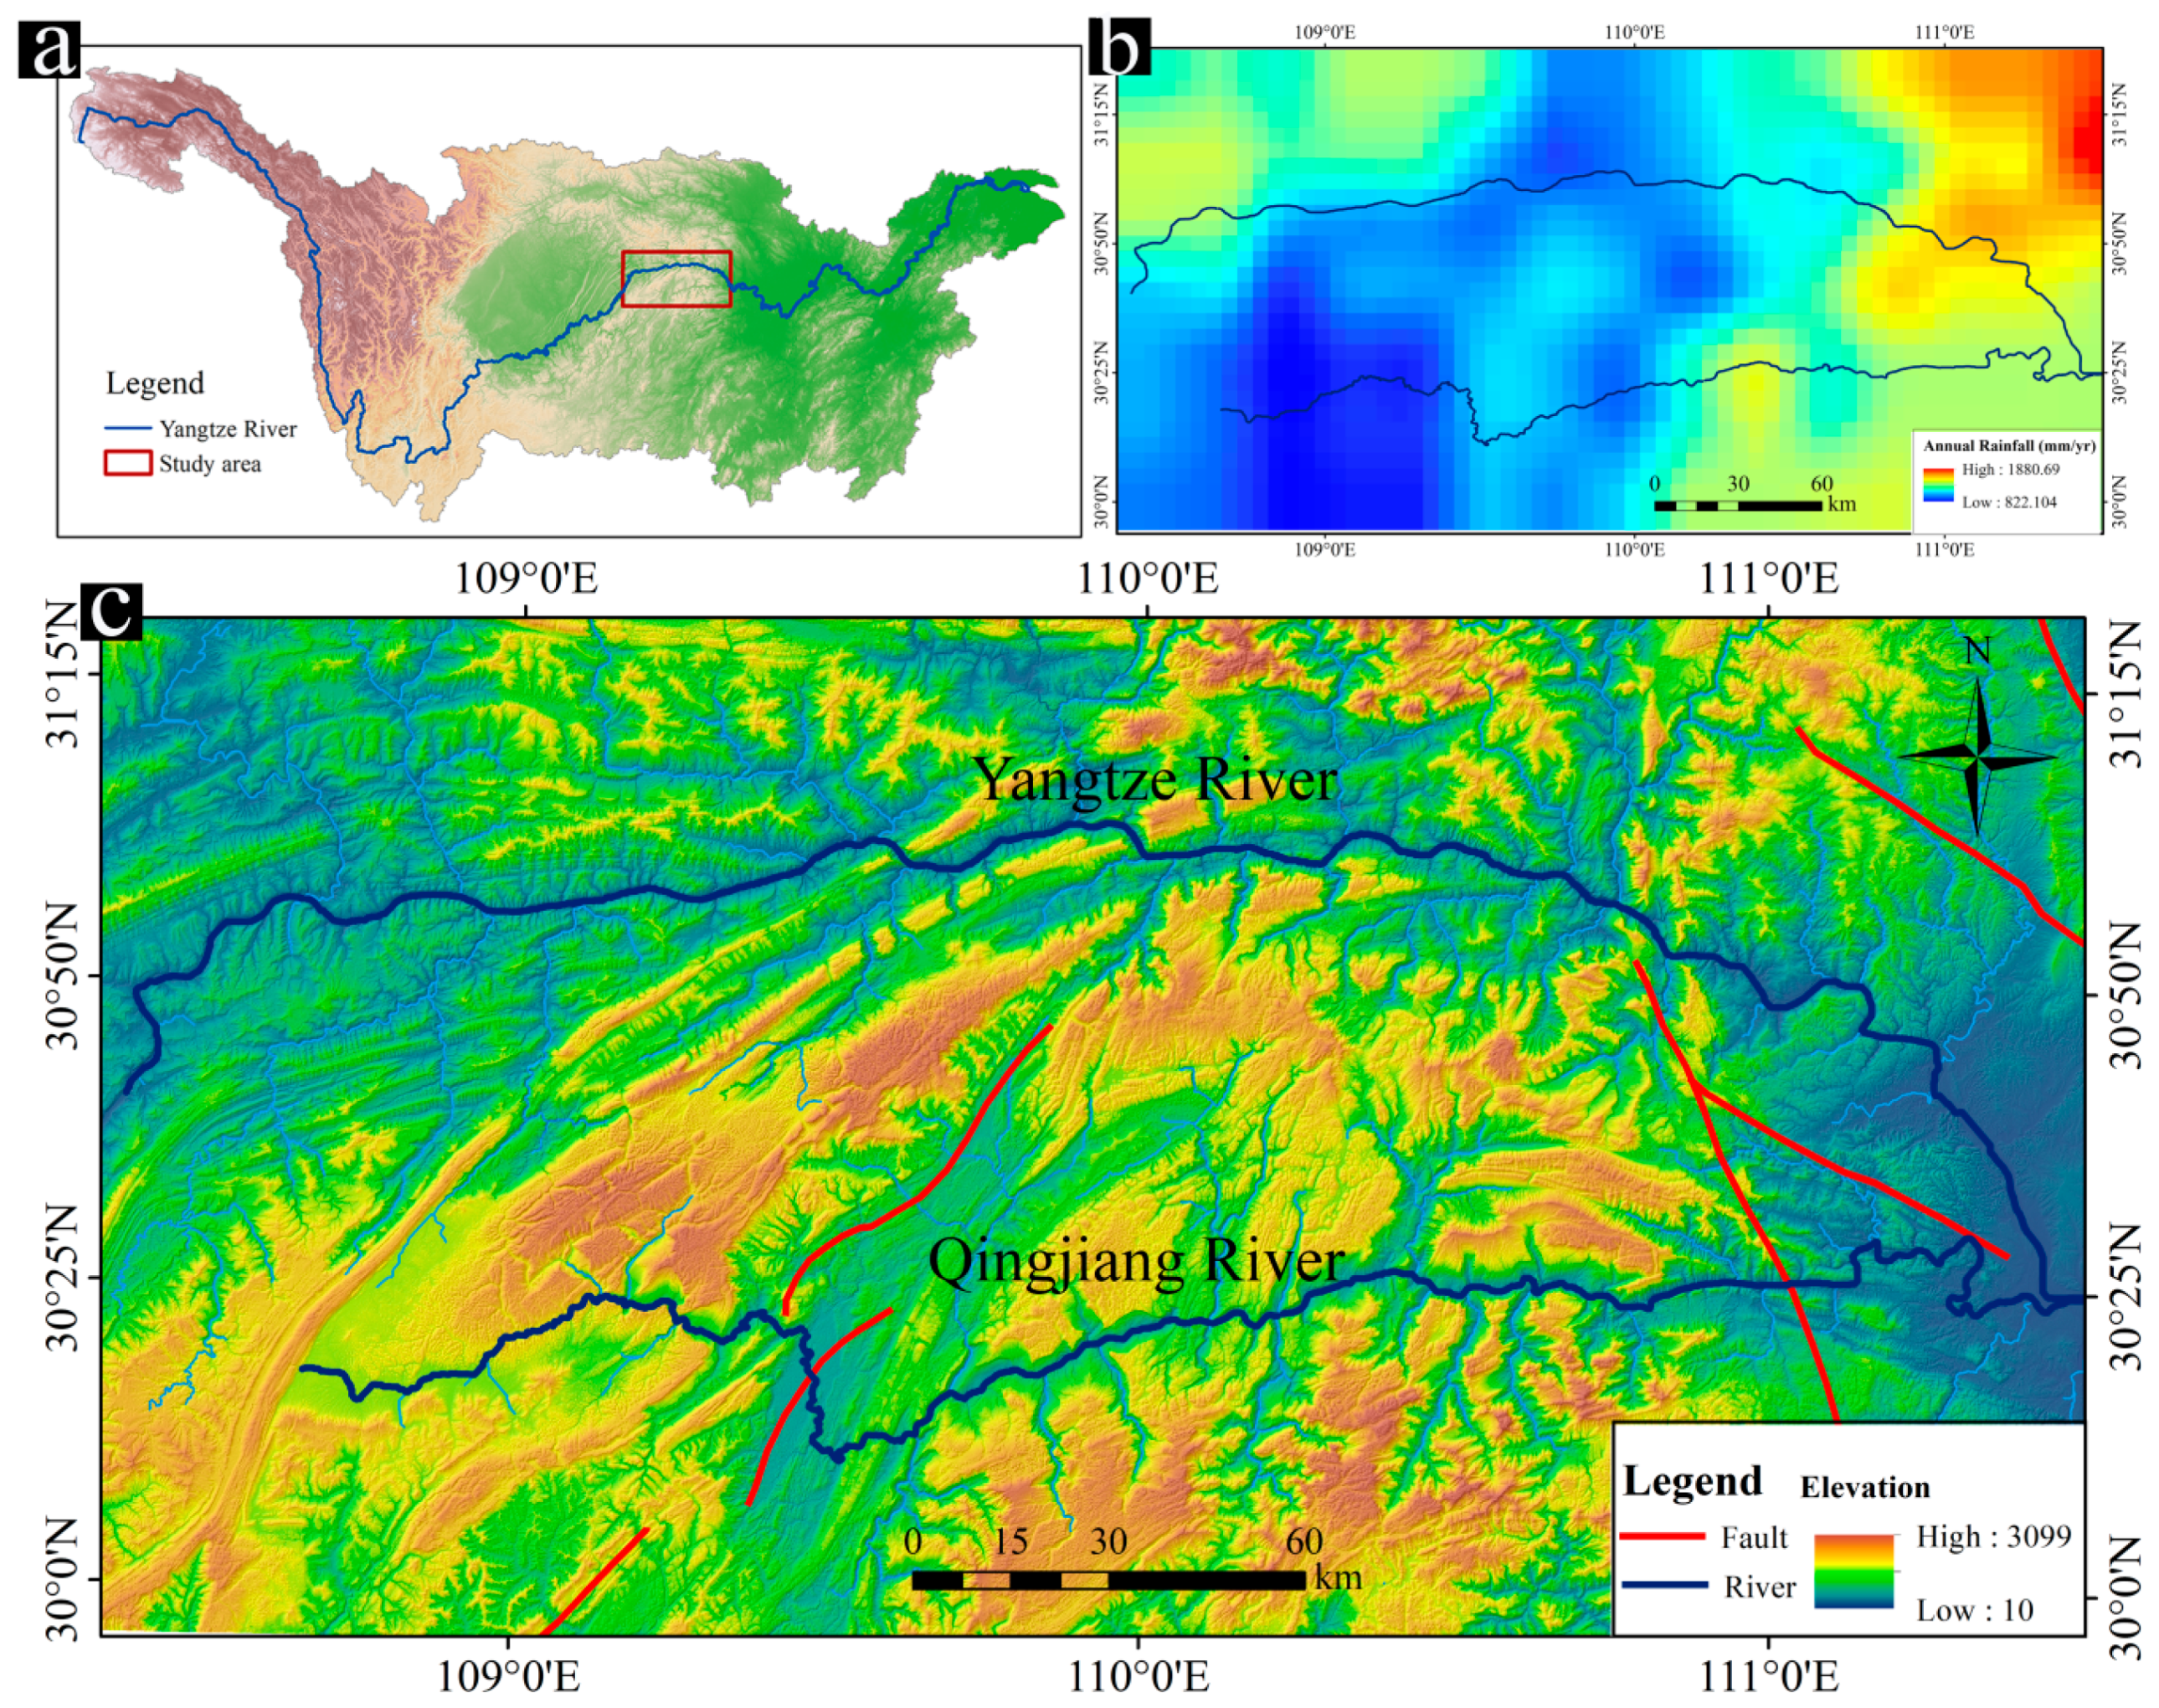
The Three Gorges of the Yangtze River is located on the edge of the second transitional belt in China (Figure 1a), and its name was derived from the three adjacent gorges (Qutang Gorge, Wu Gorge and Xiling Gorge). Because of the difference in topography caused by the uplift of the Tibetan Plateau, the middle reaches of the Yangtze River reversed in the Three Gorges area, forming a continuous river flowing eastward [19]. The Qingjiang River is in western Hubei and a first-level tributary of the Yangtze River. In the study area, the trunk streams of the Yangtze and Qingjiang rivers flow from west to east, parallel to one another, and just tens of kilometers apart (Figure 1c).
The region’s geology has been controlled by a squeeze extension effect, caused by the northward intracontinental subduction pulsations of the Indian Plate, the Tibetan Plateau uplift, and lateral compression [20]. Since the Neogene, neotectonic movements in the Three Gorges area have been represented by vertical motion (formation of multilevel river terraces, multilayer karst, and modern crustal deformation), inherited fault activities and earthquakes. The geology of the study area consists of a crystalline basement structural layer and two sedimentary covering layers [21]. The area consists of a series of limestone ridges and gorges, which are predominantly interbedded mudstone, shale, and thin limestone [22].
Located in the subtropical monsoon climate zone, the average annual rainfall exceeds 800 mm in the Three Gorges region (Figure 1b), which causes severe ground erosion and makes deposit preservation on the low-relief surface landforms problematic. These characteristics make it difficult to obtain material suitable for dating.
3. Data and Methods
3.1. Data
High-accuracy DEM data are essential for many fields such as topographic morphology analysis [23,24,25]. The DEM used in this study was derived from SRTM1 Arc-second Global, which has a spatial resolution of 30 m [26] (https://earthexplorer.usgs.gov/). Because the SRTM1 data have the characteristic of less noise, there are relatively fewer sinks that need to be filled, so the river networks created by SRTM1 in this research were more accurate than those created using other DEM data [27]. The average annual precipitation was obtained by resampling for the study area with a spatial resolution of approximately 5 × 5 km, based on the 10-year Tropical Rainfall Measuring Mission, 3B43 product (TRMM 3B43), covering the period 2009–2018.
3.2. Low-Relief Surface Mapping
The identification and reconstruction of low-relief surfaces are essential prerequisites for their application to geomorphologic analyses. In the past, identification of low-relief surfaces was usually based on topographic map research combined with field surveys to carry out ground-truthing, mapping and delineation; however, such a method is not only subjective, but also very time consuming [28]. With the development of remote sensing technology, DEM has become the most promising data source for extracting low-relief surfaces, as it records absolute elevations, which can be used for landscape visualization [29].
There are currently three main methods for mapping low-relief surfaces using DEM data. First involves manually drawing the surface distribution range by visual interpretation [22,30]. Although this method is very accurate, it demands high workload and has low efficiency. The second method involves using fuzzy logic to extract data, through smooth transitions [28,31,32], while the third requires the automatic extraction of low-relief surface levels, using certain geomorphic indicators [7,33].
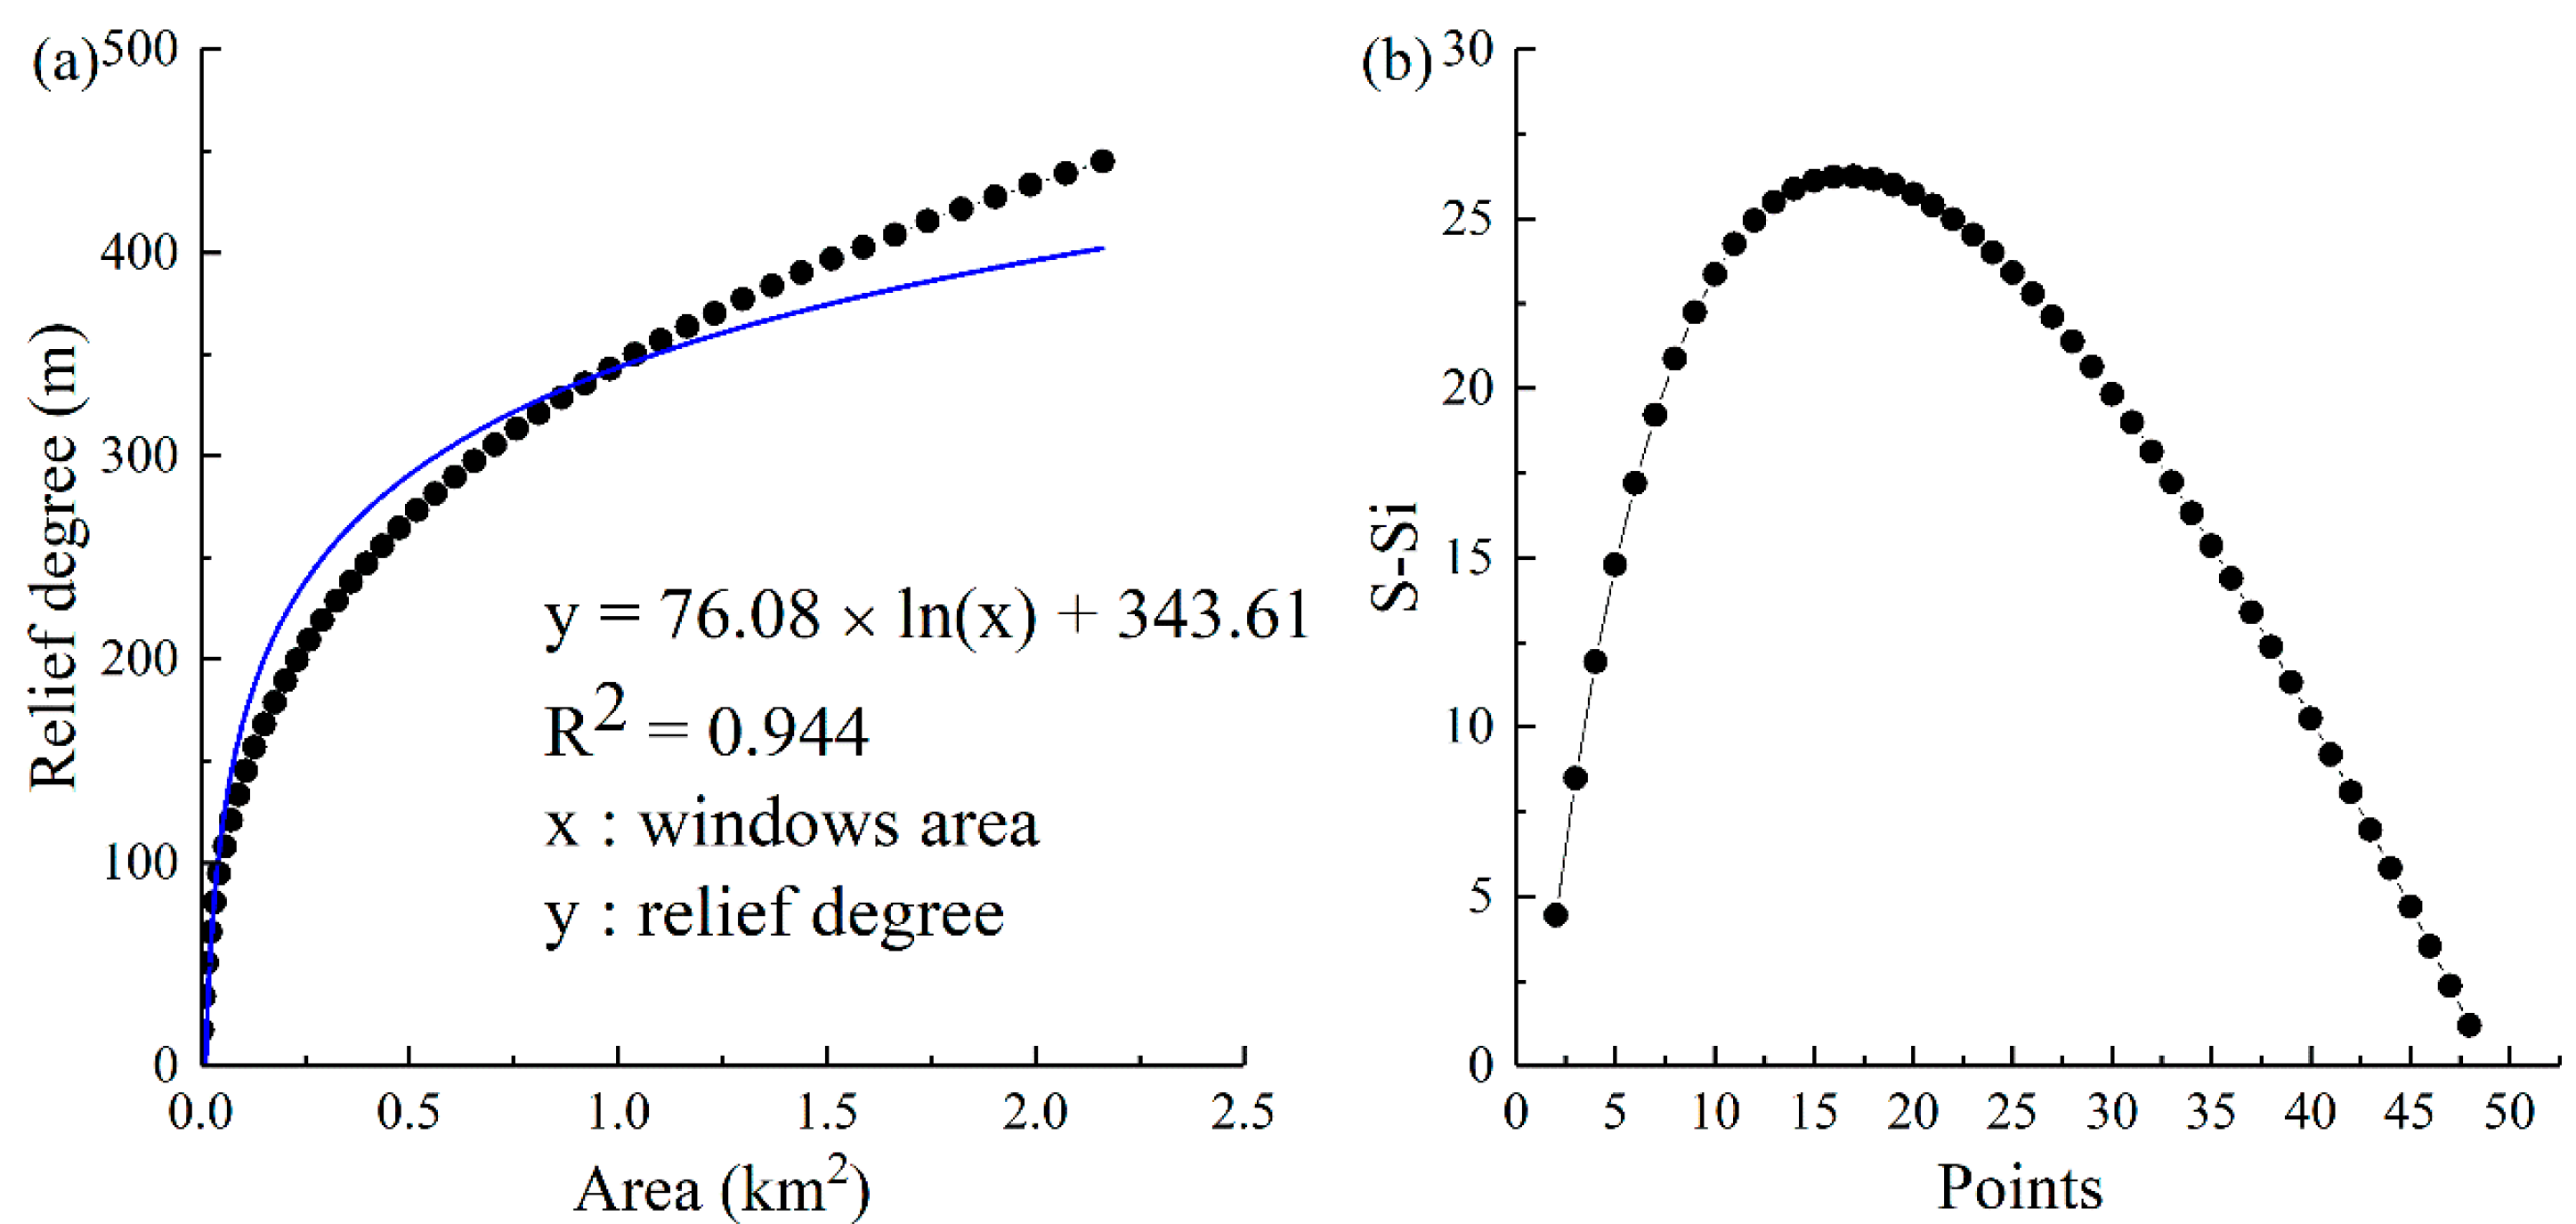
Based on the characteristics of high efficiency and accuracy of the geomorphological factor index method, we adopted the third method for our work. First, using the Three Gorges low-relief surface field investigation results of Xie et al. [14], the DEM data were classified into two levels of elevation (Table 1). Then, the mean change point analysis method (the point where the degree of relief changes from steep to gentle, or vice-versa, in the curve) was used to determine 18 × 18 points as the optimum statistics window (Figure 2). After several trials, different relief parameters for different relief terrain elevation ranges were set (Table 1) to extract the distribution of terrain relief from each elevation surface. To eliminate artifacts and terrace effects, low-relief patches <0.1 km2 were removed. Ultimately, application of this method revealed the Three Gorges region low-relief surface distribution.
Topographic evolution and river channel network changes are linked processes, with river basins being an integral part of a dynamic system, balancing the adjustment between tectonic uplift and erosion [34]. Therefore, channel morphology analysis is an effective tool for evaluating the transient state of landforms, where river profiles can reflect signals indicating the dynamic evolution of landforms, and their deformation history, and can inform calibration of erosion models [35,36,37]. In particular, channel steepness, that is, the normalized channel steepness, can predict the response of the channel to the rock uplift rate. Slope-area analysis is an approach widely used in river network erosion pattern interpretation, through the normalized steepness index, or [38]. There is a proportional relationship between riverbed slope and upstream catchment area in nature, and this can be expressed in the general form as:
where S represents the local channel gradient, A indicates the reference drainage area, and and θ stand for the steepness index and reference concavity respectively [39].
When the river system is in a steady-state, the erosion rate (K) equals the uplift rate (U), and the channel steepness is proportional to U [9], and is expressed as:
Obtaining an accurate slope calculation from a low-resolution DEM is challenging. Therefore, this study adopted the χ gradient method [35,40], using elevation instead of slope, and χ instead of catchment to calculate channel steepness. Using the algorithm developed by Schwanghart and Kuhn [41,42], χ plots were generated for the main streams and its tributaries.
The general form of the associated Equation is expressed as:
where zb indicates the position of the river outlet, which is generally assumed to be at the base level. represents an arbitrary scaling area, so χ has a length unit. The integration method is defined as follows:
where A (χ′) indicates the upstream catchment area, m and n represent empirical constants, and the ratio m/n describes the channel concavity (θ)—which is usually between 0.3 and 0.6 [43,44]. In this study, dynamic anomalies in river networks were detected by calculating the geomorphic index (χ), thereby providing a quantitative method for characterizing the impact of the instantaneous state on both river system evolution and low-relief surface landscape formation. We used the concave index as an empirical value (θ ≈ 0.45), was set to 1 km2, and the χ values for rivers on both sides of the catchment were calculated from Equations (3) and (4).
Since elevation values along longitudinal river profiles are frequently affected by large scatters (e.g., errors and human factors) in topographic data, we applied the constrained regularization smoothing (crs) algorithm based on the quantile regression method to hydrological correction and to smooth the profiles. The final χ map was drawn using ArcGIS software.
3.3. Swath Profile
Swath profiles are significant when exploring the response of a landscape to tectonic activity and climate change. Compared with the traditional topographic profile, the swath profile is a widely used tool to reduce the randomness of the profile line, and focus on its more important morphological features [45,46]. Generally, low values in swath profiles, where all lines merge, indicate low to moderate incision. Conversely, high local relief and wider swath profiles characterize the dissected landforms that are related to high uplifts or deep river incisions in mountain belts [47].
Here, swath profiles and low-relief patch distribution were plotted together to explain the changes in the elevation curve better, and show whether the surface patches were spatially continuous. In this study, the Create Fishnet and Zonal Statistic tools in ArcGIS were used to draw swath profiles S1, S2, and S3, perpendicular to the study area. A horizontal swath profile (S4) was also generated, and it was based on the functions available in the Topographic Analysis Kit [41]. The maximum, minimum, and mean elevations of the swath profiles were calculated by statistical analysis, and then plotted using Origin. Among these, the relationship between the three curves revealed essential information about the state of the landscape, while the mean elevation curve illustrated the overall topographic trend along the swath profile.
3.4. Numerical Analytical Model
LEMs are 3D numerical simulation forms, and are crucial and valuable tools when studying the coupled tectonic–geomorphic evolution of mountain belts, and the respective effects of geomorphic processes, tectonic forces, and climate [48,49,50,51,52,53]. One of the most important ideas derived from numerical simulations is the concept of a steady-state mountain belt: the rapid rise of mountains may lead to an increase in relief, until the topography and exhumation are independent of time [54,55]. The main LEMs include the CASCADE, CHILD, FastScape, and Divide and Capture (DAC) models [33,50,56,57]. In our work, the DAC numerical analysis model was used to simulate landscape evolution, and included the physical processes associated with drainage divide migration and river capture [9].
In this study, a 120 × 60 km rectangular domain was defined, which had its four edges at a constant elevation. It was assumed that the slope index (n) was 1, the area index (m) was 0.45, the uplift rate (U) was 6 × 10⁻⁴ m·yr−1, and the rock erodibility (K) was 4.0 × 1.0−5 (m·yr)−0.5. Steady-state terrain data were generated using the initial random elevation field, assuming that the initial structural uplift rate was uniform in space, without horizontal motion, and that the precipitation levels and rock types were stable, thus forming the point for simulation initialization. After forming a symmetrical mountain range with a maximum elevation of 1500 m, vertical uplift was imposed to represent mountain building. The simulation started at 0 Ma and ended at 32 Ma, with 10,000 year intervals.
4. Results
4.1. Distribution of Upland Low-Relief Surfaces
Identifying the distribution of upland low-relief surfaces was an important foundation for the study of the Three Gorges region long-term geomorphic evolution. Based on previous research [14,15], this study identified two levels of low-relief surface landforms at different mountain heights, which we referred to as the higher and lower elevation surfaces (Figure 3).
This work found that the higher elevation surfaces (1700–2000 m), covering an area of 1589 km2, were mainly distributed on the high mountain tops in the drainage divide between the Yangtze and Qingjiang rivers, spread along the direction of the major fault lines. While only present in scattered patches on the north bank of the Yangtze River, it was found distributed over a continuous and large area of the south bank, in a distribution related to lithology, particularly the widespread distribution of carbonate rock on the Yangtze River south bank. Different rocks have different anti-erosion capabilities, and so, once a low-relief surface formed on limestone, it could be preserved for a long time, while the sandy shales on the north bank of the Yangtze River have always been more vulnerable to erosion and destruction. The south bank is also the boundary between the Yangtze and Qingjiang rivers drainages, and the mobility of this divide has also played a positive role in promoting low-relief surface formation.
In some instances, lithological effects change the mobility of the drainage divide [58]. When the widespread existence of carbonate in the south bank of the Yangtze River, which, being a single block, had reduced lithological change on both sides of the divide, was considered, the impact of lithology difference on cross-divide movement in the Three Gorges area did not seem obvious. The landform of the higher elevation surface was found to be a combination of wide shallow depressions and low hills and was found to be in a steep transition with a lower elevation surface.
The lower elevation surface (1200–1500 m), covering 5296 km2, was found to be distributed mainly around the low-relief surfaces of the higher elevation areas, with a wider distribution range. It was most developed in the west of the gorge area, with a greater presence on the south bank than on the north bank. The geomorphology at this level was mainly represented by a karst platform in the limestone basin, and the low-relief surfaces near the Yangtze River usually appeared as a platform, in a phenomenon that mainly reflected the extensive karst development in the area.
4.2. Chi (χ) Map Analysis
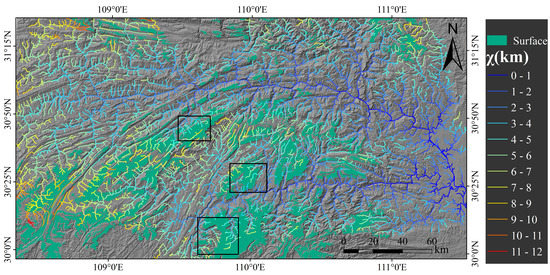
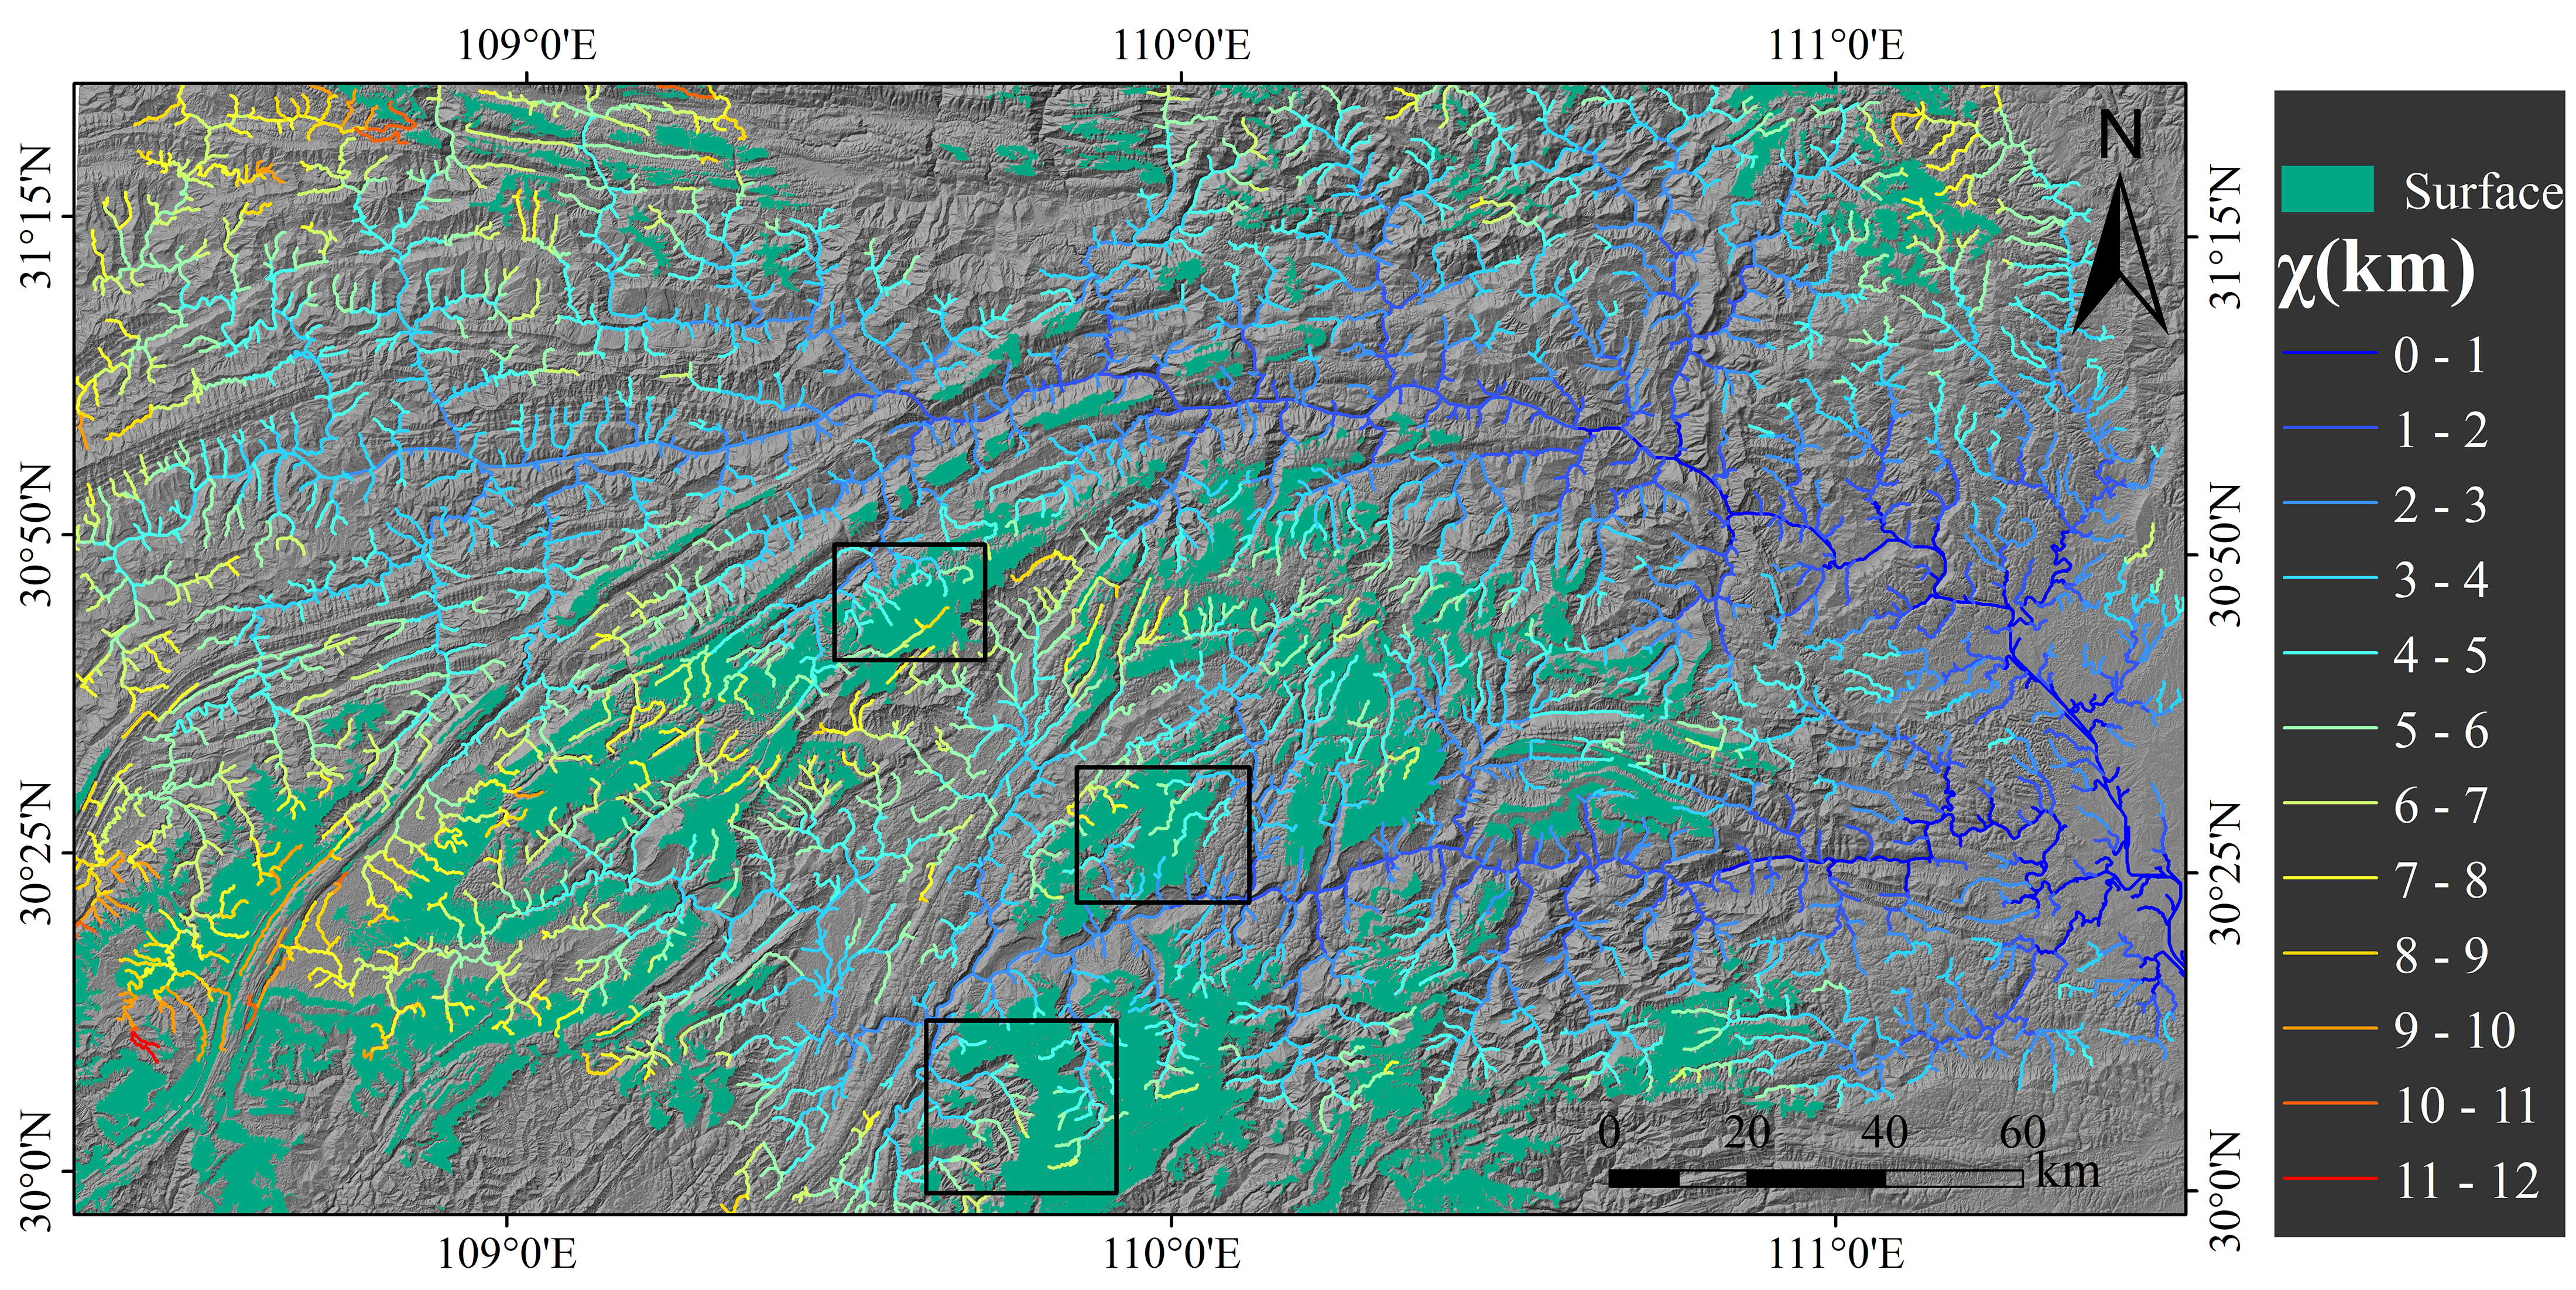
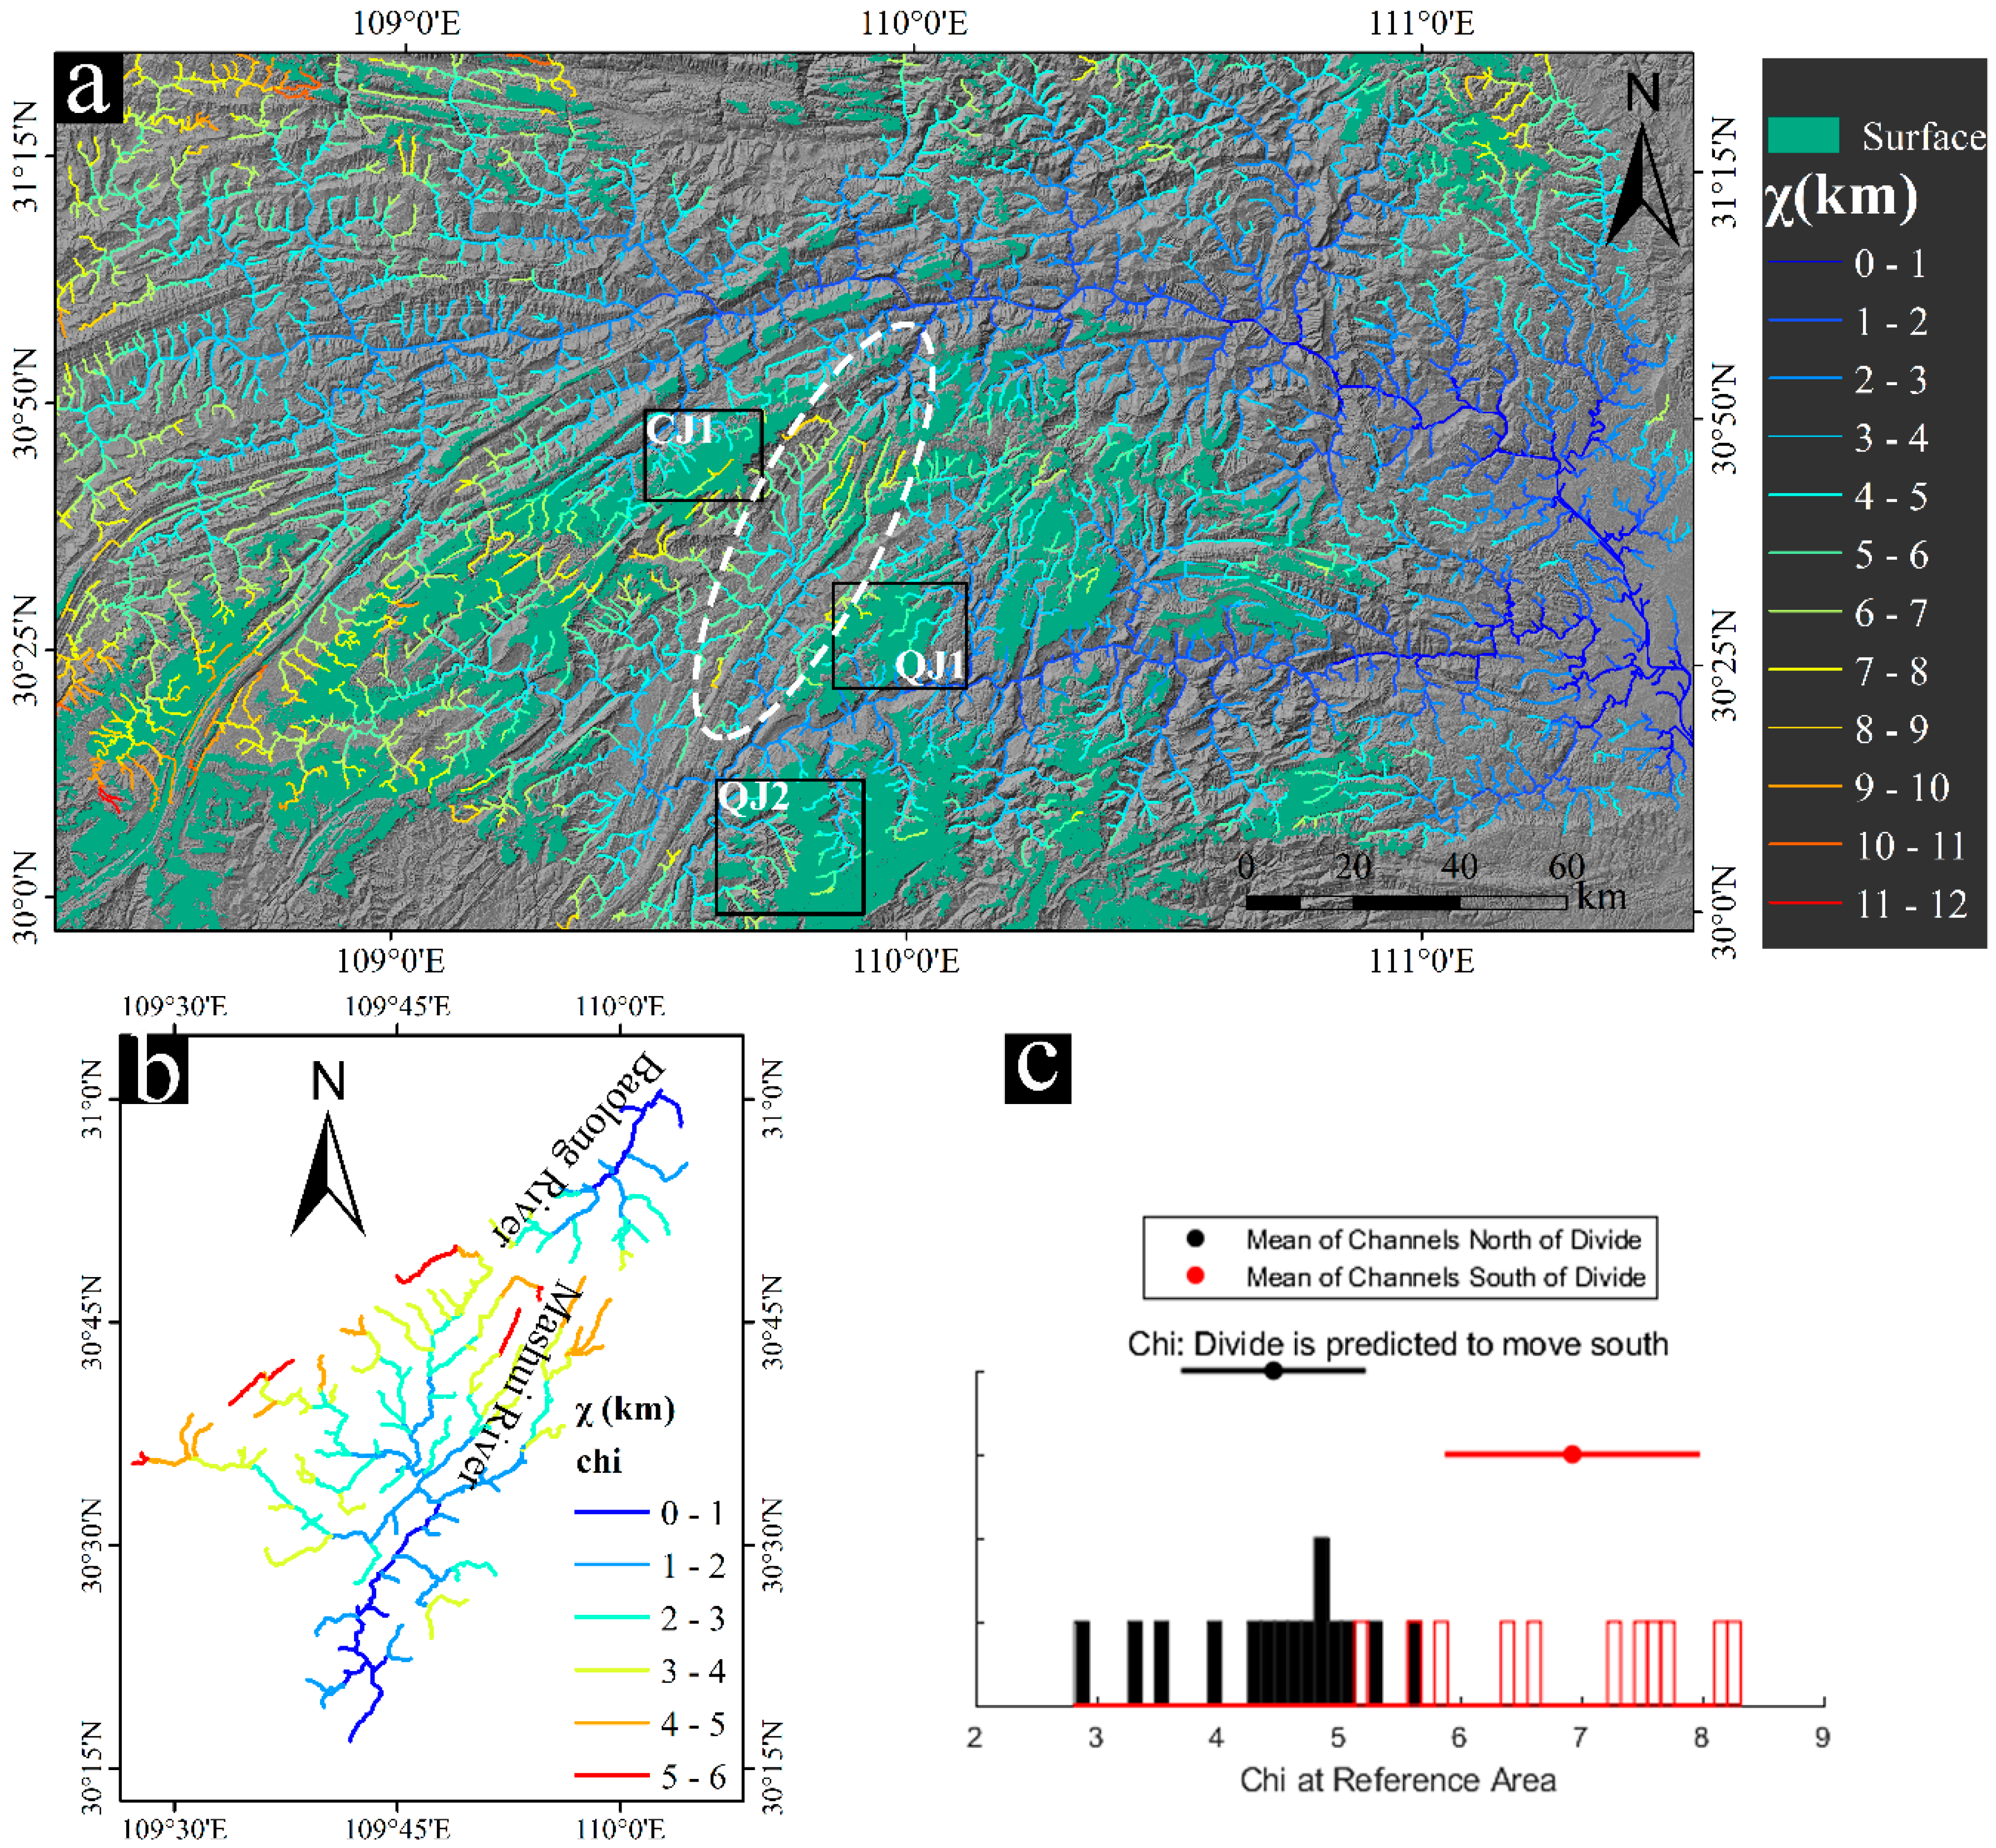
In this study, χ maps (Figure 4) were generated to reflect the horizontal dynamic changes of the river network in the Three Gorges area. The results of the χ mapping showed systematic differences in river geometry, with high χ values focused in two areas: (1) the watershed between the Yangtze River and Qingjiang River, and (2) the rivers in the W of the study area (Figure 4a). This feature suggested that these two parts of the overall basin had a relatively low erosion rate, and that the rivers in these areas had not reached geometric equilibrium. This issue deserves attention with respect to the Three Gorges region, as the transient state of landform evolution has often been the local cause of landslides, mudslides, and other regional disasters [59].
The χ values showed a pattern of clear differences on the divide between the tributaries of the Yangtze and Qingjiang rivers, indicating that this divide will move south to an equilibrium state through stream capture. Therefore, the χ-anomalies in this plot may have been reflecting either migration of the present-day divide, or the possibility of future divide movability in this region, due to recent river captures. The χ values were seen to drop off significantly on the E of the Three Gorges region, where drainage divides appeared stationary. There was no distinct contrast in χ values across the drainage divide at any scale that related to a recently captured area, reflecting its near equilibrium state.
4.3. Topographic Analysis
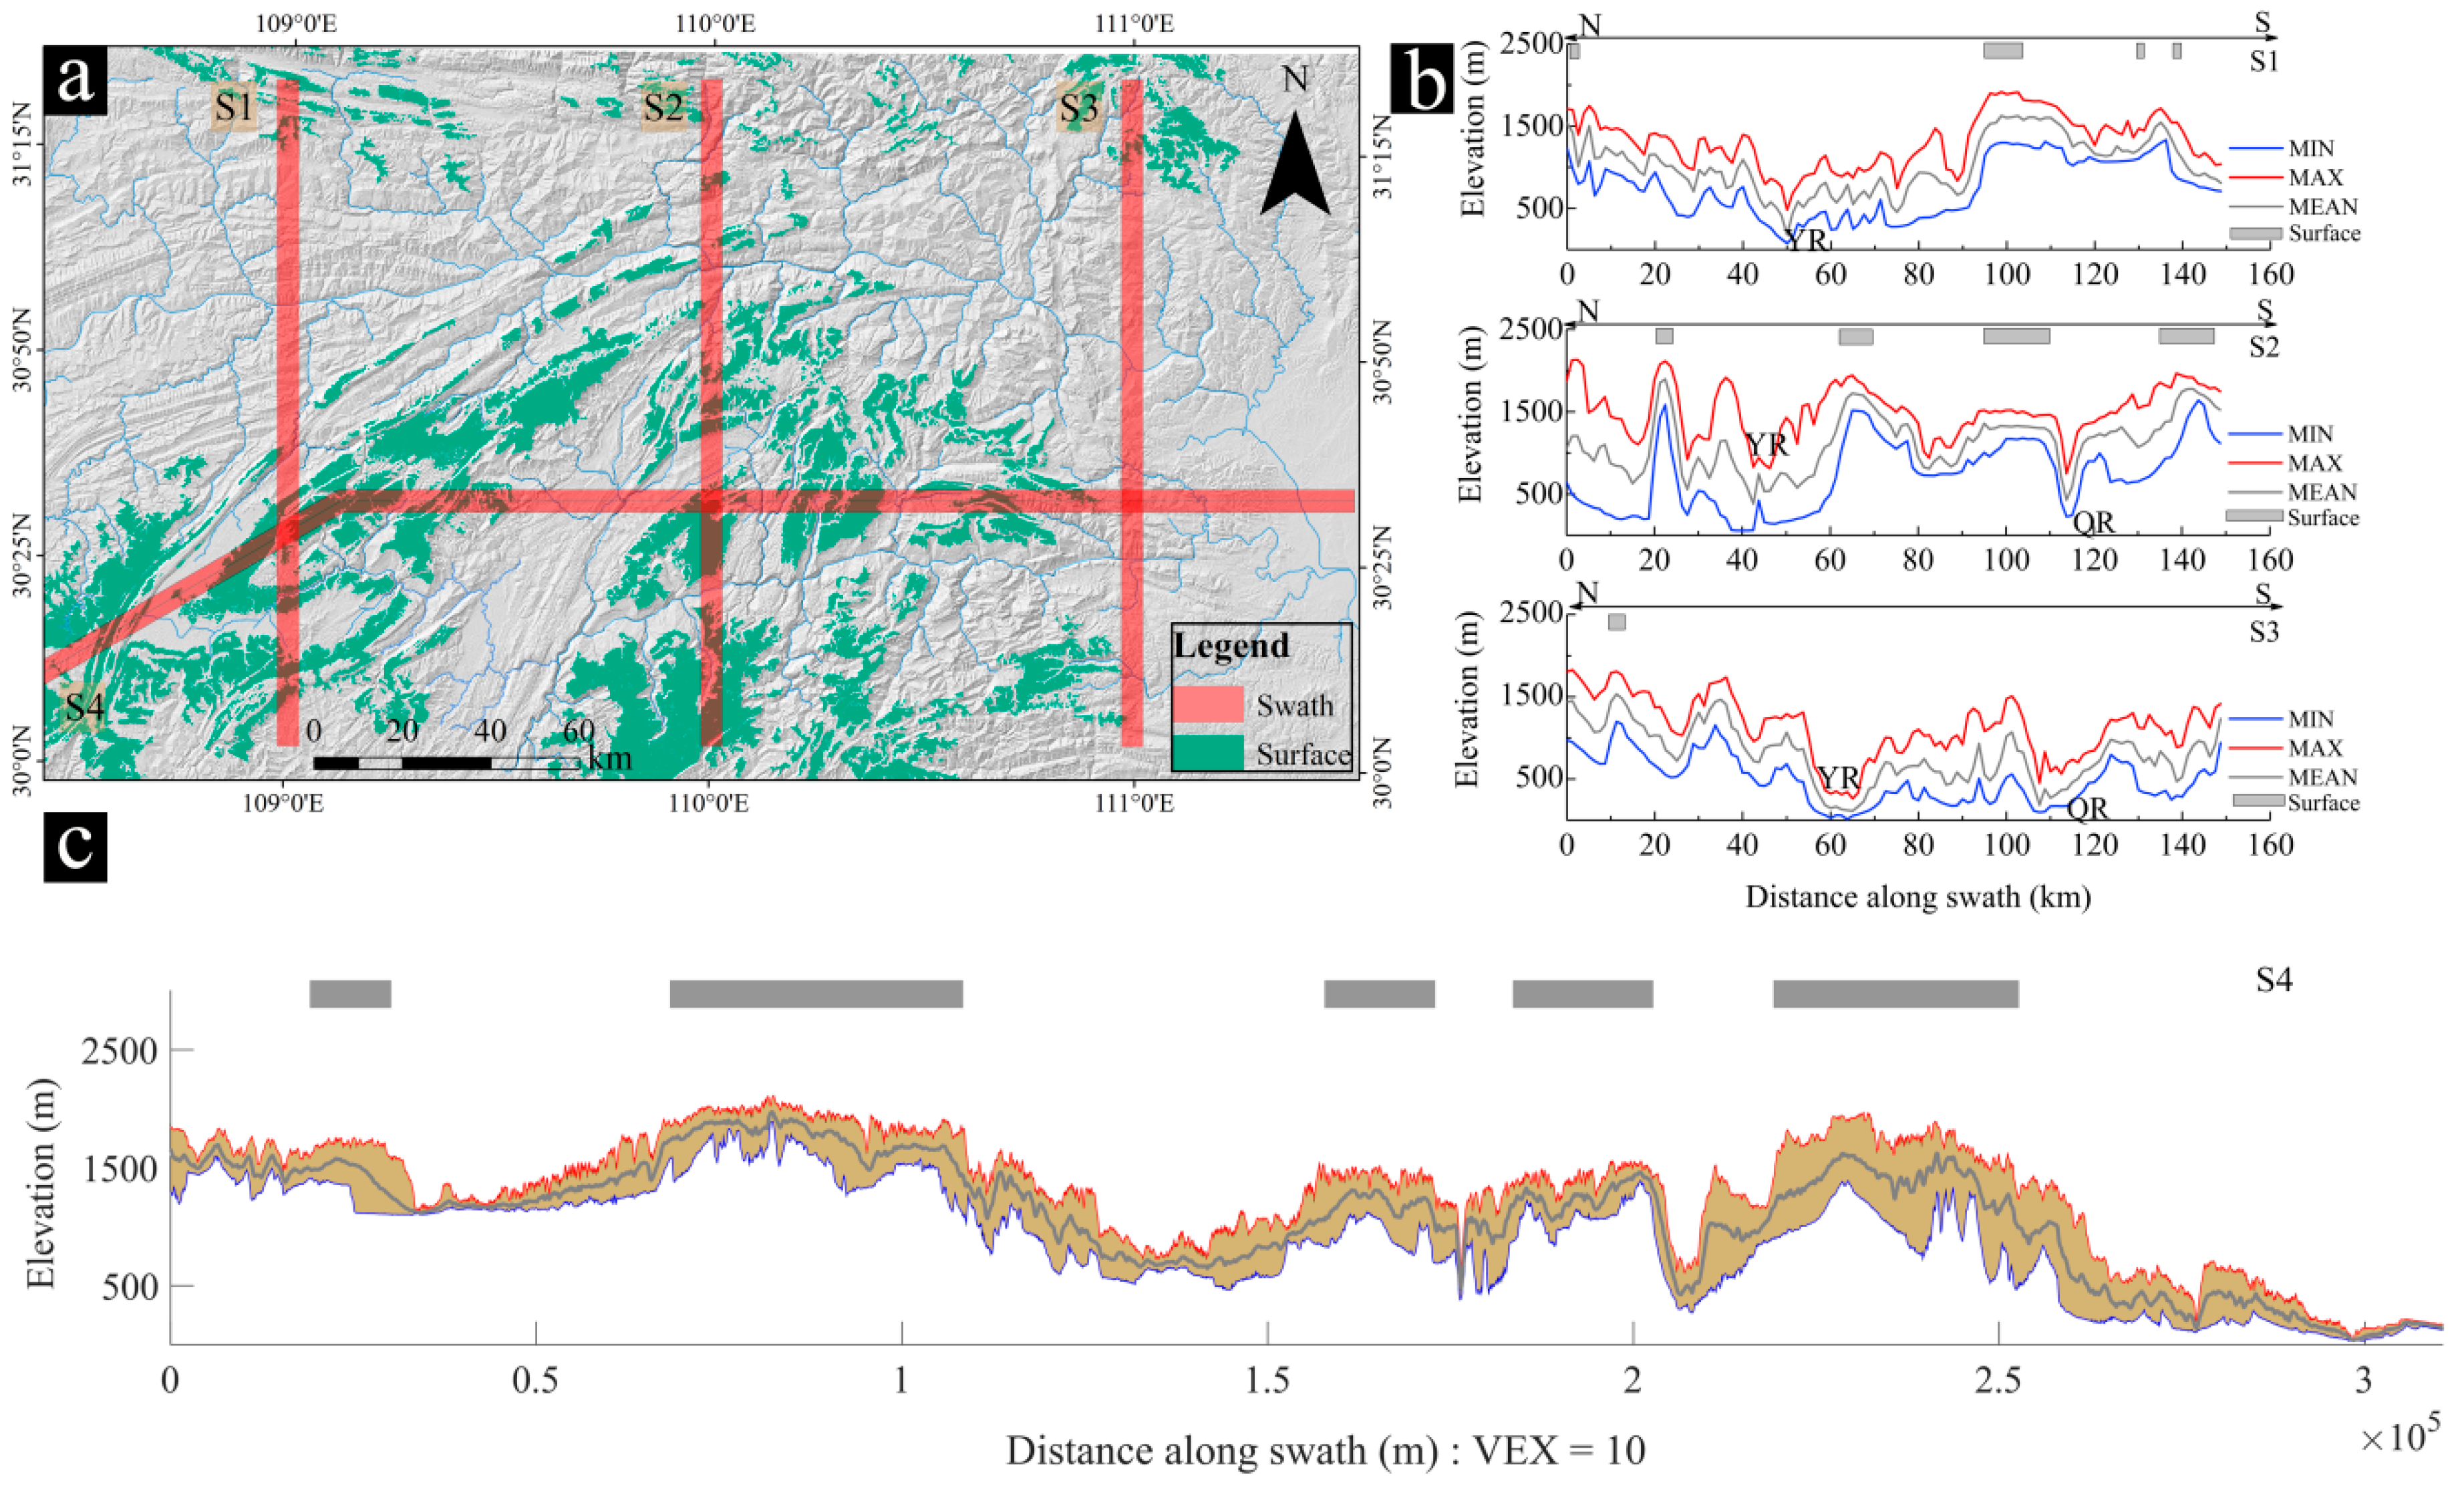
In this study, the swath profiles (see profile locations in Figure 5a) were considered to describe topographic trends and local relief changes quantitatively. Topographic elevations showed no clear increasing or decreasing trends in the swath profiles, in either the vertical or horizontal direction (Figure 5b,c). The topography changed significantly along Sections S1 and S3, and the low-relief surfaces were scattered. S2 showed that the highest altitude and high-relief landforms appeared in the Shennongjia region, which is in the north of the Yangtze River.
We could see that a strong link existed between the low-relief surfaces and local relief. The lowest local relief values were found mainly on the highlands of the Yangtze and Qingjiang drainage divide, which roughly matched the distribution range for the upland low-relief surfaces. The relationship between the spatial distribution of low-relief patches and the swath profiles showed that low-relief surfaces were widely distributed at altitudes ranging from 1300–2000 m.
4.4. χ-Transformed Profiles (χ-Plots)
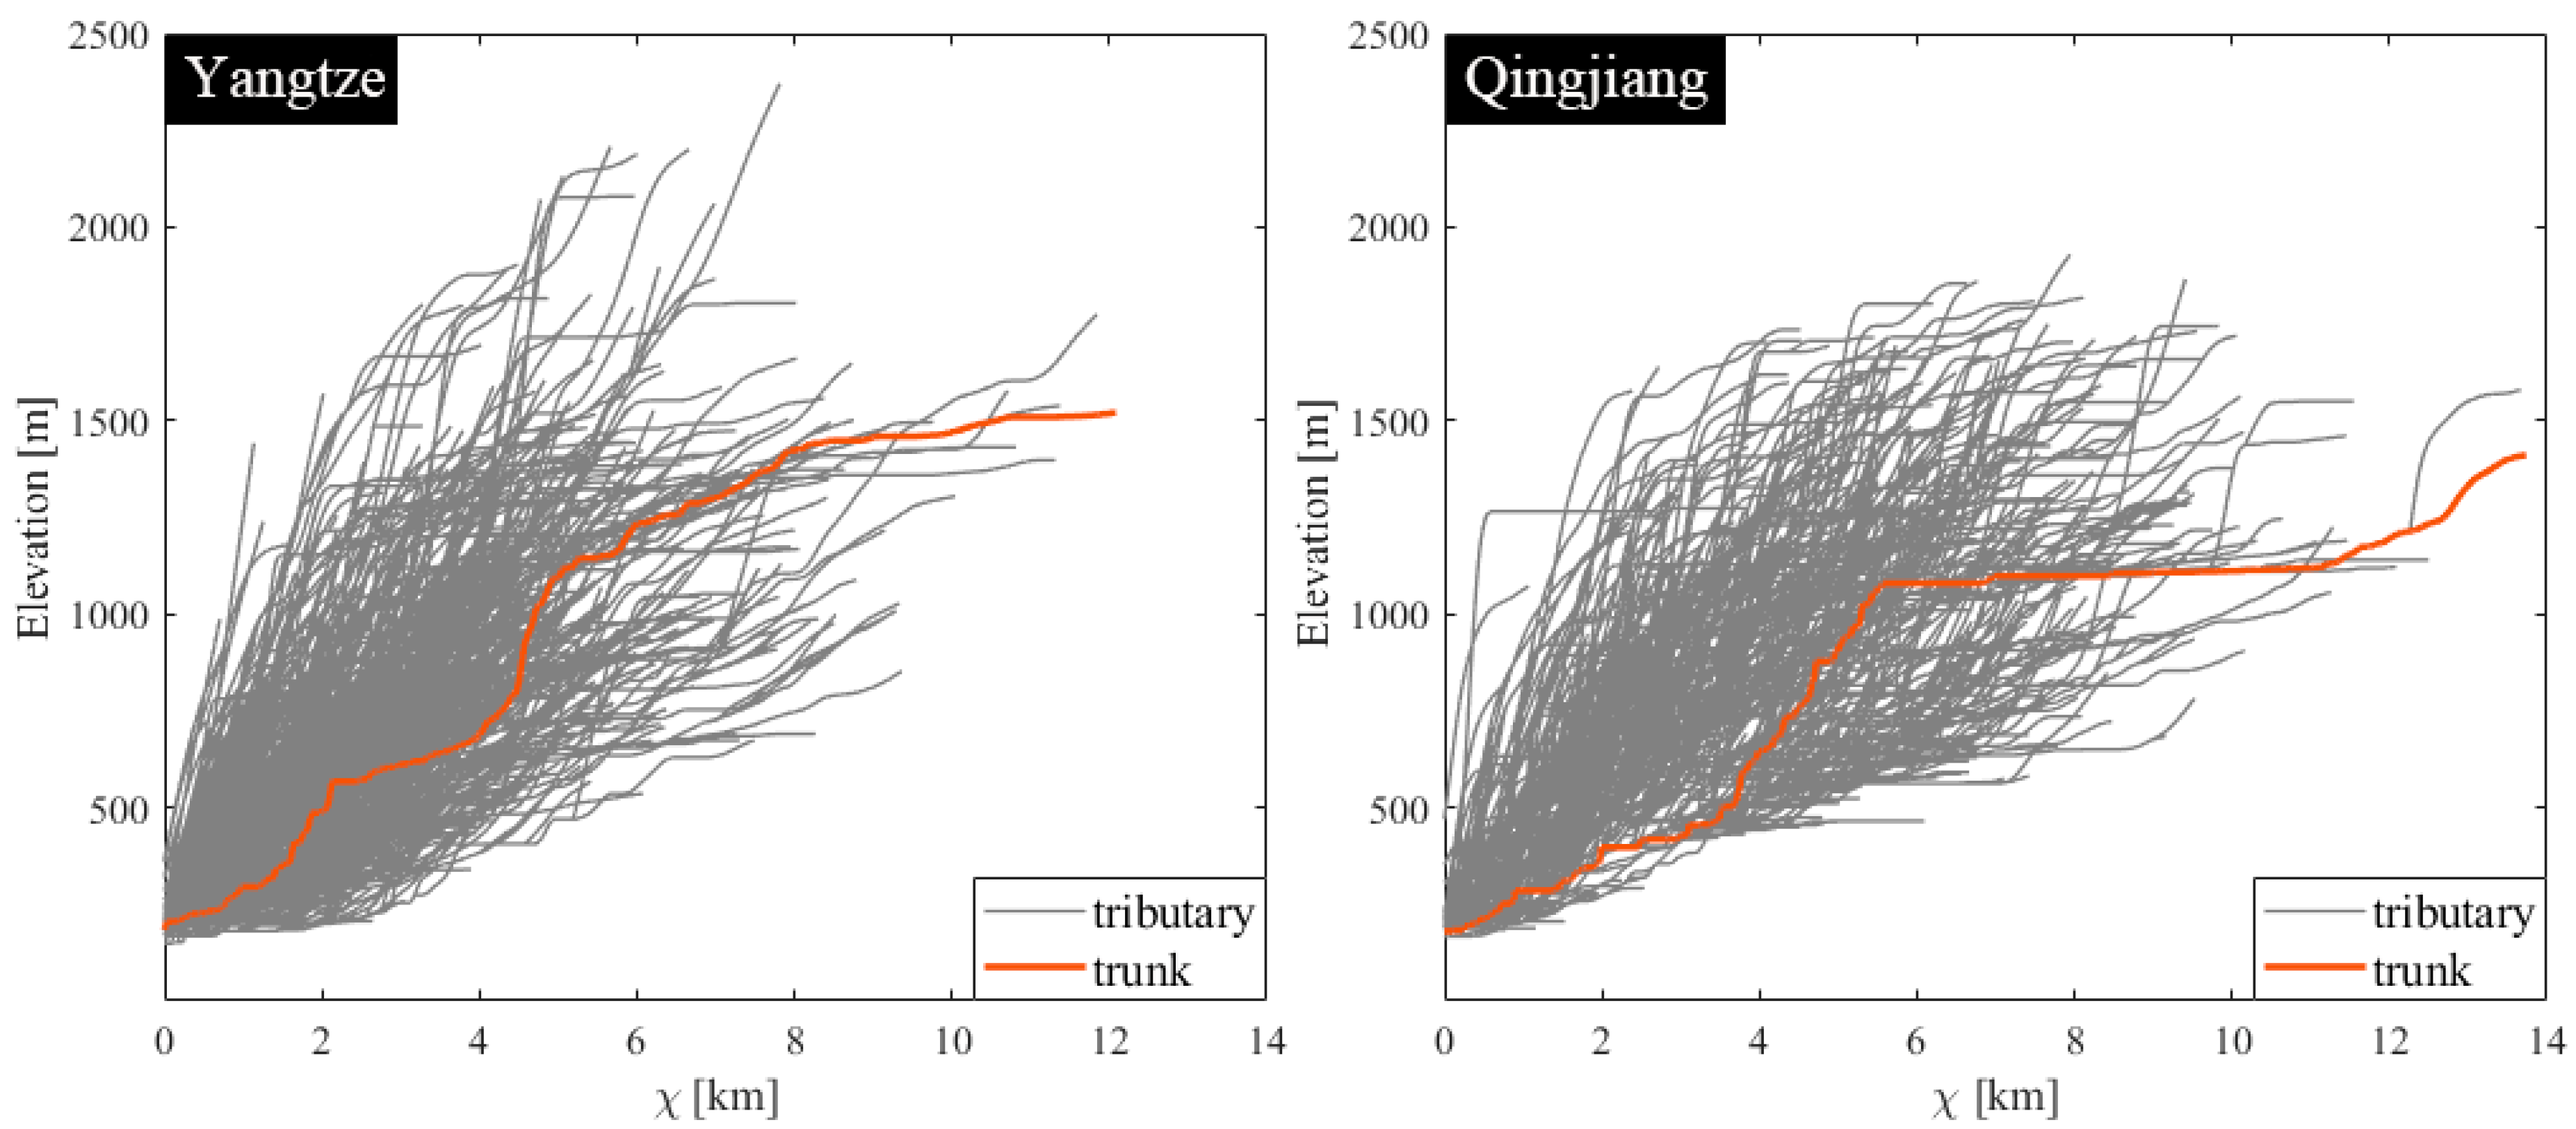
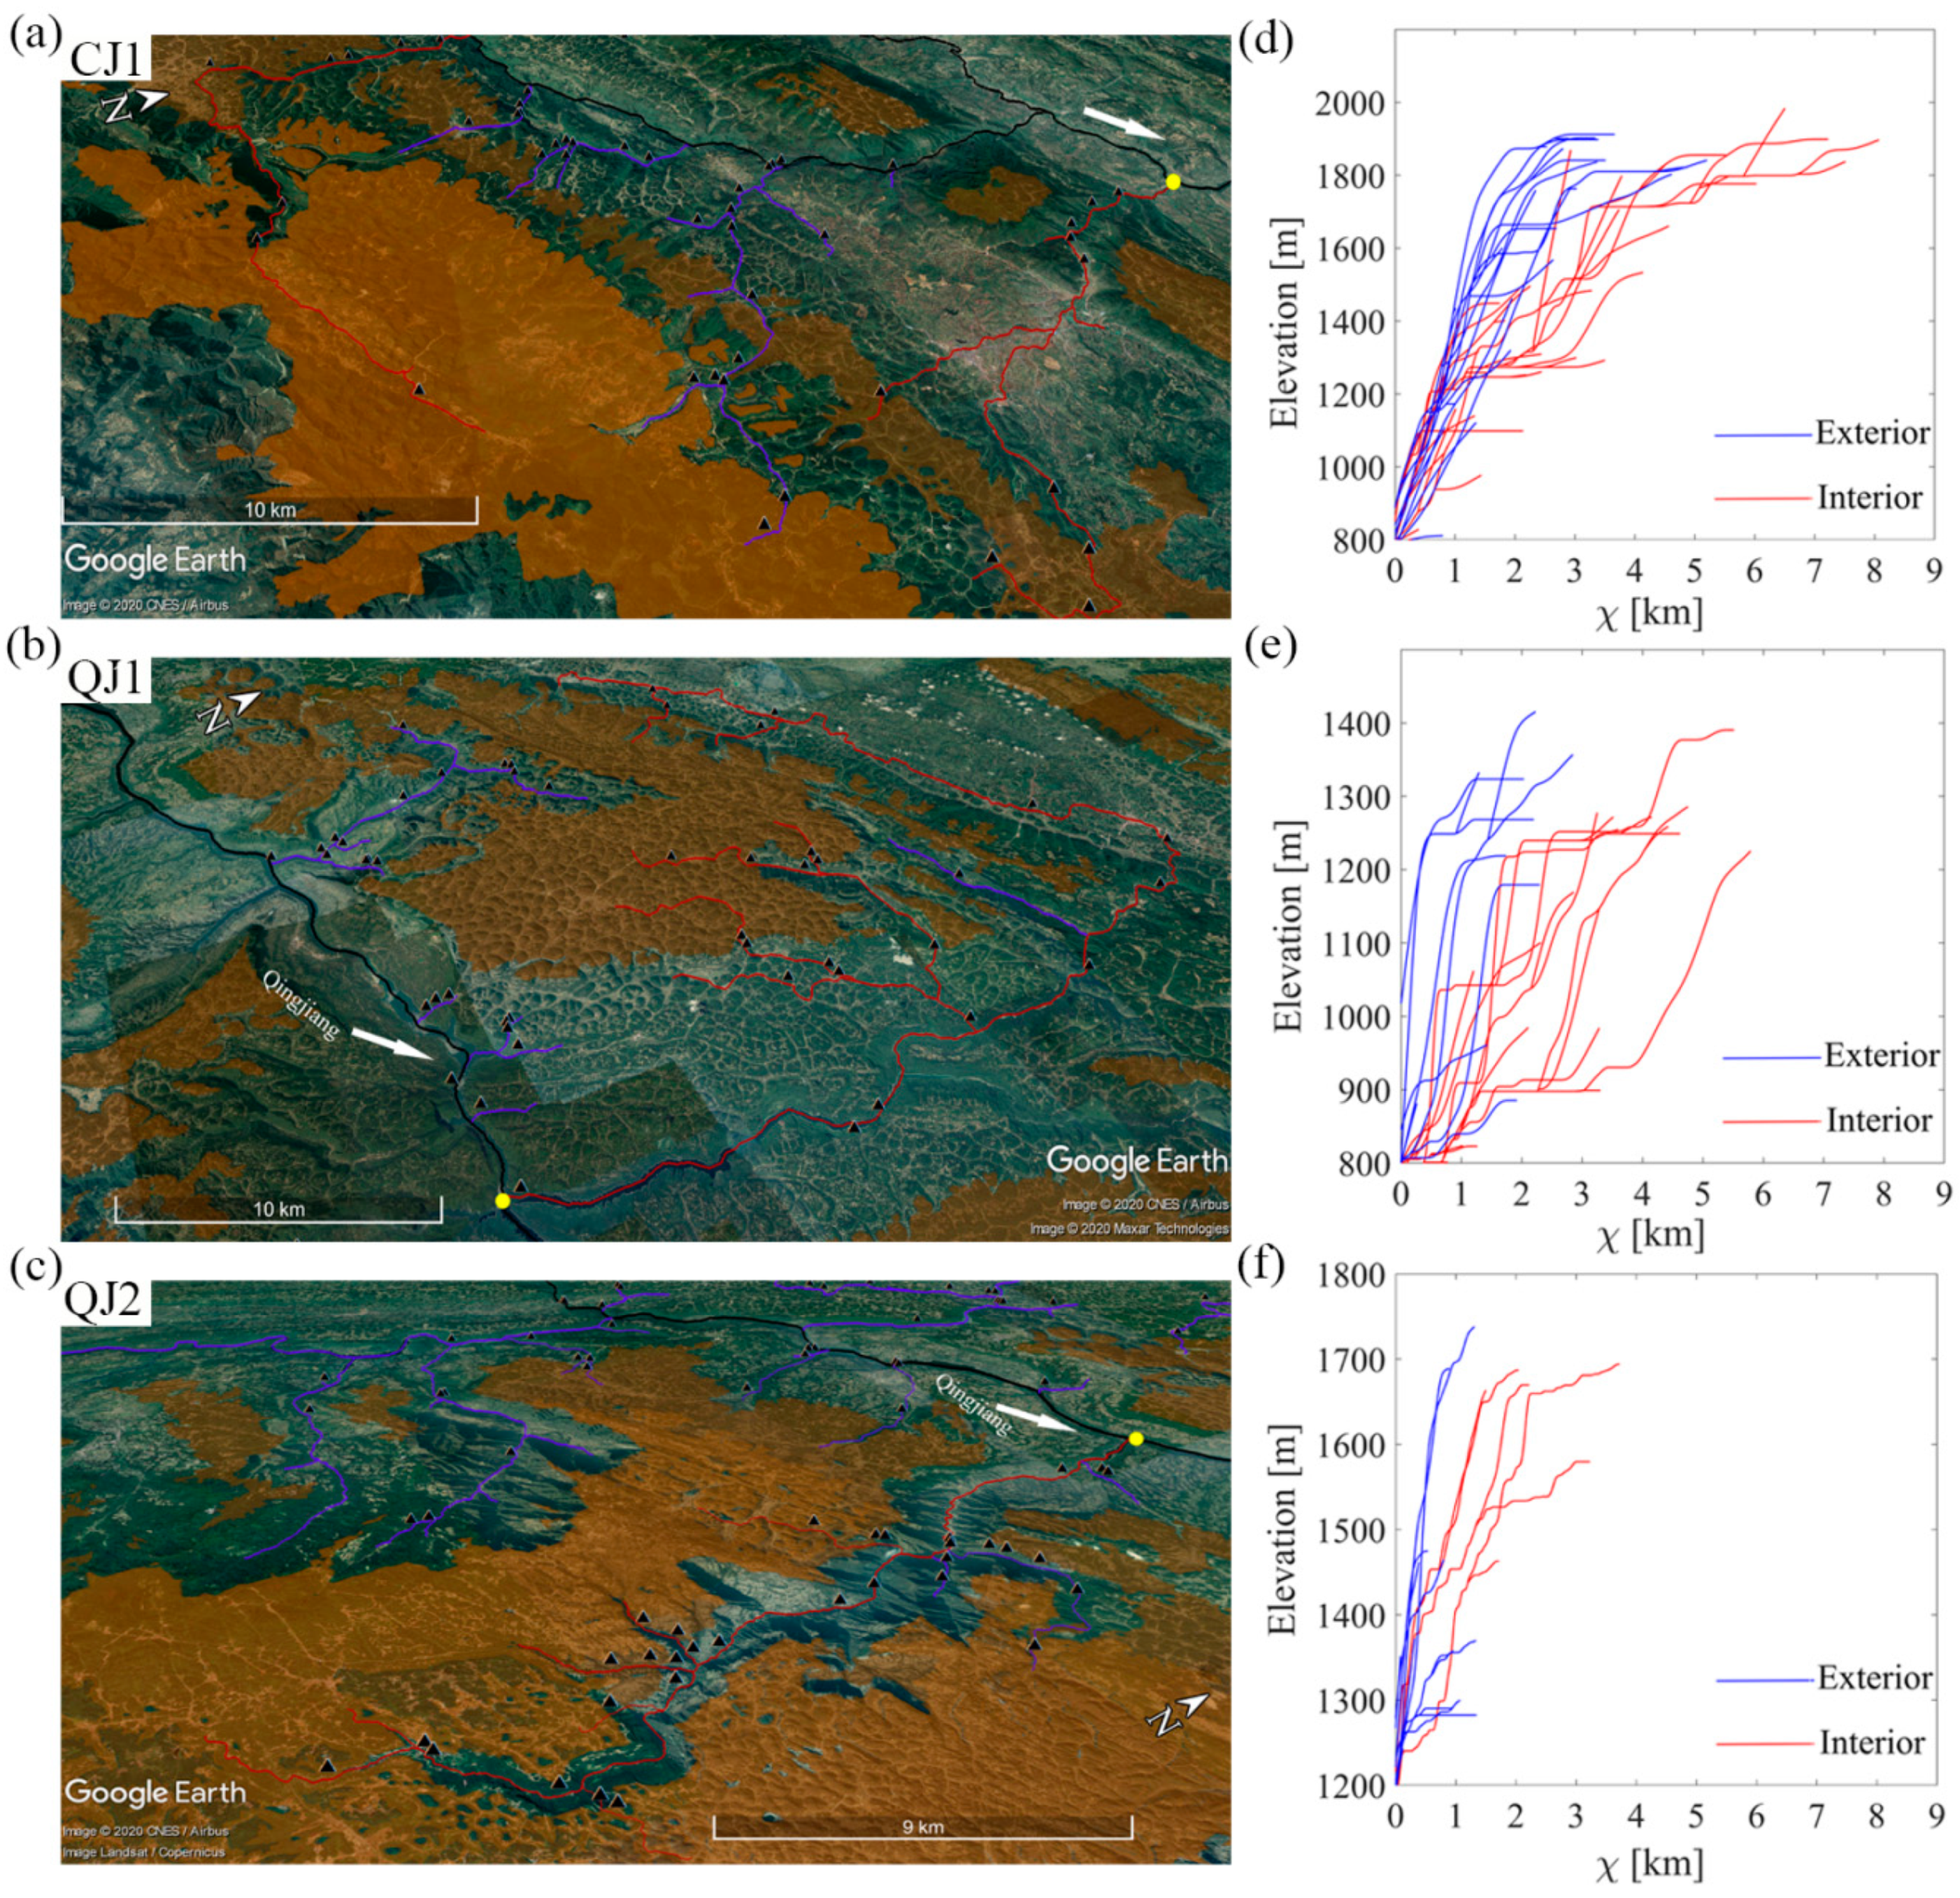
To test whether low-relief surfaces had a common uplift history, we generated χ-plots. In the study area, the knickpoints for most rivers were >1300 m, which was close to the distribution range of low-relief surface landscapes in the study area (Figure 6). For individual low-relief surfaces, three low-relief patches (CJ1, QJ1, and QJ2) were selected to analyze the differences in the χ-plots between their internal and external tributaries (Figure 7a–c). Internal tributaries are rivers with longer streams and larger drainage areas and are mainly distributed in low-relief surface landscapes. External tributaries are mainly located outside the region of low-relief surfaces and are rivers with short drainage systems and small catchments. It was showed that interior streams (victims) of low-relief surfaces have anomalously high χ-values and low erosion rates, whereas exterior streams (aggressors) have the low χ-values and high erosion rates (Figure 7d–f).
4.5. Numerical Analytical Model
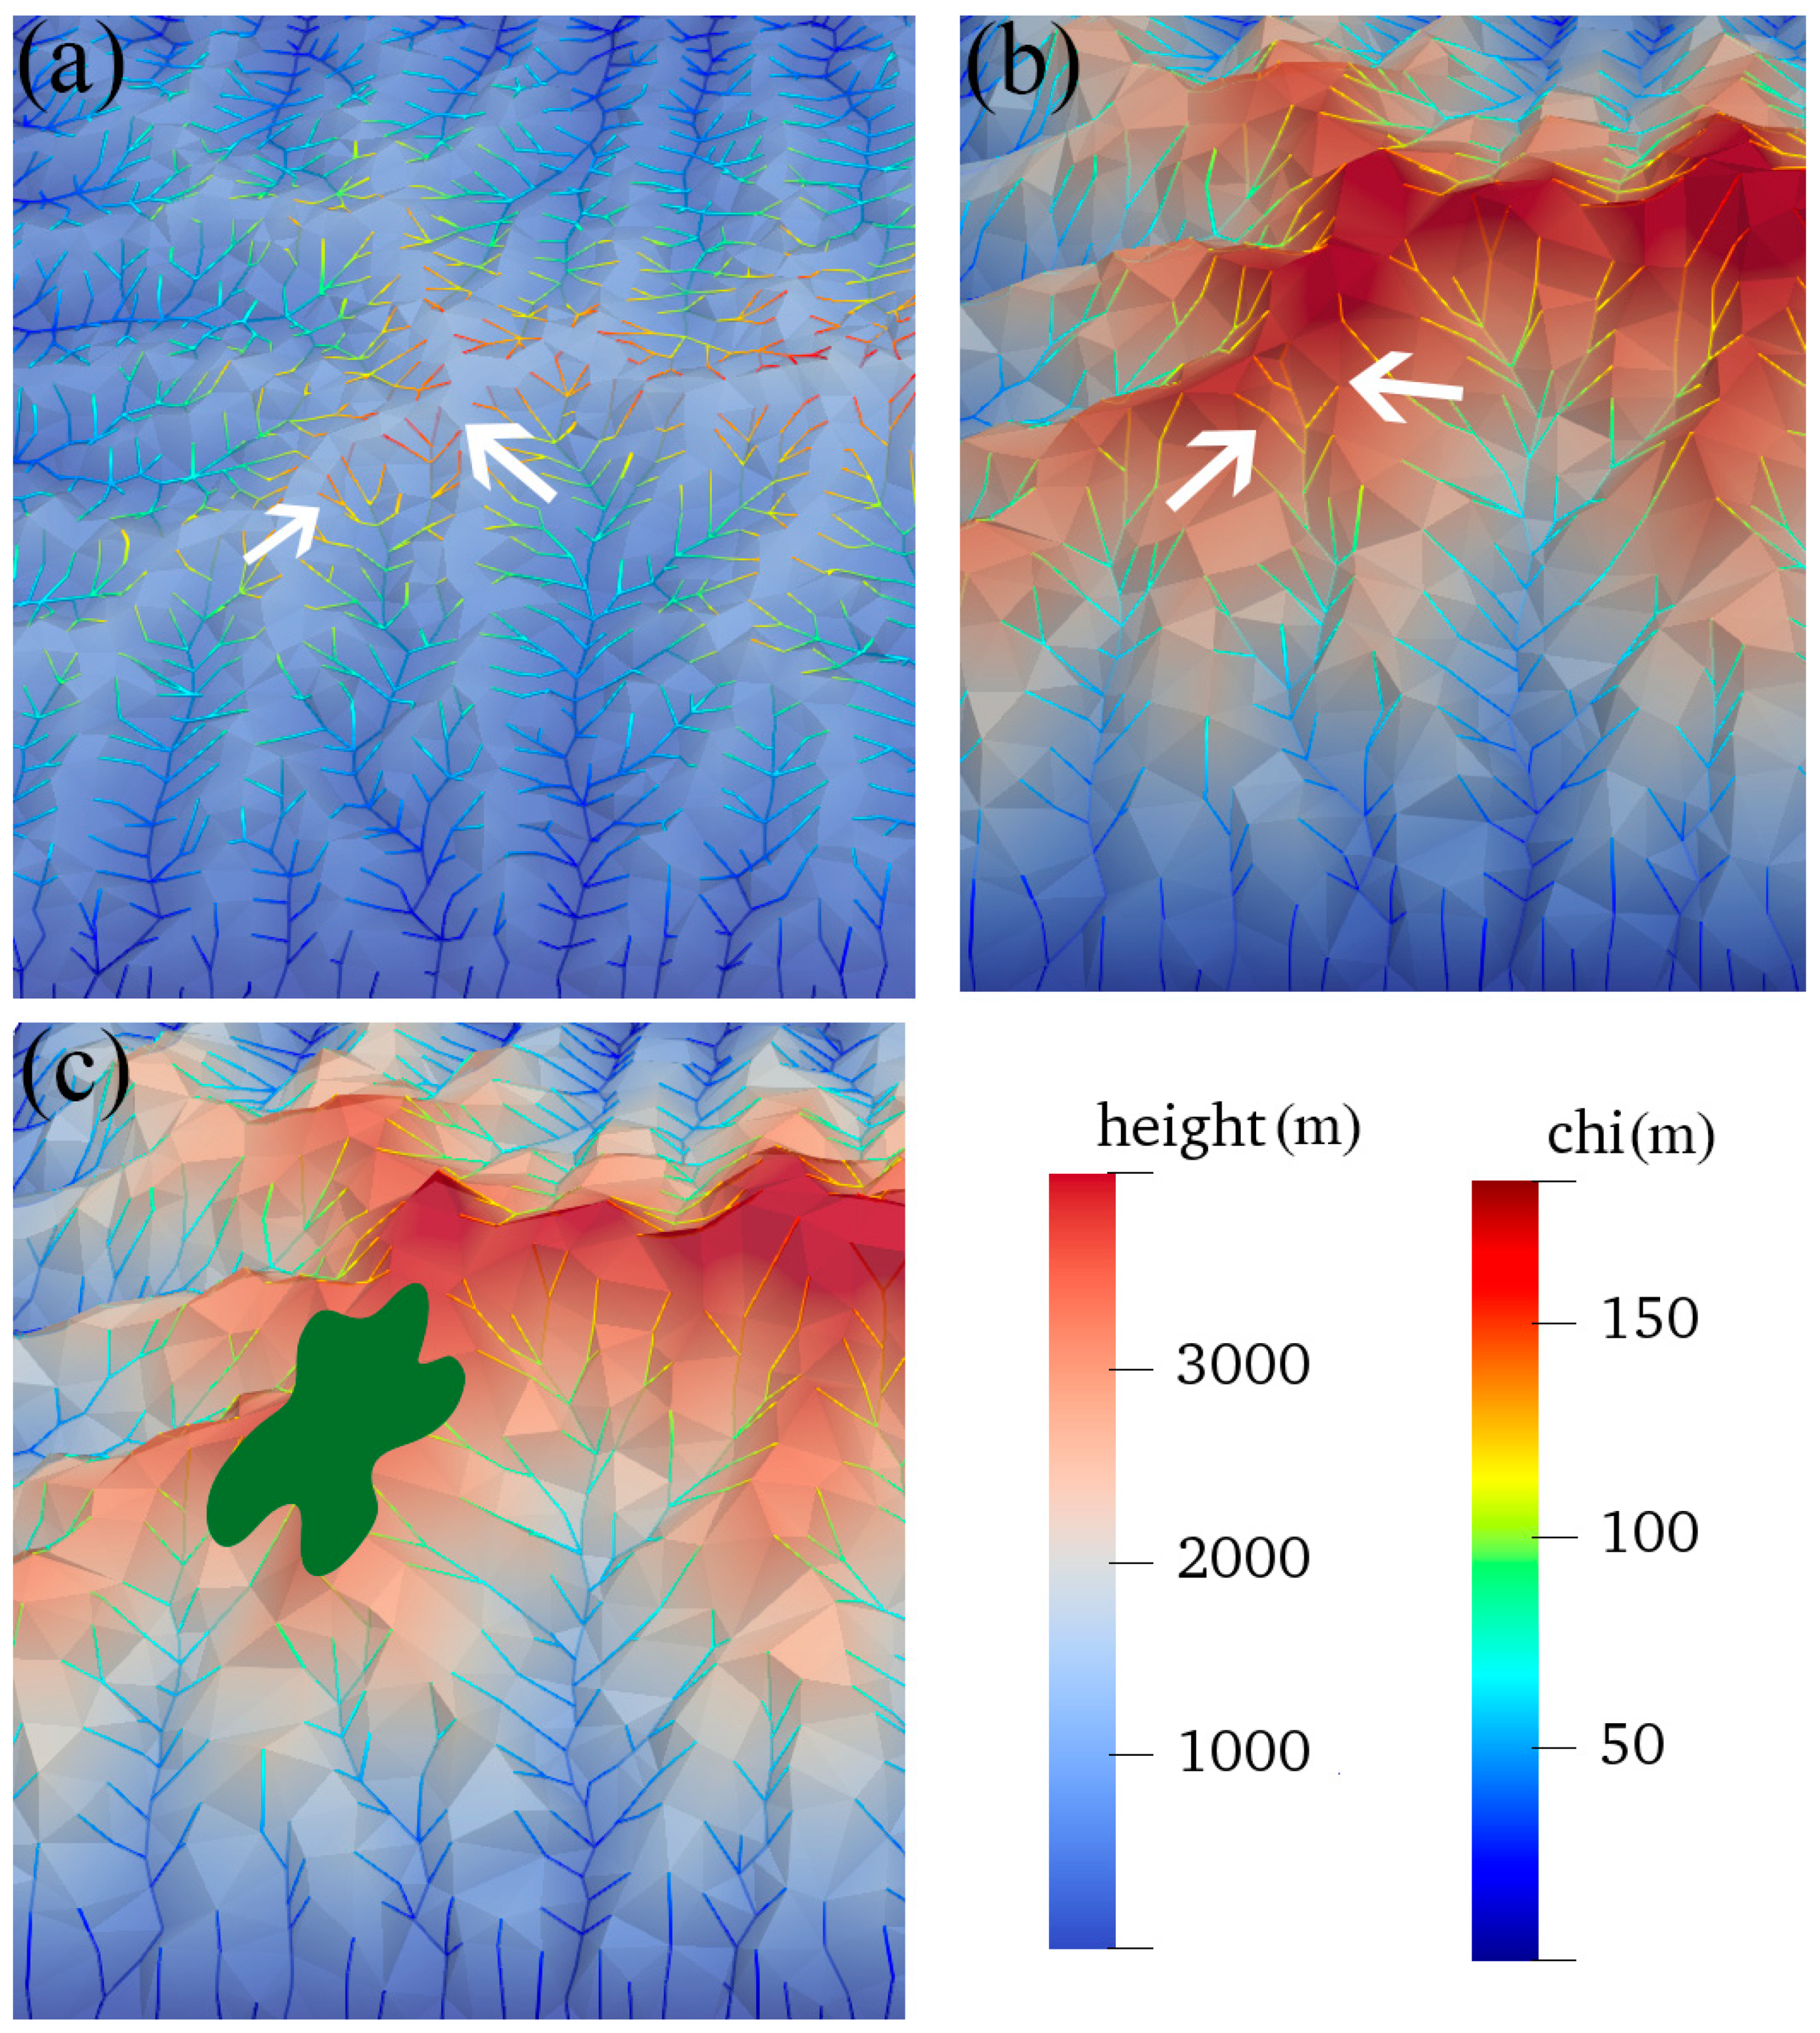
To investigate the roles of river capture on the formation of low-relief surfaces, we conducted DAC numerical modeling (Figure 8). The model showed that the mountainous region was affected by tectonic uplift, the regional drainage network was disturbed, and the river basin was reorganized, the upstream part of the central stream was gradually captured by the surrounding pirate rivers (Figure 8b). This led to a reduced catchment area for the central river, which weakened its ability to erode the bedrock, to the extent that the continuous tectonic uplift was no longer balanced by fluvial erosion. The hillsides around the captured river were continuously eroded by external rivers, reducing local relief, and leading to a net surface uplift, that is erosion [E] < rock uplift [U]. Therefore, the tributaries of the beheaded river near the capture point experienced a period of rise, relative to the base level, eventually forming a low-relief surface located in the rugged peaks (Figure 8c).
5. Discussion
5.1. Drainage Evolution and River Basin Reorganization
The χ differences across drainage divides were evidence that the river network geometric structure was in a state of disequilibrium, and of the river capture and the dynamic reorganization processes of the water system [34,60,61]. When the rock uplift rate, lithology, and climate conditions does not change significantly on either side of a divide, drainage divide moves away from channels with low χ toward channels with higher χ [34].
The higher χ value on the southern side of the study area suggested that Qingjiang streams were captured by the Yangtze River, and that, in its search for stable basin geometry, the drainage divide migrated to the Qingjiang Basin. As evidence supporting this, the χ value at the source of the Mashui River, a tributary of the Qingjiang River, was very different to that of the Baolong River, a tributary of the Yangtze River (Figure 4b). The Baolong value was lower, and the Mashui value higher, indicating that the Baolong River of the Yangtze system captured the Ancient Mashui River of the Qingjiang system. The position of the ancient divide between the Yangtze and Qingjiang rivers was further north then, and as the Yangtze Basin constantly captured the Qingjiang Basin to the south, this caused the drainage divide to move southward (Figure 4c). This phenomenon has also been evident in some nearby river systems, suggesting that the drainage systems in the Three Gorges region have not yet achieved a particularly stable configuration.
The rivers with high χ values in Figure 4a are close to the low-relief surface distribution range. Our analysis showed that this regular spatial distribution existed in the divide between the Yangtze and Qingjiang rivers, as well as along the south bank of the Qingjiang River. High χ values were found to be located inside the low-relief surface landform, while low χ values were mainly located elsewhere, outside the low-relief surface areas, indicating that low-relief surface landscape formation in the Three Gorges region was related to river capture and the subsequent dynamic reorganization of the river basin.
5.2. Was It Quasi-Plain Uplift or River Piracy Which Generated the Low-Relief Surfaces?
Detailed topographic analysis revealed that the Three Gorges area fulfilled the expectations for in situ generated low-relief upland surfaces formed in response to drainage area-loss, rather than being “relict” landscapes formed by quasi-plain uplift. Whipple et al. [8] noted that the diagnostic criteria for low-relief surface landscapes were that the remnants of the surface were all preserved at a similar altitude, they were approximately coplanar, and that they decreased in altitude systematically across the study area [7,28]. This possibility seems less likely in the Three Gorges area, however, as the distribution elevation of the low-relief surface patches did not show a systematic and obvious downward trend in the horizontal direction, as can be seen in Figure 5c.
The study found that the Three Gorges area low-relief surfaces were mostly located in the divide between the Yangtze and Qingjiang rivers, and that the catchments of related tributaries formed the low-relief surface patch boundaries, as shown in Figure 4 and Figure 5b. The low-relief surfaces were found to be distributed between 1300 and 2000 m; they occurred at various altitudes within this range, their distribution appeared to be random and scattered, rather than continuous, and they did not appear to have been formed as a quasi-plain, which rose uniformly and simultaneously [17].
Two samples of the ancient fluvial gravel layer located between the Mashui and Baolong rivers were aged, using electron spin resonance dating, and were found to have been formed at 728 ± 72 ka and 789 ± 78 ka, respectively [62]. Comparison with the Three Gorges terrace substrates indicated that this gravel layer formed in the same period as the fifth terrace of the Three Gorges, in the early Middle Pleistocene [15]. However, it is noted that the elevation difference between the gravel layer and the fifth terrace was >1000 m, which indicated that there had not been a multilevel planation surface in the Three Gorges area. Moreover, the Three Gorges area had been a regional watershed since the Mesozoic, and had not been completely flattened into a “quasi-plain” [17]. All of which supported the concept that the upland low-relief surface landscapes in the Three Gorges region were not preserved patches of a landscape formerly at equilibrium.
Abrupt transitions on river profiles and log-transformed slope-area plots are termed slope-break knickpoints [63]. If the low-relief surface was a relict formed by river incision into a quasi-plain formed when regional uplift increased and the river network geometry was fixed, the trunk and tributary profiles of all rivers would show slope-break knickpoint changes at similar altitudes [64]. However, according to Figure 6, the χ-plots of all the major regional catchment streams display different collapse trends—as opposed to a regular change pattern in space. This result indicated that these low-relief surface patches did not experience a common uplift history [18], contrary to the relict landscape hypothesis.
The concept of “area-loss feedback” (ALF) refers to a drainage basin that has lost its catchment area, due to the impact of river capture, which leads to a decrease in its erosion rate and an increase in elevation; this increases the vulnerability of the catchment to further reduction, triggering a subsequent cascade of river capture and migration to the inner catchment [8]. The river profiles away from dynamic equilibrium and knickpoints are quite clear on the internal stream profile in Figure 7d–f. The results here show that even in a single plot, the χ-plots also showed a large scatter, indicating that they had different common uplift histories. Generally, the divide migrates in the direction with the lower erosion rate, which means that rivers outside low-relief surface patches are gaining catchment area by capturing the upper parts of inner rivers. In this work, it is noted three typical ALF mechanism cases in the Three Gorges, which were consistent with the concept of the low-relief surfaces were generated by river piracy. Hence, the study of well-validated cases in the Three Gorges area can improve our understanding of the elevated, low-relief surface landscape associated with drainage captures.
To simulate this mechanism, we established a DAC numerical model, which reflected the vertical uplift effect caused by neotectonic movement in the Three Gorges area (Figure 8). The model proved that the low-relief landscape patches formed in situ, in response to drainage area-loss following river capture. Although the dynamics of this landscape evolution could not be fully represented by this simple model, it satisfactorily constructed the concept, demonstrating the key role played by drainage evolution in the formation of low-relief surface landscapes in the Three Gorges region. Moreover, the model also reflected the sensitivity of river reorganization to vertical tectonic and revealed the function mechanism provided by river network geometry in the elucidation of geomorphic evolution.
6. Conclusions
In this study, low-relief surfaces in the Three Gorges area were plotted and quantitatively analyzed based on the geomorphologic index method, by using a 30 m resolution DEM. The analyses showed that the Three Gorges area has many low-relief surfaces distributed throughout, mainly on the highlands of the drainage divide between the Yangtze and Qingjiang rivers. Swath profiles were used to analyze the topographic features, and the spatial distribution of low-relief surfaces was not coplanar, reflecting that these surfaces had different uplift histories in different regions.
By characterizing the χ maps and dividing migrations, the study determined that the landform in the Three Gorges area was in an instantaneous state, and that the rivers were still undergoing dynamic reorganization, with the river basin having not yet reached equilibrium. The χ-transformed profiles were used to analyze the χ value differences between the inner and outer rivers of the landform surfaces, which showed that the low-relief patches in the Three Gorges area conformed to the expectations of an ALF mechanism. A DAC numerical model was then used to simulate landform evolution, and all the evidence taken together allowed us to form the hypothesis that the upland low-relief surface landscapes of the Three Gorges are not relict uplifted surfaces, but rather have formed in situ, based on long-term exchanges between river basins.
Overall, the study described here has allowed us to propose a valuable insight into the evolution of the low-relief surface landscapes of the Three Gorges, from the perspective of feedback effects caused by river piracy. We also recommend that the quasi-plain theory should be used more cautiously when explaining the evolution mechanism of the upland low-relief surface landscape. Because of the absence of dating materials, however, there is no direct evidence to show the formation age of the low-relief surfaces. In the future, accurate dating of low-relief surface landscapes will be required, if a deeper understanding of the long geomorphological history of the study region is to be achieved.
Supplementary Materials
The following are available online at https://www.mdpi.com/2072-4292/12/23/3899/s1, Movie S1: Numerical simulation showing the evolution of landscape and drainage network.
Author Contributions
L.L. was responsible for the processing, interpretation of data and wrote the manuscript; L.W. and X.W. designed and supervised the work, and revised the manuscript; C.L. led the conception of the research; H.L., X.W., and S.W. were involved in discussion and editing. All authors have read and agreed to the published version of the manuscript.
Funding
This study is funded by the National Natural Science Foundation of China (grant No.41975044, No. 41801021, No.41871019, No.41672355), and the Special Fund for Basic Scientific Research of Central Colleges, China University of Geosciences, Wuhan (CUGCJ1704).
Conflicts of Interest
The authors declare no conflict of interest.
References
- Davis, W.M. The geographical cycle. Geogr. J. 1899, 14, 481–504. [Google Scholar] [CrossRef]
- Pan, B.; Hu, Z.; Wang, J.; Vandenberghe, J.; Hu, X.; Wen, Y.; Li, Q.; Cao, B. The approximate age of the planation surface and the incision of the Yellow River. Palaeogeography 2012, 356–357, 54–61. [Google Scholar] [CrossRef]
- Vandenberghe, J.F. From planation surfaces to river valleys. Bull. Soc. Géogr. Liège 2016, 67, 93–106. [Google Scholar]
- Ritter, D. Landscape analysis and the search for geomorphic unity. GSA Bull. 1988, 100, 160–171. [Google Scholar] [CrossRef]
- Phillips, J.D. Erosion, isostatic response, and the missing peneplains. Geomorphology 2002, 45, 225–241. [Google Scholar] [CrossRef]
- Xiong, J.; Li, Y.; Zhang, P. New advances in planation surface research. Adv. Earth Sci. 2020, 35, 378–388, (In Chinese with English Abstract). [Google Scholar]
- Clark, M.K.; Royden, L.H.; Whipple, K.X.; Burchfiel, B.C.; Zhang, X.; Tang, W. Use of a regional, relict landscape to measure vertical deformation of the eastern Tibetan Plateau. J. Geophys. Res. Earth Surf. 2006, 111, F03002. [Google Scholar] [CrossRef] [Green Version]
- Whipple, K.X.; DiBiase, R.A.; Ouimet, W.B.; Forte, A.M. Preservation or piracy: Diagnosing low-relief, high-elevation surface formation mechanisms. Geology 2017, 45, 91–94. [Google Scholar] [CrossRef]
- Yang, R.; Willett, S.D.; Goren, L. In situ low-relief landscape formation as a result of river network disruption. Nature 2015, 520, 526–529. [Google Scholar] [CrossRef] [PubMed]
- Jaiswara, N.K.; Pandey, P.; Pandey, A.K. Mio-Pliocene piracy, relict landscape and drainage reorganization in the Namcha Barwa syntaxis zone of eastern Himalaya. Sci. Rep. 2019, 9, 17585. [Google Scholar] [CrossRef] [Green Version]
- Cao, L.; Shao, L.; Qiao, P.; Zhao, Z.; van Hinsbergen, D.J.J. Early Miocene birth of modern Pearl River recorded low-relief, high-elevation surface formation of SE Tibetan Plateau. Earth Planet Sci. Lett. 2018, 496, 120–131. [Google Scholar] [CrossRef]
- Sheng, Y. The Valley Landform of the Upper Yangtze; Science Press: Beijing, China, 1965. (In Chinese) [Google Scholar]
- Tian, L.; Li, P.; Luo, Y. Valley Development History of Three Gorges of Yangtze River; Press of Southwest Jiaotong University: Chengdu, China, 1996. (In Chinese) [Google Scholar]
- Xie, S.; Yuan, D.; Wang, J. Faetures of the planation surface in the surrounding area of the three gorges of Yangtze. Carsologica Sin. 2006, 25, 40–45, (In Chinese with English Abstract). [Google Scholar]
- Li, J.; Xie, S.; Kuang, M. Geomorphic evolution of the Yangtze Gorges and the time of their formation. Geomorphology 2001, 41, 125–135. [Google Scholar] [CrossRef]
- Ding, J. The identification of the physiographic epoch in west Hubei plateau. Carsologica Sin. 1987, 03, 81–88, (In Chinese with English Abstract). [Google Scholar]
- Yang, D.; Ren, L. The summit level in western Hubei mountain region. Mt. Res. 1997, 15, 187–191, (In Chinese with English Abstract). [Google Scholar]
- Wang, L.; Niu, Z.; Zhao, X.; Tu, B. Discovery of high-elevation gravel during middle Pleistocene in Jianshi area and its significance. Yangtze River 2010, 41, 58–60, (In Chinese with English Abstract). [Google Scholar]
- Clark, M.K.; Schoenbohm, L.M.; Royden, L.H.; Whipple, K.X.; Burchfiel, B.C.; Zhang, X.; Tang, W.; Wang, E.; Chen, L. Surface uplift, tectonics, and erosion of eastern Tibet from large-scale drainage patterns. Tectonics 2004, 23. [Google Scholar] [CrossRef] [Green Version]
- Zhang, N.; Li, X.; Li, S. The new view points of qurer and crustal movement, valley deep trough and palaeoflood, from Fengjie county to Yunyang county in three gorges reservoir area. Quat. Sci. 2005, 25, 24–27. (In Chinese) [Google Scholar]
- Wu, S.; Shi, L.; Wang, R.; Tan, C.; Hu, D.; Mei, Y.; Xu, R. Zonation of the landslide hazards in the forereservoir region of the Three Gorges Project on the Yangtze River. Eng. Geol. 2001, 59, 51–58. [Google Scholar] [CrossRef]
- Li, H.; Huang, X.; Deng, Q.; Kusky, T.M.; Cai, X. Mapping of planation surfaces in the southwest region of Hubei Province, China—Using the DEM-derived painted relief model. J. Earth Sci. 2012, 23, 719–730. [Google Scholar] [CrossRef]
- Arseni, M.; Voiculescu, M.; Georgescu, L.P.; Iticescu, C.; Rosu, A. Testing different interpolation methods based on single beam echosounder river surveying. Case study: Siret River. ISPRS Int. J. Geo Inf. 2019, 8, 507. [Google Scholar] [CrossRef] [Green Version]
- Chen, C.; Li, Y.; Yan, C.; Dai, H.; Liu, G. A Robust algorithm of multiquadric method based on an improved Huber loss function for interpolating remote-sensing-derived elevation data sets. Remote Sens. 2015, 7, 3347–3371. [Google Scholar] [CrossRef] [Green Version]
- Aguilar, F.J.; Mills, J.P. Accuracy assessment of lidar-derived digital elevation models. Photogramm. Rec. 2008, 23, 148–169. [Google Scholar] [CrossRef]
- Elkhrachy, I. Vertical accuracy assessment for SRTM and ASTER digital elevation models: A case study of Najran city, Saudi Arabia. Ain Shams Eng. J. 2018, 9, 1807–1817. [Google Scholar] [CrossRef]
- Boulton, S.J.; Stokes, M. Which DEM is best for analyzing fluvial landscape development in mountainous terrains? Geomorphology 2018, 310, 168–187. [Google Scholar] [CrossRef]
- Liu, F.; Gao, H.; Pan, B.; Li, Z.; Su, H. Quantitative analysis of planation surfaces of the upper Yangtze River in the Sichuan-Yunnan Region, Southwest China. Front. Earth Sci. 2018, 13, 55–74. [Google Scholar] [CrossRef]
- Smith, M.J.; Rose, J.; Booth, S. Geomorphological mapping of glacial landforms from remotely sensed data: An evaluation of the principal data sources and an assessment of their quality. Geomorphology 2006, 76, 148–165. [Google Scholar] [CrossRef]
- Strobl, M.; Hetzel, R.; Niedermann, S.; Ding, L.; Zhang, L. Landscape evolution of a bedrock peneplain on the southern Tibetan Plateau revealed by in situ-produced cosmogenic 10Be and 21Ne. Geomorphology 2012, 153–154, 192–204. [Google Scholar] [CrossRef] [Green Version]
- Haider, V.L.; Kropáček, J.; Dunkl, I.; Wagner, B.; von Eynatten, H. Identification of peneplains by multi-parameter assessment of digital elevation models. Earth Surf. Process. Landf. 2015, 40, 1477–1492. [Google Scholar] [CrossRef]
- Zadeh, L.A. Fuzzy algorithms. Inf. Control 1968, 12, 94–102. [Google Scholar] [CrossRef] [Green Version]
- Braun, J.; Sambridge, M. Modelling landscape evolution on geological time scales A new method based onirregular spatial discretization. Basin Res. 1997, 9, 27–52. [Google Scholar] [CrossRef] [Green Version]
- Willett, S.D.; McCoy, S.W.; Perron, J.T.; Goren, L.; Chen, C.Y. Dynamic reorganization of River Basins. Science 2014, 343, 1248765. [Google Scholar] [CrossRef] [PubMed]
- Perron, J.T.; Royden, L. An integral approach to bedrock river profile analysis. Earth Surf. Process. Landf. 2013, 38, 570–576. [Google Scholar] [CrossRef] [Green Version]
- Struth, L.; Giachetta, E.; Willett, S.D.; Owen, L.A.; Tesón, E. Quaternary drainage network reorganization in the Colombian Eastern Cordillera plateau. Earth Surf. Process. Landf. 2020, 45, 1789–1804. [Google Scholar] [CrossRef]
- Whipple, K.X. Bedrock rivers and the geomorphology of active orogens. Annu. Rev. Earth Planet. Sci. 2004, 32, 151–185. [Google Scholar] [CrossRef] [Green Version]
- Kirby, E.; Whipple, K. Quantifying differential rock-uplift rates via stream profile analysis. Geology 2001, 29, 415–418. [Google Scholar] [CrossRef]
- Wobus, C.; Whipple, K.X.; Kirby, E.; Snyder, N.; Johnson, J.; Spyropolou, K.; Crosby, B.; Sheehan, D. Tectonics from topography: Procedures, promise, and pitfalls. In Tectonics, Climate, and Landscape Evolution; The Geological Society of America: Boulder, CO, USA, 2006. [Google Scholar] [CrossRef] [Green Version]
- Mudd, S.M.; Attal, M.; Milodowski, D.T.; Grieve, S.W.D.; Valters, D.A. A statistical framework to quantify spatial variation in channel gradients using the integral method of channel profile analysis. J. Geophys. Res. Earth Surf. 2014, 119, 138–152. [Google Scholar] [CrossRef] [Green Version]
- Forte, A.M.; Whipple, K.X. Short communication: The topographic analysis kit (TAK) for TopoToolbox. Earth Surf. Dyn. 2019, 7, 87–95. [Google Scholar] [CrossRef] [Green Version]
- Schwanghart, W.; Kuhn, N.J. TopoToolbox: A set of Matlab functions for topographic analysis. Environ. Model. Softw. 2010, 25, 770–781. [Google Scholar] [CrossRef]
- Gallen, S.F.; Wegmann, K.W. River profile response to normal fault growth and linkage: An example from the Hellenic forearc of south-central Crete, Greece. Earth Surf. Dyn. 2017, 5, 161–186. [Google Scholar] [CrossRef] [Green Version]
- Wang, Y.; Zheng, D.; Zhang, H.; Li, C.; Xiao, L.; Li, Y.; Hao, Y. The distribution of active rock uplift in the interior of the western Qilian Shan, NE Tibetan Plateau: Inference from bedrock channel profiles. Tectonophysics 2019, 759, 15–29. [Google Scholar] [CrossRef]
- Telbisz, T.; Kovács, G.; Székely, B.; Szabó, J. Topographic swath profile analysis: A generalization and sensitivity evaluation of a digital terrain analysis tool. Z. Geomorphol. 2013, 57, 485. [Google Scholar] [CrossRef]
- Hergarten, S.; Robl, J.; Stüwe, K. Extracting topographic swath profiles across curved geomorphic features. Earth Surf. Dyn. 2014, 2, 97–104. [Google Scholar] [CrossRef] [Green Version]
- Pérez-Peña, J.V.; Al-Awabdeh, M.; Azañón, J.M.; Galve, J.P.; Booth-Rea, G.; Notti, D. SwathProfiler and NProfiler: Two new ArcGIS Add-ins for the automatic extraction of swath and normalized river profiles. Comput. Geosci. 2017, 104, 135–150. [Google Scholar] [CrossRef]
- Bishop, P. Long-term landscape evolution: Linking tectonics and surface processes. Earth Surf. Process. Landf. 2007, 32, 329–365. [Google Scholar] [CrossRef]
- Codilean, A.T.; Bishop, P.; Hoey, T.B. Surface process models and the links between tectonics and topography. Prog. Phys. Geogr. 2006, 30, 307–333. [Google Scholar] [CrossRef] [Green Version]
- Goren, L.; Willett, S.D.; Herman, F.; Braun, J. Coupled numerical-analytical approach to landscape evolution modeling. Earth Surf. Process. Landf. 2014, 39, 522–545. [Google Scholar] [CrossRef]
- Temme, A.J.A.M.; Claessens, L.; Veldkamp, A.; Schoorl, J.M. Evaluating choices in multi-process landscape evolution models. Geomorphology 2011, 125, 271–281. [Google Scholar] [CrossRef]
- Tucker, G.E.; Hancock, G.R. Modelling landscape evolution. Earth Surf. Process Landf. 2010, 35, 28–50. [Google Scholar] [CrossRef]
- Willgoose, G. Mathematical modeling of whole landscape evolution. Annu. Rev. Earth Planet. Sci. 2005, 33, 443–459. [Google Scholar] [CrossRef]
- Willett, S.D.; Slingerland, R.; Hovius, N. Uplift, shortening, and steady state topography in active mountain belts. Am. J. Sci. 2001, 301, 455–485. [Google Scholar] [CrossRef] [Green Version]
- Pelletier, J.D. Persistent drainage migration in a numerical landscape evolution model. Geophys. Res. Lett. 2004, 31. [Google Scholar] [CrossRef] [Green Version]
- Braun, J.; Willett, S.D. A very efficient O(n), implicit and parallel method to solve the stream power equation governing fluvial incision and landscape evolution. Geomorphology 2013, 180–181, 170–179. [Google Scholar] [CrossRef]
- Tucker, G.; Lancaster, S.; Gasparini, N.; Bras, R. The channel-hillslope integrated landscape development model (CHILD). Landsc. Eros. Evol. Modeling 2001, 349–388. [Google Scholar] [CrossRef]
- Zondervan, J.R.; Stokes, M.; Boulton, S.J.; Telfer, M.W.; Mather, A.E. Rock strength and structural controls on fluvial erodibility: Implications for drainage divide mobility in a collisional mountain belt. Earth Planet. Sci. Lett. 2020, 538, 116221. [Google Scholar] [CrossRef] [Green Version]
- Gu, Z.-K.; Fan, H.; Lou, J.-P.; Yang, K. Controls on geomorphic characteristics of the Xiaohei River basin in the upper Lancang-Mekong, China. J. Mt. Sci. 2020, 17, 1032–1044. [Google Scholar] [CrossRef]
- Chen, C.-Y.; Willett, S.D. Graphical methods of river profile analysis to unravel drainage area change, uplift and erodibility contrasts in the Central Range of Taiwan. Earth Surf. Process. Landf. 2016, 41, 2223–2238. [Google Scholar] [CrossRef]
- Fan, N.; Chu, Z.; Jiang, L.; Hassan, M.A.; Lamb, M.P.; Liu, X. Abrupt drainage basin reorganization following a Pleistocene river capture. Nat. Commun. 2018, 9. [Google Scholar] [CrossRef] [Green Version]
- Wang, L.; Niu, Z.; Zhao, X.; Tu, B. Study of characteristics of layered landforms depositions and geomorphic evolution in the Qingjiang River Basin. Yangtze River 2010, 41, 18–20, (In Chinese with English Abstract). [Google Scholar]
- Kirby, E.; Whipple, K. Expression of active tectonics in erosional landscapes. J. Struct. Geol. 2012, 44, 54–75. [Google Scholar] [CrossRef]
- Lavé, J. Landscape inversion by stream piracy. Nature 2015, 520, 442–443. [Google Scholar] [CrossRef] [PubMed]
Figure 1.
Overview of the study area. (a) Map showing the location of the Three Gorges region, in the Yangtze River basin. (b) The mean precipitation over the study region obtained from Tropical Rainfall Measuring Mission. (c) Relief map showing study area elevations. The red lines are major faults.

Figure 2.
Determining the optimal statistical window for topographic relief. (a) The coefficient of determination (R2) between the window area and topographic relief, x and y represent window area and topographic relief, respectively; (b) mean change point graph. The curve slope changes from steep to shallow at the 18th point, so 18 × 18 pts was selected as the window size.

Figure 3.
The spatial distribution and classification of the Three Gorges region low-relief surfaces.
Figure 3.
The spatial distribution and classification of the Three Gorges region low-relief surfaces.

Figure 4.
(a) Relationship between χ map and low-relief surfaces distribution in the Three Gorges region. Dashed white ovals show the location of the area shown in panel b. (b) Detailed χ map for the Baolong and Mashui River networks. (c) Geomorphic parameters showing the direction of the predicted divide migration. Black and white bars represent data from the Baolong River in the north, and the Mashui River in the south, respectively.

Figure 5.
Topographic swath (S) profiles in the Three Gorges study area: (a) Locations of the S1–4, the length of S1–3 is 150 km and S4 running parallel to the Yangtze River, together with the low-relief surface distribution (planar shown as green); (b,c) The upper red curve and the lower blue curve represent maximum and minimum elevations, respectively, with the solid gray line in the middle representing mean elevation. Gray bars indicate low-relief surface patches along the topographic profile.

Figure 6.
χ-transformed profiles of all major streams in the study area catchments. The red and gray lines represent profiles of the main streams and tributaries, respectively.
Figure 6.
χ-transformed profiles of all major streams in the study area catchments. The red and gray lines represent profiles of the main streams and tributaries, respectively.

Figure 7.
Relationship between individual low-relief surface patches and streams: (a–c) Landscape perspective view captured using Google Earth imagery (locations are those shown in the black boxes in Figure 4a). The blue lines represent the exterior rivers of the low-relief surface landscape, while red lines represent interior rivers. The white arrows indicate flow direction, the black triangles shows the knickpoint, and the yellow points represents the downstream point common to all the rivers in the figure; (d–f) χ-plots for the major rivers in (a–c).

Figure 8.
Topographic evolution in a Divide and Capture (DAC) landscape model, showing river reorganization and low-relief surfaces. (a–c) represent the evolutionary sequence of the rivers and associated landforms in a region undergoing tectonic uplift. The rivers are colored based on their χ value, and the larger the χ value, the stronger the river’s ability to capture. The white arrows indicate the direction of drainage divide migration, and the green surface is the low-relief surface formed by river piracy (see also Supplementary movie S1).


Table 1.
Classification and parameter criteria for study area low-relief surfaces.
| Low-Relief Surface | Elevation (m) | Relief (m) |
|---|---|---|
| Higher elevation surface | 1700–2000 | 350 |
| Lower elevation surface | 1200–1500 | 300 |
Publisher’s Note: MDPI stays neutral with regard to jurisdictional claims in published maps and institutional affiliations. |
© 2020 by the authors. Licensee MDPI, Basel, Switzerland. This article is an open access article distributed under the terms and conditions of the Creative Commons Attribution (CC BY) license (http://creativecommons.org/licenses/by/4.0/).
Share and Cite
MDPI and ACS Style
Lv, L.; Wang, L.; Li, C.; Li, H.; Wang, X.; Wang, S. Formation Mechanism for Upland Low-Relief Surface Landscapes in the Three Gorges Region, China. Remote Sens. 2020, 12, 3899. https://doi.org/10.3390/rs12233899
AMA Style
Lv L, Wang L, Li C, Li H, Wang X, Wang S. Formation Mechanism for Upland Low-Relief Surface Landscapes in the Three Gorges Region, China. Remote Sensing. 2020; 12(23):3899. https://doi.org/10.3390/rs12233899
Chicago/Turabian StyleLv, Lingyun, Lunche Wang, Chang’an Li, Hui Li, Xinsheng Wang, and Shaoqiang Wang. 2020. "Formation Mechanism for Upland Low-Relief Surface Landscapes in the Three Gorges Region, China" Remote Sensing 12, no. 23: 3899. https://doi.org/10.3390/rs12233899
Note that from the first issue of 2016, this journal uses article numbers instead of page numbers. See further details here.