Quantitative Comparison of the Marker Compounds in Different Medicinal Parts of Morus alba L. Using High-Performance Liquid Chromatography-Diode Array Detector with Chemometric Analysis


Abstract
: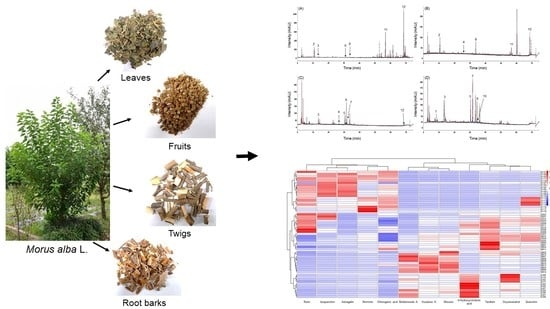
1. Introduction
2. Results
2.1. Optimization of the Sample Extraction and the Analytical Conditions
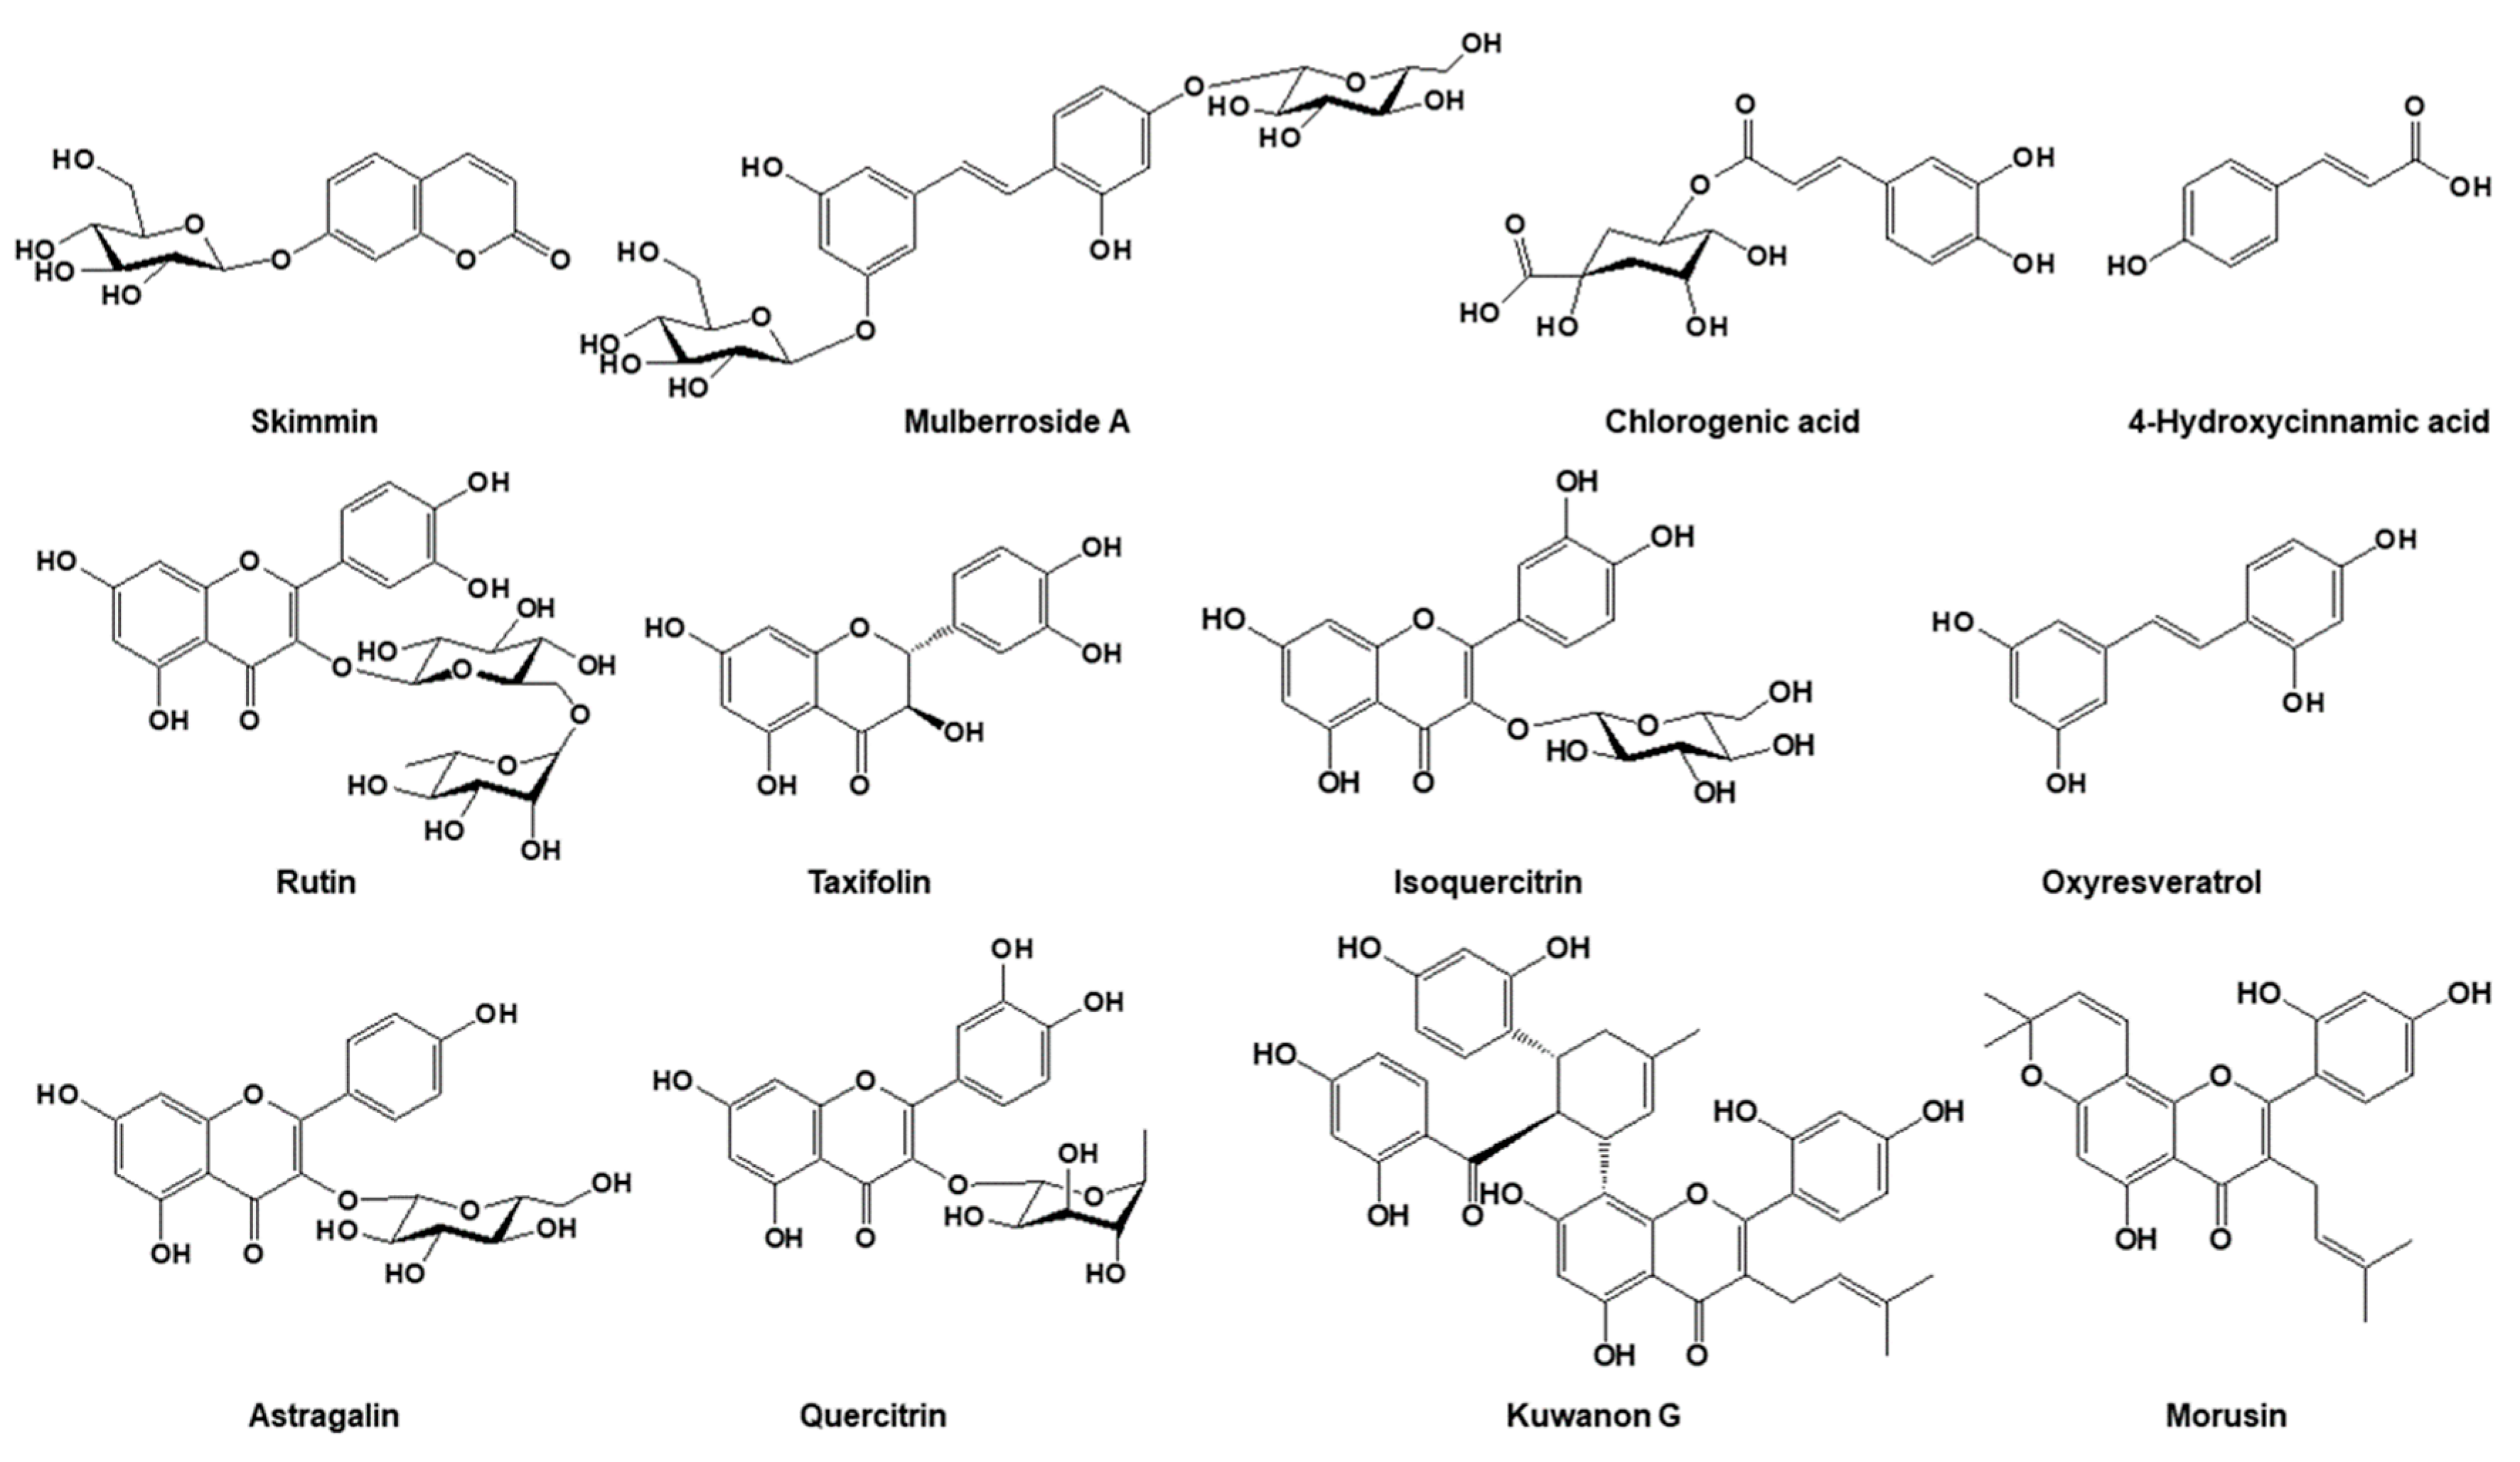
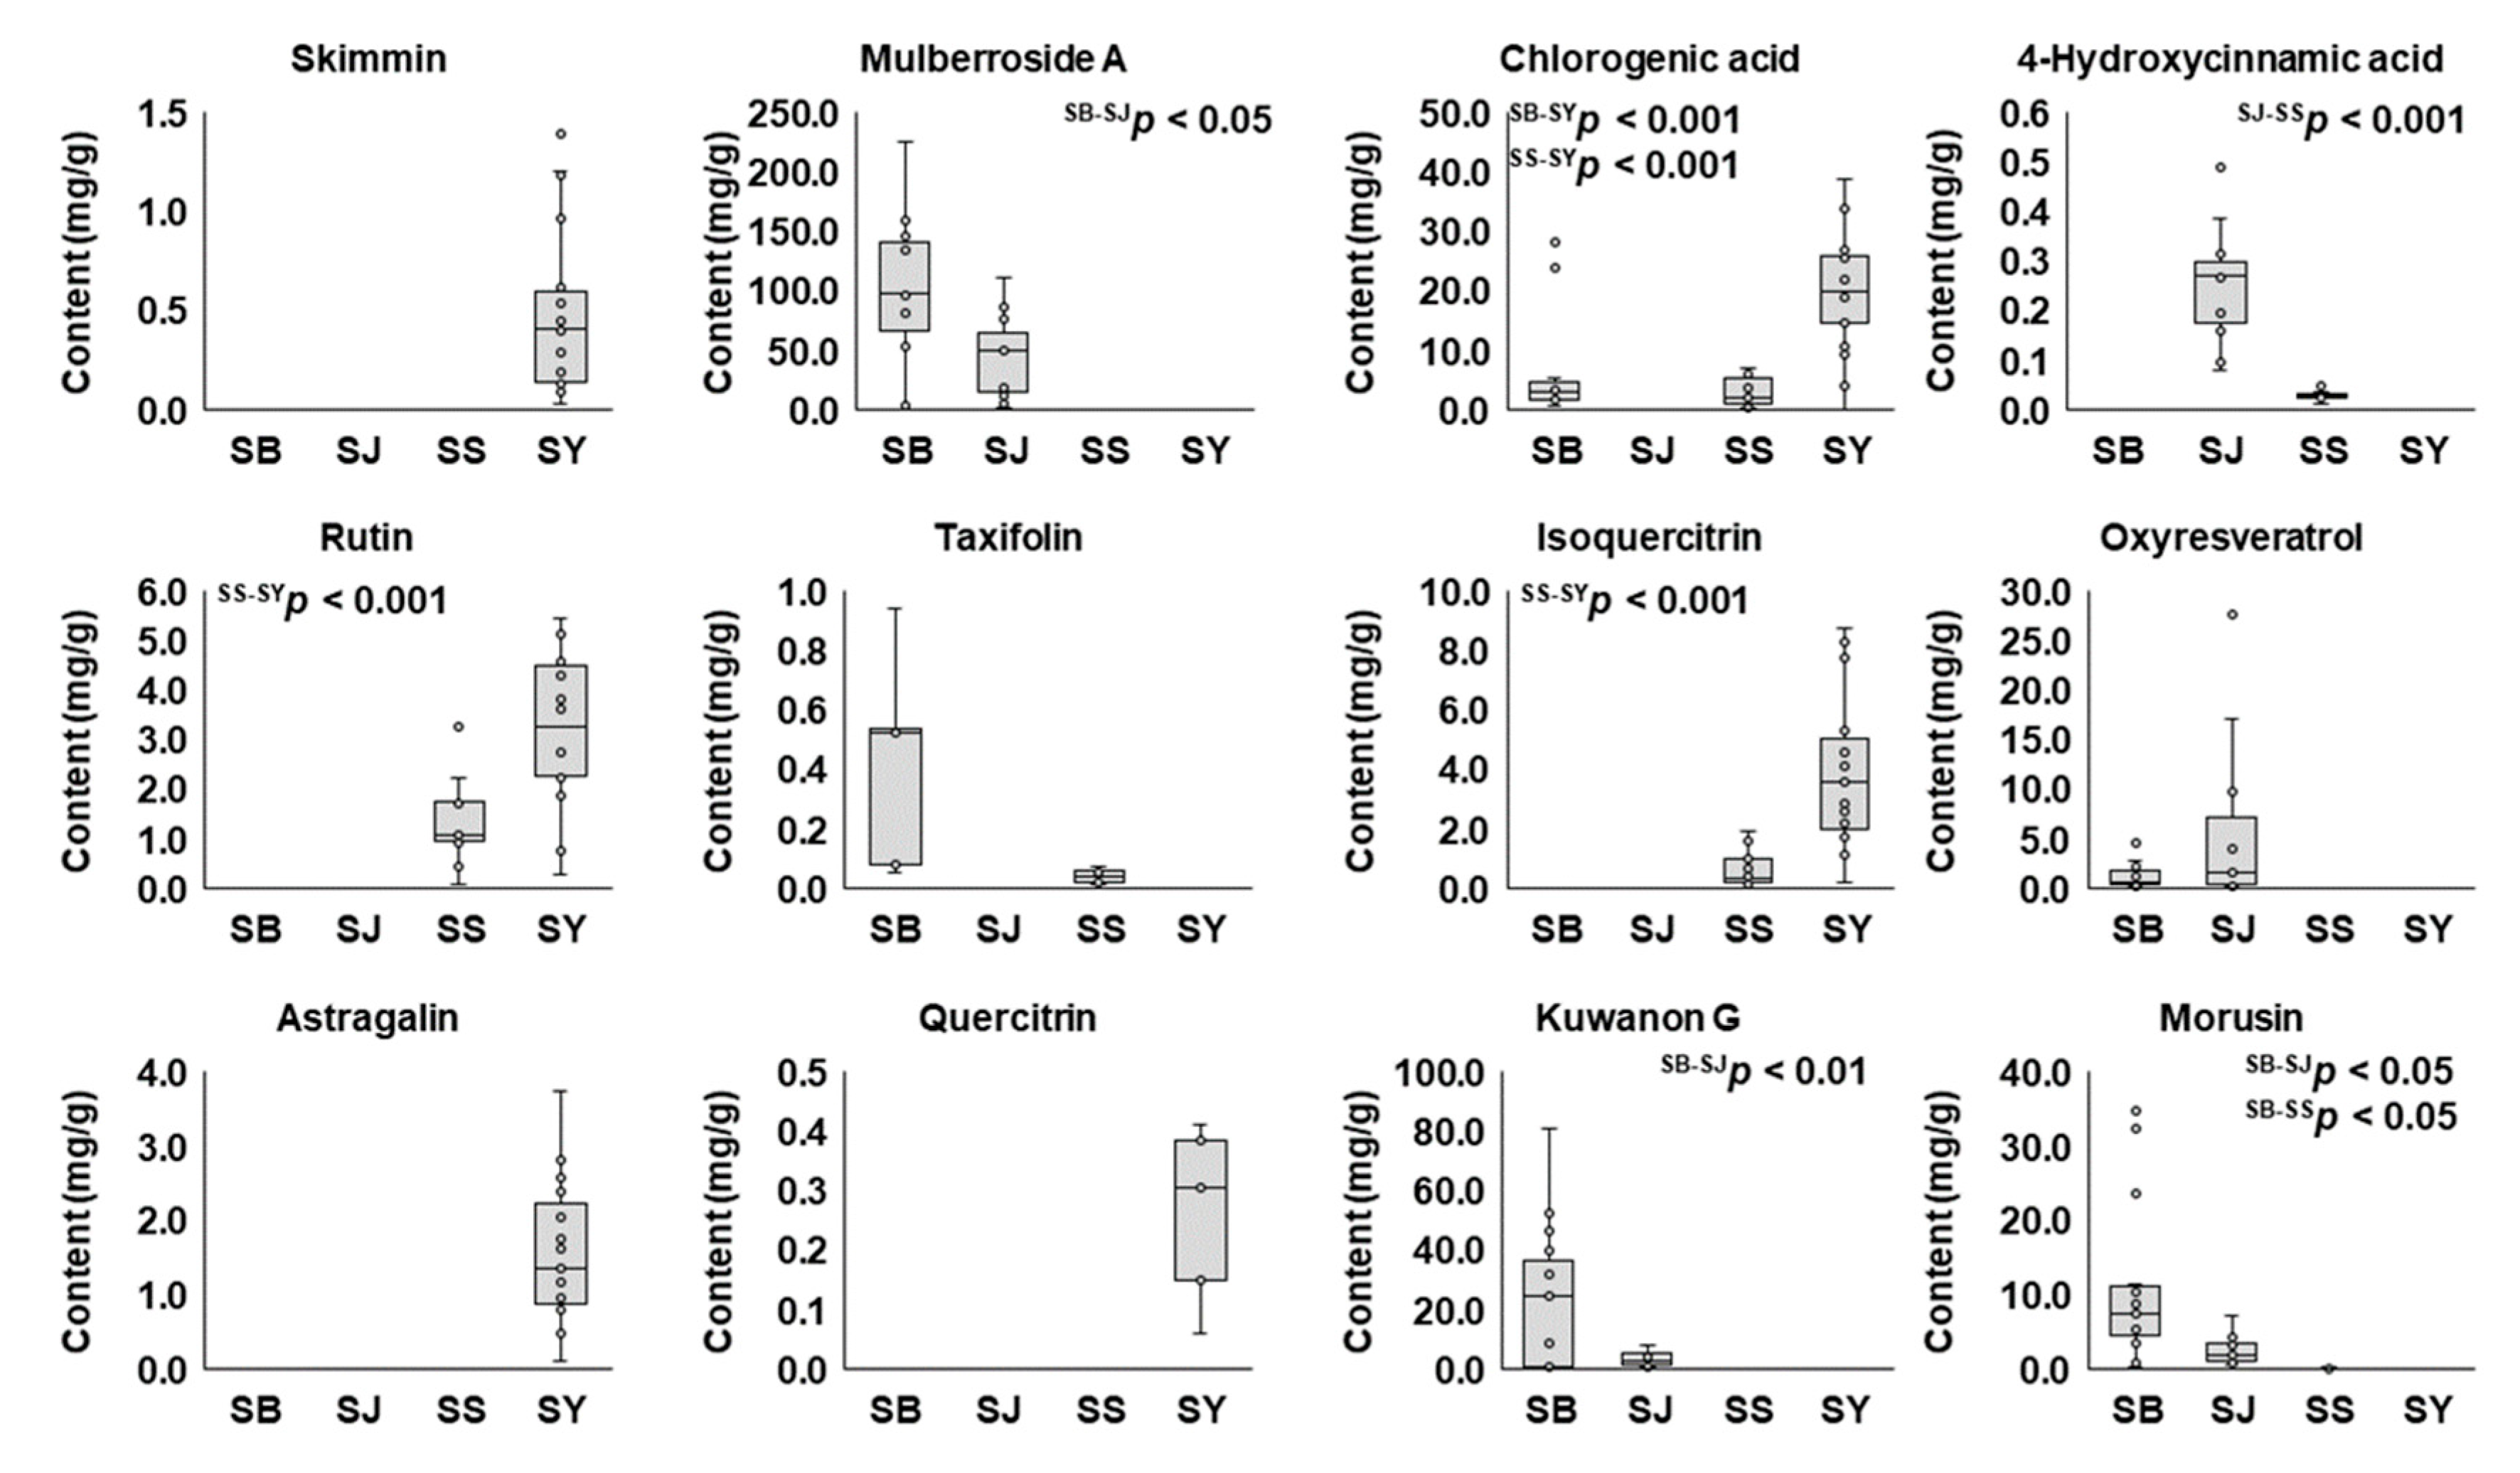
2.2. Quantitative Comparison of the 12 Marker Compounds in Different Medicinal Parts of M. alba
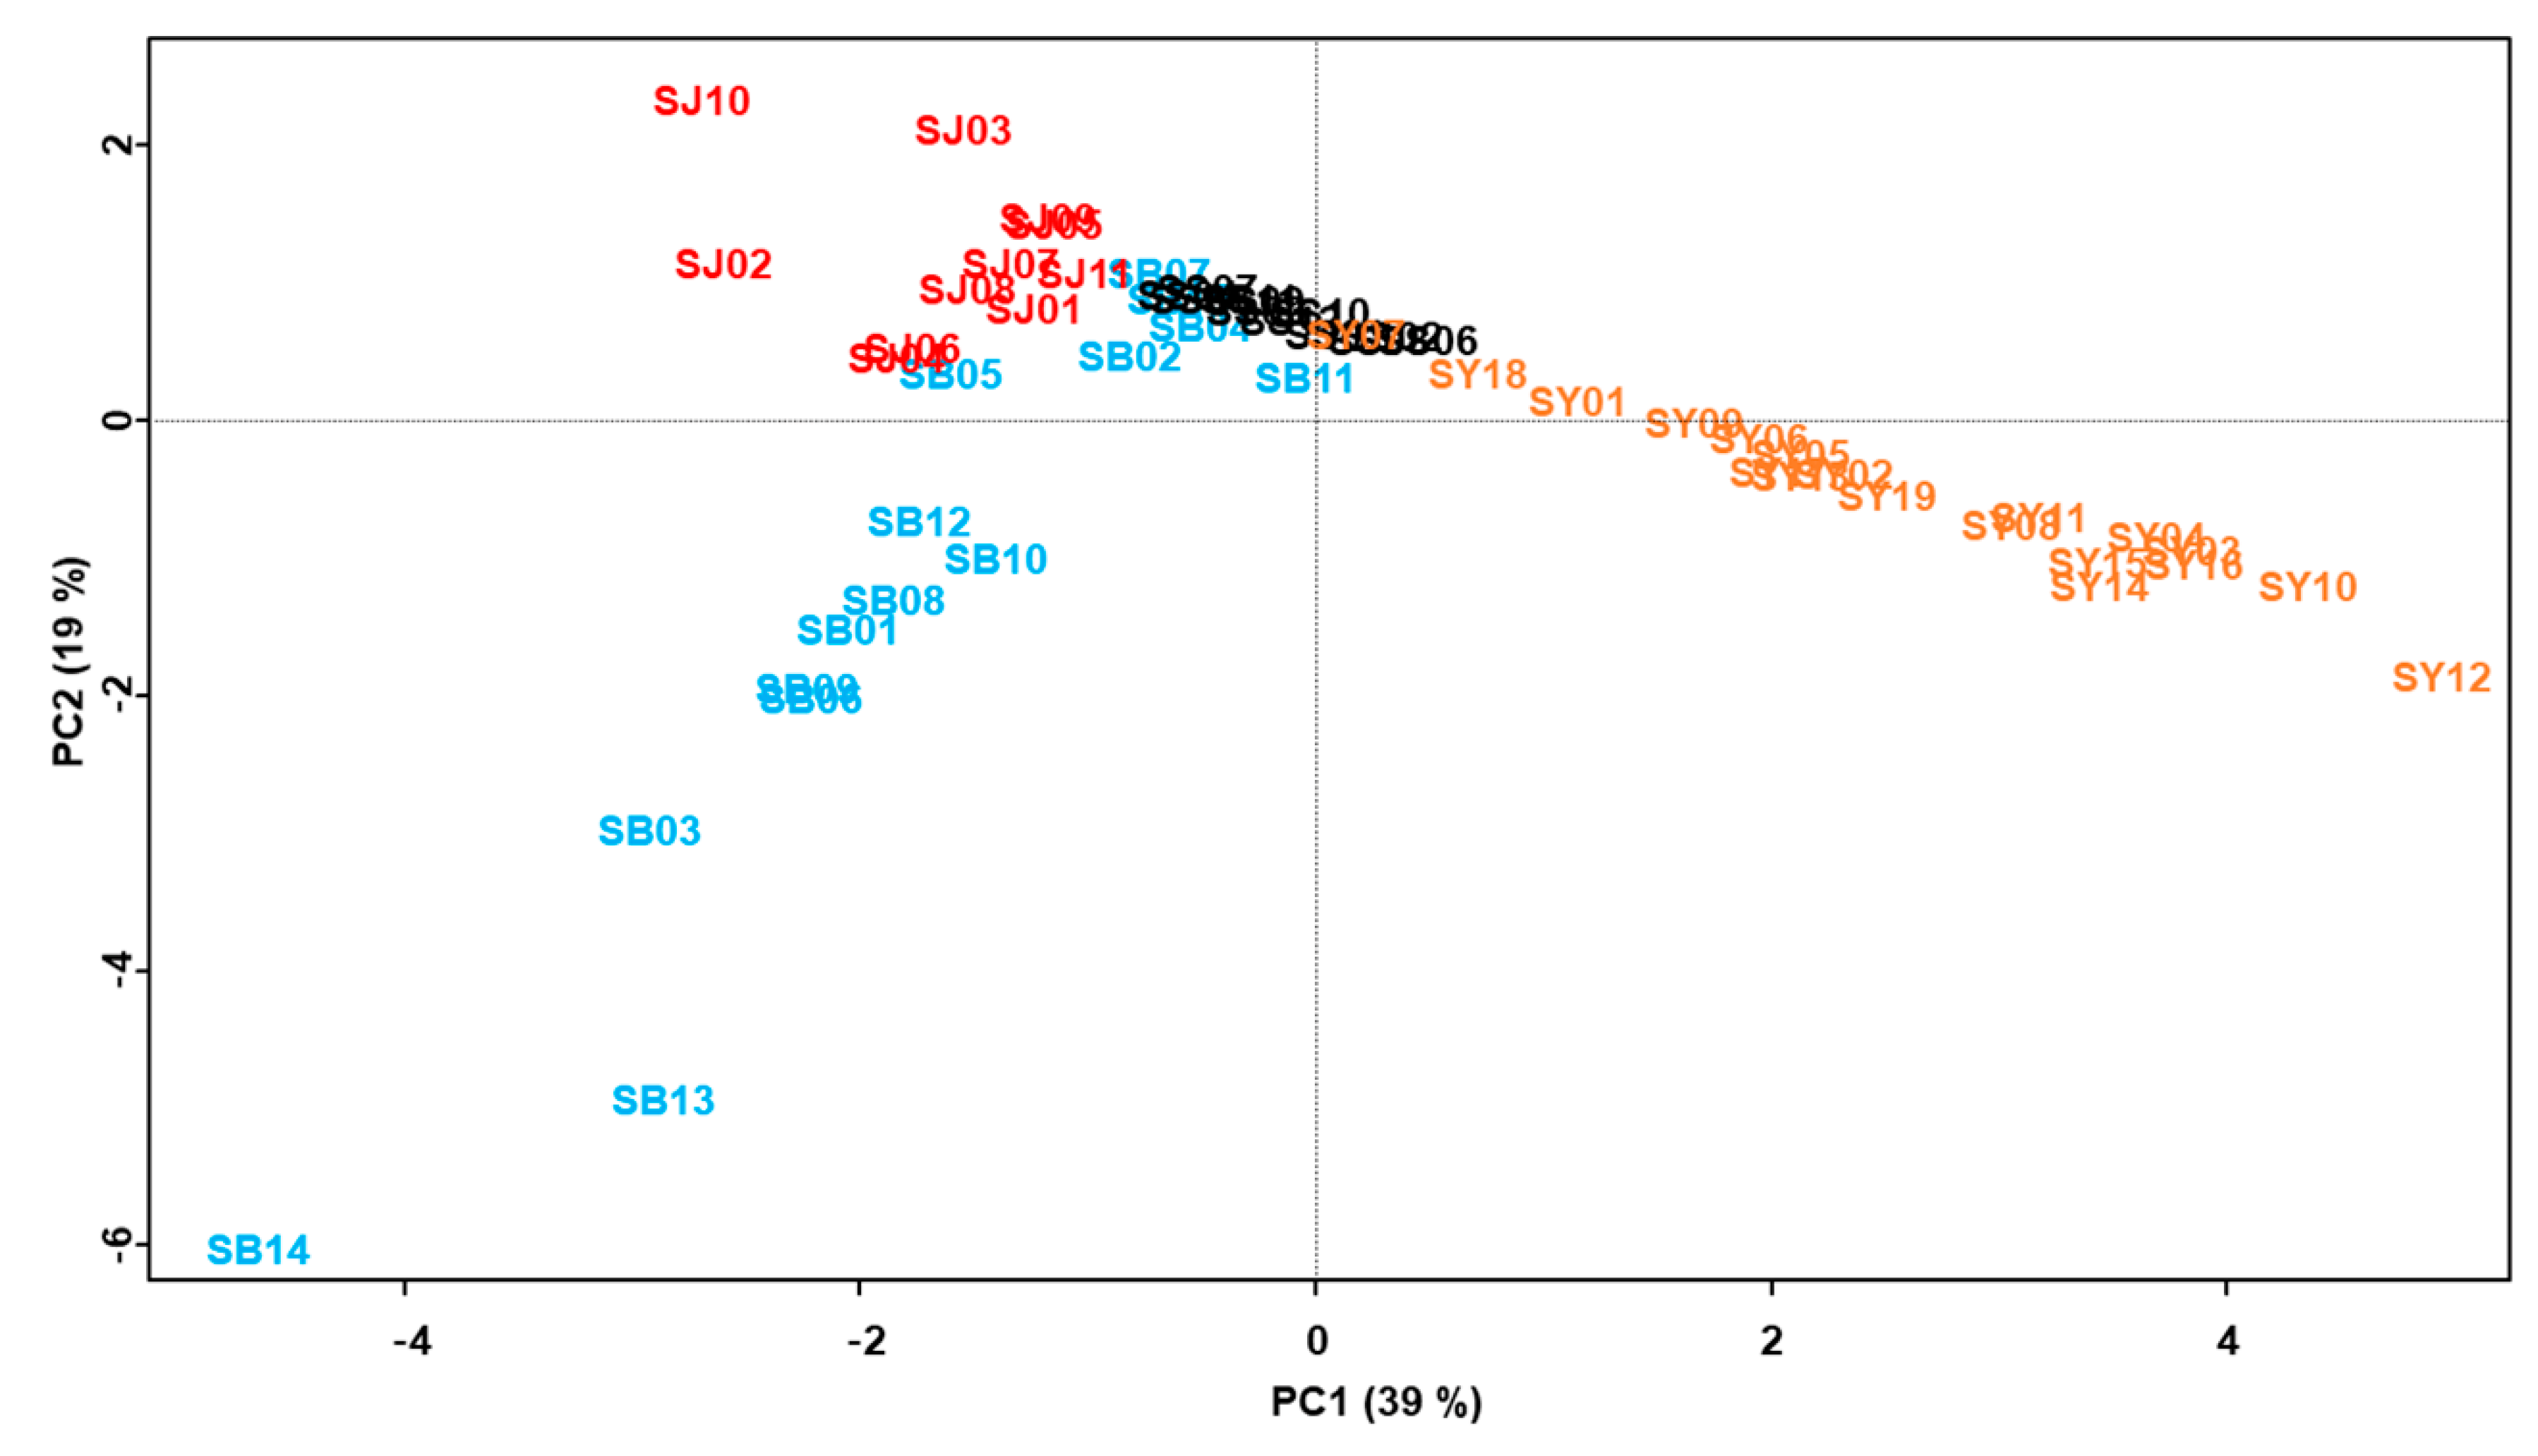
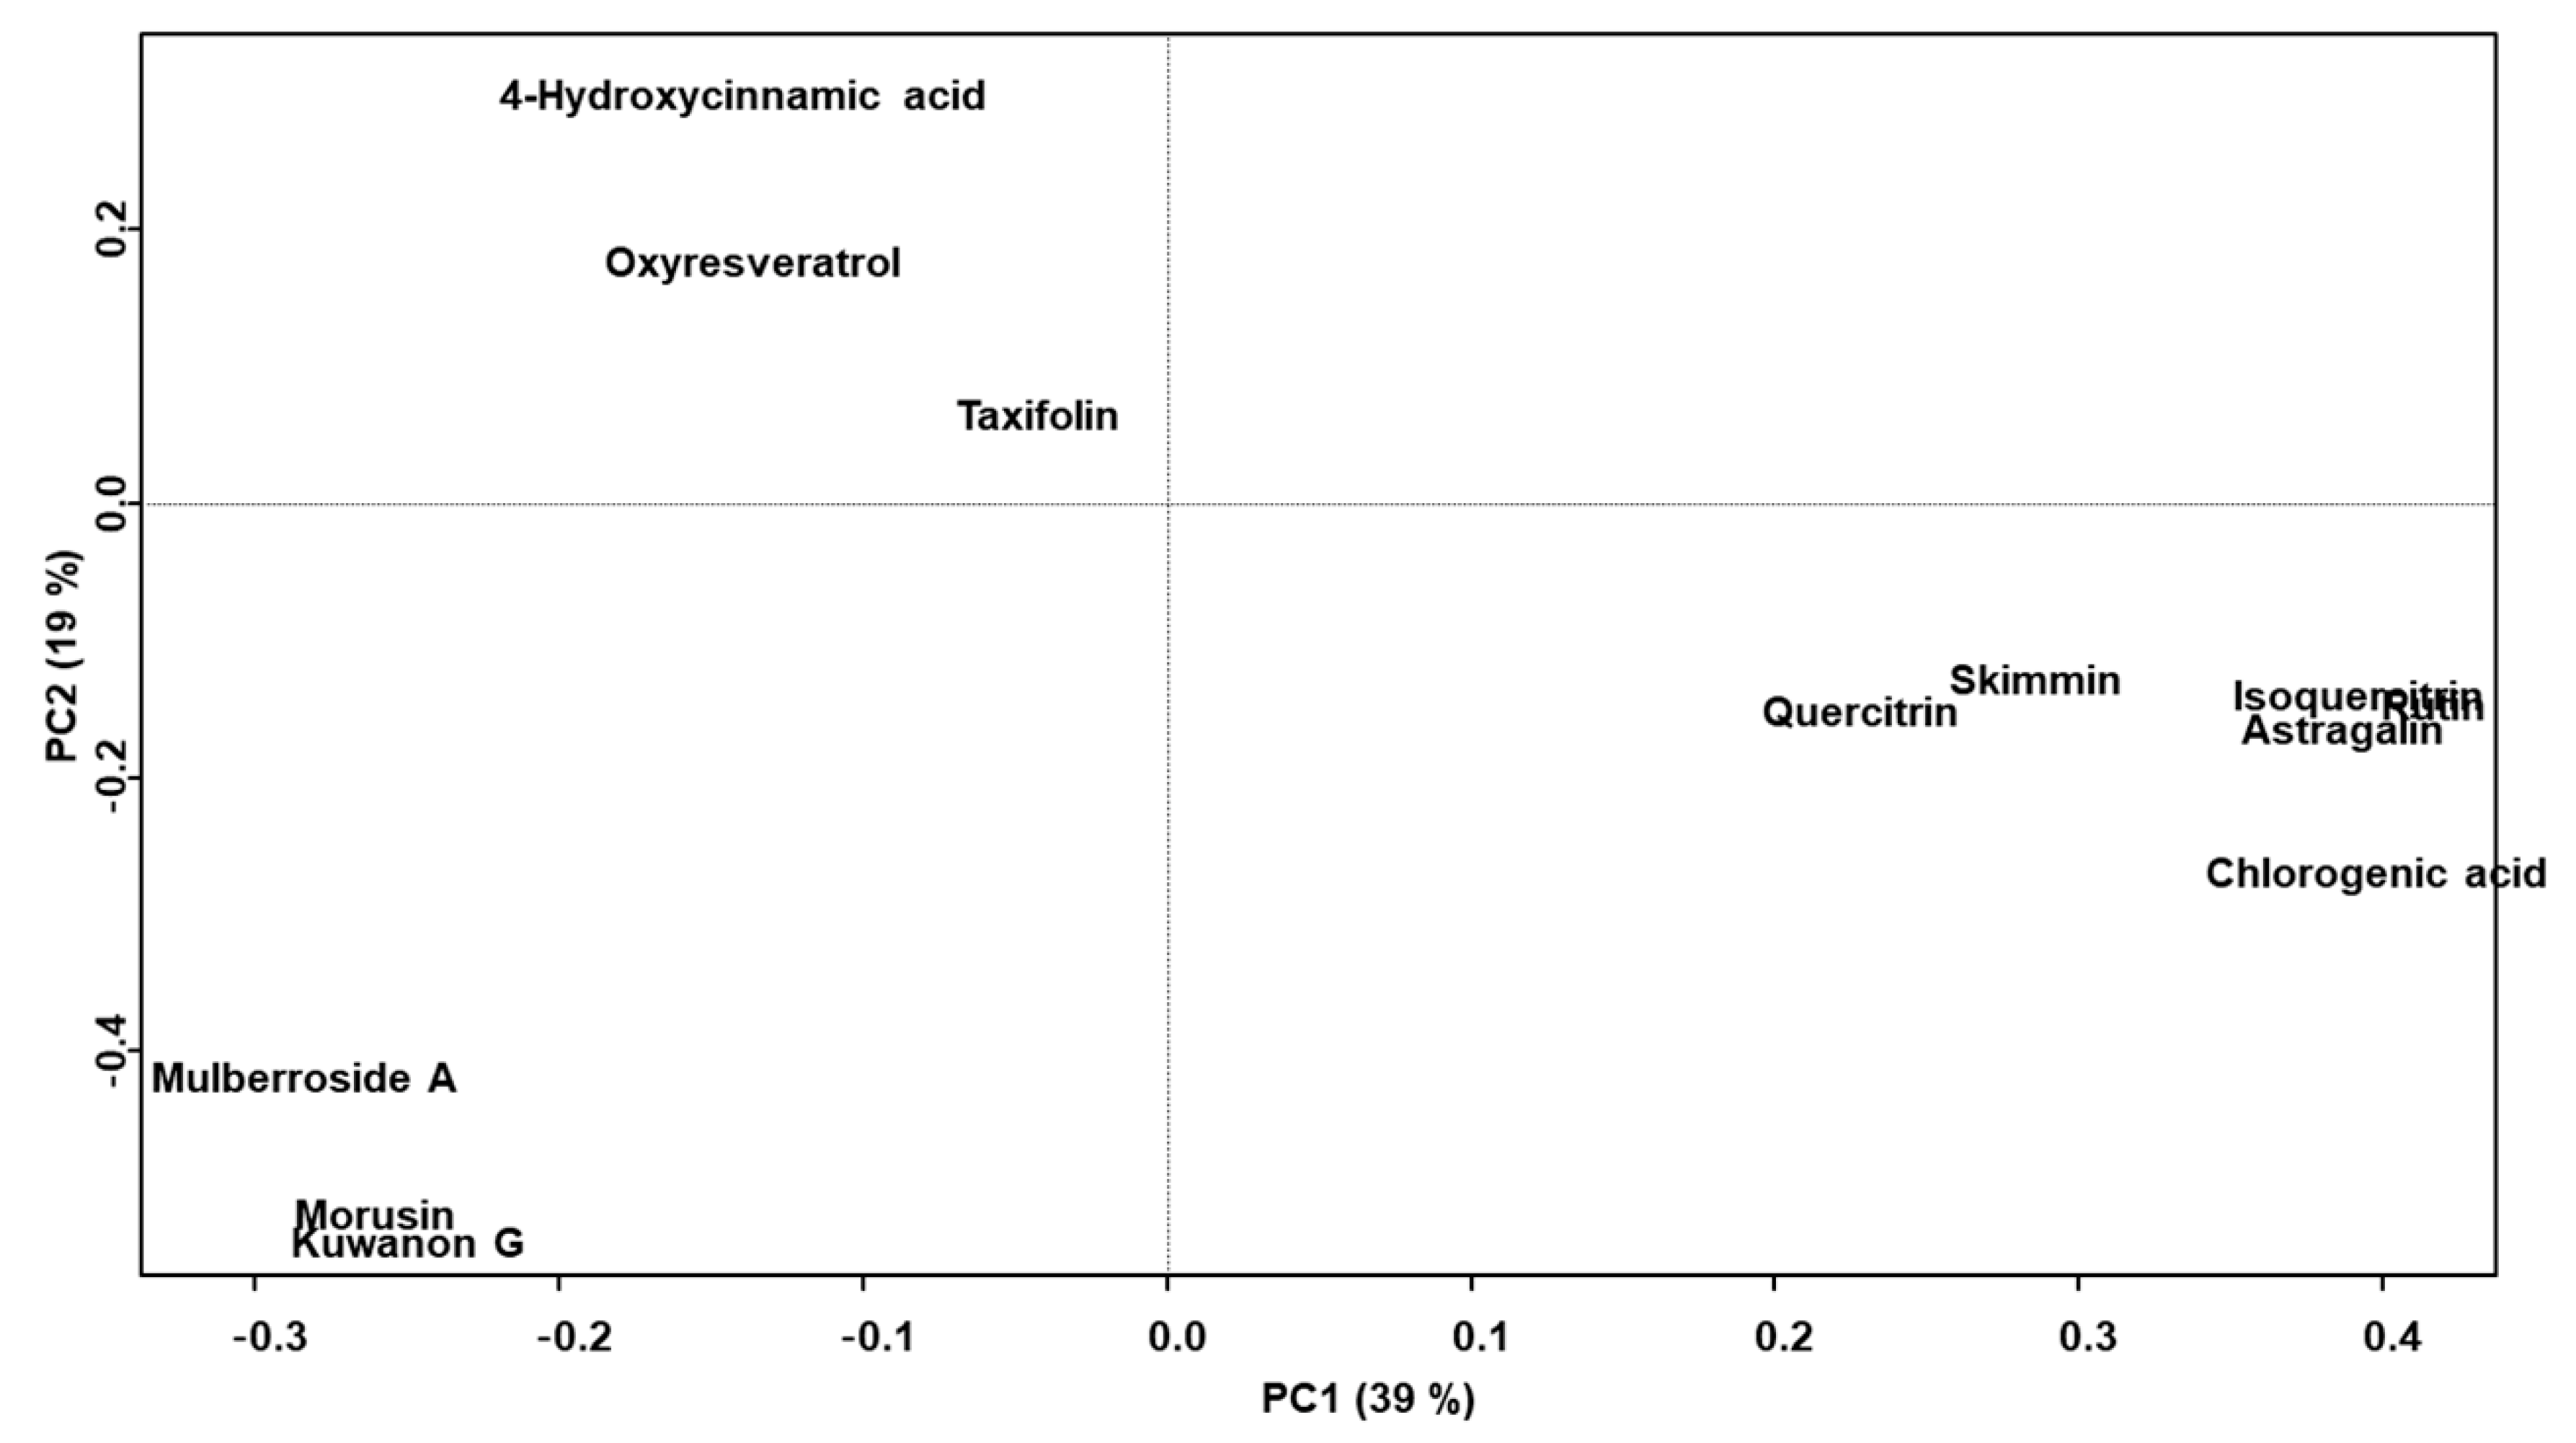
2.3. Chemometric Analysis of the Marker Compounds in the Morus Samples
3. Discussion
4. Materials and Methods
4.1. Chemicals and Reagents
4.2. Sample Preparation
4.3. HPLC Analytical Conditions
4.4. Validation of the HPLC Method
4.5. Chemometric Statistical Analysis
5. Conclusions
Supplementary Materials
Author Contributions
Funding
Acknowledgments
Conflicts of Interest
References
- The Ministry of Korean Food and Drug Safety. The Korean Pharmacopoeia. In KFDA Notification No. 2019-102, 12th ed.; Ministry of Korean Food and Drug Safety: Seoul, Korea, 2019. [Google Scholar]
- The Ministry of Korean Food and Drug Safety. The Korean Herbal Pharmacopoeia. In KFDA Notification No. 2020-12; Ministry of Korean Food and Drug Safety: Seoul, Korea, 2020. [Google Scholar]
- Jia, Y.-N.; Peng, Y.-L.; Zhao, Y.-P.; Cheng, X.-F.; Zhou, Y.; Chai, C.-L.; Zeng, L.-S.; Pan, M.-H.; Xu, L. Comparison of the hepatoprotective effects of the three main stilbenes from mulberry twigs. J. Agric. Food Chem. 2019, 67, 5521–5529. [Google Scholar] [CrossRef] [PubMed]
- Guo, Y.-Q.; Tang, G.-H.; Lou, L.-L.; Li, W.; Zhang, B.; Liu, B.; Yin, S. Prenylated flavonoids as potent phosphodiesterase-4 inhibitors from Morus alba: Isolation, modification, and structure-activity relationship study. Eur. J. Med. Chem. 2018, 144, 758–766. [Google Scholar] [CrossRef]
- Li, F.; Zhang, B.; Chen, G.; Fu, X. The novel contributors of anti-diabetic potential in mulberry polyphenols revealed by UHPLC-HR-ESI-TOF-MS/MS. Food Res. Int. 2017, 100, 873–884. [Google Scholar] [CrossRef] [PubMed]
- Naowaratwattana, W.; De-Eknamkul, W.; De Mejia, E.G. Phenolic-containing organic extracts of mulberry (Morus alba L.) leaves inhibit HepG2 hepatoma cells through G2/M phase arrest, induction of apoptosis, and inhibition of topoisomerase IIα activity. J. Med. Food 2010, 13, 1045–1056. [Google Scholar] [CrossRef] [PubMed]
- Chang, L.-W.; Juang, L.-J.; Wang, B.-S.; Wang, M.-Y.; Tai, H.-M.; Hung, W.-J.; Chen, Y.-J.; Huang, M.-H. Antioxidant and antityrosinase activity of mulberry (Morus alba L.) twigs and root bark. Food Chem. Toxicol. 2011, 49, 785–790. [Google Scholar] [CrossRef] [PubMed]
- Wang, W.; Zu, Y.; Fu, Y.; Efferth, T. In vitro antioxidant and antimicrobial activity of extracts from Morus alba L. leaves, stems and fruits. Am. J. Chin. Med. 2012, 40, 349–356. [Google Scholar] [CrossRef] [PubMed]
- Choi, S.W.; Lee, Y.J.; Ha, S.B.; Jeon, Y.H.; Leem, D.H. Evaluation of biological activity and analysis of functional constituents from different parts of mulberry (Morus alba L.) tree. J. Korean Soc. Food Sci. Nutr. 2015, 44, 823–831. [Google Scholar] [CrossRef]
- Lavola, A.; Salonen, A.; Virjamo, V.; Julkunen-Tiitto, R. Phytochemical variation in the plant-part specific phenols of wild crowberry (Empetrum hermaphroditum Hagerup) populations. Phytochem. Lett. 2017, 21, 11–20. [Google Scholar] [CrossRef]
- Abdennacer, B.; Karim, M.; Yassine, M.; Nesrine, R.; Mouna, D.; Mohamed, B. Determination of phytochemicals and antioxidant activity of methanol extracts obtained from the fruit and leaves of Tunisian Lycium intricatum Boiss. Food Chem. 2015, 174, 577–584. [Google Scholar] [CrossRef]
- Li, C.-F.; Zhu, Y.; Yu, Y.; Zhao, Q.-Y.; Wang, S.-J.; Wang, X.-C.; Yao, M.-Z.; Luo, D.; Li, X.; Chen, L.; et al. Global transcriptome and gene regulation network for secondary metabolite biosynthesis of tea plant (Camellia sinensis). BMC Genom. 2015, 16, 560. [Google Scholar] [CrossRef] [Green Version]
- Ivamoto, S.T.; Sakuray, L.M.; Ferreira, L.P.; Kitzberger, C.S.G.; Scholz, M.B.S.; Pot, D.; Leroy, T.; Vieira, L.G.E.; Domingues, D.S.; Pereira, L.F.P. Diterpenes biochemical profile and transcriptional analysis of cytochrome P450s genes in leaves, roots, flowers, and during Coffea arabica L. fruit development. Plant. Physiol. Biochem. 2017, 111, 340–347. [Google Scholar] [CrossRef] [Green Version]
- Figueiredo, A.C.; Barroso, J.G.; Pedro, L.G.; Scheffer, J.J.C. Factors affecting secondary metabolite production in plants: Volatile components and essential oils. Flavour Fragr. J. 2008, 23, 213–226. [Google Scholar] [CrossRef]
- Lunkenbein, S.; Bellido, M.; Aharoni, A.; Salentijn, E.M.J.; Kaldenhoff, R.; Coiner, H.A.; Muñoz-Blanco, J.; Schwab, W. Cinnamate Metabolism in Ripening Fruit. Characterization of a UDP-Glucose:Cinnamate Glucosyltransferase from Strawberry. Plant. Physiol. 2006, 140, 1047–1058. [Google Scholar] [CrossRef] [PubMed] [Green Version]
- Li, Y.; Kong, D.; Fu, Y.; Sussman, M.R.; Wu, H. The effect of developmental and environmental factors on secondary metabolites in medicinal plants. Plant. Physiol. Biochem. 2020, 148, 80–89. [Google Scholar] [CrossRef]
- Yudthavorasit, S.; Wongravee, K.; Leepipatpiboon, N. Characteristic fingerprint based on gingerol derivative analysis for discrimination of ginger (Zingiber officinale) according to geographical origin using HPLC-DAD combined with chemometrics. Food Chem. 2014, 158, 101–111. [Google Scholar] [CrossRef] [PubMed]
- Zhou, X.; Tang, L.; Wu, H.; Zhou, G.; Wang, T.; Kou, Z.; Li, S.; Wang, Z. Chemometric analyses for the characterization of raw and processed seeds of Descurainia sophia (L.) based on HPLC fingerprints. J. Pharm. Biomed. Anal. 2015, 111, 1–6. [Google Scholar] [CrossRef] [PubMed]
- Doh, E.-J.; Lee, G.; Jung, H.-J.; Kwon, K.-B.; Kim, J.-H. Chemotaxonomic monitoring of genetically authenticated Amomi Fructus using high-performance liquid chromatography-diode array detector with chemometric analysis. Molecules 2020, 25, 4581. [Google Scholar] [CrossRef]
- Qiu, S.; Yang, W.-Z.; Yao, C.-L.; Qiu, Z.-D.; Shi, X.-J.; Zhang, J.-X.; Hou, J.-J.; Wang, Q.-R.; Wu, W.-Y.; Guo, D.-A. Nontargeted metabolomic analysis and “commercial-homophyletic” comparison-induced biomarkers verification for the systematic chemical differentiation of five different parts of Panax ginseng. J. Chromatogr. A 2016, 1453, 78–87. [Google Scholar] [CrossRef]
- Mena, P.; Tassotti, M.; Andreu, L.; Nuncio-Jáuregui, N.; Legua, P.; Del Rio, D.; Hernández, F. Phytochemical characterization of different prickly pear (Opuntia ficus-indica (L.) Mill.) cultivars and botanical parts: UHPLC-ESI-MSn metabolomics profiles and their chemometric analysis. Food Res. Int. 2018, 108, 301–308. [Google Scholar] [CrossRef]
- Marmouzi, I.; Kharbach, M.; El Jemli, M.; Bouyahya, A.; Cherrah, Y.; Bouklouze, A.; Heyden, Y.V.; Faouzi, M.E.A. Antidiabetic, dermatoprotective, antioxidant and chemical functionalities in Zizyphus lotus leaves and fruits. Ind. Crops Prod. 2019, 132, 134–139. [Google Scholar] [CrossRef]
- Chen, Z.; Du, X.; Yang, Y.; Cui, X.; Zhang, Z.; Li, Y. Comparative study of chemical composition and active components against α-glucosidase of various medicinal parts of Morus alba L. Biomed. Chromatogr. 2018, 32, e4328. [Google Scholar] [CrossRef] [PubMed]
- Pan, Q.; Dai, Y.; Nuringtyas, T.R.; Mustafa, N.R.; Schulte, A.E.; Verpoorte, R.; Choi, Y.H. Investigation of the chemomarkers correlated with flower colour in different organs of Catharanthus roseus using NMR-based metabolomics. Phytochem. Anal. 2014, 25, 66–74. [Google Scholar] [CrossRef] [PubMed]
- Liu, M.-H.; Yang, B.-R.; Cheung, W.-F.; Yang, K.Y.; Zhou, H.-F.; Kwok, J.S.-L.; Liu, G.-C.; Li, X.-F.; Zhong, S.; Lee, S.M.-Y.; et al. Transcriptome analysis of leaves, roots and flowers of Panax notoginseng identifies genes involved in ginsenoside and alkaloid biosynthesis. BMC Genom. 2015, 16, 265. [Google Scholar] [CrossRef] [PubMed]
- Dhiman, N.; Kumar, A.; Kumar, D.; Bhattacharya, A. De novo transcriptome analysis of the critically endangered alpine Himalayan herb Nardostachys jatamansi reveals the biosynthesis pathway genes of tissue-specific secondary metabolites. Sci. Rep. 2020, 10, 17186. [Google Scholar] [CrossRef] [PubMed]
- Hunyadi, A.; Martins, A.; Hsieh, T.-J.; Seres, A.; Zupkó, I. Chlorogenic acid and rutin play a major role in the in vivo anti-diabetic activity of Morus alba leaf extract on type II diabetic rats. PLoS ONE 2012, 7, e50619. [Google Scholar] [CrossRef] [Green Version]
- Lee, W.J.; Choi, S.W. Quantitative changes of polyphenolic compounds in mulberry (Morus alba L.) leaves in relation to varieties, harvest period, and heat processing. Prev. Nutr. Food Sci. 2012, 17, 280–285. [Google Scholar] [CrossRef] [Green Version]
- Zhao, L.; Wang, D.; Liu, J.; Yu, X.; Wang, R.; Wei, Y.; Wen, C.; Ouyang, Z. Transcriptomic analysis of key genes involved in chlorogenic acid biosynthetic pathway and characterization of MaHCT from Morus alba L. Protein Expr. Purif. 2019, 156, 25–35. [Google Scholar] [CrossRef]
- Zhao, S.; Park, C.H.; Li, X.; Kim, Y.B.; Yang, J.; Sung, G.B.; Park, N.I.; Kim, S.; Park, S.U. Accumulation of rutin and betulinic acid and expression of phenylpropanoid and triterpenoid biosynthetic genes in mulberry (Morus alba L.). J. Agric. Food Chem. 2015, 63, 8622–8630. [Google Scholar] [CrossRef]
- Yu, X.; Zhu, Y.; Fan, J.; Wang, D.; Gong, X.; Ouyang, Z. Accumulation of flavonoid glycosides and UFGT gene expression in mulberry leaves (Morus alba L.) before and after frost. Chem. Biodivers. 2017, 14, e1600496. [Google Scholar] [CrossRef]
- Doi, K.; Kojima, T.; Makino, M.; Kimura, Y.; Fujimoto, Y. Studies on the constituents of the leaves of Morus alba L. Chem. Pharm. Bull. 2001, 49, 151–153. [Google Scholar] [CrossRef] [Green Version]
- Li, H.X.; Park, J.U.; Su, X.D.; Kim, K.T.; Kang, J.S.; Kim, Y.R.; Kim, Y.H.; Yang, S.Y. Identification of anti-melanogenesis constituents from Morus alba L. leaves. Molecules 2018, 23, 2559. [Google Scholar] [CrossRef] [Green Version]
- Komaikul, J.; Kitisripanya, T.; Tanaka, H.; Sritularak, B.; Putalun, W. Development of an enzyme-linked immunosorbent assay for specific detection of mulberroside A in mulberry (Morus alba L.) using anti-mulberroside A polyclonal antibody. Food Anal. Methods 2014, 7, 58–63. [Google Scholar] [CrossRef]
- Zhou, J.; Li, S.-X.; Wang, W.; Guo, X.-Y.; Lu, X.-Y.; Yan, X.-P.; Huang, D.; Wei, B.-Y.; Cao, L. Variations in the levels of mulberroside A, oxyresveratrol, and resveratrol in mulberries in different seasons and during growth. Sci. World J. 2013, 2013, 380692. [Google Scholar] [CrossRef] [PubMed] [Green Version]
- Choi, S.W.; Jang, Y.J.; Lee, Y.J.; Leem, H.H.; Kim, E.O. Analysis of functional constituents in mulberry (Morus alba L.) twigs by different cultivars, producing areas, and heat processings. Prev. Nutr. Food Sci. 2013, 18, 256–262. [Google Scholar] [CrossRef] [PubMed] [Green Version]
- Lu, H.P.; Jia, Y.N.; Yu, Y.; Xu, L. DNA protection activity of a hydroethanol extract and six polyphenol monomers from Morus alba L. (mulberry) twig. Int. J. Food Prop. 2017, 20, 2207–2219. [Google Scholar]
- Lu, H.P.; Jia, Y.N.; Peng, Y.L.; Yu, Y.; Sun, S.L.; Yue, M.T.; Pan, M.H.; Zeng, L.S.; Xu, L. Oxyresveratrol, a stilbene compound from Morus alba L. twig extract active against Trichophyton rubrum. Phytother. Res. 2017, 31, 1842–1848. [Google Scholar] [CrossRef] [PubMed]
- Nomura, T.; Fukai, T. Kuwanon G, a new flavone derivative from the root barks of the cultivated mulberry tree (Morus alba L.). Chem. Pharm. Bull. 1980, 28, 2548–2552. [Google Scholar] [CrossRef] [Green Version]
- Park, K.M.; You, J.S.; Lee, H.Y.; Baek, N.I.; Hwang, J.K. Kuwanon G: An antibacterial agent from the root bark of Morus alba against oral pathogens. J. Ethnopharmacol. 2003, 84, 181–185. [Google Scholar] [CrossRef]
- Nomura, T.; Hano, Y.; Fukai, T. Chemistry and biosynthesis of isoprenylated flavonoids from Japanese mulberry tree. Proc. Jpn. Acad. Ser. B 2009, 85, 391–408. [Google Scholar] [CrossRef] [Green Version]
- Lim, H.J.; Jin, H.-G.; Woo, E.-R.; Lee, S.K.; Kim, H.P. The root barks of Morus alba and the flavonoid constituents inhibit airway inflammation. J. Ethnopharmacol. 2013, 149, 169–175. [Google Scholar] [CrossRef]
- Nomura, T. The chemistry and biosynthesis of isoprenylated flavonoids from moraceous plants. Pure Appl. Chem. 1999, 71, 1115–1118. [Google Scholar] [CrossRef]
- Gupta, G.; Dua, K.; Kazmi, I.; Anwar, F. Anticonvulsant activity of morusin isolated from Morus alba: Modulation of GABA receptor. Biomed. Aging Pathol. 2014, 4, 29–32. [Google Scholar] [CrossRef]
- Zhu, W.; Zhong, Z.; Liu, S.; Yang, B.; Komatsu, S.; Ge, Z.; Tian, J. Organ-specific analysis of Morus alba using a gel-free/label-free proteomic technique. Int. J. Mol. Sci. 2019, 20, 365. [Google Scholar] [CrossRef] [Green Version]
- Li, Y.; Li, J.; Qian, B.; Cheng, L.; Xu, S.; Wang, R. De novo biosynthesis of p-coumaric acid in E. coli with a trans-cinnamic acid 4-hydroxylase from the Amaryllidaceae Plant Lycoris aurea. Molecules 2018, 23, 3185. [Google Scholar] [CrossRef] [PubMed] [Green Version]
- Teng, H.; Lee, W.Y. Optimization of microwave-assisted extraction of polyphenols from mulberry fruits (Morus alba L.) using response surface methodology. J. Korean Soc. Appl. Biol. Chem. 2013, 56, 317–324. [Google Scholar] [CrossRef]
- Natić, M.M.; Dabić, D.Č.; Papetti, A.; Fotirić Akšić, M.M.; Ognjanov, V.; Ljubojević, M.; Tešić, Ž.L. Analysis and characterisation of phytochemicals in mulberry (Morus alba L.) fruits grown in Vojvodina, North Serbia. Food Chem. 2015, 171, 128–136. [Google Scholar] [CrossRef] [PubMed]
- Zhang, L.; Tao, G.; Chen, J.; Zheng, Z.P. Characterization of a new flavone and tyrosinase inhibition constituents from the twigs of Morus alba L. Molecules 2016, 21, 1130. [Google Scholar] [CrossRef] [Green Version]
- Yang, J.; Wen, H.; Zhang, L.; Zhang, X.; Fu, Z.; Li, J. The influence of ripening stage and region on the chemical compounds in mulberry fruits (Morus atropurpurea Roxb.) based on UPLC-QTOF-MS. Food Res. Int. 2017, 100, 159–165. [Google Scholar] [CrossRef]
Sample Availability: Samples are not available from the authors. |


| Compound | tR (min) | UV (nm) | Regression Equation | Linear Range (μg/mL) | r2 | LOD (μg/mL) | LOQ (μg/mL) |
|---|---|---|---|---|---|---|---|
| Skimmin (1) | 9.72 | 325 | y = 7.885x + 3.792 | 1.88–30.00 | 0.9998 | 0.47 | 1.56 |
| Mulberroside A (2) | 10.70 | 325 | y = 12.651x + 10.932 | 9.38–600.00 | 1.0000 | 0.59 | 1.95 |
| Chlorogenic acid (3) | 13.42 | 325 | y = 26.686x + 43.967 | 10.94–700.00 | 0.9993 | 0.68 | 2.28 |
| 4-Hydroxycinnamic acid (4) | 26.11 | 310 | y = 86.121x + 0.582 | 0.31–10.00 | 1.0000 | 0.08 | 0.26 |
| Rutin (5) | 30.47 | 255 | y = 17.363x + 23.435 | 4.38–280.00 | 0.9996 | 0.14 | 0.46 |
| Taxifolin (6) | 31.13 | 290 | y = 31.091x + 3.466 | 0.63–20.00 | 0.9998 | 0.16 | 0.52 |
| Isoquercitrin (7) | 31.75 | 255 | y = 23.558x − 7.984 | 4.69–150.00 | 1.0000 | 0.15 | 0.49 |
| Oxyresveratrol (8) | 33.80 | 325 | y = 48.105x − 4.063 | 3.13–200.00 | 1.0000 | 0.10 | 0.33 |
| Astragalin (9) | 34.54 | 265 | y = 26.060x − 1.994 | 1.56–100.00 | 1.0000 | 0.10 | 0.33 |
| Quercitrin (10) | 34.74 | 255 | y = 29.297x + 2.644 | 0.78–50.00 | 0.9999 | 0.10 | 0.33 |
| Kuwanon G (11) | 56.83 | 265 | y = 16.023x + 2.815 | 3.13–200.00 | 0.9999 | 0.20 | 0.65 |
| Morusin (12) | 68.62 | 275 | y = 38.191x + 7.181 | 2.34–150.00 | 0.9999 | 0.07 | 0.24 |
Publisher’s Note: MDPI stays neutral with regard to jurisdictional claims in published maps and institutional affiliations. |
© 2020 by the authors. Licensee MDPI, Basel, Switzerland. This article is an open access article distributed under the terms and conditions of the Creative Commons Attribution (CC BY) license (http://creativecommons.org/licenses/by/4.0/).
Share and Cite
Kim, J.-H.; Doh, E.-J.; Lee, G. Quantitative Comparison of the Marker Compounds in Different Medicinal Parts of Morus alba L. Using High-Performance Liquid Chromatography-Diode Array Detector with Chemometric Analysis. Molecules 2020, 25, 5592. https://doi.org/10.3390/molecules25235592
Kim J-H, Doh E-J, Lee G. Quantitative Comparison of the Marker Compounds in Different Medicinal Parts of Morus alba L. Using High-Performance Liquid Chromatography-Diode Array Detector with Chemometric Analysis. Molecules. 2020; 25(23):5592. https://doi.org/10.3390/molecules25235592
Chicago/Turabian StyleKim, Jung-Hoon, Eui-Jeong Doh, and Guemsan Lee. 2020. "Quantitative Comparison of the Marker Compounds in Different Medicinal Parts of Morus alba L. Using High-Performance Liquid Chromatography-Diode Array Detector with Chemometric Analysis" Molecules 25, no. 23: 5592. https://doi.org/10.3390/molecules25235592