
The mRNA landscape profiling reveals potential biomarkers associated with acute kidney injury AKI after kidney transplantation
- Published
- Accepted
- Received
- Academic Editor
- Zhaohui Qin
- Subject Areas
- Bioinformatics, Biotechnology, Nephrology, Surgery and Surgical Specialties, Medical Genetics
- Keywords
- Acute kidney injury, Biomarkers, Diagnosis, Kidney transplantation
- Copyright
- © 2020 Bi et al.
- Licence
- This is an open access article distributed under the terms of the Creative Commons Attribution License, which permits using, remixing, and building upon the work non-commercially, as long as it is properly attributed. For attribution, the original author(s), title, publication source (PeerJ) and either DOI or URL of the article must be cited.
- Cite this article
- 2020. The mRNA landscape profiling reveals potential biomarkers associated with acute kidney injury AKI after kidney transplantation. PeerJ 8:e10441 https://doi.org/10.7717/peerj.10441
Abstract
Background
This study aims to identify potential biomarkers associated with acute kidney injury (AKI) post kidney transplantation.
Material and Methods
Two mRNA expression profiles from Gene Expression Omnibus repertory were downloaded, including 20 delayed graft function (DGF) and 68 immediate graft function (IGF) samples. Differentially expressed genes (DEGs) were identified between DGF and IGF group. The Gene Ontology and Kyoto Encyclopedia of Genes and Genomes pathway analysis of DEGs were performed. Then, a protein-protein interaction analysis was performed to extract hub genes. The key genes were searched by literature retrieval and cross-validated based on the training dataset. An external dataset was used to validate the expression levels of key genes. Receiver operating characteristic curve analyses were performed to evaluate diagnostic performance of key genes for AKI.
Results
A total of 330 DEGs were identified between DGF and IGF samples, including 179 up-regulated and 151 down-regulated genes. Of these, OLIG3, EBF3 and ETV1 were transcription factor genes. Moreover, LEP, EIF4A3, WDR3, MC4R, PPP2CB, DDX21 and GPT served as hub genes in PPI network. EBF3 was significantly up-regulated in validation GSE139061 dataset, which was consistently with our initial gene differential expression analysis. Finally, we found that LEP had a great diagnostic value for AKI (AUC = 0.740).
Conclusion
EBF3 may be associated with the development of AKI following kidney transplantation. Furthermore, LEP had a good diagnostic value for AKI. These findings provide deeper insights into the diagnosis and management of AKI post renal transplantation.
Background
Kidney transplantation currently is an operative therapeutic strategy for patients undergoing advanced renal disease (Wolfe et al., 1999; Yunhua et al., 2018). Although effective pharmaceutical interventions after surgery greatly improve survival prognosis of renal transplantation recipients, many risk factors, such as immune injury and ischemia-reperfusion injury, inevitably cause kidney allograft rejection (Cantaluppi et al., 2015; Meier-Kriesche et al., 2004). Emerging evidence has demonstrated that acute kidney injury (AKI) is the most common symptom in deceased patients and leads to a relatively high incidence of delayed graft function (DGF) (Kim et al., 2017; Wu et al., 2014). Notably, DGF is typically observed in the first week post renal transplant and predominately associated with graft rejection (Siedlecki, Irish & Brennan, 2011). The statistical data suggests that the occurrence rate of DGF was approximately 4%–10% in living donor transplants and 5–50% in deceased donor transplants (Yarlagadda et al., 2008). Therefore, it is a pressing need to screen several powerful biomarkers for early assessment and prediction of kidney function after kidney transplantation, which will provide early clinical decision support and improve survival.
Numerous studies are currently ongoing to identify effective molecular markers to predict AKI following renal transplantation. For example, serum creatinine is typically used for the assessment of kidney function in a clinical context. Its level generally is not elevated until 50% of kidney function is lost (Lee et al., 2012). However, renal function will be seriously damaged when serum creatinine level is increased. Therefore, serum creatinine cannot reflect the degree of impaired kidney function. Existing evidence has demonstrated that NGAL (neutrophil gelatinase-associated lipocalin) is a generally acknowledged biomarker for the progression of AKI (Haase et al., 2009; Korbely et al., 2011). Mishra et al. (2006) examined the expression of NGAL in biopsy specimens after transplantation of cadaveric and living-related renal allografts. They found that NGAL level was markedly elevated in cadaveric samples than living-related samples. More interestingly, NGAL staining in early cadaveric biopsies was closely related to peak postoperative serum creatinine (Mishra et al., 2006).
However, the detailed role of this gene in AKI development after kidney transplantation has not been completely fully elucidated, restricting its potential clinical application. Notably, the extensive popularization and application of high throughput sequencing provides a new approach for the identification of biomarkers-related AKI. Wilflingseder et al. (2014) emphasized that SLPI and miR-182-5p may play important roles in post-transplant AKI by analyzing the whole-genome mRNA and miRNA expression profiles of kidney transplant recipient with AKI. Unfortunately, the underlying molecular mechanism of AKI following kidney transplantation has not been extensively investigated.
In this study, we performed an integrated bioinformatics analysis to identify potential novel gene signatures related to AKI after kidney transplantation using two gene expression profiles, which will supply a research basis for AKI prediction in the clinical practice and contribute to deeper understanding of pathogenesis mechanism of AKI after renal transplantation.
Materials and Methods
Data collection and pre-processing
Two microarray datasets (GSE53769 and GSE37838) were retrieved and obtained from the National Center for Biotechnology Information Gene Expression Omnibus (GEO) (http://www.ncbi.nlm.nih.gov/geo/) repository. The GSE53769 dataset contained 18 samples (8 DGF samples and 10 IGF samples) and these samples were subjected to GPL16686 [HuGene-2_0-st] Affymetrix Human Gene 2.0 ST Array for sequencing. For the GSE37838 dataset, there were 70 samples, including 12 DGF samples and 58 immediate graft function (IGF) samples. The platform for this dataset was GPL570 [HG-U133_Plus_2] Affymetrix Human Genome U133 Plus 2.0 Array. Afterwards, the raw data was standardized based on fragments per kilobase million and normalized by quantile normalization method, respectively. The expression files were further processed according to the following criteria: (1) the probes that mapped to multiple genes were removed during annotation processes; (2) for the genes matched by multiple probes, the probe with maximum expression value was retained. In total 31,135 genes and 51,877 genes were respectively obtained in GSE53769 and GSE37838. Finally, 18,651 overlapping genes were extracted between these two datasets and used for following analysis.
DEGs identification and functional analyses
We used the limma and metaMA package in R 3.6.2 software to screen differentially expressed genes (DEGs) between DGF and IGF samples according to the cutoff value of P value < 0.05 (Marot et al., 2009). Herein, raw data was processed using removeBatchEffect() function in limma package to eliminate the batch effect from sample preparation, library preparation and sequencing. The inverse normal method was utilized for P value combination in meta-analysis. The heatmap of top 50 DEGs was plotted by R_boxplot() function. In addition, Gene Ontology (GO) and Kyoto Encyclopedia of Genes and Genomes (KEGG) pathway analysis of DEGs were performed using GOstats and KEGG.db package in R3.6.2 based on the threshold of P value < 0.01. Here, the GO analysis contained three categories: molecular function (MF), cellular component (CC) and biological process (BP).
Protein–protein interaction (PPI) analysis
To explore whether there were close interactions among protein products of DEGs, we carried out a PPI analysis of DEGs using the Search Tool for the Retrieval of Interacting Genes/Proteins (STRING) database, which provides an online PPI prediction analysis (Szklarczyk et al., 2015). All DEGs were considered as the input gene set. A PPI network was established and visualized by Cytoscape software (http://apps.cytoscape.org/apps/cytonca). Moreover, topological feature of this network was evaluated by degree centrality score of nodes. A high node score indicated this protein had a key role in this network and acted as the hub genes in network. The top seven nodes were listed.
Validation analysis of key DEGs and receiver operating characteristic (ROC) analysis
The seven hub genes and three transcription factor genes were considered as candidates in following analysis. Firstly, these genes were searched in Pubmed to investigate whether they had been reported to be associated with AKI. Then, the cross validation for these genes was carried out using createFolds() function in caret package based on the training datasets (GSE37838 and GSE53769). Subsequently, the expression of these ten genes were examined in another GEO dataset. Specifically, the GSE139061 dataset, including 39 AKI renal biopsy samples and nine nephrectomies, was obtained from GEO database, which was generated based on Illumina HiSeq 4000 platform. This dataset was then used to evaluate the expression levels of key DEGs. P value < 0.05 indicates a statistically significant difference. In addition, the pROC package (https://cran.r-project.org/web/packages/pROC/index.html) in R 3.6.2 was used to perform ROC analysis to assess the diagnostic performance of key DEGs for AKI. The area under the ROC curve (AUC) value was calculated. Herein, if AUC values of the genes were greater than 0.7, these genes will be considered to discriminate AKI samples from controls with high specificity and sensitivity (Lin et al., 2015; Mandrekar, 2010).
Results
DEGs screening
After data pre-processing, no DEGs were identified based on the screening threshold of adjusted P value < 0.05. Our results showed that a total of 330 DEGs between DGF and IGF samples were extracted according to the screening criteria of P value < 0.05, which contained 179 up-regulated genes and 151 down-regulated genes (Supplemental Information). Among these, up-regulated OLIG3 (oligodendrocyte transcription factor 3) and EBF3 (early B-cell factor transcription factor 3) as well as down-regulated ETV1 (E twenty-six variant transcription factor 1) were three transcription factor genes. The heatmaps of top 50 DEGs were exhibited in Fig. 1, which indicated that these genes can distinguish DGF and IGF samples in GSE53769 and GSE37838.
GO and KEGG enrichment analysis
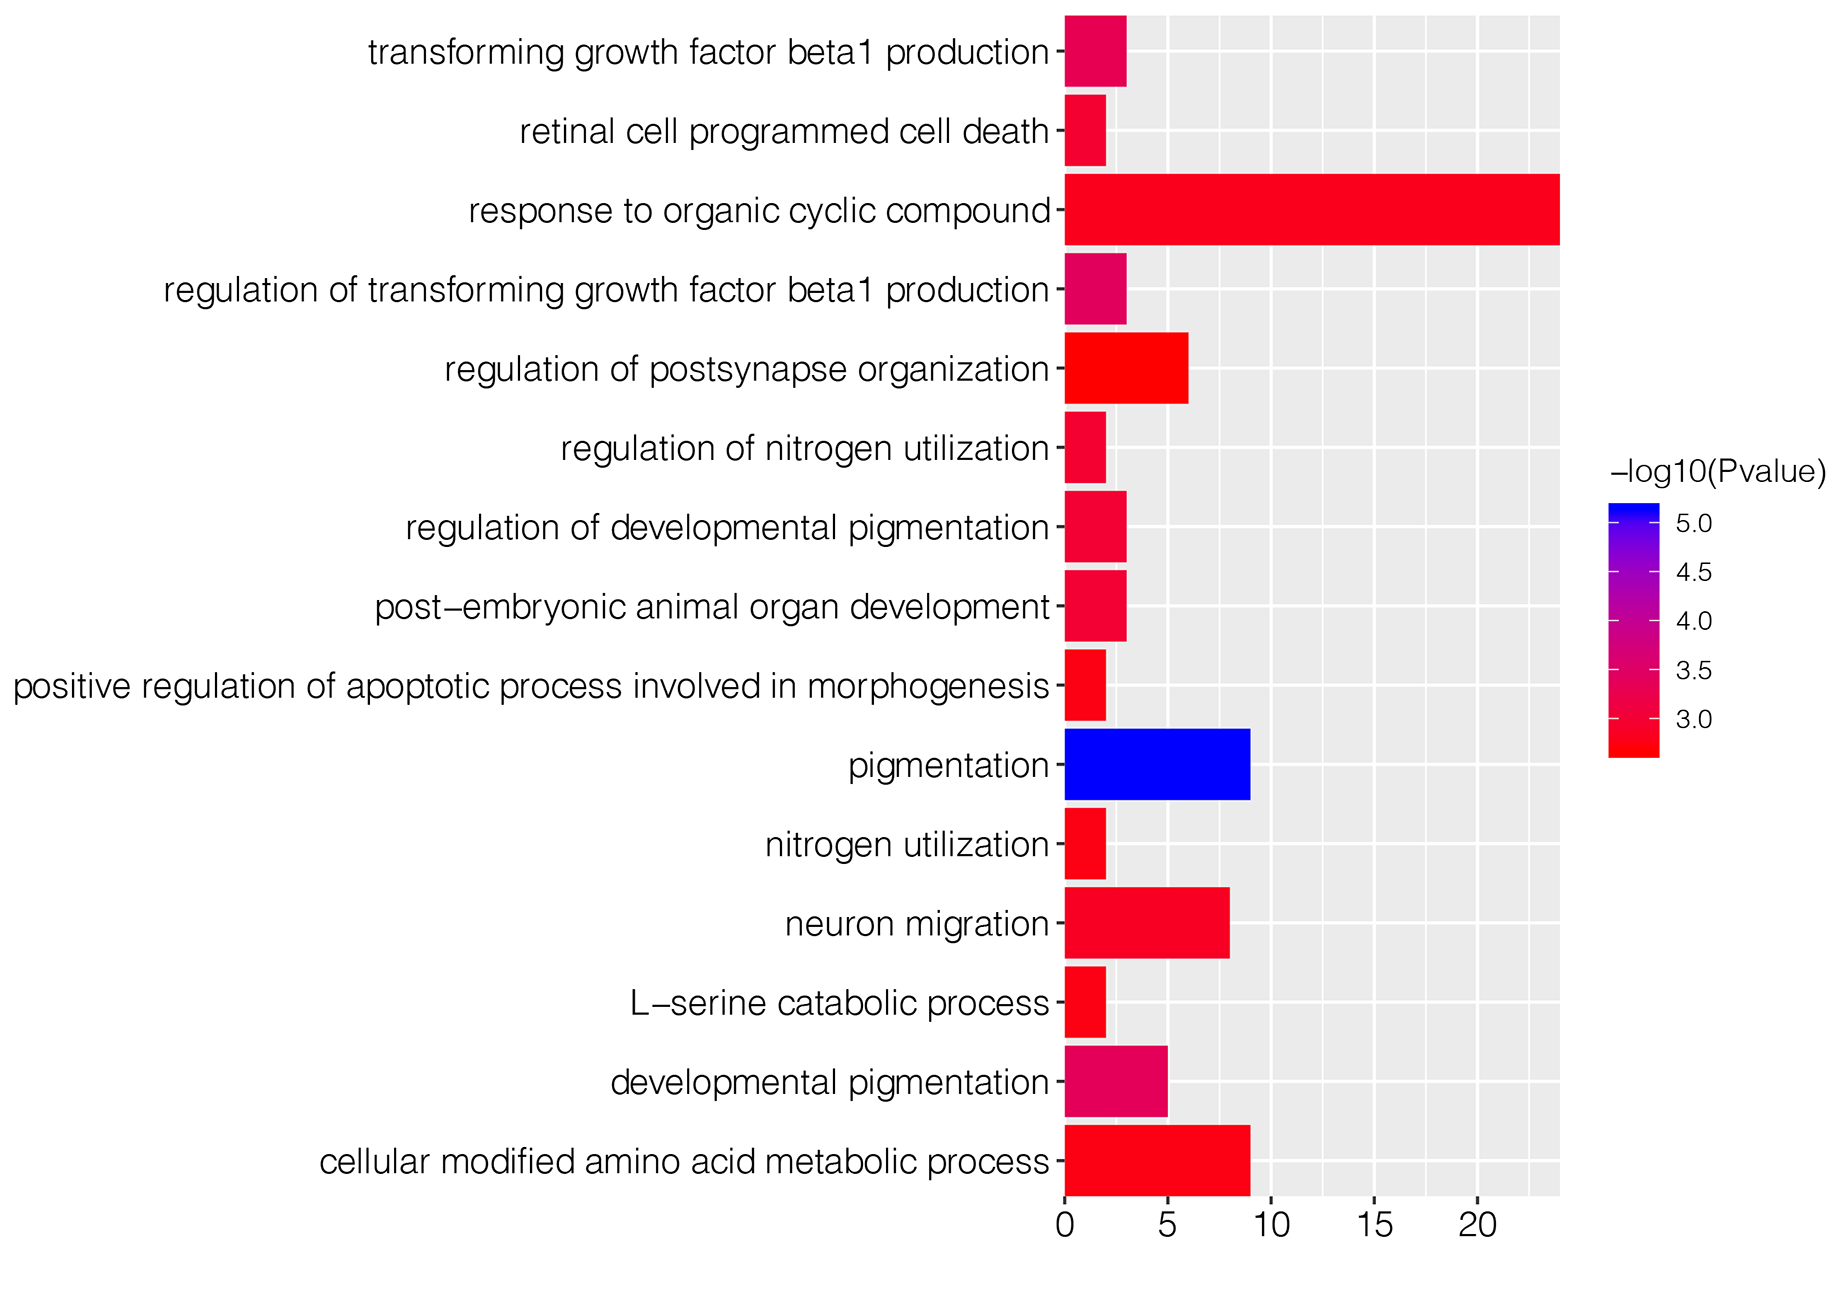
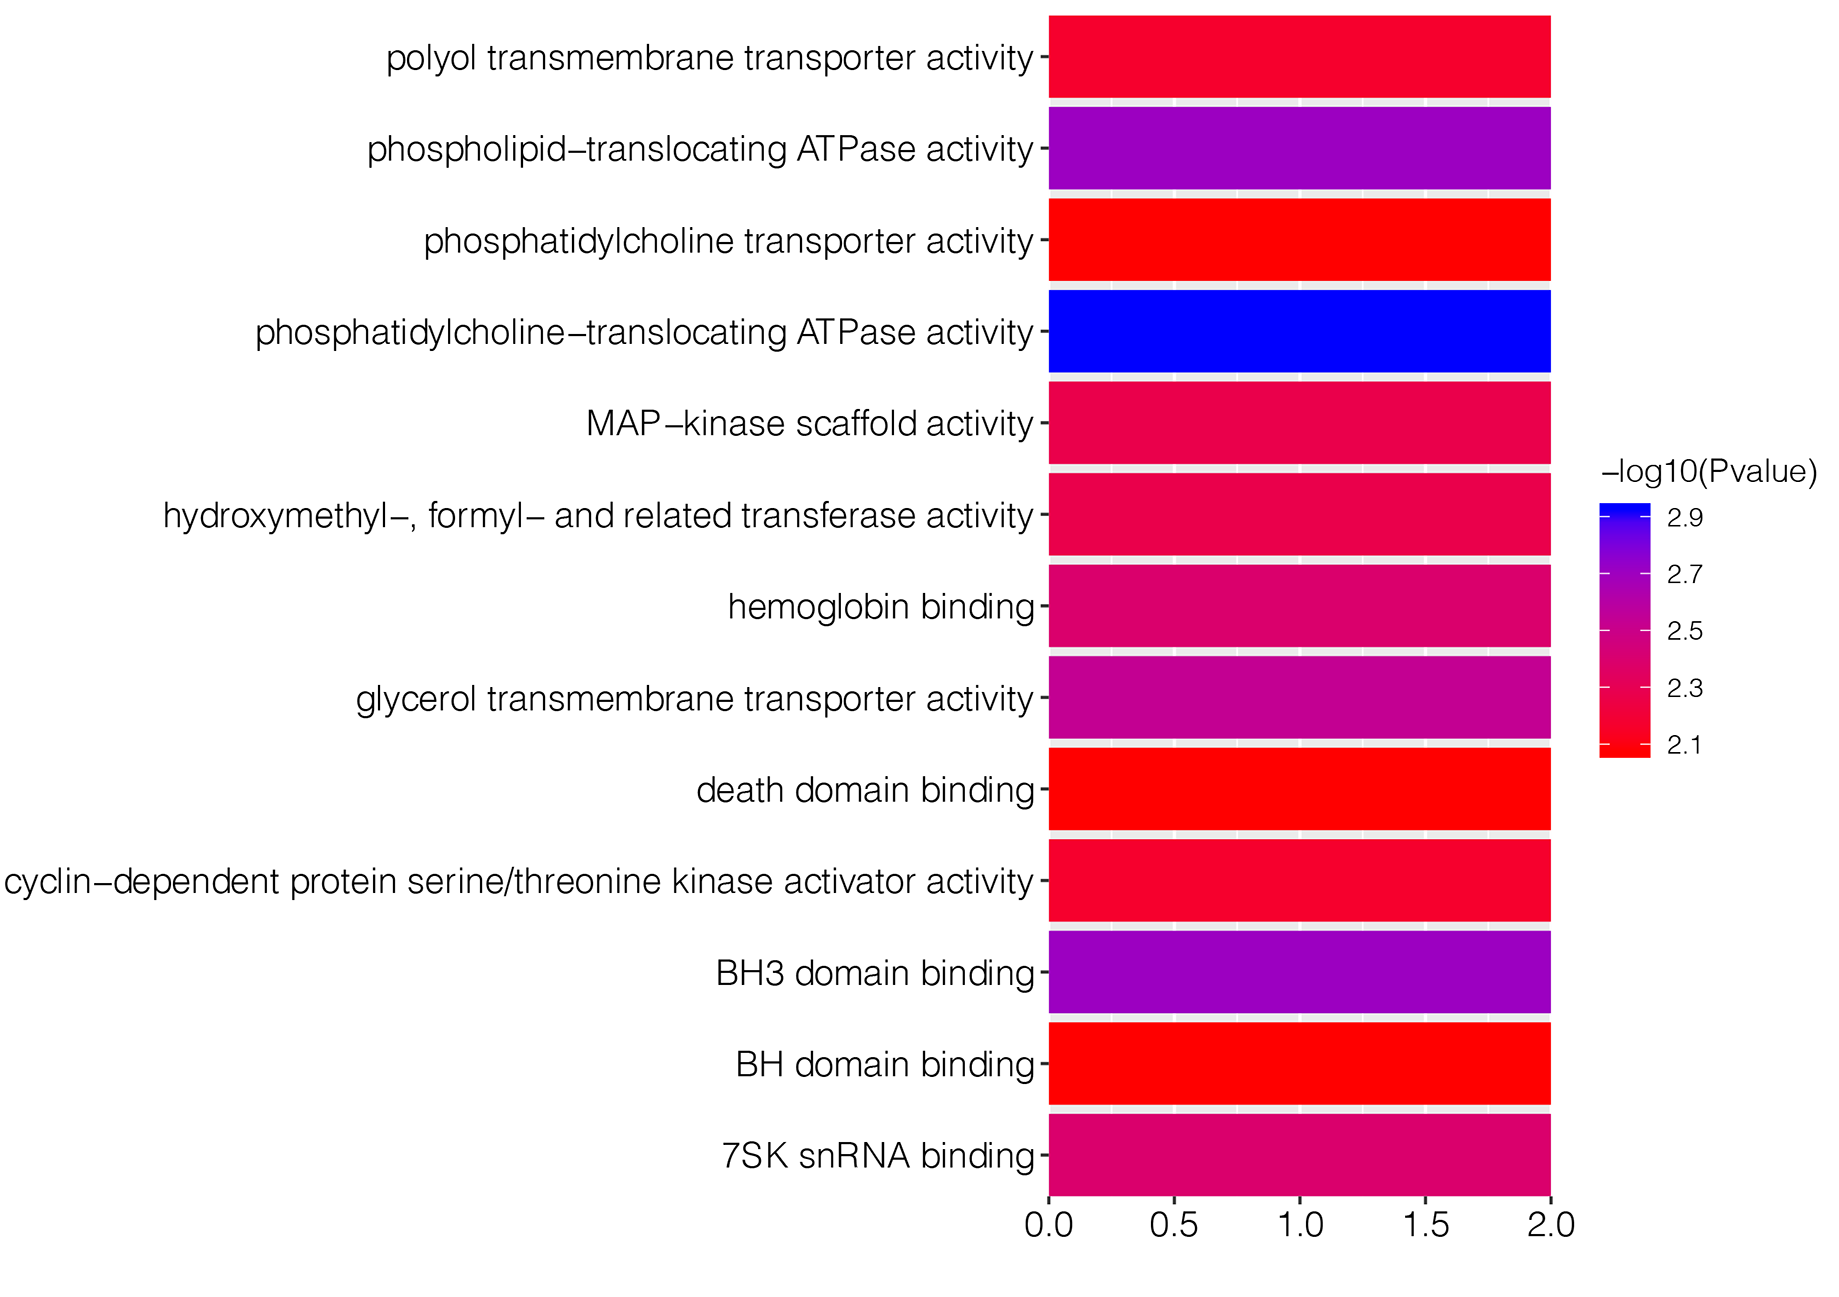
To explore underlying biological function of identified DEGs, the GO and KEGG enrichment analysis were carried out. The results revealed that these DEGs were significantly enriched in 67 GO-BP terms, such as pigmentation (P = 7.36E−06), regulation of transforming growth factor beta1 production (P = 0.0004) and developmental pigmentation (P = 0.0005; Table 1). Fig. S1 showed top 15 markedly enriched GO-BP terms. Meanwhile, there were 13 significant GO-MF terms, including phosphatidylcholine-translocating ATPase activity (P = 0.001), phospholipid-translocating ATPase activity (P = 0.002) and BH3 domain binding (P = 0.002; Table 1; Fig. S2). We also found that numerous DEGs were closely associated with three GO-CC terms (pore complex, P = 0.003; outer dynein arm, P = 0.005; nuclear speck, P = 0.006; Table 1; Fig. S3). Besides, KEGG enrichment analysis suggested that the DEGs were involved in cyanoamino acid metabolism pathway (P = 0.004; Table 1).
PPI network analysis
A PPI network of DEGs was constructed based on the STRING database as displayed in Fig. 2, containing 182 gene nodes (102 up-regulated genes and 80 down-regulated genes). The top seven gene nodes were considered as hub gene in PPI network, which included LEP (leptin; up-regulation; degree = 13), EIF4A3 (eukaryotic translation initiation factor 4A3; down-regulation; degree = 10), WDR3 (WD repeat domain 3; up-regulation; degree = 8), MC4R (melanocortin 4 receptor; down-regulation; degree = 8), PPP2CB (protein phosphatase 2 catalytic subunit beta; up-regulation; degree = 8), DDX21 (DExD-Box Helicase 21; down-regulation; degree = 8) and GPT (glutamic-pyruvic transaminase; down-regulation; degree = 8). Notably, transcription factor gene ETV1 was also involved in PPI network (degree = 1).
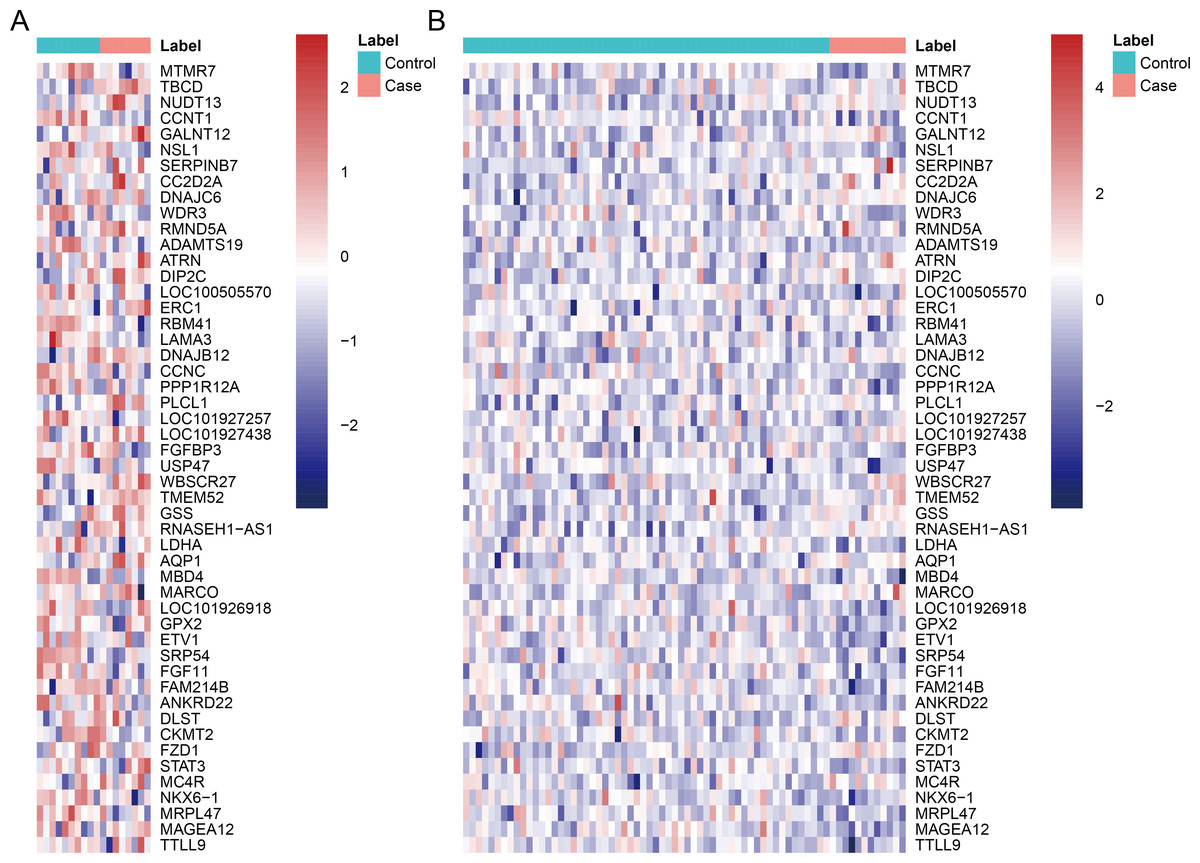
Figure 1: The heatmap of top 50 differentially expressed genes.
(A) The top 50 differentially expressed genes can distinguish DGF and IGF samples in GSE53769; (B) the top 50 differentially expressed genes can distinguish DGF and IGF samples in GSE37838. DGF delayed graft function; IGF immediate graft function.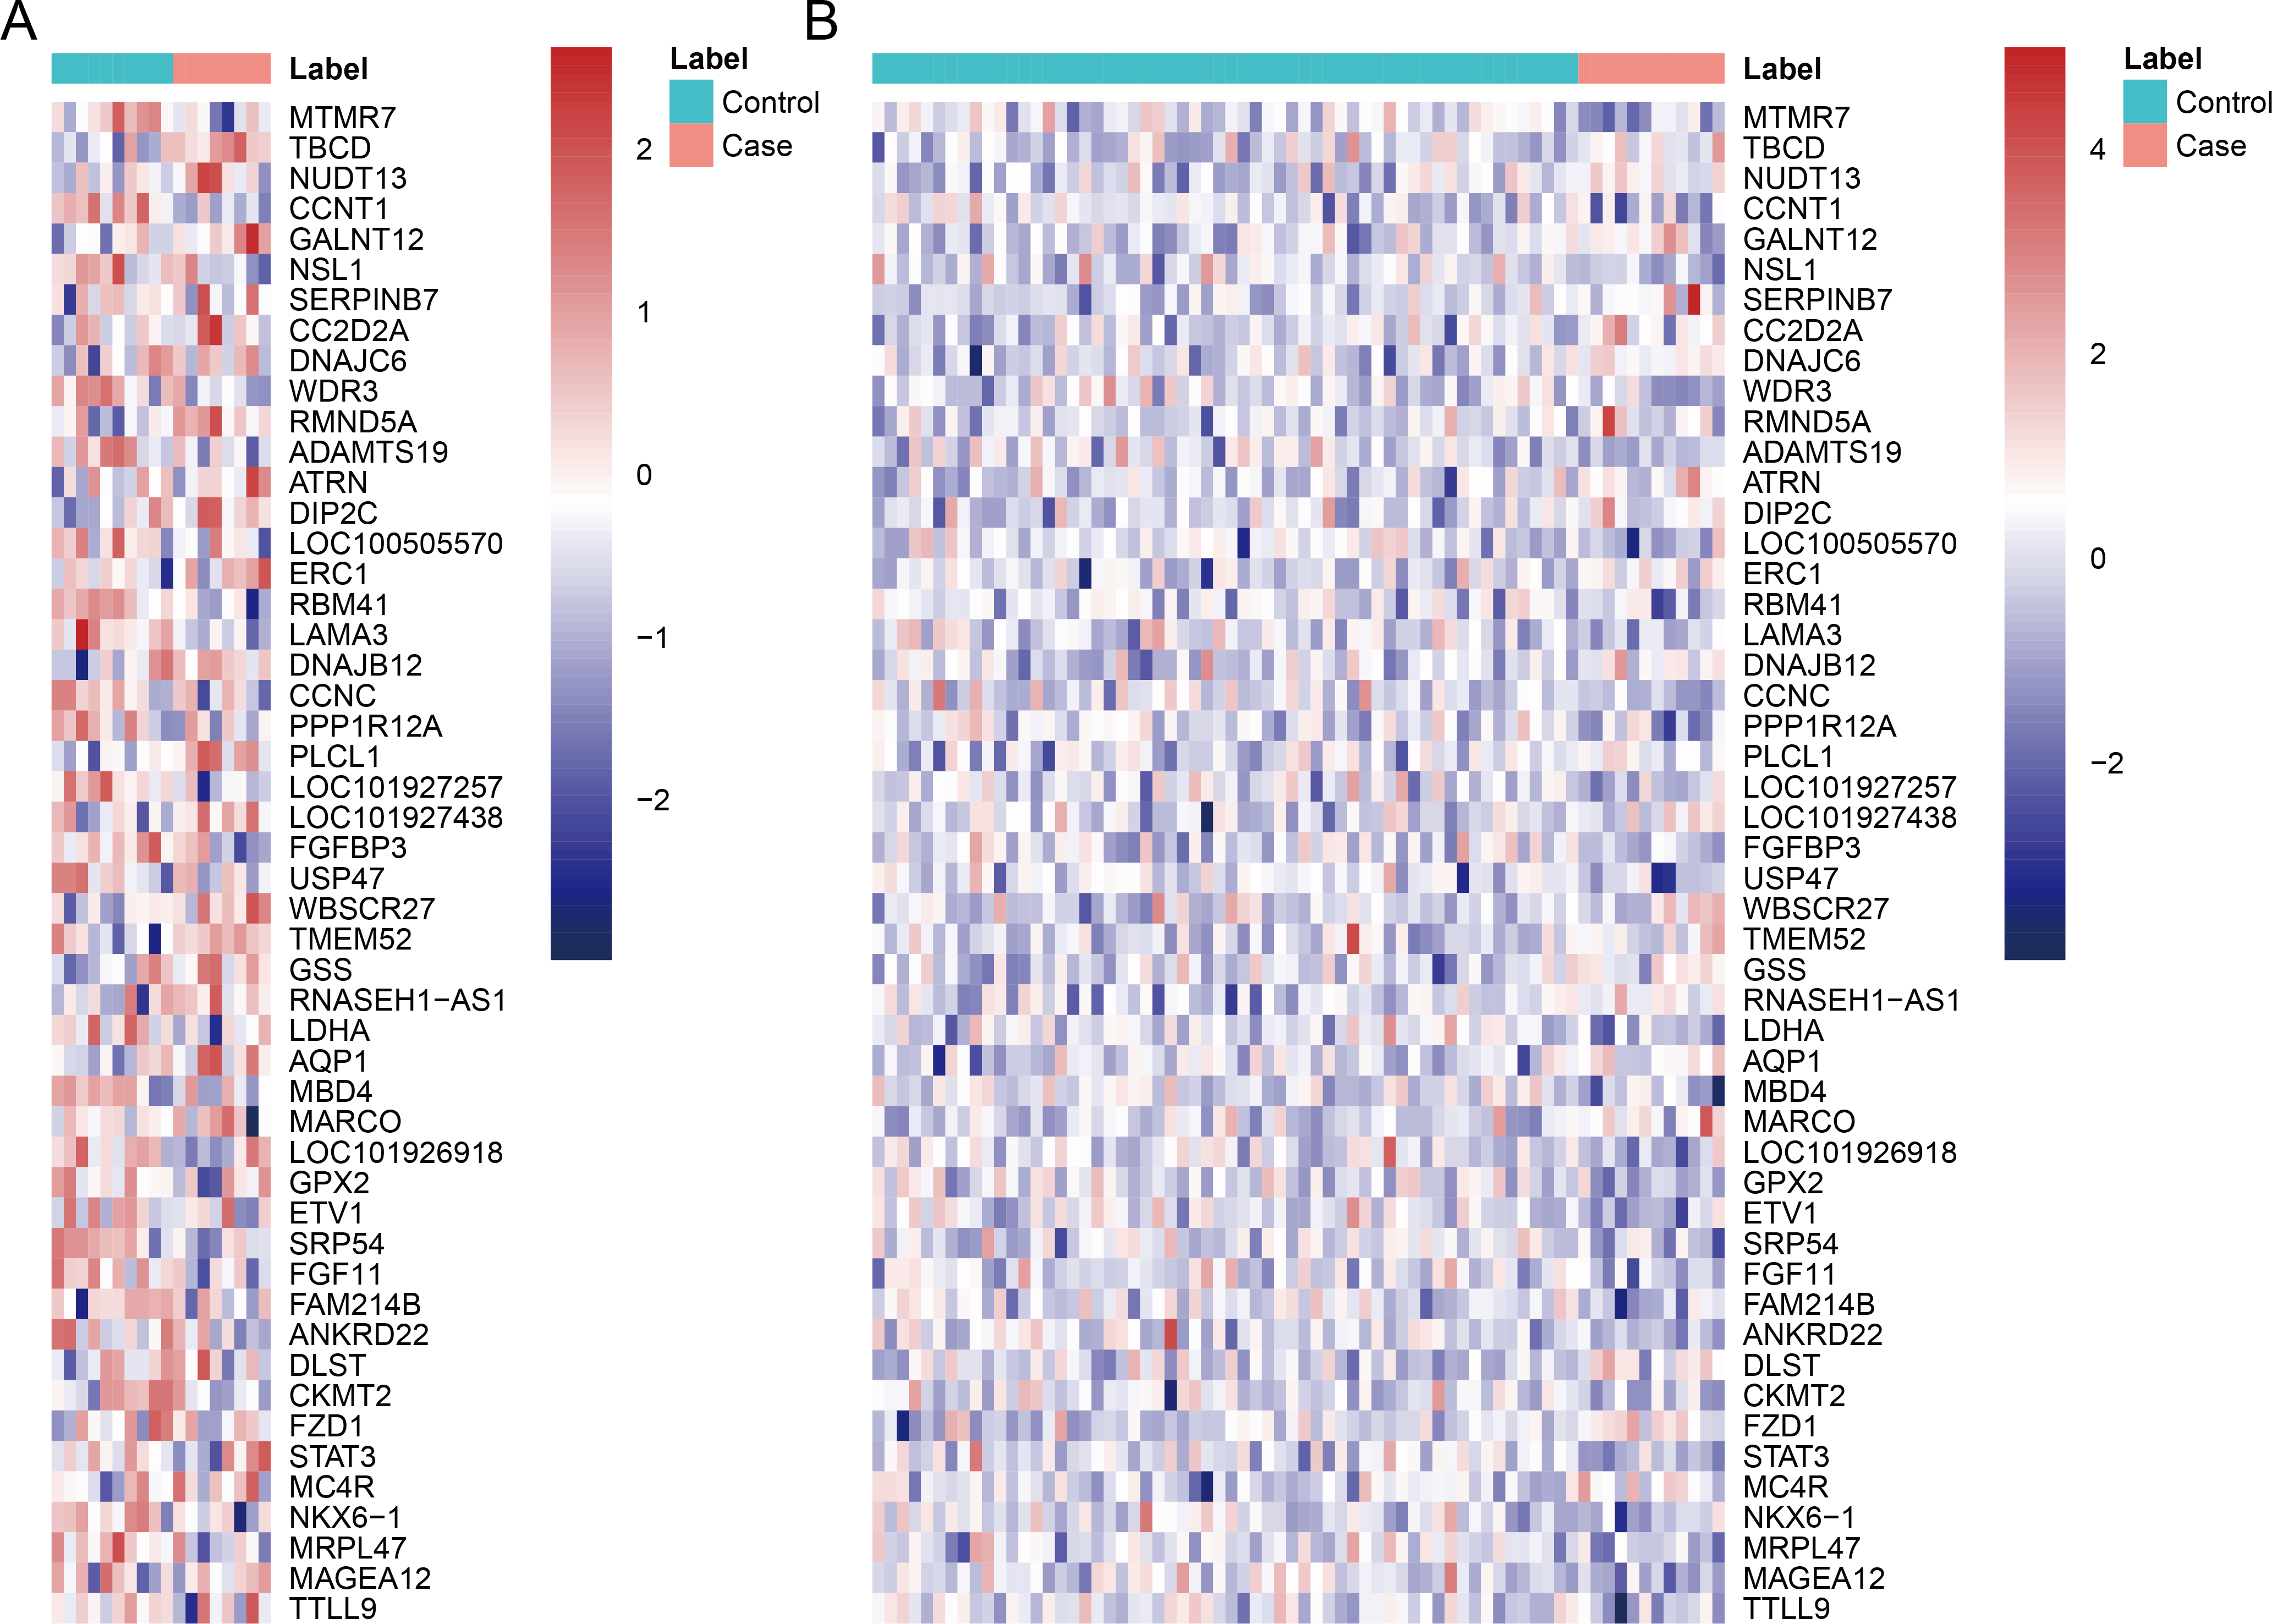
Validation of key DEGs and ROC analysis
Three transcription factors and seven hub genes in PPI network were regarded as key biomarkers associated with AKI and subjected to further analysis. By literature mining, we found that ETV1, LEP, PPP2CB and GPT have been reported in several kidney-related studies (Table 2). In addition, the average accuracy of ten-fold cross validation analysis for ten feature genes was 0.829 in GSE37838 dataset. However, cross validation for these genes was not performed in the GSE53769 due to the limited sample size. Subsequently, an external dataset (GSE13906) was downloaded from the GEO database to verify the expression levels of key genes (EBF3, LEP ETV1, EIF4A3, DDX21 and GPT). The results suggested that only EBF3 was significantly up-regulated, which was consistently with our initial gene differential expression analysis (P = 0.01; Fig. 3). Other genes results did not reach statistical significance (P > 0.05), which can be partly explained by sample size and selection bias.
| Category | Term | Pvalue | Count | Gene Symbol |
|---|---|---|---|---|
| GO-BP* | Pigmentation | 7.36E−06 | 9 | SPNS2; MYO7A; BAX; RAB1A; BCL2; HPS6; VANGL1; ATRN; CD63 |
| Regulation of transforming growth factor beta1 production | 0.0004 | 3 | GATA6; THBS1; SERPINB7 | |
| Developmental pigmentation | 0.0004 | 5 | SPNS2; BAX; BCL2; HPS6; CD63 | |
| Transforming growth factor beta1 production | 0.0005 | 3 | GATA6; THBS1; SERPINB7 | |
| Regulation of developmental pigmentation | 0.0010 | 3 | SPNS2; BAX; BCL2 | |
| Post-embryonic animal organ development | 0.0010 | 3 | LDHA; MYO7A; BAX | |
| Regulation of nitrogen utilization | 0.0011 | 2 | BAX; BCL2 | |
| Retinal cell programmed cell death | 0.0011 | 2 | BAX; BCL2 | |
| Neuron migration | 0.0014 | 8 | OLIG3; ASTN1; NKX6-1; NRCAM; ULK4; SH3RF1; BAX; NRP2 | |
| Response to organic cyclic compound | 0.0016 | 24 | AKAP13; CATSPER1; RFTN2; ABCA1; ALAD; FOXF1; GABRB3; AQP1; LDHA; LEP; ARRB2; MSN; DHH; TRIM68; MAVS; RBBP8; BCL2; SHMT1; THBS1; WNT8B; PIAS1; MBD4; DDX21; EIF4A3 | |
| L-serine catabolic process | 0.0018 | 2 | SHMT1; CBS | |
| Nitrogen utilization | 0.0018 | 2 | BAX; BCL2 | |
| Positive regulation of apoptotic process involved in morphogenesis | 0.0018 | 2 | BAX; TNFRSF1B | |
| Cellular modified amino acid metabolic process | 0.0018 | 9 | AHCYL1; CGA; HOGA1; CKMT2; GGT6; ALDH1L2; GSS; GCNT4; SHMT1 | |
| Regulation of postsynapse organization | 0.0021 | 6 | CUX2; NRCAM; LRFN1; CBLN1; NRP2; KALRN | |
| GO-MF | Phosphatidylcholine-translocating ATPase activity | 0.0012 | 2 | ABCA1; ABCB1 |
| Phospholipid-translocating ATPase activity | 0.0020 | 2 | ABCA1; ABCB1 | |
| BH3 domain binding | 0.0020 | 2 | BAX; BCL2 | |
| Glycerol transmembrane transporter activity | 0.0029 | 2 | AQP1; AQP10 | |
| Hemoglobin binding | 0.0040 | 2 | HP; AHSP | |
| 7SK snRNA binding | 0.0040 | 2 | CCNT1; DDX21 | |
| MAP-kinase scaffold activity | 0.0053 | 2 | AKAP13; SH3RF1 | |
| Hydroxymethyl-, formyl- and related transferase activity | 0.0053 | 2 | ALDH1L2; SHMT1 | |
| Polyol transmembrane transporter activity | 0.0068 | 2 | AQP1; AQP10 | |
| Cyclin-dependent protein serine/threonine kinase activator activity | 0.0068 | 2 | CKS2; CCNT1 | |
| Phosphatidylcholine transporter activity | 0.0084 | 2 | ABCA1; ABCB1 | |
| BH domain binding | 0.0084 | 2 | BAX; BCL2 | |
| Death domain binding | 0.0084 | 2 | BAX; BCL2 | |
| GO-CC | Pore complex | 0.0032 | 3 | BAX; BCL2; C9 |
| Outer dynein arm | 0.0045 | 2 | DNAH5; DNAI1 | |
| Nuclear speck | 0.0063 | 12 | SF3B2; NOSTRIN; ZCCHC12; NSL1; GPATCH2; PRPF40A; RREB1; SRP54; PIAS1; STK19; MBD4; EIF4A3 | |
| KEGG | Cyanoamino acid metabolism | 0.0044 | 2 | SHMT1; GGT6 |
Notes:
- GO
-
Gene Ontology
- BP
-
Biological Process
- MF
-
Molecular Function
- CC
-
Cellular Component
- KEGG
-
Kyoto Encyclopedia of Genes and Genomes
Figure 2: Protein-protein interaction (PPI) network of DEGs.
The node size represents the degree score. DEGs differentially expressed genes.
| Symbol | Regulation | Pubmed ID and Related diseases | Detail |
|---|---|---|---|
| ETV1 | Up-regulation | 27278120; Renal cell carcinoma | Transcription factor, PPI degree = 1 |
| OLIG3 | Up-regulation | Transcription factor | |
| EBF3 | Up-regulation | Transcription factor | |
| LEP | Down-regulation | 30517161; Acute kidney injury | PPI degree = 13 |
| EIF4A3 | Up-regulation | PPI degree = 10 | |
| WDR3 | Down-regulation | PPI degree = 8 | |
| MC4R | Up-regulation | PPI degree = 8 | |
| PPP2CB | Down-regulation | 31464346; End-stage renal disease | PPI degree = 8 |
| DDX21 | Down-regulation | PPI degree = 8 | |
| GPT | Up-regulation | 20220435; 23587212; Acute renal failure | PPI degree = 8 |

Figure 3: Validation of the expression levels of key differentially expressed genes based on the GSE139061 dataset.
In this study, six genes (EBF3, LEP, ETV1, EIF4A3, DDX21 and GPT) were chosen as the focus of ROC analysis. Our findings indicated that only LEP exhibited a good discriminative ability for identifying AKI samples (AUC = 0.740), suggesting that this gene had great diagnostic value for AKI (Fig. 4). However, remaining five genes were not capable of discriminating DGF and IGF samples (AUC < 0.7).
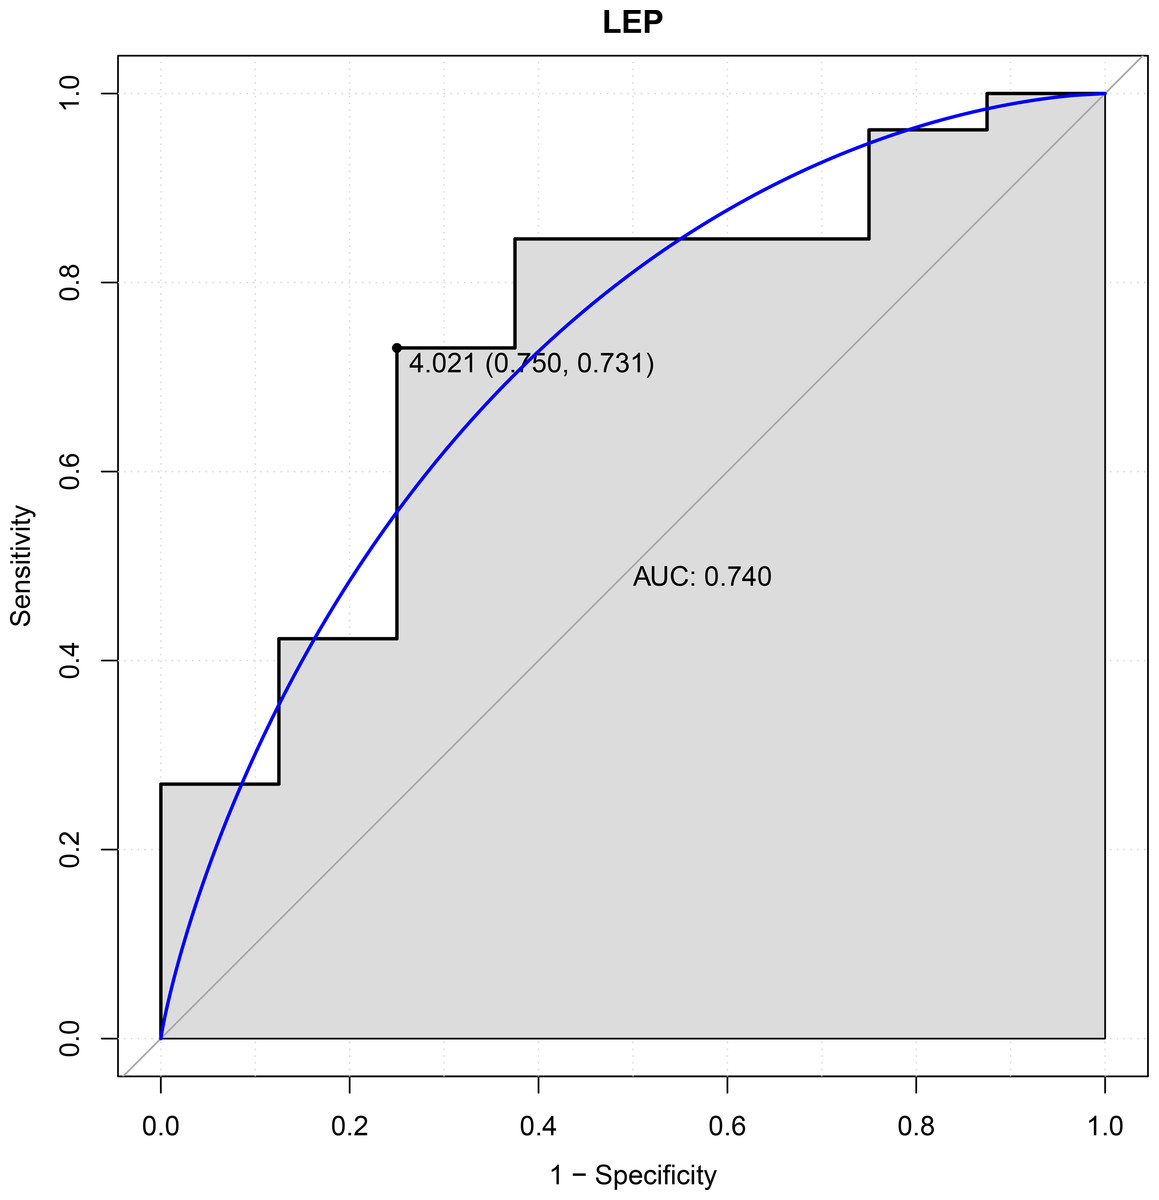
Figure 4: ROC curves of LEP.
The ROC curves were used to evaluate the diagnostic value of LEP with sensitivity and 1-Specificity. The X-axis indicates 1-specificity and the Y-axis indicates sensitivity. ROC, Receiver operating characteristic; AUC, Area under the ROC curve.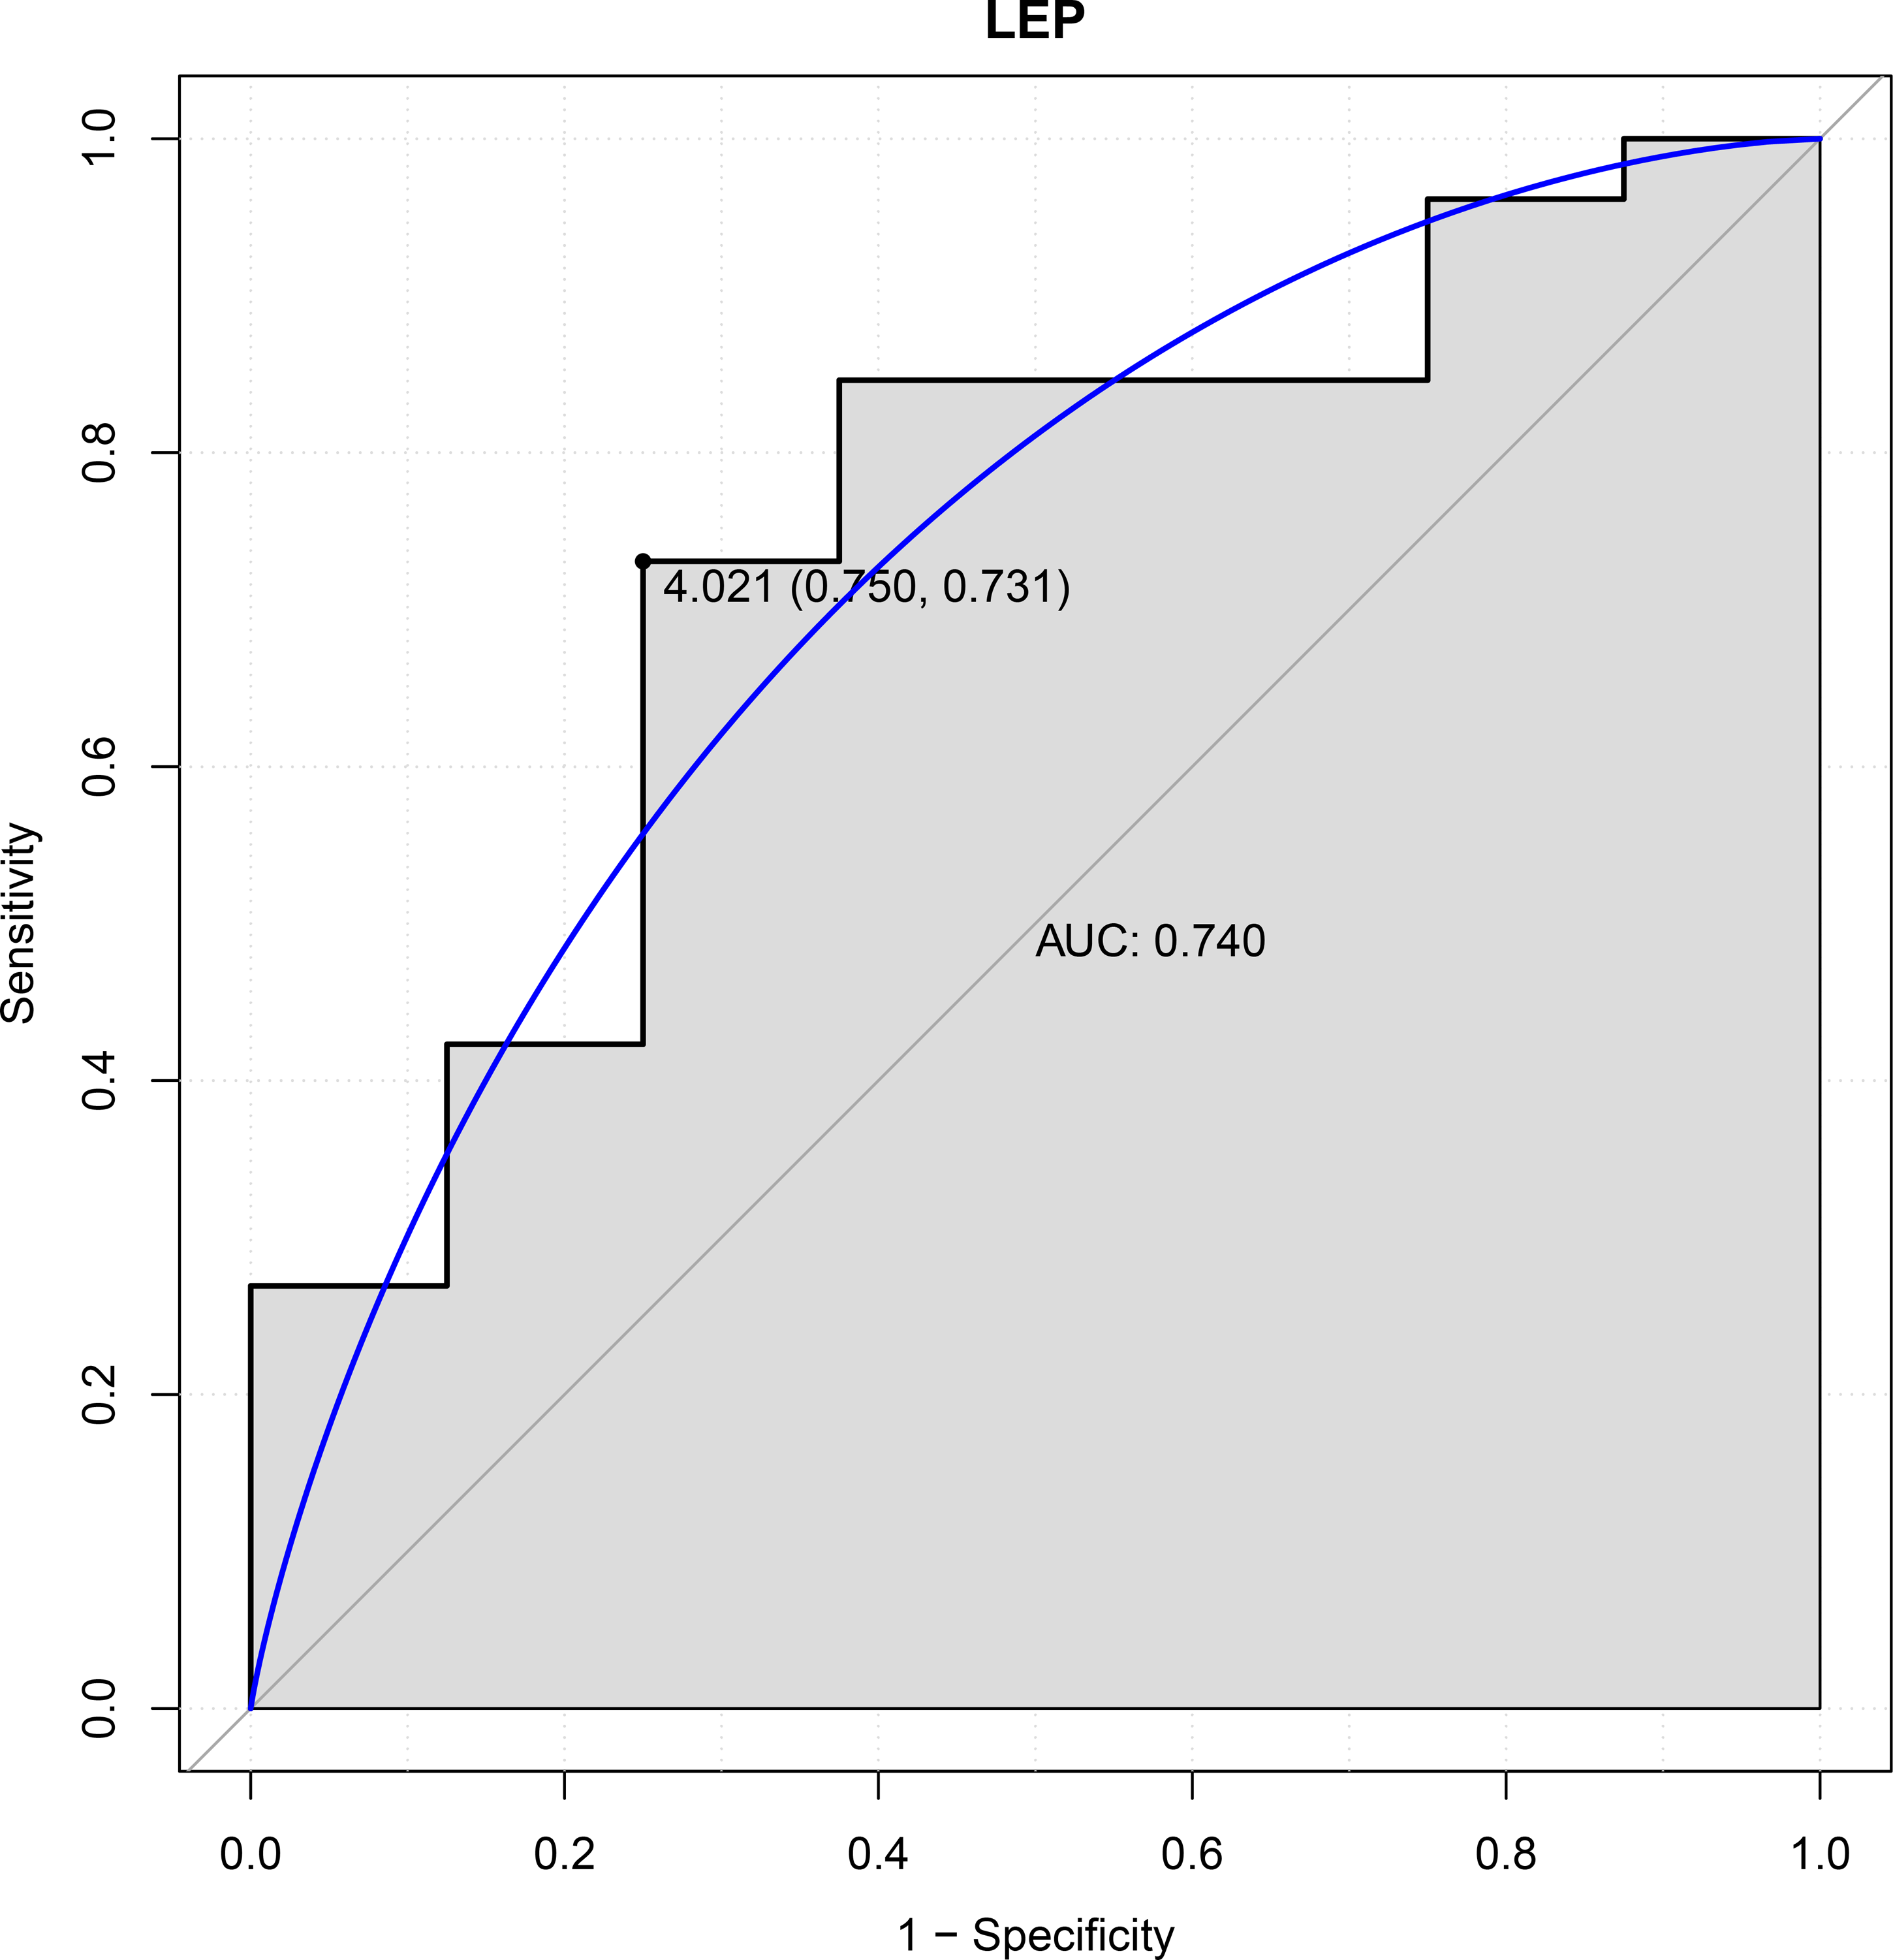
Discussion
AKI represents one of important complications induced by kidney transplantation (Qaqish et al., 2019). DGF is considered as a manifestation of AKI and strongly related to a high risk of graft loss (Yarlagadda et al., 2019). Therefore, it is urgently needed to identify key biomarkers associated with DGF, which will help predict AKI during the early periods following renal transplantation. In this study, we systematically analyzed two gene expression profiles of AKI post-kidney transplantation. Totally, 330 DEGs (179 up-regulated and 151 down-regulated genes) were extracted between DGF and IGF samples. Moreover, the protein products of three DEGs (OLIG3, EBF3 and ETV1) were also key transcription factors. There were seven hub genes (LEP, EIF4A3, WDR3, MC4R, PPP2CB, DDX21 and GPT) in PPI network. The expression levels of six genes (EBF3, LEP, ETV1, EIF4A3, DDX21 and GPT) were confirmed in an external GEO dataset. Among them, only EBF3 was statistically significant in expression analysis of validation dataset. Additionally, LEP had a good diagnostic value for AKI.
LEP can encode a mall peptide hormone leptin (16kDa), which is primarily secreted from adipocytes and cleared by the kidneys (Stern, Rutkowski & Scherer, 2016; Zhang et al., 1994). Previous studies suggested that serum leptin level was decreased during the period shortly after kidney transplantation (Kayacan et al., 2003; Souza et al., 2008). Nicoletto et al. (2012) pointed out that there was an increase for serum leptin level in patients who received renal transplantation a few months later. Similarly, our result showed that the expression of LEP was elevated in DGF samples compared with that in IGF samples. Leptin plays its biological roles principally via interacting with its receptors, including ObRa, ObRb, ObRc, ObRd, ObRe, and ObRf (Barreto et al., 2009). Wang et al. (2014) investigated the underlying roles of leptin deficiency in endotoxin (LPS)-associated early acute renal failure and found that elevated levels of endogenous leptin that binds to their many receptors in db/db mice was possibly crucial for renoprotection against endotoxin. Dong et al. (2013) suggested that leptin level was significantly increased in lung following LPS administration and leptin deficiency promote lung injury development through by aggravating inflammatory responses. Notably, Mantula et al. (2018) previously highlighted that a low level of leptin at the acute phase of puumala hantavirus infection may be closely related to the development of AKI. In this study, the diagnostic value of LEP was firstly evaluated. Our findings indicated that this gene was capable of distinguishing AKI and control samples. Taken together, these evidences implied that LEP may be involved in the development of AKI following kidney transplantation and a novel diagnostic maker for AKI.
Up-regulated EBF3 and down-regulated ETV1 were two transcription factor genes. Their expression levels were validated in an external GEO dataset. EBF3 can encode a member of the early B-cell factor family of DNA binding transcription factors and was involved in tumor angiogenesis (Daiqing, 2009; Kim et al., 2012). Our analysis indicated that this gene acted as a hub gene in PPI network. ETV1 encodes a member of the ETS (E twenty-six) family of transcription factors (Coutte et al., 1999). An early research showed ETV1 was a downstream target of constitutive photomorphogenic 1 (COP1) and down-regulated by COP1 in human renal cell line ACHN. Furthermore, under-expressing ETV1 may inhibit migration and invasion of the ACHN cells (Ta et al., 2016). However, no few studies focused on exploring the potential influences of EBF3 and ETV1 on AKI. Therefore, an additional study should be performed on this target.
Three down-regulated genes (EIF4A3, DDX21 and GPT) also served as hub genes in PPI network. Moreover, their expression levels were confirmed by a gene differential analysis based on an external dataset. Our results suggested that these three genes may be involved in the molecular mechanism of AKI after renal transplantation. EIF4A3 encodes a protein that belongs to Asp-Glu-Ala-Asp (DEAD) box-family adenosine triphosphate (ATP)-dependent RNA helicase family (Linder & Jankowsky, 2011). DDX21 is also a member of RNA helicases which is highly conserved enzymes and participates in RNA metabolism process (Russell, Jarmoskaite & Lambowitz, 2013). Existing evidence suggested that these two gene were associated with occurrence and development of several cancers (Lin et al., 2018; Santoriello et al., 2020; Wang et al., 2018). In addition, we noted that there was no strong laboratory evidence for supporting the hypothesis that GPT played a prominent role in AKI following kidney transplantation.
Although we have screened multiple novel biomarkers related to AKI after renal transplantation, there are still limitations in this study. On the top of that, the experimental research such as quantitative PCR analysis is needed to perform to confirm our conclusion. In addition, although six genes (EBF3, LEP, ETV1, EIF4A3, DDX21 and GPT) had a similar expression pattern in our current training and validation dataset, the results of five genes (LEP, ETV1, EIF4A3, DDX21 and GPT) were not statistically significant in expression analysis of validation dataset. Therefore, a comprehensive bioinformatics analysis or some other datasets based on a larger sample size is required to validate our findings. Finally, the clinical information is also needed to integrate into further study.
Conclusion
We identified a novel gene markers EBF3 associated with the development of AKI after kidney transplantation. Additionally, our analysis also provided indirect evidence that LEP was involved in AKI. Moreover, LEP had a good diagnostic values for identifying DGF. However, additional experimental assays need to be carried out to validate our conclusion in future.