 Chiara Niespolo1*
 Jessica M. Johnston1
 Sumeet R. Deshmukh2
 Swapna Satam3
 Ziyanda Shologu4
 Oscar Villacanas5†
 Ian M. Sudbery2
 Heather L. Wilson1
 Endre Kiss-Toth1* on behalf of TRAIN Consortium
- 1Department of Infection, Immunity and Cardiovascular Disease, Medical School, University of Sheffield, Sheffield, United Kingdom
- 2Department of Molecular Biology and Biotechnology, Sheffield Institute for Nucleic Acids, University of Sheffield, Sheffield, United Kingdom
- 3Institute for Diabetes and Cancer IDC, Helmholtz Center, Munich, Germany
- 4Health Sciences Research Centre, University of Beira Interior, Covilhã, Portugal
- 5Intelligent Pharma, Barcelona, Spain
The pseudokinase TRIB1 controls cell function in a range of contexts, by regulating MAP kinase activation and mediating protein degradation via the COP1 ubiquitin ligase. TRIB1 regulates polarization of macrophages and dysregulated Trib1 expression in murine models has been shown to alter atherosclerosis burden and adipose homeostasis. Recently, TRIB1 has also been implicated in the pathogenesis of prostate cancer, where it is often overexpressed, even in the absence of genetic amplification. Well described TRIB1 effectors include MAP kinases and C/EBP transcription factors, both in immune cells and in carcinogenesis. However, the mechanisms that regulate TRIB1 itself remain elusive. Here, we show that the long and conserved 3’untranslated region (3’UTR) of TRIB1 is targeted by miRNAs in macrophage and prostate cancer models. By using a systematic in silico analysis, we identified multiple “high confidence” miRNAs potentially binding to the 3’UTR of TRIB1 and report that miR-101-3p and miR-132-3p are direct regulators of TRIB1 expression and function. Binding of miR-101-3p and miR-132-3p to the 3’UTR of TRIB1 mRNA leads to an increased transcription and secretion of interleukin-8. Our data demonstrate that modulation of TRIB1 by miRNAs alters the inflammatory profile of both human macrophages and prostate cancer cells.
Introduction
Tribbles-1 (TRIB1) is an evolutionary conserved pseudokinase that in mammals controls a wide range of interacting signaling pathways, such as mitogen activated protein kinases and the PI3-kinase pathway. Its expression is detectable in most tissues; it is highest in the bone marrow and in the thyroid gland (The Human Protein Atlas, https://www.proteinatlas.org). Structurally, the TRIB1 protein contains an N-terminal PEST region, a pseudokinase domain and a C-terminal COP1-binding region. By lacking a functional adenosine 5’-triphosphate (ATP) binding site, TRIB1 is a catalytically inactive enzyme (1). However, through the pseudokinase domain, TRIB1 acts as adapter or scaffold facilitating assembly with other proteins (2–4). TRIB1 is an established oncogene in acute myeloid leukemia (5, 6) and has been shown to play a pivotal role in the differentiation of anti-inflammatory M2-macrophages in the pathogenesis of early atherosclerosis and during adipose tissue inflammation (7–9). Additionally, TRIB1 has been reported to be overexpressed in prostate cancer, where it controls the expression of endoplasmic reticulum chaperone proteins and induces M2-macrophage differentiation (10, 11). At the transcript level, TRIB1 is highly unstable, reported to have an mRNA half-life shorter than 1 hour (12). TRIB1 expression is also highly variable among different cell types and tissues, suggesting it might be subject to cell type-dependent post-transcriptional regulation (13, 14). In fact, the 2kb long, 3’untraslated region (3’UTR) of TRIB1 mRNA represents more than 50% of the entire sequence and is highly conserved among different animal species. Recently, Soubeyrand and colleagues showed that blocking transcription through actinomycin-D dramatically reduced TRIB1 mRNA levels in HeLa cells and Aortic Smooth Muscle cells (15), while overexpression of the 3’UTR was shown to raise levels of the endogenous mRNA in HeLa cells (2). A major gene regulatory mechanism described in eukaryotes is mediated by microRNAs (miRNAs) by the process of RNA interference (RNAi). miRNAs are small non-coding RNAs that commonly bind to the 3’UTR of the target gene, and, via association with effector proteins, form the RNA-induced silencing complex (RISC) that ultimately leads to RNA degradation and inhibition of protein translation (16).
In the present work, we systematically analyzed the post-transcriptional regulation of TRIB1 by miRNAs, with focus on macrophages and prostate cancer models. We show that the 3’UTR of TRIB1 significantly reduces expression of a luciferase reporter when transiently transfected into HEK293 cells, it is enriched in miRNA-binding sites and is a direct target of multiple miRNAs. A significant number of miRNAs predicted to regulate TRIB1, are also silenced and/or downregulated in prostate cancer, and therefore may contribute to the elevated expression of this pseudokinase in this cancer. By directly targeting TRIB1, miR-101-3p and miR-132-3p control the inflammatory profile of human primary macrophages and prostate cancer cells, as exemplified by enhancing the expression and secretion of pro-inflammatory chemokine, interleukin-8.
Materials and Methods
Statement of Ethics
To isolate primary human blood monocytes, up to 80 ml of venous blood was taken from healthy donors. The study was approved by the University of Sheffield Ethics Committee (Reference Numbers: 031330, SMBRER310) in accordance with the Declaration of Helsinki and written informed consent was obtained from all volunteers.
Animal Experiments
Mice were handled in accordance with UK legislation (1986) Animals (Scientific Procedures) Act. Mouse experiments were approved by the University of Sheffield Project Review Committee and carried out under a UK Home Office Project License (70/7992). Myeloid specific Trib1 conditional knockout (KO) mice were generated by crossing Trib1 fl/fl mice that contain flanking loxP sites around the second exon of Trib1 and crossing them with Lyz2Cre recombinase transgenic mice (www.jax.org/strain/004781). The resulting mice; Trib1 fl/fl x Lyz2Cre (Trib1mKO) have all but the first 120 amino acids of TRIB1 excised. Myeloid specific Trib1 over-expressor transgenic mice were generated by crossing Rosa26.Trib1 mice with Lyz2Cre recombinase transgenic mice as described above. The resulting mice; Rosa26.Trib1 x Lyz2Cre (Trib1mTg) over-express Trib1 transgene by ~2.5 fold as previously described by Johnston et al. (9). Wild- type litter mates (Trib1mWT) were used as controls. All mice used were congenic on a C57BL/6J background and were housed in a controlled environment with a 12-h light/dark cycle, at 22°C in Optimice individually ventilated cages (Animal Care Systems) and given free access to a standard chow diet (#2918; Harlan Teklad) and water. Mice were sacrificed humanely by cervical dislocation at 12–13 weeks of age.
Isolation of Human Monocyte-Derived Macrophages (MDMs)
Peripheral blood mononuclear cells (PBMCs) were isolated by Ficoll–Paque Plus (GE Healthcare) density centrifugation and CD14+ monocytes were selected by positive magnetic separation using CD14 microbeads (Miltenyi Biotec). Monocytes were then cultured in complete media for seven days: RPMI-1640 (Gibco), 10% (v/v) low-endotoxin heat-inactivated FBS (PanBiotech), 1% (v/v) L-glutamine (Gibco) and 1% (v/v) penicillin/streptomycin (Gibco). Recombinant human (rh) M-CSF (100 ng/ml, Peprotech/Immunotools) was added to the media to allow the differentiation of monocytes into macrophages (MDMs). After 7 days of differentiation, MDMs were polarized into pro- (M1) and anti-(M2a) inflammatory macrophages for 24 h, using 20 ng/ml IFN-γ (Human, Peprotech) and 100 ng/ml E. coli lipopolysaccharide (Serotype R515 TLR grade TM, Enzo Life Sciences) and 20 ng/ml IL–4 (Human, Peprotech), respectively.
Established Cell Lines
HEK293T cells were obtained from ATCC® (UK) and grown in Dulbecco’s modified Eagle’s medium (DMEM, Gibco) supplemented with 10% (v/v) low-endotoxin heat-inactivated FBS (PanBiotech) and 1% (v/v) penicillin/streptomycin (Gibco). Immortalized bone marrow-derived macrophages (iBMDMs) were kindly provided by D. Brough (University of Manchester) and generated as described by Hornung et al. (17), were grown in DMEM further supplemented with 1% (v/v) sodium pyruvate (Gibco) and 1% (v/v) sodium bicarbonate (Gibco). HEK293T cells and iBMDMs were grown in T75 flasks passaged every 2–3 days in a 1:10 ratio, using trypsin/EDTA (Lonza) and cell scrapers (Biofil), respectively. Prostate cell lines used were PC3 and LNCAP as cancer cells and PWR1E and RWPE1 as normal prostatic epithelial cell controls. PC3 were grown in complete DMEM (Gibco) and LNCAP in RPMI-1640 plus 10% (v/v) low-endotoxin heat-inactivated FBS (PanBiotech), 1% (v/v) penicillin/streptomycin (Gibco) and 1% (v/v) L-glutamine (Lonza). PWR1E and RWPE1 were cultured in Keratinocyte Serum Free Media (K-SFM, Gibco) supplied with 1% (v/v) penicillin/streptomycin, 0.05 mg/ml bovine pituitary extract (BPE) and 5 ng/ml human recombinant epidermal growth factor (EGF), both provided with the K-SFM kit.
miRNA-Target Prediction Analysis
miRNA-target prediction analysis was carried out using seven different algorithms (miRanda 2010 (18), TargetScan v.7.2 (19), miRDB v.6 (20), StarBase 2019-2020 (21), miRwalk v.2 (22), Tarbase v.8 (23), and microT-CDS v.5 (24). All tools were used online, except miRanda which was downloaded and used locally as independent software, employing the default parameters. miRbase v.22 (25, 26) was used to download the list of “high-confidence” miRNAs, based on deep sequencing data. The total number of miRNAs predicted to target the 3’UTR of TRIB1 by each tool were imported in mySQL Database (pgAdmin v.4) and filtered using structural queries (for example “intersect” function to intersect tables and find “common” elements). We then selected only miRNAs predicted by at least 3 different tools. To identify miRNAs dysregulated in prostate cancer, we used the microRNA Cancer Association Database miRCancer, which is based on published literature [http://mircancer.ecu.edu/ (27)].
Transient Transfection
Small RNA-based transfection was carried out using Viromer Green for primary cells and Viromer Blue for established cell lines (Lipocalyx), while DNA-based transfection was performed using Lipofectamine 3000 (Invitrogen). Simultaneous transfection of RNA and DNA was achieved using Dharmafect DUO (Horizon Discovery). TRIB1 siRNA, miRNA mimics, inhibitors, and negative controls were purchased from Horizon Discovery (sequences are listed in Supplementary Table 1); miR-101/TRIB1 Target site blocker (TSB) and negative control were obtained from Qiagen. TSB are antisense oligonucleotides designed to bind to a specific region of a miRNA-target gene, thus masking it from the miRNA. However, the TSB does not lead to the activation of the RISC complex; it only prevents the endogenous miRNA from binding its target (for further technical details, see: https://www.qiagen.com/gb/products/discovery-and-translational-research/functional-and-cell-analysis/mirna-functional-analysis/mircury-lna-mirna-power-target-site-blockers/mircury-lna-mirna-power-target-site-blockers/#productdetails). Each transfection experiment was performed independently. Transfection time and RNA/DNA concentrations are specified in each figure legend.
Immunofluorescence Staining
To assess Kupffer cell phenotype, FFPE liver tissue from mixed gender mice was stained with F4/80 and phenotypic markers YM1 (M2/alternatively activated) and IRF5 (M1/classically activated). Adipose tissue macrophages were stained with F4/80 and YM1 only. Sections were de-waxed, rehydrated and endogenous peroxidases were blocked by incubation in 3% (v/v) hydrogen peroxidase for 10 min at room temperature followed by enzyme induced (trypsin) antigen retrieval (A. Menarini Diagnostics, UK) and permeabilized with 0.1% (v/v) Triton X-100 for 15 min. Tissues were incubated with rat anti-F4/80 and then with a secondary biotinylated rabbit anti-rat followed by Streptavidin-PE. Sections were then re-blocked in 5% (v/v) donkey serum and incubated with either mouse anti-mouse IRF5 or rabbit anti-mouse YM1 followed by either incubation with donkey anti-mouse or donkey anti-rabbit NL493. Details of antibodies, dilutions and incubation time can be found in Supplementary Table 2. Tissues were then mounted with ProLong® Gold antifade mountant with DAPI (Molecular Probes). Fluorescent images were captured using an inverted wide-field fluorescence microscope (Leica AF6000) and analyzed by Image J64 (v1.51). Only cells that were F4/80+ were included in the analysis to ensure macrophage specificity. Relative IRF5 and YM1 staining is normalized to levels of F4/80+ cells and are representative of at least three fields of view. Specificity of immunofluorescence staining was ascertained by using isotype controls as exemplified in Supplementary Figure 1.
Real-Time Quantitative PCR
Total RNA isolation was performed by using the miRNeasy Mini Kit (Qiagen) according to manufacturer instructions. The kit enables the purification of total RNA, including small RNAs and is based on silica-spin columns for optimal RNA binding. RNA concentration and purity were assessed by NanoDrop™ Spectrophotometer (260/280 ratio = 1.8/2.0; 260/230 ratio = 1.8/2.0). cDNA was synthesized using iScript cDNA Synthesis Kit (Biorad) for mRNA and miRCURY LNA RT Kit for microRNAs (Qiagen) following manufacturer instructions. Real-time quantitative PCR (RT-qPCR) was performed using SYBR Green master mix (Primer Design) for the mRNA analysis; the miRCURY LNA miRNA PCR Assay kit (Qiagen) was used for microRNAs amplification. Primers were designed and checked for specificity using BLAST Primer Design Tool (https://www.ncbi.nlm.nih.gov/tools/primer-blast) and purchased from Sigma-Aldrich; microRNA-specific primer mix were obtained from Qiagen. Results were analyzed upon a CFX384 C1000 Touch Thermal Cycler (Biorad), using the 2(-Delta Ct) analysis method. Each biological sample analyzed represents the average value of 3 technical replicates. Primer sequences are listed in Supplementary Table 3.
Western Blotting
Proteins were extracted from cell culture plates by homogenizing in RIPA buffer (Sigma-Aldrich), containing protease inhibitors (Sigma-Aldrich). The lysates were centrifuged at 4°C for 20 min at 14,000 g and the liquid upper phase was collected. Five or ten (depending on the specific experiment) micrograms of total protein lysate were then loaded onto a 4% to 12% NuPAGE Bis-Tris Gel (Invitrogen) and transferred onto Immobilon PVDF Membrane (Merck). Primary and secondary antibodies used are listed in Supplementary Table 2.
Enzyme-Linked Immunosorbent Assay (ELISA)
IL-8 ELISA was carried out using DuoSet ELISA kit (R&D) following manufacturer’s instructions. The samples were supernatants collected after transient transfection of human MDMs.
Molecular Cloning and Site-Directed Mutagenesis
Molecular cloning was carried out to generate reporter and expression plasmids by using pENTR/D-TOPO Cloning Kit (Invitrogen). High-efficiency transformation of bacteria was performed using 5-alpha competent E. coli (New England’s Labs). Multiple nucleotides deletions were generated through a site-directed mutagenesis kit according to manufacturer instructions (Agilent). Mutagenic primer sequences are specified in Supplementary Table 4.
Dual Luciferase Reporter Assay
HEK293 cells were transfected with a mixture of plasmids, encoding 1) for firefly luciferase, under the control of Thymidine Kinase minimal promoter and 2) firefly luciferase under the control of EF1 promoter ± the TRIB1 3’UTR. Twenty-four hours post-transfection, media was removed and cells were washed with PBS 1X twice and then lysed using 35 ml of 1X Passive Lysis Buffer (Promega); 5 ml of lysate was transferred onto a Nunc 384-well polystyrene white microplate. The substrates of Firefly luciferase (LAR II, Promega) and Renilla luciferase (Stop & Glo, Promega) were sequentially added to the cell lysates (1:1 ratio). From the same sample, luminescence was measured first at 560 nm for firefly luciferase and at 480 nm for Renilla luciferase using a microplate reader (Thermo Fisher Scientific). Each condition was plated in triplicate. All the readings were first normalized to the readings generated by non-transfected cells to subtract the luminescence background and then Renilla/Firefly ratio was calculated.
Cholesterol Efflux Assay
Cholesterol efflux assay was performed on MDMs transfected with miR-101-3p mimic and inhibitor, 24 h post-transfection. Cells were treated with 2.5 uM of TopFluor Cholesterol (23-(dipyrrometheneboron difluoride)-24-norcholesterol (Avanti Polar Lipids) for 24 h in RPMI 0.2% BSA fatty-acid free (Sigma-Aldrich). Media was changed to only RPMI 0.2% BSA fatty-acid free for 18 h (equilibration step). After that, 50 µg/ml of High-Density Lipoprotein (HDL) (Biorad) was added as cholesterol acceptor for 4 h. The media (supernatant) was collected and cells were lysed using a solution of 1% Cholic Acid in 100% Ethanol (Sigma-Aldrich). Both cell lysates and supernatants were then added to a Nunc 96-well plate (black) in triplicates and fluorescence was read using a microplate reader (Thermo Fisher Scientific) (excitation 490 nm, emission 520 nm). Data were analyzed as described by Low et al. (28).
Statistical Analysis
All experiments were performed at least three times. Graphs and statistical analysis were generated in GraphPad Prism 8.00 (GraphPad). Statistical methods are specified in each figure legend. P‐values <0.05 were considered to be statistically significant. Where appropriate, post-hoc power calculations have confirmed the likely lack of type II error. Group sizes are described in figure legends and, in line with conventions, for primary cells, each N represents an independent, healthy donor.
Results
Manipulation of TRIB1 Expression Alters Liver and Adipose Tissue Macrophage Phenotype In Vivo and Inflammatory Markers in Monocyte-Derived Macrophages In Vitro
We first determined the effect of myeloid-specific Trib1 overexpression and KO on tissue-resident macrophage numbers and phenotype, employing wild-type (WT) and myeloid-specific Trib1 knock-out and Trib1 transgenic (Tg) mice. The generation and characterization of these strains has been reported previously (9). First, we wanted to ascertain the consequences of altered myeloid Trib1 levels in metabolic tissues as this gene has been identified as a risk locus for hyperlipidaemia in a number of GWAS analyses (29–31) but its molecular mechanism impacting on lipid homeostasis is still incompletely understood. Dual immunofluorescence staining of Kupffer cells (liver resident macrophages) (Figures 1A, B) and adipose-tissue macrophages (ATMs) (Supplementary Figure 2), revealed that while altered Trib1 expression has no effect on the number of F4/80 positive macrophages in these tissues (Figure 1C and Supplementary Figure 2B), it significantly altered their phenotype (Figures 1D, E and Supplementary Figure 2C). Specifically, Kupffer cells from Trib1mKO mice showed a significantly elevated expression of the pro-inflammatory transcription factor IRF-5 (n = 3), compared to Trib1mWT (p = 0.02), while macrophages from Trib1mTg mice were characterized by a ~50% reduction of IRF-5 positive macrophages, compared to Trib1mWT (p = 0.04) (Figure 1D). Trib1mKO also exhibited a reduced expression of the anti-inflammatory marker YM-1 (~40% decrease on average), but this was not statistically significant (p = 0.3). Conversely, macrophages from Trib1mTg showed a ~75% increase in the expression of YM-1, compared to Trib1mWT (p = 0.007) (Figure 1E). Similarly, ATM from Trib1mKO mice exhibited a ~50% reduction of YM-1 expression, compared to Trib1mWT (p = 0.01). However, Trib1mTg only had a modest, non-significant effect (~16% increase) on YM-1 expression in ATM (p = 0.4) (Supplementary Figure 2C), suggesting that Trib1-dependent changes in macrophage phenotypes may be modulated by the local tissue environment. Next, we evaluated the impact of TRIB1 overexpression on the phenotype of human macrophages, employing transient transfection of monocyte-derived macrophages (MDMs) with a plasmid construct to overexpress the human TRIB1 protein. In response to TRIB1 overexpression (shown in Supplementary Figure 2). We observed a significant increase in the mRNA levels of MSR1 (p < 0.05) and CD163 (p < 0.05), genes associated with alternatively activated macrophages (Figures 2A, B). Similarly, we observed an increase in IL-4, on average, but the change was not statistically significant (p = 0.09) (Figure 2C). Reduced levels of the pro-inflammatory cytokines IL-6 and IL-8 were also observed (Figures 2D, E). In addition, we measured the levels of IL-8 protein secreted in the media by MDMs and found that there was a significant reduction in IL-8 production by TRIB1 overexpressing cells, compared to the control (Figure 2E). These data are consistent with previous reports (8, 32), indicating that myeloid TRIB1 expression regulates the polarization of macrophages, favoring an anti-inflammatory, alternatively activated macrophage phenotype both in vivo as shown in Trib1-deficient mice (8) and in in vitro, as demonstrated in bone marrow–derived macrophages from Trib1 deficient mice (32).
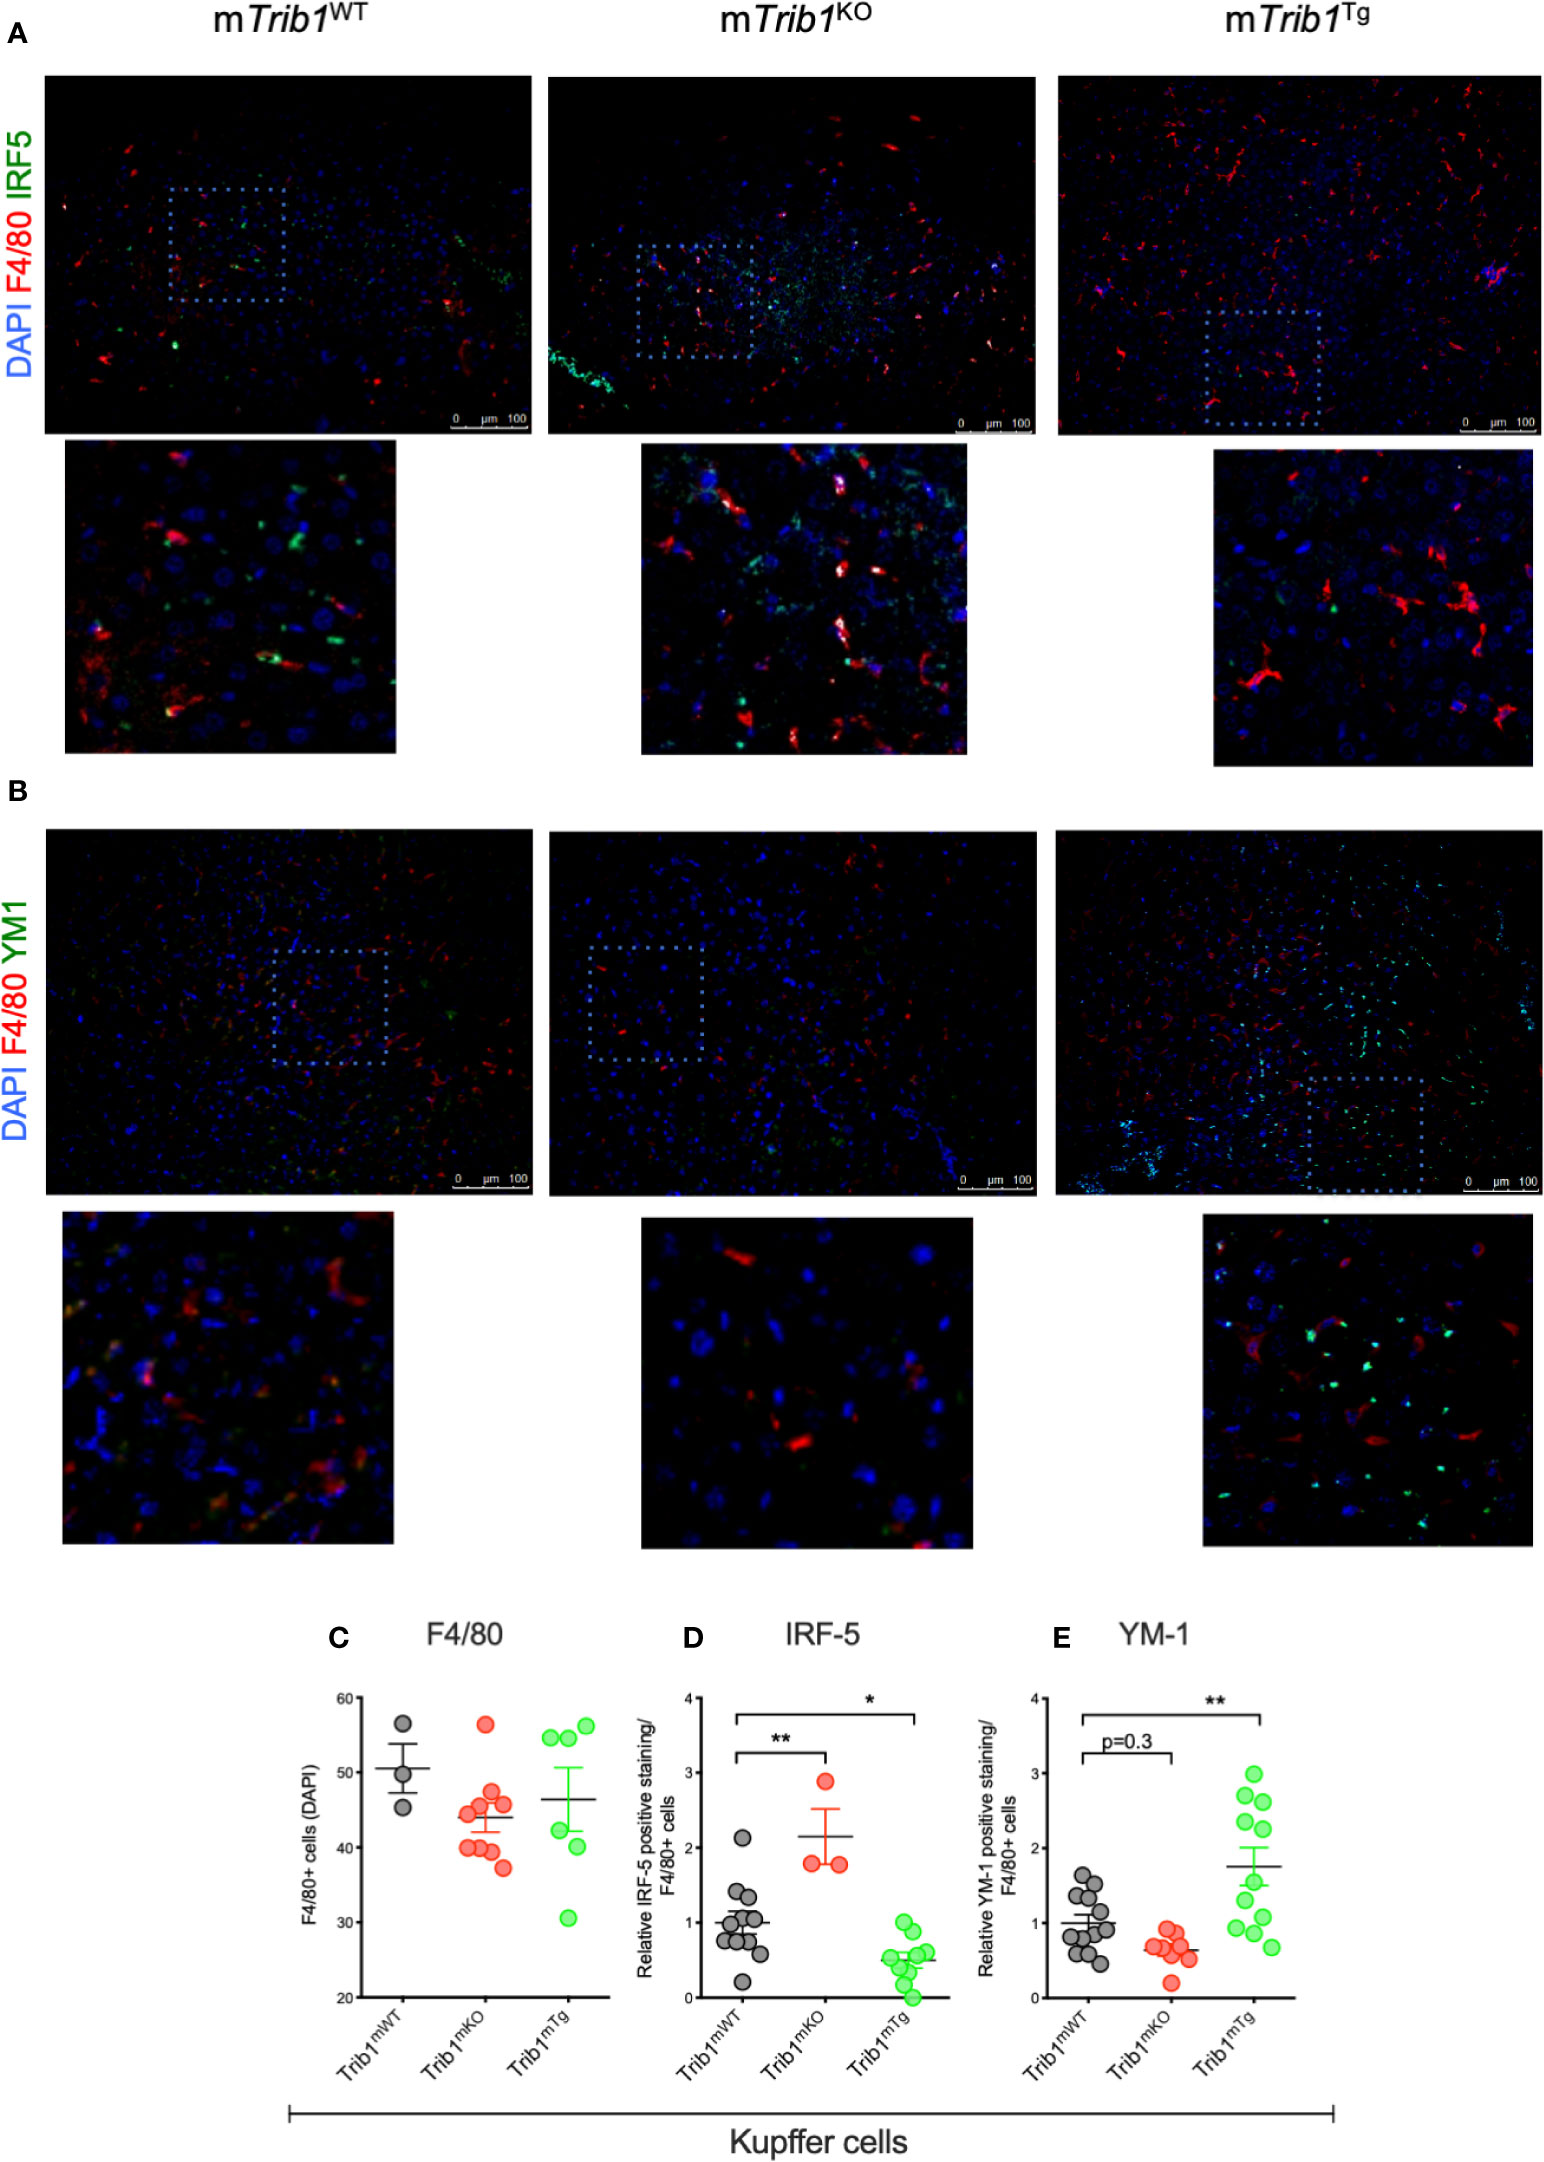
Figure 1 Genetic manipulation of myeloid Trib1 alters Kupffer cells phenotype in vivo. (A, B) Representative images of IRF5 and YM1 immunostaining of liver tissue sections from Trib1mWT, Trib1mKO and Trib1mTg mice. Scale: 100 µm. Enlarged image of marked area is also shown. (C) Quantification of F4/80 positive cells relative to DAPI in liver tissue sections from Trib1mWT, Trib1mKO, and Trib1mTg mice (n = 3–9, ordinary one-way ANOVA with Sidak’s post-test, no statistical significance p > 0.05). (D) Quantification of IRF5 positive cells relative to F4/80 in liver tissue sections from Trib1mWT, Trib1mKO, and Trib1mTg mice (n = 3–11, ordinary one-way ANOVA with Sidak’s post-test, **p < 0.01, *p < 0.05). (E) Quantification of YM1 positive cells relative to F4/80 in liver tissue sections from Trib1mWT, Trib1mKO and Trib1mTg mice (n = 8–12, ordinary one-way ANOVA with Sidak’s post-test, **p < 0.01, no statistical significance p > 0.05). Data are presented as mean ± SEM. Each data point (n) represents an individual mouse. At least three independent fields of view were examined per mouse. Samples were obtained and analyzed from three independent breeding cohorts, in total, each including WT littermate controls.
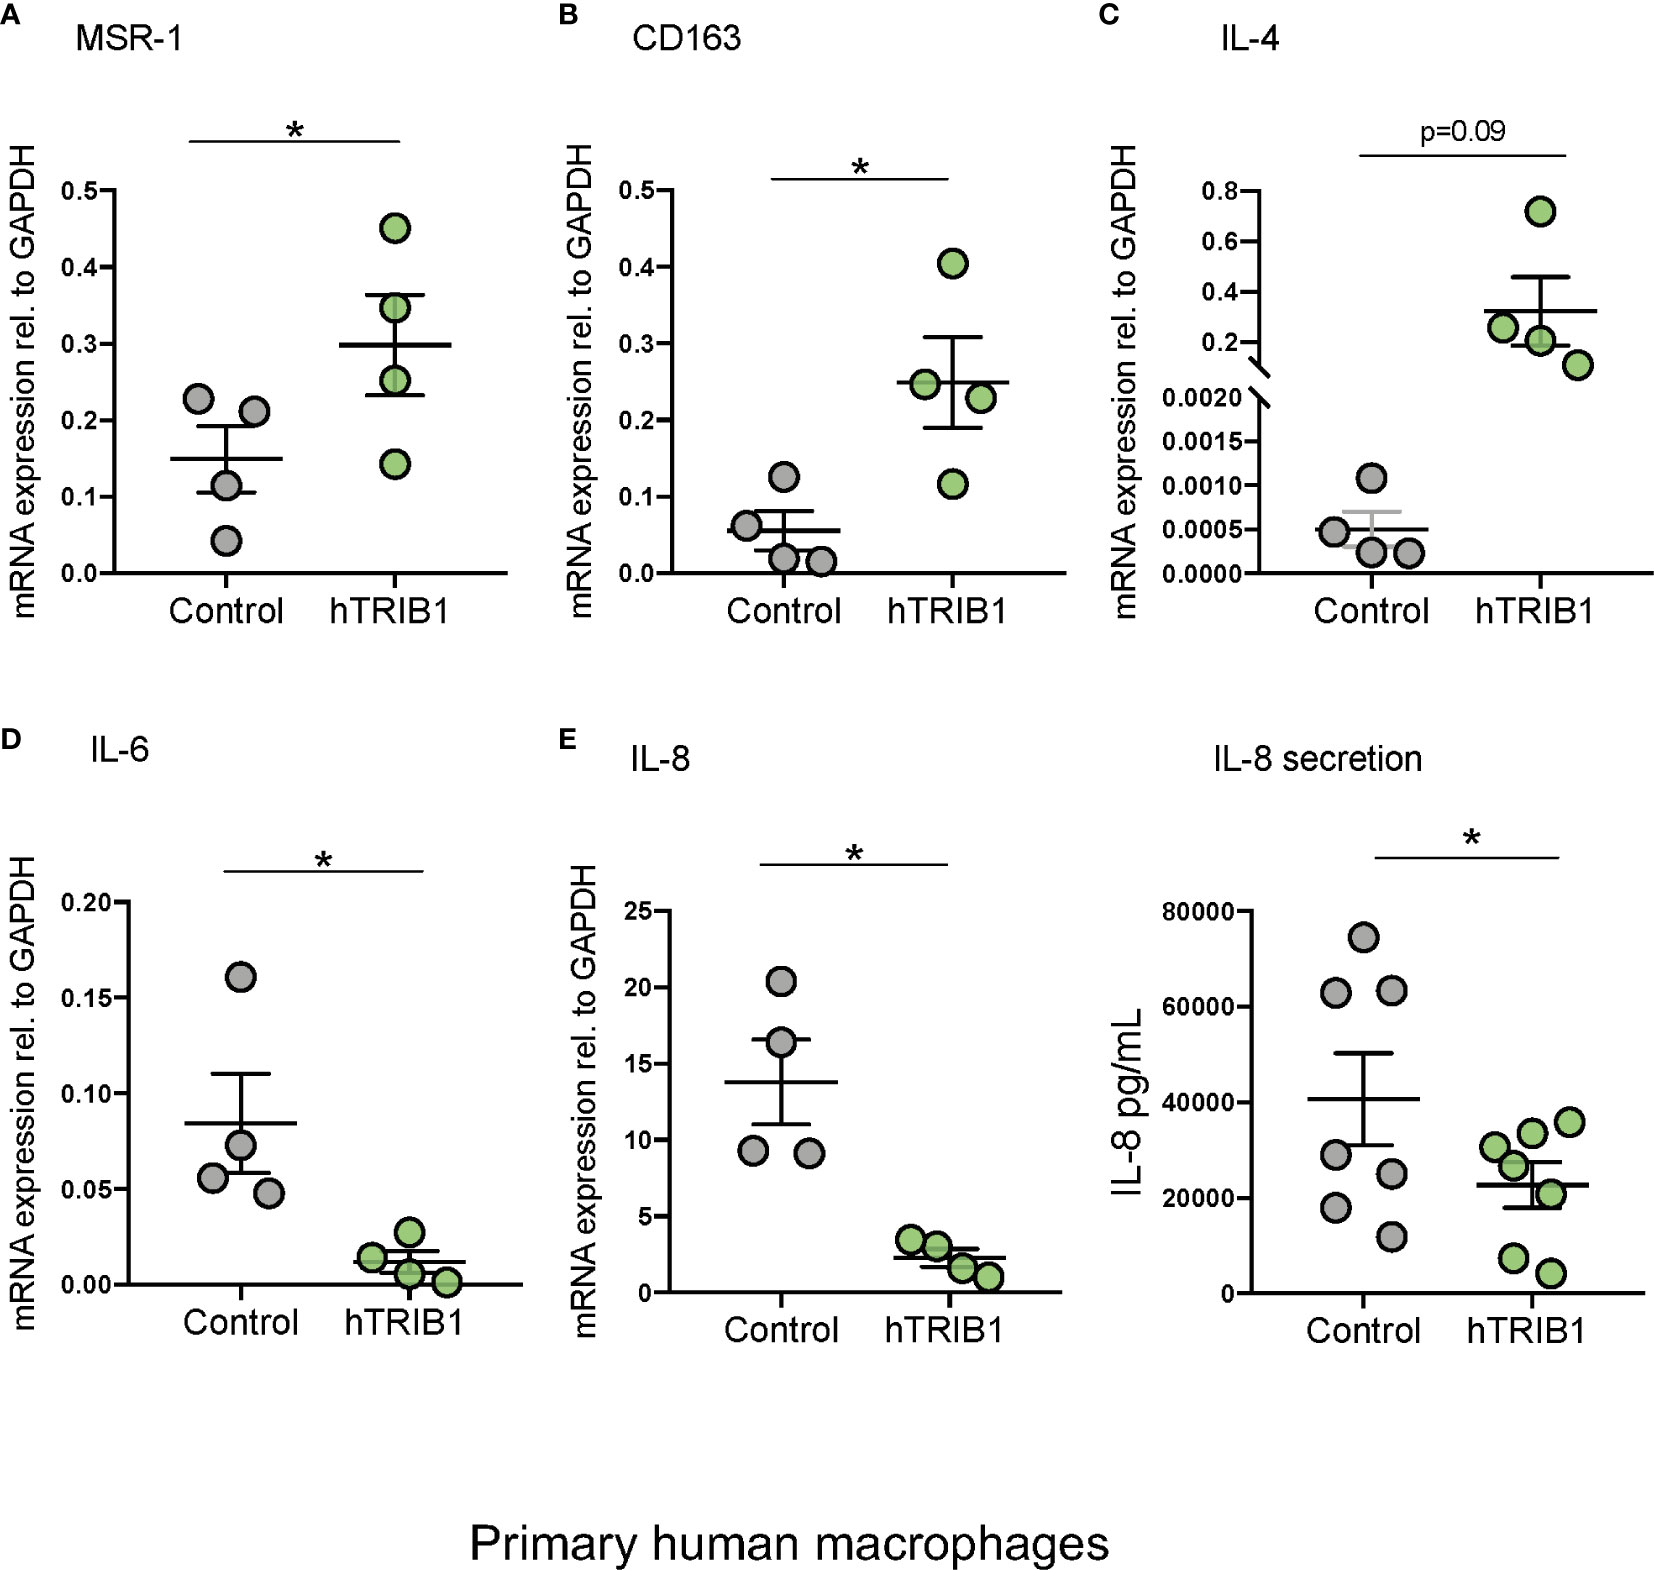
Figure 2 Genetic manipulation of TRIB1 alters macrophage phenotype in vitro. Relative mRNA expression of (A) MSR1, (B) CD163, (C) IL-4, (D) IL-6, and (E) IL-8 normalized to the housekeeping GAPDH and F: IL-8 (pg/ml) ELISA measured in MDMs transiently transfected with a TRIB1 overexpression plasmid and a control plasmid. Data are presented as mean ± SEM (scatter dot plot) (n = 4–7 biological replicates, paired t-test, *p < 0.05, no statistical significance p > 0.05). Transfection was carried out for 24 h, employing 2 µg of plasmid per well (6 well plate format). Each biological replicate represents the average of 3 technical replicates. ELISA was performed on supernatants collected 24 h post-transfection. RT-qPCR data were analyzed using the 2(−Δct) method.
TRIB1 Is Post-Transcriptionally Regulated by miRNAs
As TRIB1 mRNA has been reported to be highly unstable (12), we investigated its post-transcriptional regulation by miRNAs. The mRNA of TRIB1 encodes for a long and conserved 3’UTR region, representing more than half of the entire sequence (Figure 3A). Additionally, the 3’UTR sequence is well conserved among different animal species, as shown in Figures 3B, C. As the majority of miRNAs have functional target sites in this region, we evaluated the impact of the 3’UTR of TRIB1 on mRNA stability using a luciferase reporter assay. Cloned downstream of the renilla luciferase gene, the 3’UTR of TRIB1 led to a robust and significant decrease (> 40%) of the luciferase activity, compared to the control lacking the UTR (p < 0.0001) (Figure 3D), suggesting that this region contributes to the post-transcriptional regulation of TRIB1. This is in line with our previous findings where we showed that overexpression of TRIB1 3’UTR protects the endogenous mRNA, probably via titrating out factors (miRNAs or RNA binding proteins) that regulate the stability of the mRNA (2). To characterize the extent by which the effect of TRIB1 3’UTR may be mediated by interaction with miRNAs, we carried out a comprehensive in silico analysis using multiple miRNA-target prediction tools, including StarBase which is supported by CLIP-seq experimental data (http://starbase.sysu.edu.cn/) (Figure 3E). This analysis predicted that the 3’UTR of TRIB1 can potentially interact with a total of 1,237 distinct miRNAs. Amongst these, 285 high confidence miRNAs were identified in miRbase v.22 (ftp://mirbase.org/pub/mirbase/CURRENT/). Annotation of high confidence miRNAs was based on RNA deep sequencing data and pattern of mapped reads, as described in details by Kozomara and colleagues (25); 35 high confidence miRNAs were predicted to bind to the TRIB1 3’UTR by at least 3 prediction tools (Supplementary Table 6). Next, we selected miR-101-3p and miR-132-3p for experimental validation: they were listed as high-confidence miRNAs and were predicted by the majority of the tools that we used, also showing evolutionarily conserved binding-sites in the 3’UTR of TRIB1 mRNA (Figures 3B, C and Supplementary Figure 4). Additionally, they have been previously implicated in the literature to regulate inflammation and macrophage function (Supplementary Table 7). To determine the impact of these miRNAs on TRIB1 expression, we transiently transfected miRNA mimics and a negative control into human MDMs (Supplementary Figure 5) and immortalized murine bone marrow–derived macrophages (iBMDMs). The endogenous mRNA expression of TRIB1 was significantly reduced by miR-101-3p (p = 0.001) and miR-132-3p (p = 0.02), compared to the control (Figures 4A, B). Murine Trib1 mRNA was also downregulated, but the changes were not statistically significant (Figure 4C). Next, we investigated the endogenous expression of these miRNAs in human unpolarized (Mun) and polarized (M1 and M2a) macrophages by using RT-qPCR. We found that miR-101-3p was upregulated in M1 but not in M2 macrophages, compared to unpolarized cells (p = 0.04) (Figure 4D). The expression of miR-132-3p did not change in either M1 or M2 macrophages (Figure 4E). To investigate the biological relevance of candidate miRNAs, we performed a KEGG enrichment pathway analysis on the subset of target genes for each miRNA, focussing on those that are expressed in human macrophages. To this aim, we used an RNA seq dataset performed on human polarized macrophages, previously generated in our group (DOI: 10.17632/j2hmt7k9fh.1). Interestingly, we found shared enriched terms between miR-101-3p and miR-132-3p target genes, including MAPK signaling pathway (Figures 4F, G), which is well established to control macrophage inflammatory responses (33) and is also regulated by TRIB1 (34–36). Additionally, we found in our KEGG analysis (Figure 4G) that several miR-132-3p target genes expressed in macrophages, have been suggested to be involved in prostate cancer, a disease in which TRIB1 has been implicated (10, 11, 37). Additionally, it is well established that miR-132-3p acts as an onco-suppressor miR in prostate cancer, as several publications have reported (38, 39).
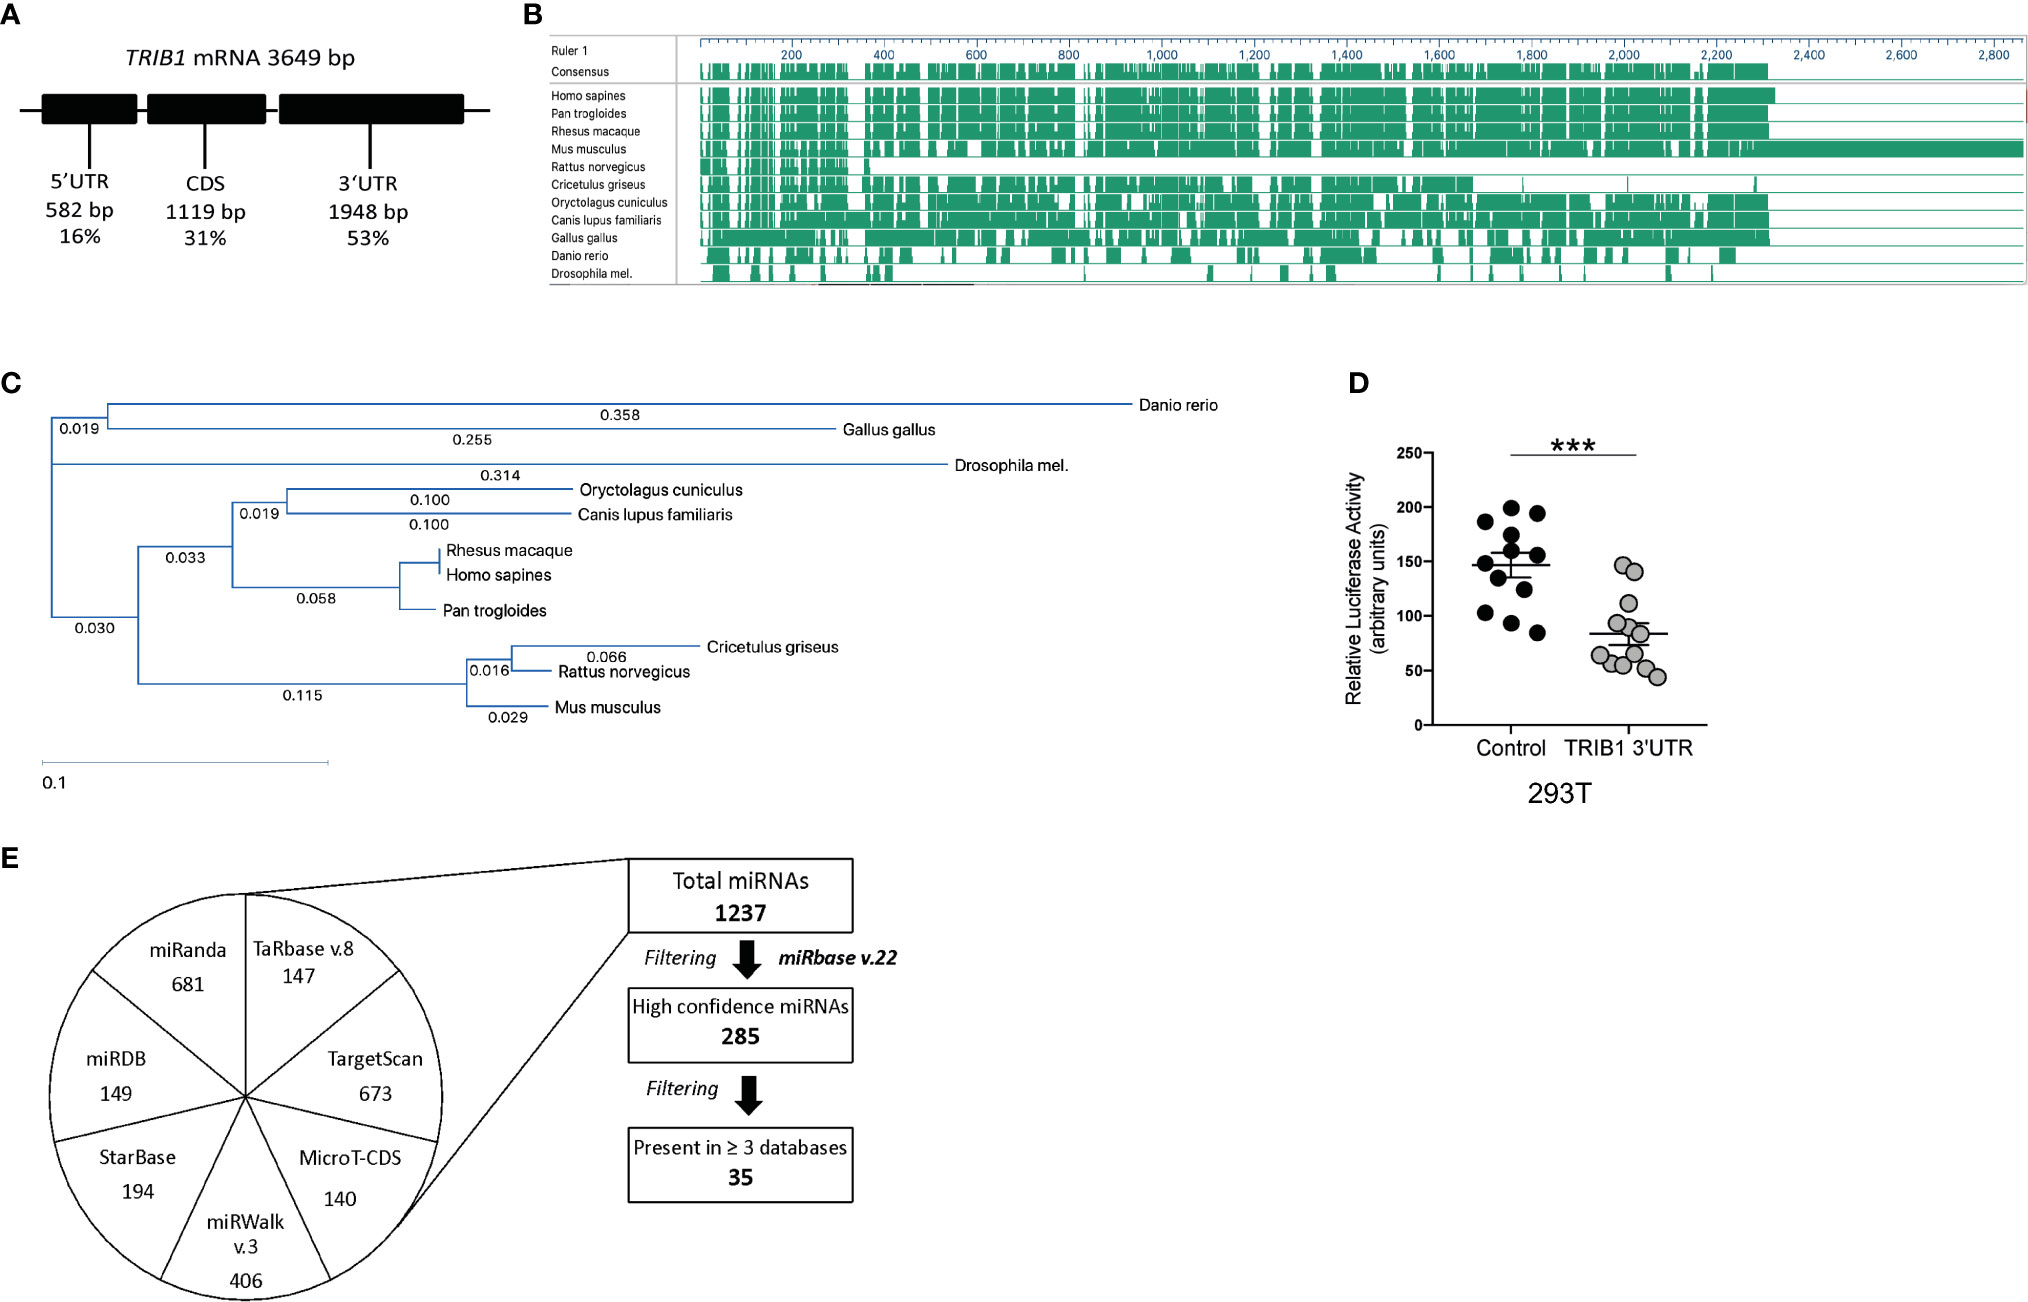
Figure 3 TRIB1 3’ UTR encodes for evolutionarily conserved miRNA binding sites. (A) Schematic representation of TRIB1 mRNA, showing the length of the untranslated regions and the protein coding sequence. (B) Schematic overview of TRIB1 3’UTR multi-species alignment, generated with the software DNASTAR Lasergene (v16). (C) TRIB1 3’UTR alignment tree, generated with the software DNASTAR Lasergene (v16) using the ClustalW algorithm. (D) Relative luciferase activity measured in HEK293T cell line after transfection of renilla luciferase reporter (control, 95 ng/well) and TRIB1 3’UTR renilla luciferase reporter (TRIB1 3’UTR, 95 ng/well) along with a firefly luciferase reporter plasmid (5 ng/well), used for data normalization (n = 12, biological replicates, unpaired t-test, ***p < 0.001). (E) Overview of miRNAs-target prediction analysis: seven different tools (miRanda, TargetScan, StarBase, miRDB, miRwalk, TarBase, and MicroT-CDS) were used to predict miRNAs targeting the 3’UTR of TRIB1; the list of distinct miRNAs was filtered selecting only “high-confidence” miRNAs (according to miRbase v.22) and miRNAs predicted at least by three different tools.
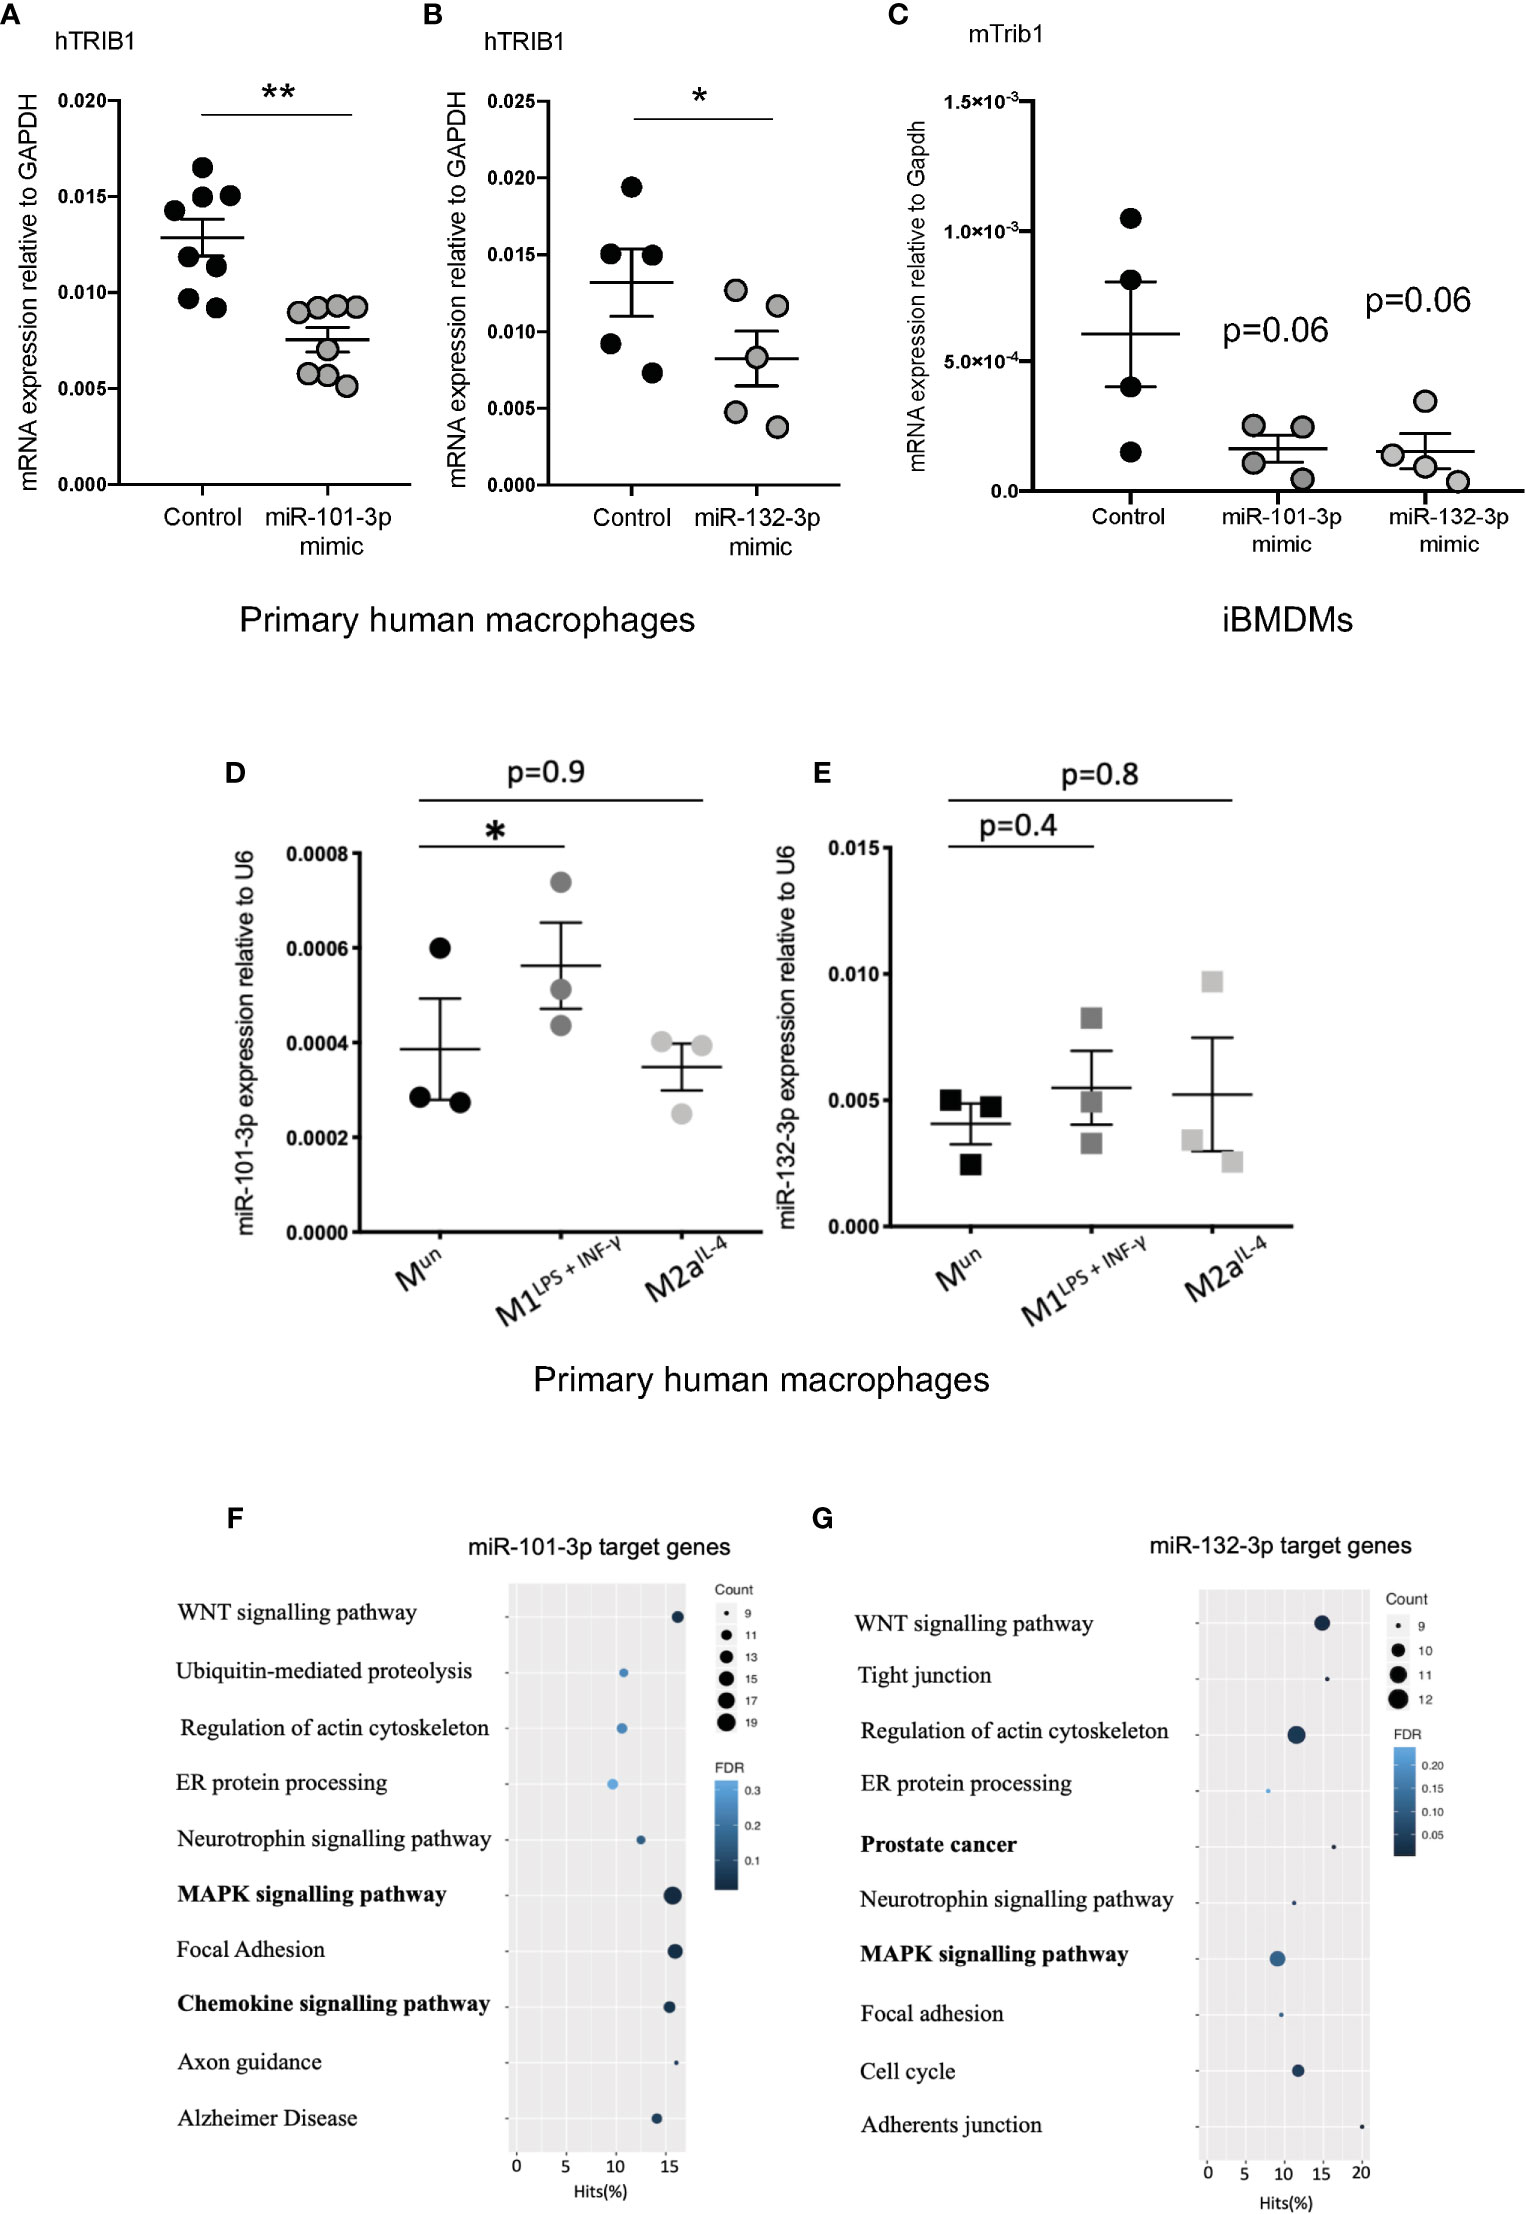
Figure 4 TRIB1 is post-transcriptionally regulated by miRNAs. (A, B) Relative mRNA expression of TRIB1 normalized to the housekeeping GAPDH in MDMs transiently transfected with miR-101-3p and miR-132-3p mimics (n = 5–8, biological replicates, paired t-test, **p < 0.01, *p < 0.05). (C) Relative mRNA expression of murine Trib1 normalized to the housekeeping Gapdh in iBMDMs transiently transfected with miR-101-3p and miR-132-3p mimics (n = 4, biological replicates, unpaired t-test, no statistical significance p > 0.05). (D, E) Relative expression of miR-101-3p and miR-132-3p normalized to the housekeeping U6 in unpolarized and M1- and M2- polarized MDMs (n = 3, biological replicates, repeated measure one way ANOVA with Dunnett’s post-test, *p < 0.05, no statistical significance p > 0.05). (F, G) KEGG enrichment pathway analysis of miR-101-3p and miR-132-3p target genes, predicted by using TargetScan and selecting macrophage-specific genes (from RNA-seq deposited at DOI: 10.17632/j2hmt7k9fh.1). Data are presented as mean ± SEM (scatter dot plot, where each dot represents an individual donor of MDMs or different passage of iBMDMs). Transient transfection of both DNAs and RNAs was carried out for 24 h. Mimics/control were used at 50 nM. RT-qPCR data were analyzed using the 2(−ΔCt) method. KEGG analysis was performed with the GOseq R package.
miR-101-3p Has a Functional Binding Site in the 3’UTR of TRIB1
miR-101-3p, a miRNA known to regulate inflammatory responses in monocyte/macrophages (40, 41), was predicted to bind to the 3’UTR of TRIB1 between positions 1526-1532 (7mer-m8 site) and 1424-1430 (7mer-A1 site) (Supplementary Table 7). However, we focussed on the 7mer-m8 site, as it was predicted by all the tools used and was the most conserved (Supplementary Table 7); this is an established factor of likely biological relevance (19). Furthermore, the interaction is characterized by one of the most effective canonical seed region types, an exact match to position 2–8 of the mature miRNA (Figure 5A), which strongly correlates with targeting efficiency (19, 42). To substantiate the direct interaction between miR-101-3p and TRIB1 3’UTR, we co-transfected the TRIB1 3’UTR reporter plasmid and 50nM of miR-101-3p mimic or negative control in HEK293T cells and carried out a luciferase reporter assay. Overexpressing miR-101-3p led to a significant reduction of the TRIB1 3’UTR reporter activity compared to control (~45% reduction, p = 0.006) (Figure 5B). In contrast, miR-101-3p overexpression had no effect on reporter expression with a TRIB1 3’UTR mutant lacking the 7 nucleotides complementary to the miR-101-3p seed region (p = 0.8) (Figures 5A, C), confirming that the predicted miR-101-3p binding site between positions 1526-1532 is in fact targeted by miR-101-3p. Conversely, a miRNA inhibitor, which is designed to antagonize the activity of the endogenous miR-101-3p, led to a significant increase of the luciferase activity (~16% increase, p = 0.005) and had no effect when co-transfected together with a control plasmid, without the 3’UTR of TRIB1 (p = 0.4) (Figure 5D). Next, we evaluated the effect of miR-101-3p mimic on endogenous TRIB1 protein levels in transfected human MDMs, as we previously showed that the mRNA of both human and murine TRIB1 was negatively downregulated (Figures 5D, E). Upon transfection of the mimic, TRIB1 protein was reduced by approximately 60%, compared to control (p = 0.03) (Figures 5E, F). Finally, we investigated whether the activity of miR-101-3p on endogenous TRIB1 mRNA and protein levels in macrophages is due to their direct physical interaction. To this aim, we transiently transfected MDMs with a miR-101/TRIB1 TSB. This is an antisense oligonucleotide designed to selectively compete with miR-101-3p for binding the TRIB1 3’UTR. It binds to the target with high affinity, preventing the endogenous miRNA from binding to the same region and without activating the RISC complex (Figure 5G). The TSB treatment caused a significant increase of TRIB1 mRNA (~30%, p = 0.004) compared to control (Figure 5H), suggesting that a direct interaction between miR-101-3p and TRIB1 occurs in human macrophages. However, we did not observe a significant increase in the Trib1 protein (p = 0.2). This was likely due to an individual donor, as shown in the line graph in Figure 5I and in the immunoblot (Figure 5J, donor 2). Nevertheless, our data indicate that miR-101-3p is a negative, direct regulator of TRIB1 in macrophages.
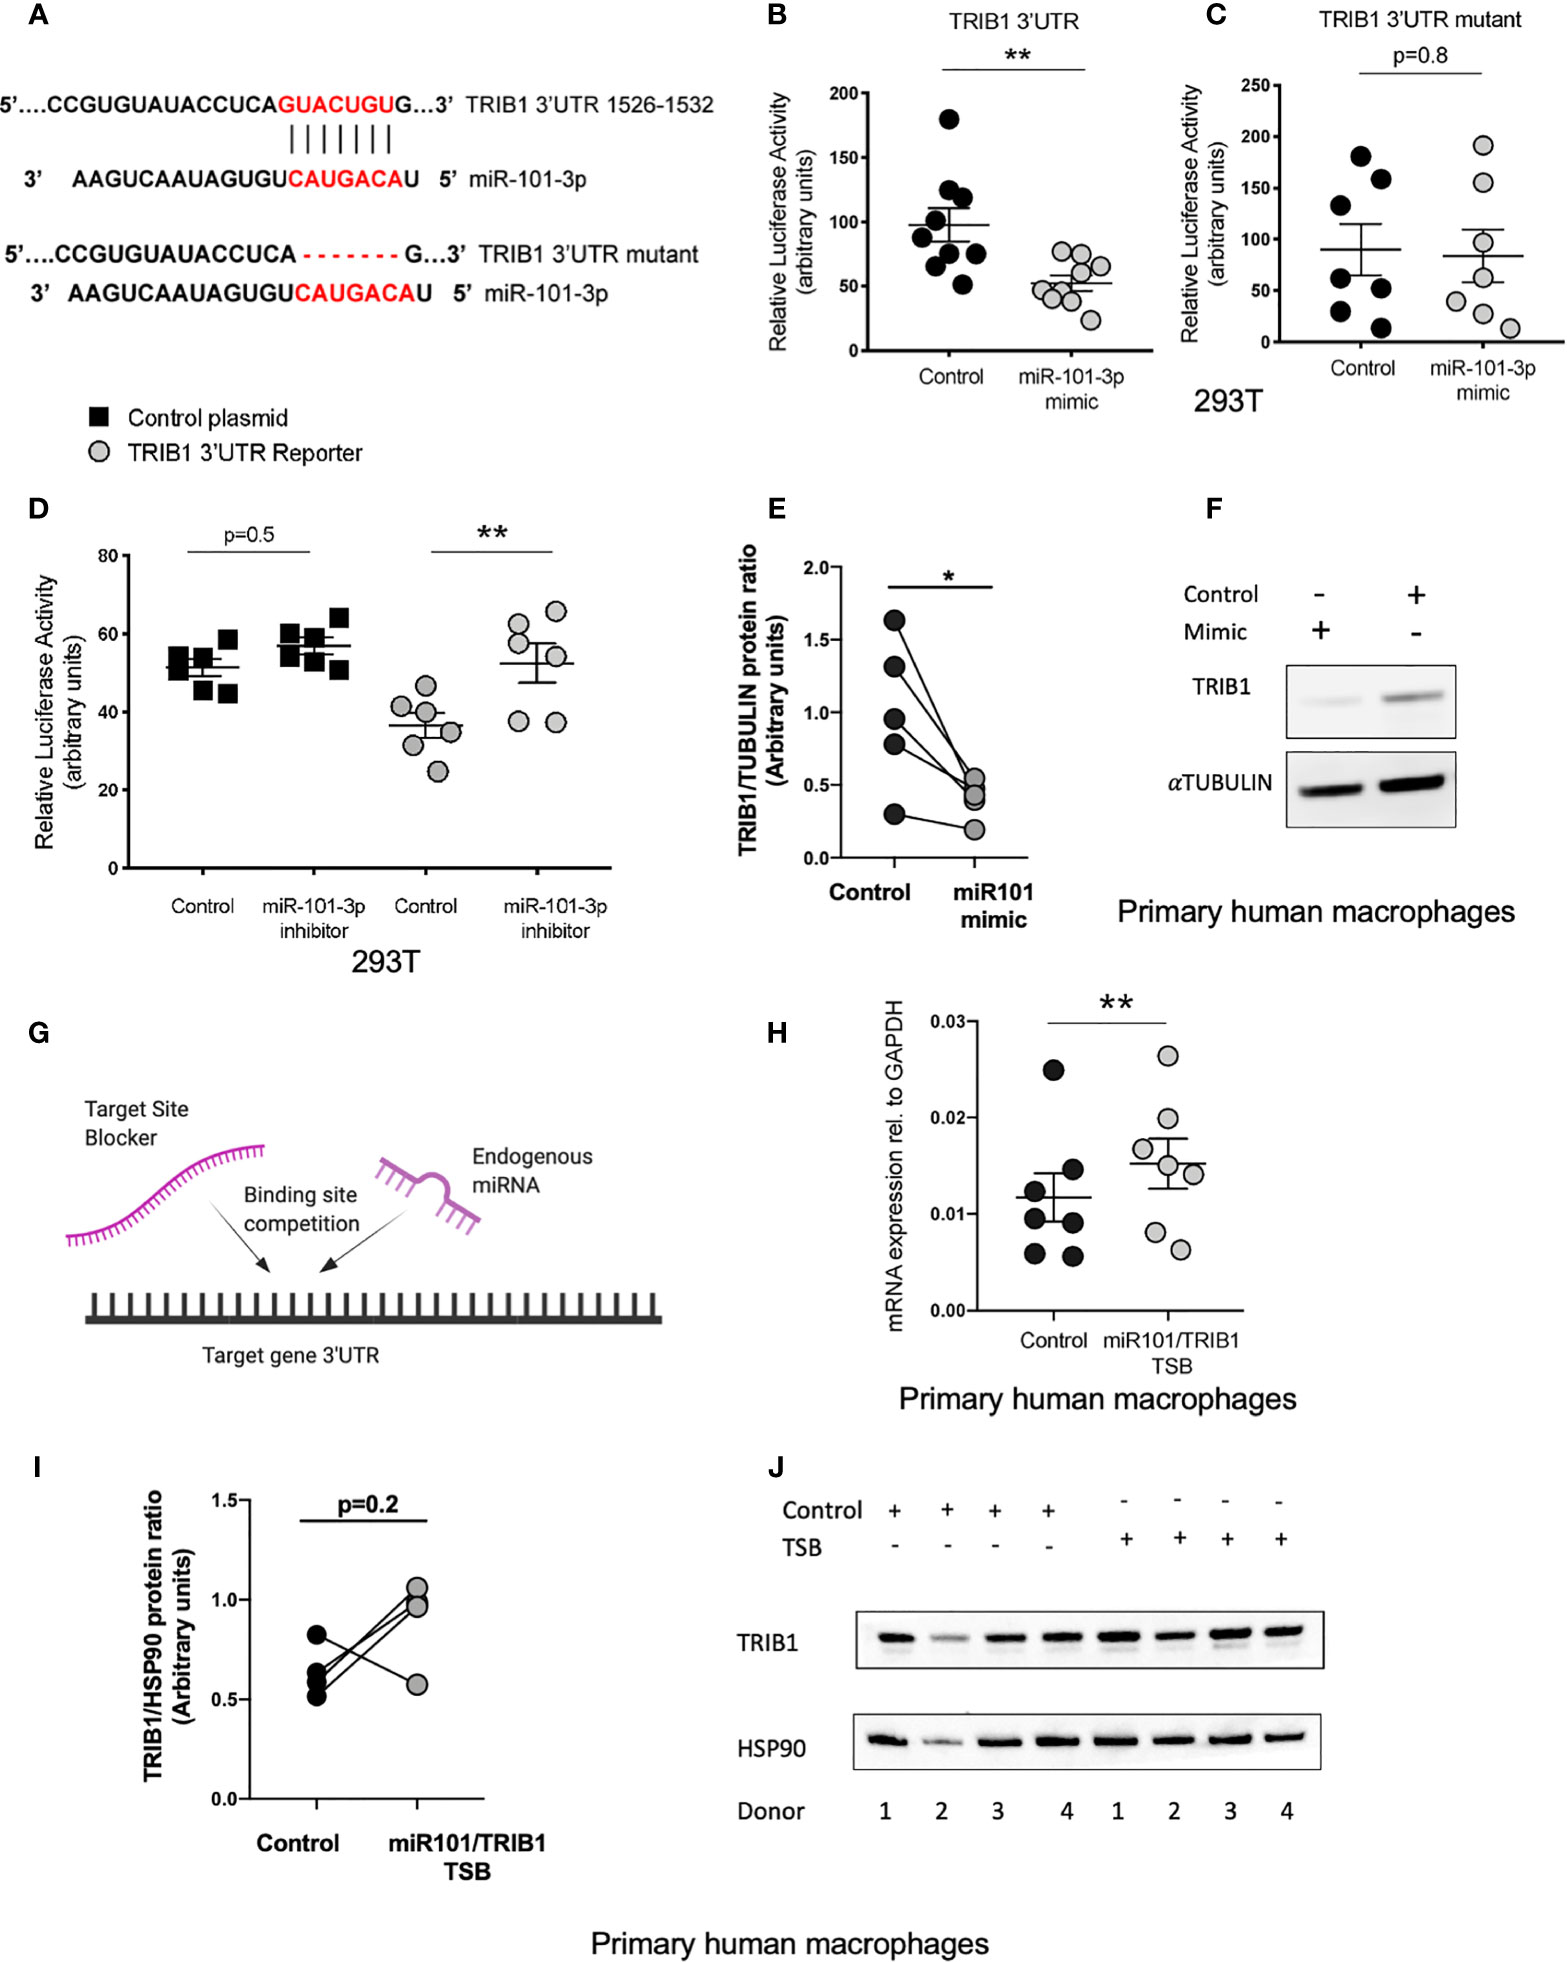
Figure 5 miR-101-3p has a functional binding site in the 3’UTR of TRIB1. (A) Schematic alignment of miR-101-3p with the 3’UTR of TRIB1 and its “binding site” mutant. (B) Relative luciferase activity measured in HEK293T cell line after co-transfection of the TRIB1 3’UTR renilla reporter (95 ng/well) with miR-101-3p mimic and a negative control (+firefly luciferase reporter, 5 ng/well), (n = 9, biological replicates, unpaired t-test, **p < 0.01). (C) Relative luciferase activity measured in HEK293T cell line after co-transfection of the TRIB1 3’UTR renilla reporter “mutant” (95 ng/well) with miR-101-3p mimic and a negative control (+ firefly luciferase reporter, 5 ng/well), (n = 7, biological replicates, unpaired t-test, no statistical significance p > 0.05). (D) Relative luciferase activity measured in HEK293T cell line after co-transfection of the renilla luciferase reporter (control, 95 ng/well) and TRIB1 3’UTR renilla reporter (TRIB1 3’UTR, 95 ng/well) with miR-101-3p inhibitor and a negative control (+ firefly luciferase reporter, 5 ng/well), (n = 6, biological replicates, ordinary one-way ANOVA with Sidak’s post-test, **p < 0.01, no statistical significance p > 0.05). (E, F) Trib1 protein levels relative to the housekeeping α-tubulin in MDMs transiently transfected with miR-101-3p mimic/negative control and representative immunoblot (n = 5, biological replicates, paired t-test, *p < 0.05). (G) Schematic representation of TSB/endogenous miRNA competition for the target site. (H) Relative TRIB1 mRNA expression normalized to the housekeeping GAPDH in MDMs transiently transfected with miR-101/TRIB1 TSB and a negative control (n = 7, biological replicates, paired t-test, **p < 0.01). (I, J) Trib1 protein levels relative to the housekeeping Hsp90 in MDMs transiently transfected with miR-101/TRIB1 TSB/negative control and representative immunoblot (n = 4, biological replicates, paired t-test, no statistical significance p > 0.05). Data are presented as mean ± SEM (scatter dot plot where each dot represents an individual donor of MDMs or different passages of HEK293T cells). Each biological replicate represents the average of 3 technical replicates. Transient transfection of both DNAs and RNAs was carried out for 24 h. Mimic/control, inhibitor/control and TSB/control were used at 50, 25, and 50 nM, respectively. RT-qPCR data were analyzed using the 2(−Δct) method.
miR-101-3p Drives a Pro-Inflammatory Phenotype in Human Macrophages
In macrophages, miR-101-3p was previously identified as a direct regulator of the dual specificity phosphatase 1 (DUSP1) (40) and ATP-binding cassette transporter A1 (ABCA1) (41) genes. This was associated with the activation of p38 and JNK and inhibition of cholesterol efflux under inflammatory and non-inflammatory conditions, respectively (40, 41). We confirmed the negative effect of miR-101-3p overexpression on DUSP1 and ABCA1 mRNA in unpolarized human MDMs (Supplementary Figures 6A, B) and its impact on cholesterol efflux to HDL (Supplementary Figure 6C). We next analyzed the expression of pro- and anti-inflammatory macrophage markers by RT-qPCR. We observed that miR-101-3p significantly increased the mRNA levels of IL-6, IL-8, TNF-α, CD80, and CD86 (Figure 6A), but had no effect on the anti-inflammatory markers CD36, CD163 and IL-4 (Figure 6B). We performed IL-8 ELISA on MDMs transfected with miR-101-3p mimic and miR-101/TRIB1 TSB and found that the mimic enhanced IL-8 secretion (p = 0.007), while the TSB diminished it (p = 0.01) (Figure 6C). Additionally, we tested the impact of miR-132-3p, which downregulated the mRNA of TRIB1 in both human and murine macrophages (see Figure 4B). IL-8 secretion was significantly increased in response to miR-132-3p mimic (p = 0.01), suggesting that TRIB1 is a regulator of IL-8, downstream of the miRNAs tested. Overall, we conclude that miR-101-3p and miR-132-3p drive an inflammatory phenotype in human macrophages, at least in part by targeting TRIB1.
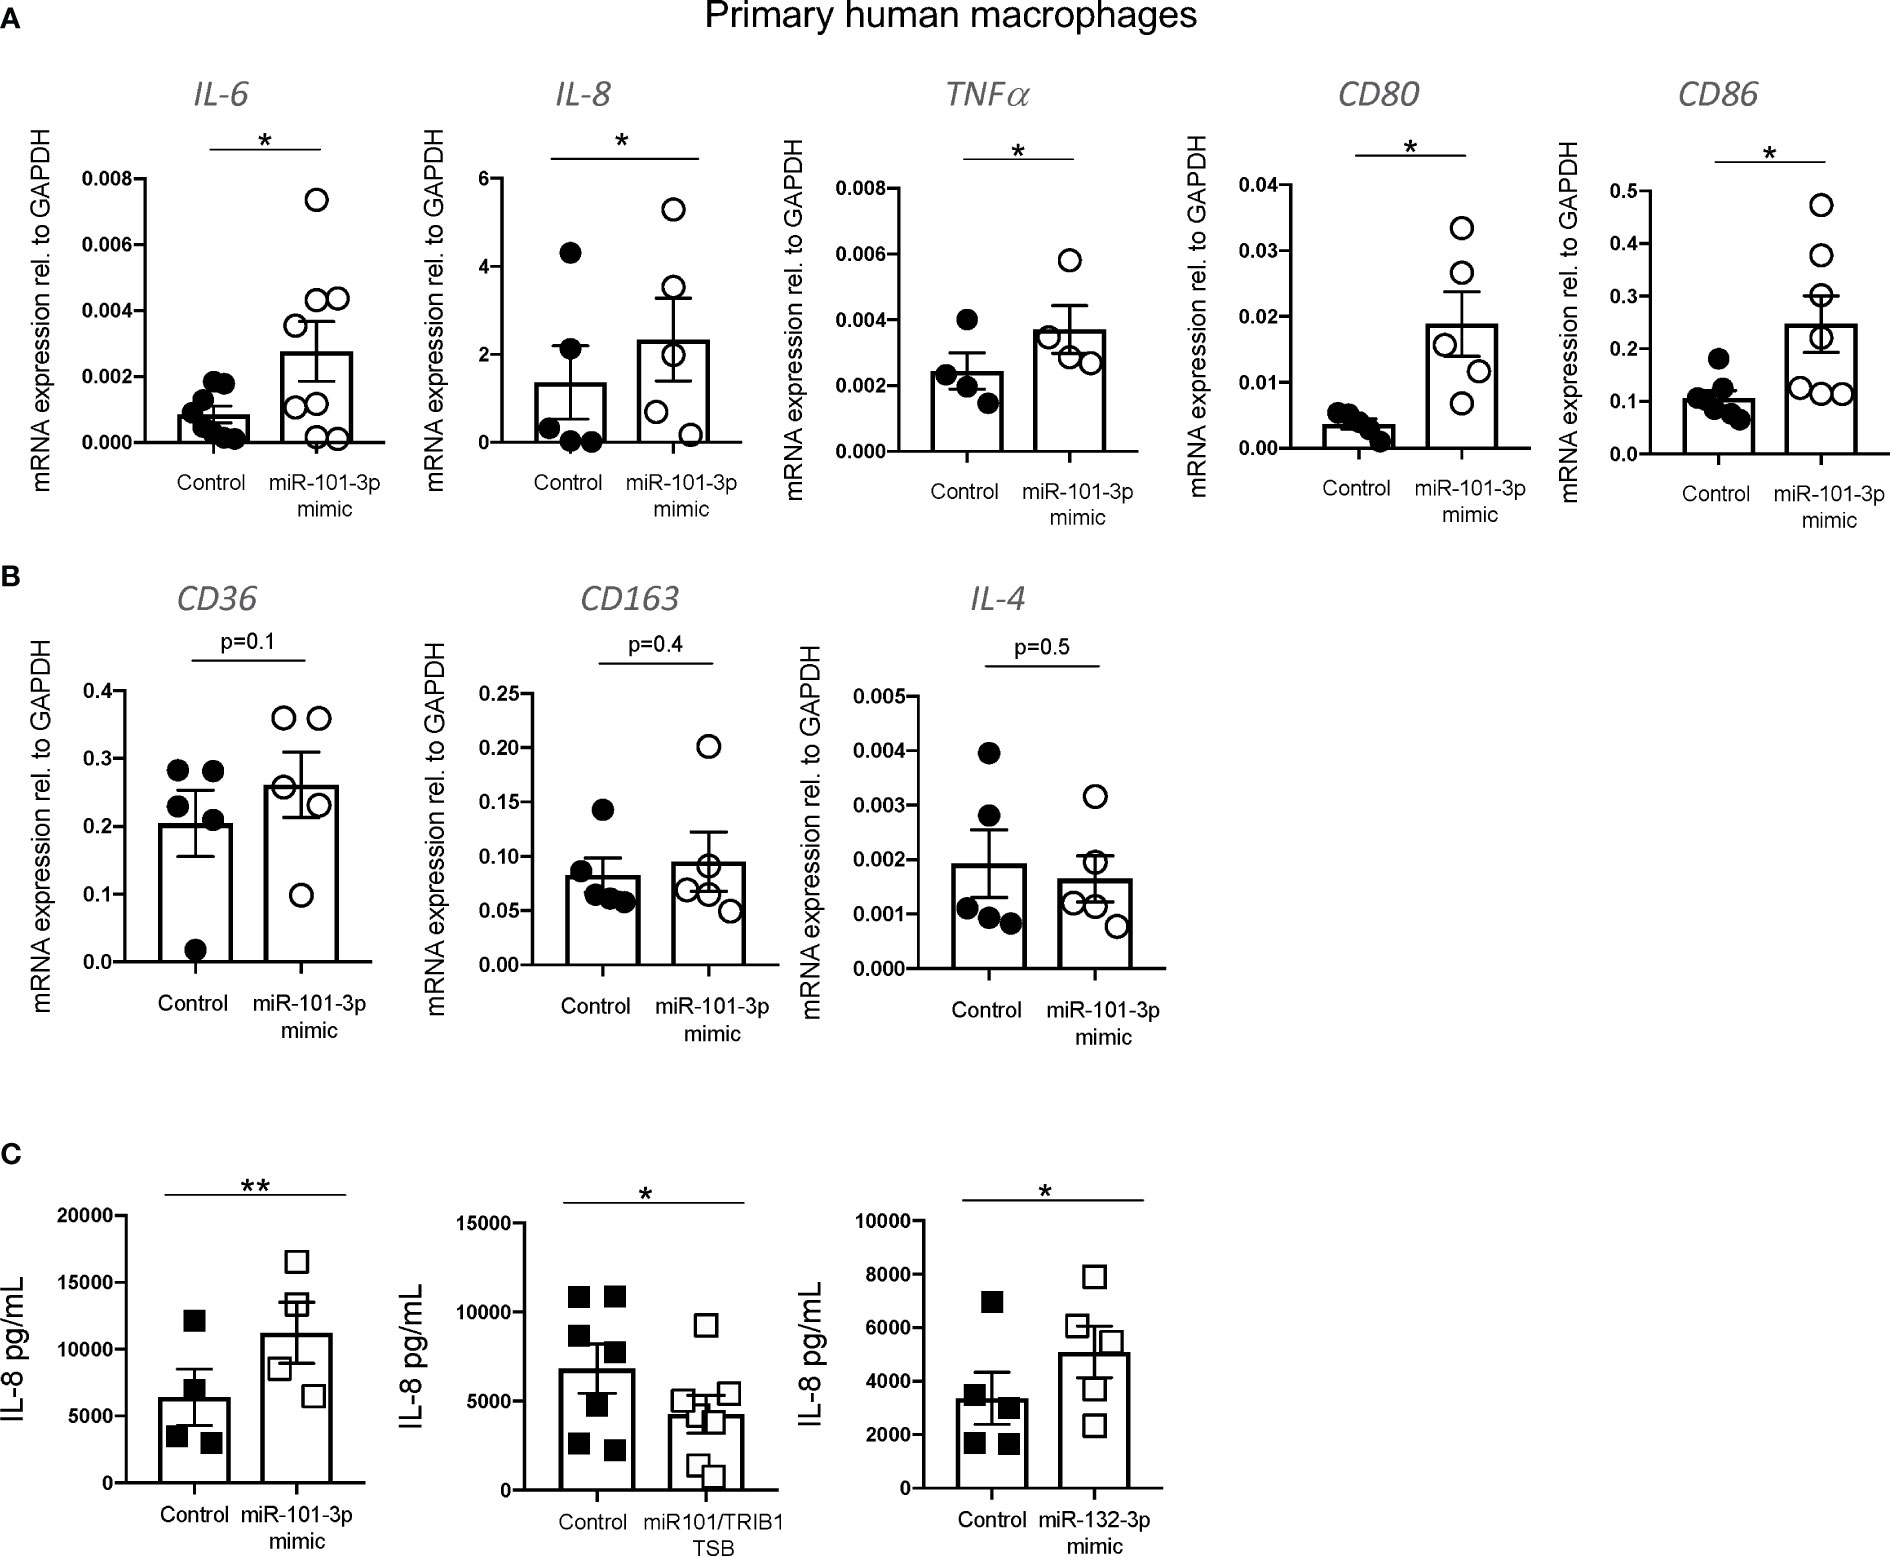
Figure 6 miR-101-3p drives a pro-inflammatory phenotype in human macrophages. (A, B) Relative mRNA expression of pro-inflammatory IL-6, IL-8, TNF-α c, CD80, and CD86 and anti-inflammatory macrophage markers CD36, CD163 and IL-4 normalized to the housekeeping GAPDH in MDMs transiently transfected with miR-101-3p mimic and a negative control. (C) Levels of IL-8 protein (pg/ml) measured from the supernatants of MDMs transiently transfected with miRNAs mimics and miR-101-3p/TRIB1 TSB. Data are presented as mean ± SEM (scatter dot plot where each dot represents an individual donor of MDMs). Each biological replicate represents the average of 3 technical replicates; (n = 4–8, biological replicates, paired t-test, **p < 0.01, *p < 0.05, no statistical significance p > 0.05). Transfection was carried out for 24 h, employing 50 nM of test and control RNAs. RT-qPCR data were analyzed using the 2(−Δct) method.
TRIB1 Is a Target of miRNAs Downregulated in Prostate Cancer
It is widely reported that in prostate cancer the majority of dysregulated miRNAs are either silenced by epigenetic modifications or downregulated (43–45). At the same time, TRIB1 has been reported to be upregulated in this cancer (10). To address the hypothesis that TRIB1 upregulation occurs as a result of downregulation of endogenous miRNAs, we first assessed the endogenous TRIB1 expression in in vitro models of prostate cancer. To this end we used PWR1E and RWPE1 as normal prostate epithelial cells and PC3 and LNCAP as cancer cell lines. The mRNA expression of TRIB1 was significantly upregulated in PC3 and LNCAP cells, compared to RWPE1, non-cancer prostate epithelial cells (Figure 7A). Next, we used the miRCancer database to download the list of miRNAs reported to be dysregulated in prostate cancer and found that 21 downregulated miRNAs are also predicted to target the 3’UTR of TRIB1, according to TargetScan (Figure 7B and Supplementary Table 7). Among them, we selected miR-132-3p and miR-224-5p, since both of these miRNAs are established to be silenced in prostate cancer (38, 46). Additionally, as described above, miR-132-3p is a potential regulator of TRIB1 in both human and murine macrophages and miR-224-5p has also been already implicated in the regulation of this pseudokinase in prostate cancer (47). Therefore, we assessed the expression of these miRNAs in PC3 and LNCAP cells. Considering our previous findings, we included miR-101-3p as it was also listed as miRNA downregulated in prostate cancer, according to the miRCancer database. miR-132-3p was significantly downregulated in both cell lines, compared to controls (Figure 7C), while miR-224-5p was not detectable in the cancer cells (Figure 7D). On the contrary, the endogenous expression of miR-101-3p in PC3 and LNCAP lines was not significantly different from the controls (Figure 7E). Therefore, we next focused on the activity of miR-132-3p. miR-132-3p has two predicted binding sites on the 3’UTR of TRIB1 (Figure 7F). Despite not being highly conserved, the target sites are both characterized by a 7mer-m8 seed region (Supplementary Table 7). When tested in a luciferase assay, miR-132-3p mimic led to a significant reduction of the TRIB1 3’ UTR reporter activity, compared to control (p = 0.02) (Figure 7G). Transfection of the inhibitor led to an increase in the luciferase activity, on average, however this did not reach statistical significance (p = 0.09) (Figure 7H). We note that miRNA inhibitors are often less effective in rescuing miRNA-target expression, especially when the endogenous miRNAs they target are present at low levels. Next, we performed a transient transfection of PC3 cells with TRIB1 siRNA/scramble and miR-132-3p mimic/control and analyzed the gene expression profile of pro-inflammatory cytokines and cancer-related genes and found similar signatures. The assessment of TRIB1 mRNA downregulation induced by the siRNA and miR-132-3p is shown in Figures 8A, D, respectively. Either condition led to significant upregulation of pro-inflammatory cytokines (IL-6, IL-8 and IL-1β) (Figures 8B, E), in line with our above presented data obtained in human macrophages. The immune checkpoint regulator gene, PD-L1, was also significantly increased in both conditions, while the extracellular matrix glycoprotein SPAR-C was enhanced only in PC3 cells treated with TRIB1 siRNA (p = 0.01) (Figures 8C, F), hinting a role for TRIB1 in the regulation of cancer immune escape and invasion properties. Put together, these results suggest that the miR-132-3p/TRIB1 axis may be a regulator of the immunological profile of prostate cancer.
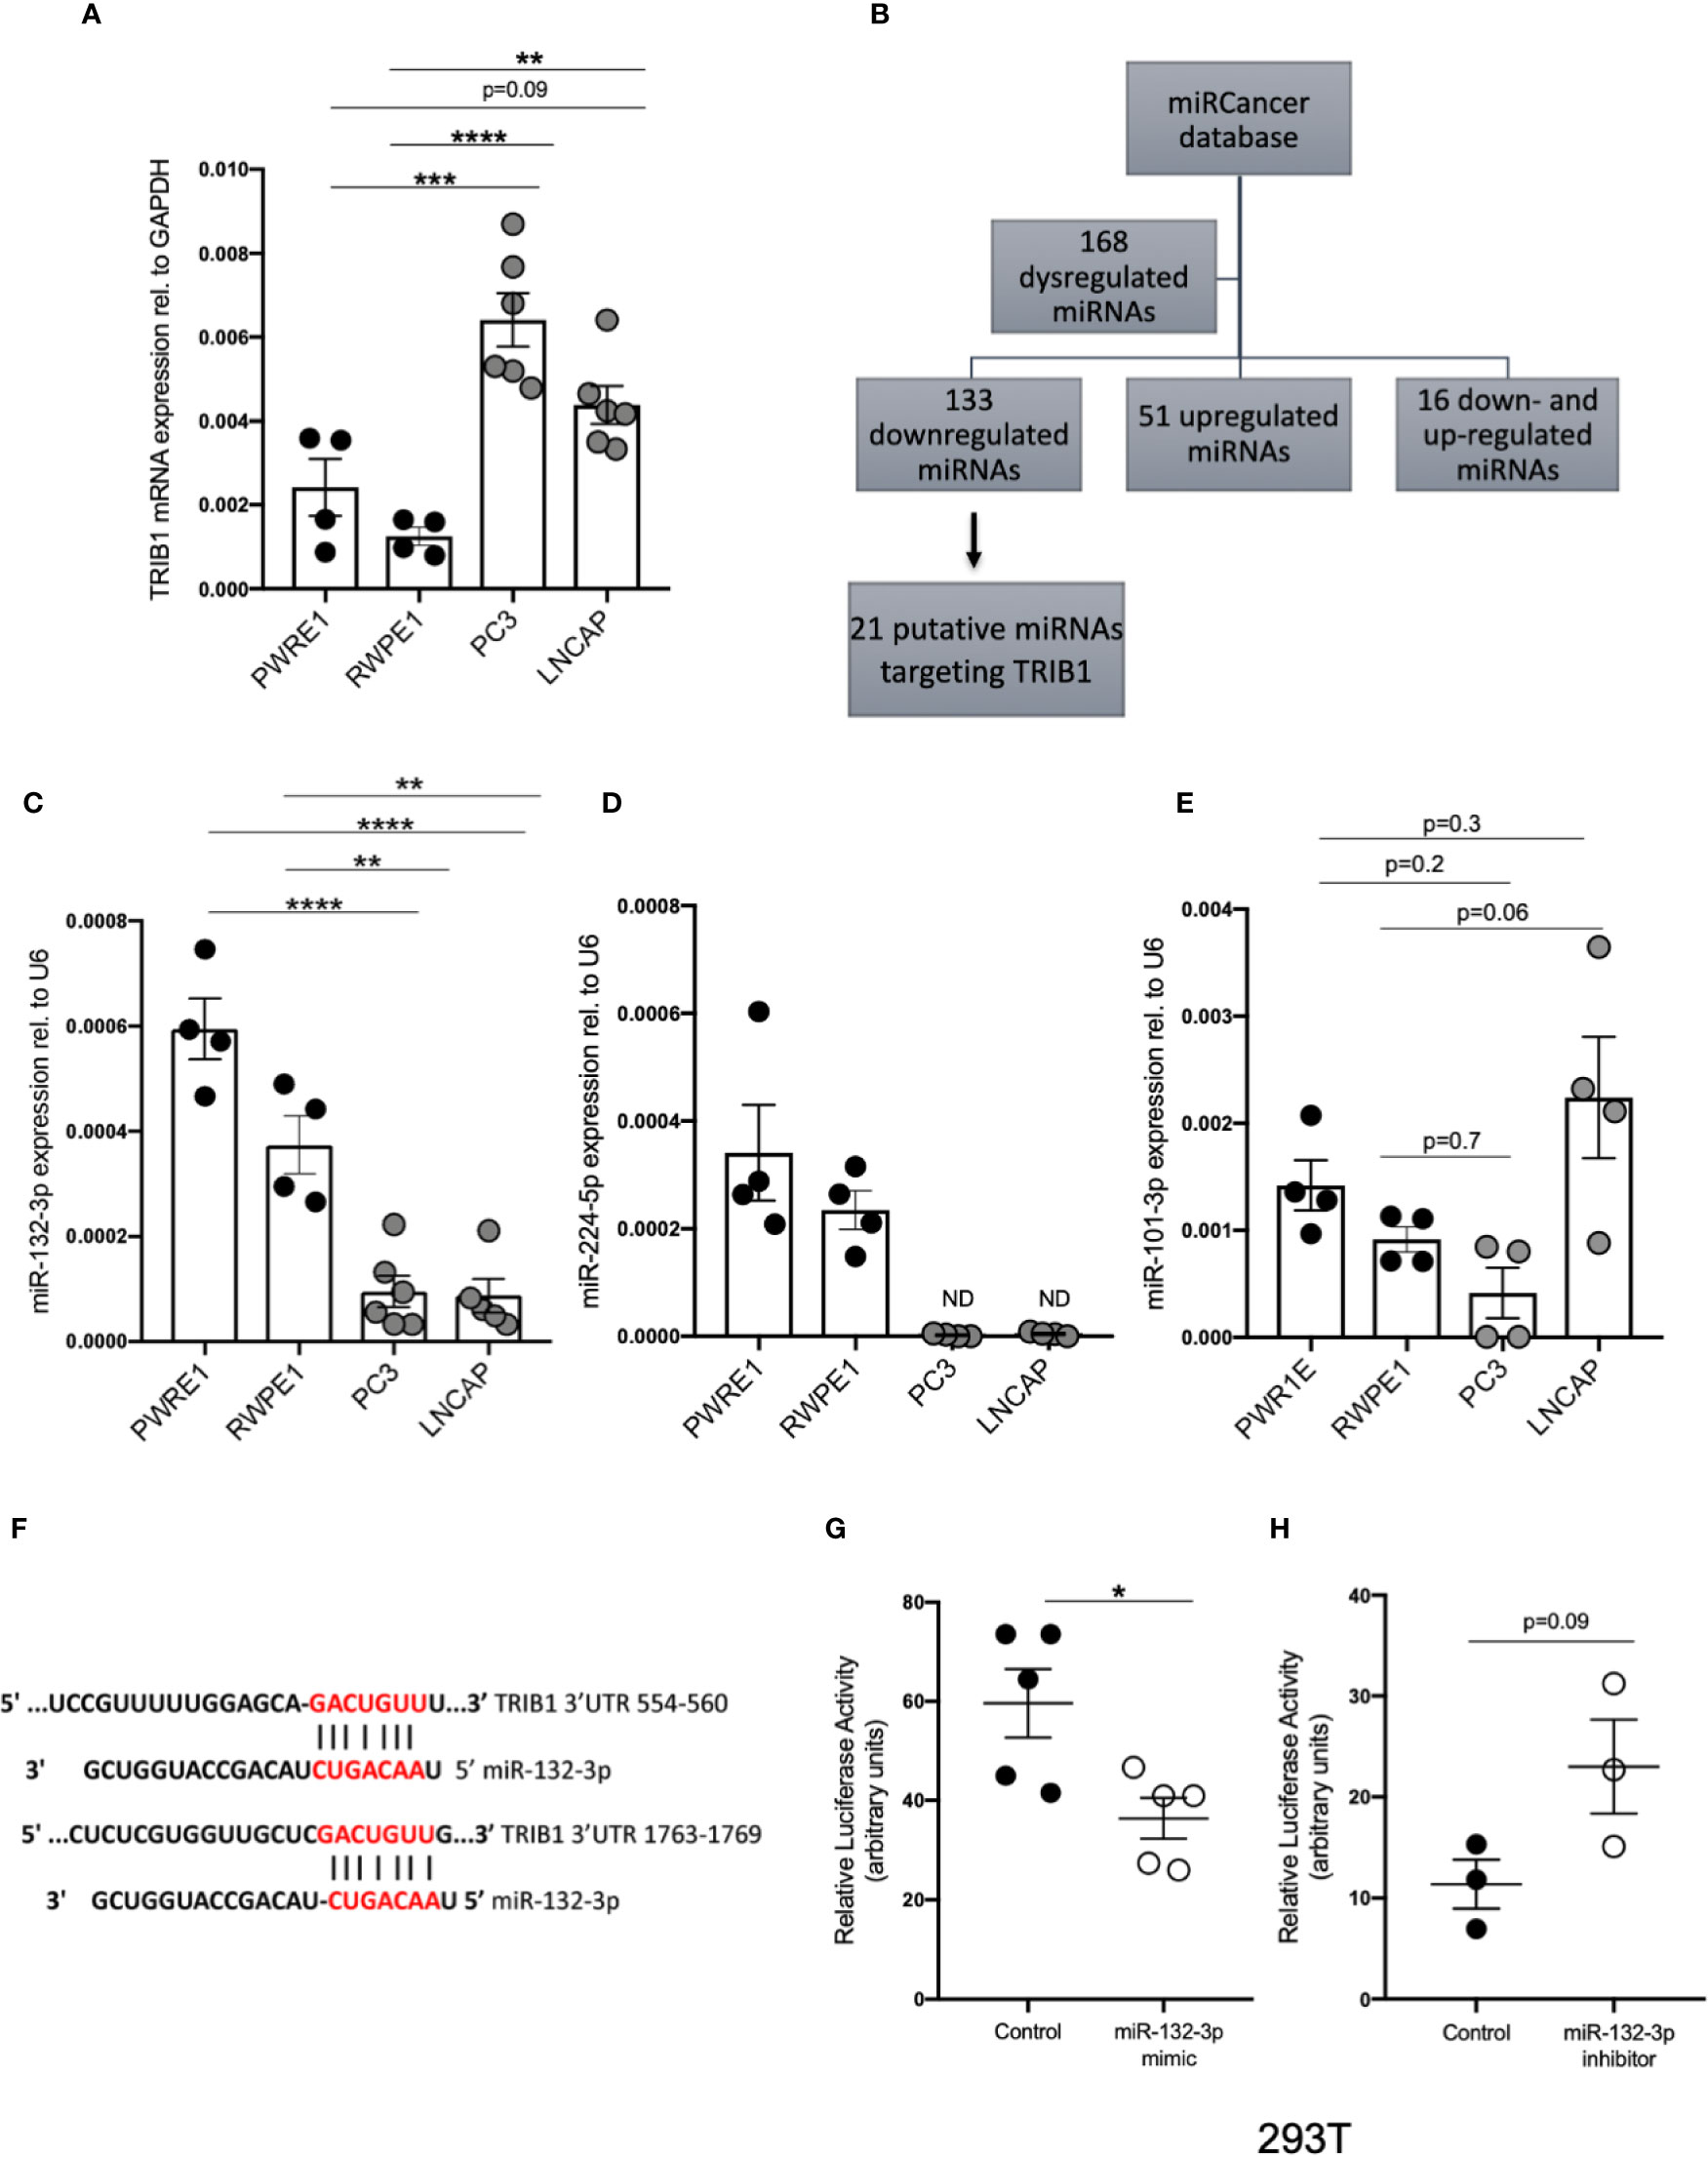
Figure 7 TRIB1 is a target of miRNAs downregulated in prostate cancer. (A) Relative mRNA expression of TRIB1 normalized to the housekeeping GAPDH in prostate cancer cell lines (n = 4–6, biological replicates, ordinary one-way ANOVA with Sidak’s post-test, ****p < 0.0001, ***p < 0.001, **p < 0.01, no statistical significance p > 0.05). (B) Flowchart for the detection of miRNAs downregulated/silenced in prostate cancer and potentially targeting the 3’UTR of TRIB1. (C–E) Relative expression of miR-132-3p, miR-224-5p and miR-101-3p normalized to the housekeeping U6 in a panel of prostate cancer and control cell lines (n = 4–6, biological replicates, ordinary one-way ANOVA with Sidak’s post-test, ****p < 0.0001, **p < 0.01, ND not detected, ns p > 0.05). (F) Schematic representation of miR-132-3p binding sites in two different positions of TRIB1 3’UTR. (G, H) Relative luciferase activity measured in HEK293T cell line after co-transfection of co-transfection of the TRIB1 3’UTR renilla reporter (95 ng/well) and miR-132-3p mimic/control (left) and miR-132-3p inhibitor/control (right) (+ firefly luciferase reporter, 5 ng/well) (n = 3–5, biological replicates, unpaired t-test, *p < 0.05, no statistical significance p > 0.05). Data are presented as mean ± SEM (scatter dot plot where each dot represents different passages of cell lines). Each biological replicate represents the average of 3 technical replicates. Transfection of plasmids and RNAs was carried out for 24 h. Mimic/control and inhibitor/control were used at 50 and 25 nM, respectively. RT-qPCR data were analyzed using the 2(−Δct) method.
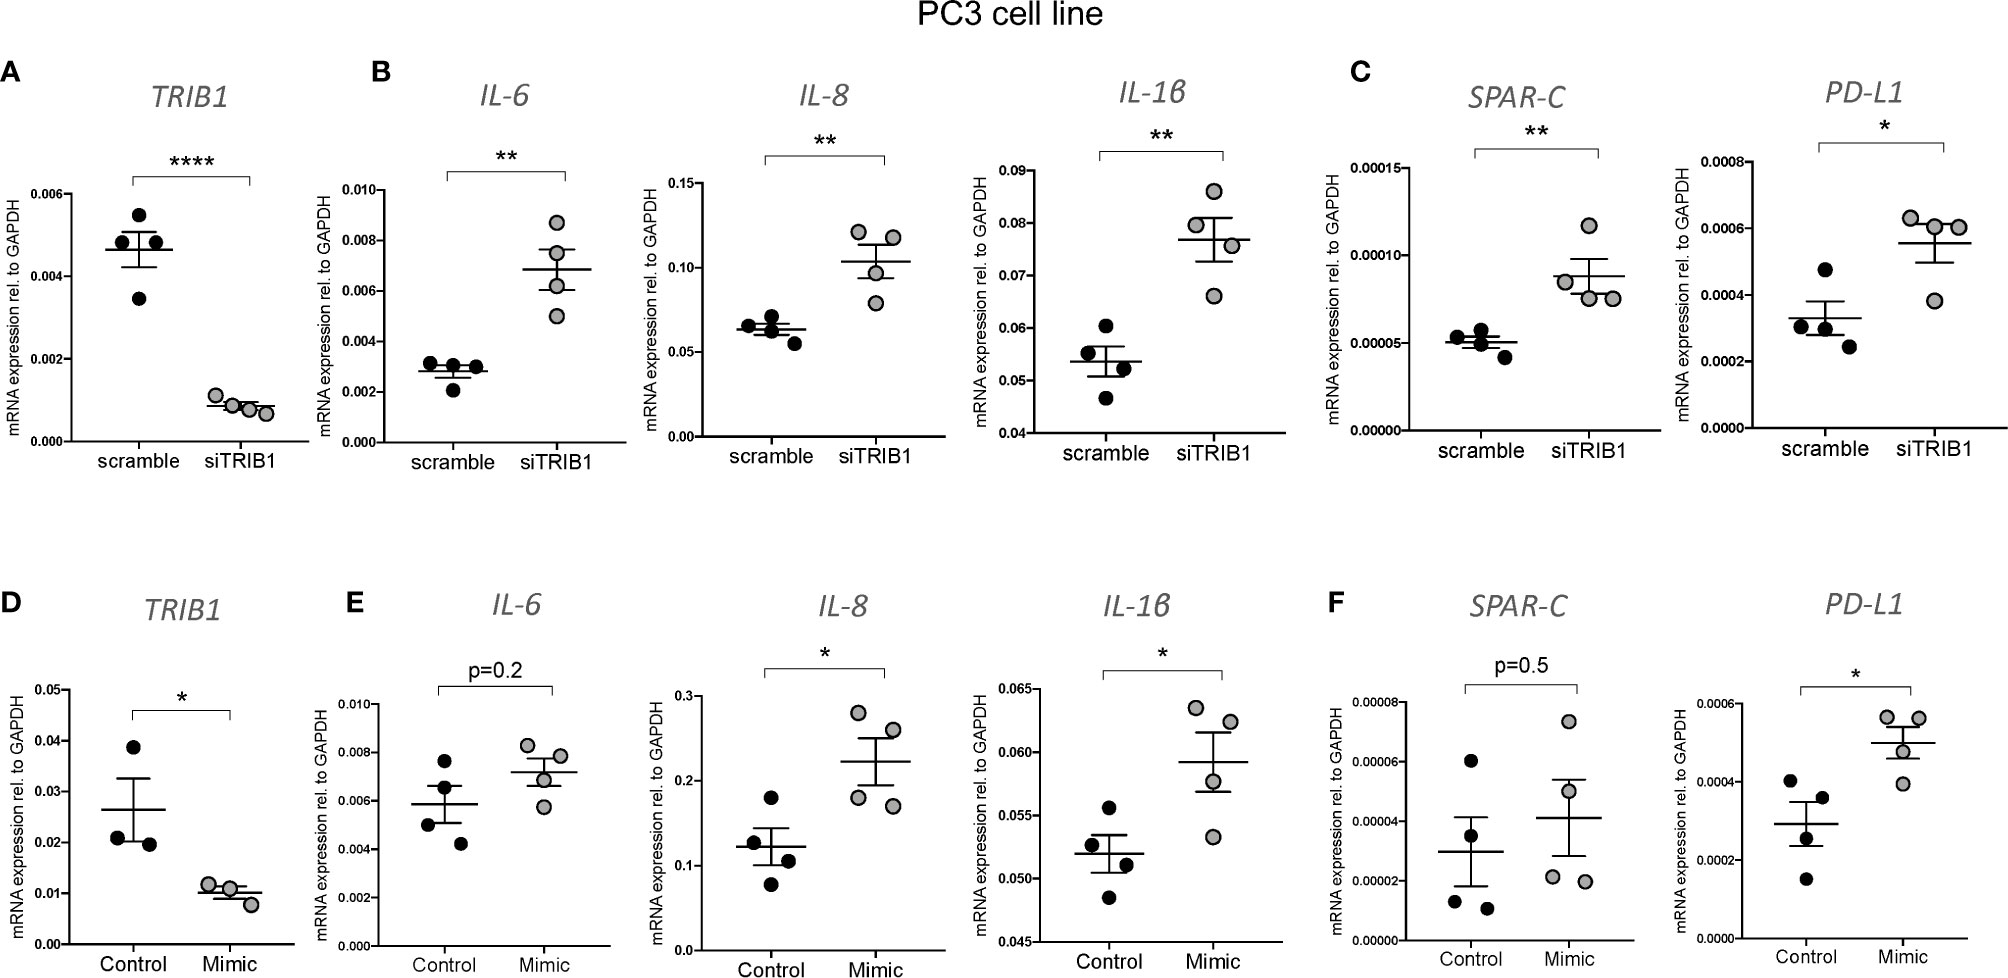
Figure 8 TRIB1 knock-down and miR-132-3p overexpression in PC3 cell lines. (A, D) Relative TRIB1 mRNA expression normalized to the housekeeping GAPDH in PC3 cell line transiently transfected with siTRIB1/Scramble and miR-132-3p/control (n = 3–4, biological replicates, unpaired t-test, ****p < 0.0001, *p < 0.05). (B, C, E, F) Relative mRNA expression of inflammatory markers and cancer-related genes normalized to the housekeeping GAPDH in in PC3 cell line transiently transfected with siTRIB1/Scramble and miR-132-3p/control (n = 4, biological replicates, unpaired t-test, **p < 0.01, *p < 0.05, no statistical significance p > 0.05). Data are presented as mean ± SEM (scatter dot plot where each dot represents a different passage of PC3 cells). Each biological replicate represents the average of three technical replicates. Transfection was carried out for 24 h. Mimic/control and siTRIB1/Scramble were used at 50 nM. RT-qPCR data were analyzed using the 2(−Δct) method.
Discussion
Since their discovery 20 years ago (48, 49), Tribbles proteins have gained significant attention and have been implicated in many different pathologies, including cancer, cardiovascular disease, and metabolic disorders (5, 9, 10, 50–52). The role of TRIB1 has been particularly studied in myeloid cells and adipose tissue, and linked to the regulation of anti-inflammatory macrophage polarization and inflammatory responses (7, 8, 32). Recently, it has emerged that TRIB1 is often overexpressed in prostate cancer and is associated with cancer risk, but not with aggressiveness and survival (37). Although TRIB1-mediated signaling pathways are well characterized (1, 2, 34, 53), the upstream mechanisms underlying its regulation remain unknown. The observation that altered expression of Trib1 in myeloid cells leads to significant changes in the phenotypes of liver and adipose macrophages provides further evidence for the importance of this pseudokinase in regulating metabolic homeostasis.
This prompted us to explore upstream factors, with focus on miRNAs, that may be important in regulating Trib1 expression levels in macrophages, as well as exploring whether similar regulatory mechanisms may control TRIB1 levels in cellular models of PCa. Thus, we looked at the post-transcriptional regulation of TRIB1, with a focus on the importance of its 3’ UTR. This region of eukaryotic mRNAs has been extensively studied and several types of regulatory elements contributing to the control of mRNA (in)stability have been described ([a recent review, see (54)]. A study conducted in murine embryonic stem cells reported that TRIB1 mRNA has a half-life shorter than 1 h and it was ranked among the top 50 most unstable genes (12). As the human TRIB1 mRNA is characterized by a 2 kb long and conserved 3’UTR, we proposed that regulatory sequences within this may contribute to the control of TRIB1 mRNA stability, including a role for miRNAs. In line with this hypothesis, we showed that the 3’UTR of TRIB1 had a strong, negative effect on luciferase expression by using a reporter assay. Our in-silico analysis indicated that multiple “high-confidence” miRNAs are predicted to bind to the 3’UTR of TRIB1. So far, only miR-23a and miR-224-5p have been experimentally validated and shown to downregulate TRIB1 expression in hepatocellular carcinoma and prostate cancer models, respectively (47, 55). Specifically, we demonstrated that miR-101-3p and miR-132-3p were able to negatively modulate both human and murine TRIB1 mRNA expression in macrophages. To elucidate the biological impact of these miRNAs, we performed an enrichment pathway analysis using their predicted target genes, selecting only those expressed by human macrophages. Among the top 10 enriched terms for miR-101-3p target genes we observed MAPK and chemokine signaling pathways, both of which have previously been shown to be extensively regulated via Trib1. We demonstrated that the experimental overexpression of miR-101-3p in primary human macrophages led to a significant increase in the mRNA levels of pro-inflammatory markers, such as IL-6, IL-8, TNF-α, CD80, and CD86. It has been previously reported that TRIB1 regulates the activity of the IL-8 promoter in a gene reporter assay (2). More recently, it was shown that TRIB1 negatively regulates IL-8 secretion by inhibiting IKB-zeta in prostate cancer cells (11). To investigate the consequences of the putative interaction between endogenous miR-101-3p and TRIB1 mRNA, we evaluated the impact of miR-101-3p on both TRIB1 expression and IL-8 secretion by employing a TSB, a molecule designed to selectively prevent the endogenous miR from binding the mRNA of only TRIB1, without altering the miRNA expression itself. The TSB caused a significant increase in the steady-state mRNA of TRIB1 and a reduction in IL-8 secretion. Similarly, we showed that miR-132-3p mimics downregulated TRIB1 and enhanced secreted IL-8 protein levels. Therefore, our findings indicate that endogenous miRNAs are able to control TRIB1 expression and, in turn, regulate IL-8 via targeting TRIB1. Of note, miR-132-3p was also shown to increase IL-8 levels in human adipocytes by targeting SirT1 and thus activating NF-κB (56), a key activator of inflammation and the latter also being a known TRIB1 target (7, 57). In light of our data, it is plausible that the miR-132-3p/TRIB1 regulatory axis may play a part in this. However, we also explored the interaction between miR-132-3p and TRIB1 in the context of prostate cancer. Our KEGG analysis of miR-132-3p predicted targets showed an enrichment of genes involved in prostate cancer. Although miR132 did not show the highest number of gene reads in PCa, we focused on this pathway because miR-132-3p is usually silenced by promoter hypermethylation in prostate cancer (38). A number of studies reported that restoring miR-132-3p expression in prostate cancer resulted in the suppression of cell proliferation, migration and invasion (38, 39, 58, 59). In addition to miR-132-3p, we identified 20 other miRNAs which are either silenced or downregulated in prostate cancer and also predicted to target TRIB1, with multiple binding sites, including miR-101-3p. Thus, we speculate that the downregulation of endogenous miRNAs could, at least in part, account for the elevated expression of TRIB1 in prostate cancer, the causes of which have not been established yet (10, 37, 47). Here, we assessed the endogenous expression of miR-132-3p, miR-224-5p and miR-101-3p in a panel of prostate cancer cell lines and controls. We selected miR-132-3p and miR-101-3p as we validated their impact on TRIB1 in human macrophages, and miR-224-5p as a positive control. In fact, miR-224-5p has previously been shown to be downregulated in prostate cancer and to target TRIB1 and inhibit prostate cancer growth in vitro (47). We found that miR-132-3p and miR-224-5p were significantly downregulated in cancer cells compared to controls, while the expression of miR-101-3p did not show any significant changes among the different cell lines. As the interaction between TRIB1 and miR-224-5p has been functionally validated already (47), we focussed on miR-132-3p, showing that the downregulation of TRIB1 by either a small interfering RNA or miR-132-3p mimic led to similar transcriptomic signatures in PC3 cells and confirmed the impact of the pseudokinase on IL-6 and IL-8 mRNA expression, even in non-myeloid cells. Of interest, MSR1 expression has also been enhanced in the presence of overexpressed TRIB1. In addition to being a widely used marker of M2-like macrophages, this gene has also been linked to the development of prostate cancer (60, 61). The immune checkpoint regulator gene, PD-L1 also increased in both conditions, suggesting a role for TRIB1 in regulating the “immune escape” of prostate cancer. While our data presented in this paper provides evidence for TRIB1 altering macrophage phenotypes (pro- vs. anti-inflammatory) both in murine metabolic tissues and human monocyte-derived macrophages, further mechanistic studies are required to elucidate the full impact of these TRIB1-mediated changes on prostate cancer cells. However, our data supports the hypothesis that the role of TRIB1 in prostate cancer is, at least in part, linked to macrophage polarization and function, as a recent work has suggested (11). In fact, Liu and colleagues demonstrated that high levels of TRIB1 in prostate cancer correlate with CD163+ macrophage infiltration. In addition, they showed that TRIB1 inhibits the secretion of cytokines from prostate cancer cells via inhibition of IKB-zeta. This, in turn, leads to the differentiation of anti-inflammatory M2-like macrophages in the surrounding microenvironment, which supports tumour growth (11). Of particular interest, a recent from Carracedo and his colleagues (62) demonstrates a cancer cell-intrinsic role for TRIB1 in prostate cancer by showing that TRIB1 often overexpressed in PCa, and that overexpression of this gene in the prostate epithelium accelerates tumourigenesis in a mouse model. Thus, our data and the literature collectively suggest an important regulatory role for TRIB1 both in macrophages and tumour cells, thus may provide a novel mechanism for the interplay between the tumour microenvironment and cancer cells.
In summary, in this report, we have demonstrated that TRIB1 is subject to post-transcriptional regulation by miRNAs. By using a systematic miRNA-target prediction analysis, we identified a number of “high-confidence” miRNAs predicted to bind to the 3’UTR of TRIB1 through a canonical seed region matching. We experimentally validated the interaction of the 3’UTR of TRIB1 with miR-101-3p and miR-132-3p in human macrophages and prostate cancer, respectively, showing that they control TRIB1 expression and, in turn, alter the mRNA and protein levels of IL-8. Of note, data we present on miRNA-132-3p action is lacking TSB blockade validation, similar to as shown for miRNA-101-3p, due to constrains of overall available primary macrophage cell numbers used in these experiments. However, we also recognize that the presented association between TRIB1-regulating miRNAs and the development of PCa is largely correlative in nature, thus future investigations will be required to further substantiate the biological relevance of these findings.
We also note that some of the data presented here is preliminary in nature and analysis of larger number of replicates have been severely hampered by the impact of COVID19 pandemic imposed restrictions. In addition to technical challenges of restricted working patterns, this disease is driving a severe monocyte/macrophage response is often asymptomatic or very mildly symptomatic in younger adults, thus controlling for potential effects of SARS-COV-2 in human monocyte-derived macrophages obtained from healthy volunteers that may interfere with our readouts is very challenging.
Data Availability Statement
The original contributions presented in the study are included in the article/Supplementary Material. Further inquiries can be directed to the corresponding authors.
Author Contributions
CN, OV, IS, HW, and EK-T conceived the experiments. CN, JJ, SD, SS, and ZS performed all the experiments and bioinformatics analysis. All authors contributed to the article and approved the submitted version.
Funding
This work was funded by the European Marie Sklodowska Curie ITN Project TRAIN-TRIBBLES Research and Innovation Network (Grant No. 721532) and funds from the British Heart Foundation (PG/16/44/32146). We are very grateful to Veronika Kiss-Toth, Jonathan Kilby, Benjamin Durham, Markus Arians, Fiona Wright, and Yvonne Stephenson for their great technical support.
Conflict of Interest
The authors declare that the research was conducted in the absence of any commercial or financial relationships that could be construed as a potential conflict of interest.
Supplementary Material
The Supplementary Material for this article can be found online at: https://www.frontiersin.org/articles/10.3389/fimmu.2020.574046/full#supplementary-material
Supplementary Figure 1 | Immunofluorescence: isotype controls and ATM staining. FFPE adipose tissue from myeloid Trib1 mice were stained with F4/80 (red) and the anti-inflammatory/M2 marker YM1 (green). Representative image of isotype controls and ATM staining is shown. Enlarged image of the boxed area is shown illustrating F4/80+ macrophage and dual positive (F4/80+ YM1+) macrophage.
Supplementary Figure 2 | Genetic manipulation of myeloid Trib1 alters ATM phenotype in vivo. (A) Representative image of YM1 immunostaining of adipose tissue sections from Trib1mWT, Trib1mKO and Trib1mTg mice. Scale: 100µm. Enlarged image of marked area is also shown. Each n represents the mean of at least 3 fields of view from an individual mouse. (B) Quantification of F4/80 positive cells in adipose tissue sections from Trib1mWT, Trib1mKO and Trib1mTg mice. (n = 4–9 biological replicates, ordinary one-way ANOVA with Sidak’s post-test, no statistical significance p > 0.05). (C) Quantification of YM1 positive cells relative to F4/80 in adipose tissue sections from Trib1mWT, Trib1mKO and Trib1mTg mice (n = 3–6, biological replicates, ordinary one-way ANOVA with Sidak’s post-test, *p < 0.05, no statistical significance p > 0.05). Each n represents an individual mouse; mice were obtained from two independent breeding cohorts and were stained per cohort, each including WT litter-mate controls. At least 3 independent fields of view were examined per mouse.
Supplementary Figure 3 | Confirmation of TRIB1 overexpression in human macrophages. Relative TRIB1 mRNA expression normalized to the housekeeping GAPDH in MDMs transiently transfected with TRIB1 overexpression plasmid and a control plasmid (n = 4, biological replicates, paired t-test, no statistical significance p > 0.05). Data are presented as mean ± SEM (scatter dot plot where each dot represents an individual donor of MDMs). Biological replicate represents the average of 3 technical replicates. Transfection was carried out for 24 h, employing 2 µg of plasmid per well (6 well plate). RT-qPCR data were analyzed using the 2(−Δct) method.
Supplementary Figure 4 | TRIB1 3’UTR mega alignment. Overview of TRIB1 3’UTR sequences alignment in different species, generated with the software DNASTAR Lasergene (v16); miR-101-3p and miR-132-3p binding sites are highlighted in red and black, respectively.
Supplementary Figure 5 | Confirmation of miRNAs overexpression in human macrophages. Relative expression of miR-101-3p and miR-132-3p normalized to the housekeeping U6 in MDMs transiently transfected with miRNA mimics (n = 5–8, biological replicates, paired t-test, ***p < 0.001). Data are presented as mean ± SEM (scatter dot plot where each dot represents an individual donor of MDMs). Biological replicates represent the average of 3 technical replicates. Transfection was carried out for 24 h, employing 50nM of mimics and negative control. RT-qPCR data were analyzed using the 2(−Δct) method.
Supplementary Figure 6 | Effect of miR-101-3p on previously validated targets: DUSP1 and ABCA1. (A, B) Relative mRNA expression of DUSP1 and ABCA1 normalized to the housekeeping GAPDH in MDMs transiently transfected with miR-101-3p mimic and a negative control (n = 4–7, biological replicates, paired t-test, **p < 0.01, *p < 0.05). (C) Percentage of total cholesterol efflux to HDL measured in MDMs transiently transfected with miR-101-3p mimic and inhibitor (n = 6, biological replicates, paired t-test, **p < 0.01). Data are presented as individual points (A, B) and as mean ± SEM (scatter dot plot) (C). Each dot represents an individual donor of MDMs; biological replicates represent the average of 3 technical replicates. Transfection was carried out for 24 h, employing 50 nM of mimic/control and 25 nM of inhibitor/control. RT-qPCR data were analyzed using the 2(−Δct) method. As miRNA mimic and inhibitor were used at different concentrations and along with their controls (negative control mimic and negative control inhibitor) we used the paired t-test.
Supplementary Table 1 | List of RNA constructs used for transient transfection.
Supplementary Table 2 | List of primary and secondary antibodies used for western blot (WB) and immunofluorescence (IF) experiments.
Supplementary Table 3 | List of RT-qPCR primers.
Supplementary Table 4 | List of PCR primers used for site-directed mutagenesis.
Supplementary Table 5 | List of “high-confidence” miRNAs predicted to target the 3’UTR of TRIB1 by 3 different prediction tools, along with their features taken from TargetScan. The list of “high-confidence” miRNAs can be accessed and downloaded using this link ftp://mirbase.org/pub/mirbase/CURRENT (miRbase v.22).
Supplementary Table 6 | The table lists candidate miRNAs selected for experimental validation and their features, according to TargetScan; both were listed as “high-confidence” miRNAs, according to deep sequencing published data (miRbase v.22).
Supplementary Table 7 | List of miRNAs downregulated/silenced in prostate cancer and predicted to target the 3’UTR of TRIB1. miRNA-target prediction analysis was performed by using TargetScan, miRanda and Starbase. The list of dysregulated miRNAs in prostate cancer was taken from miRCancer and it is accessible at this link: http://mircancer.ecu.edu/search.jsp?mirId=&logic=&condition=Or&cancerName=prostate+cancer&buttonSearch.
References
1. Eyers PA, Keeshan K, Kannan N. Tribbles in the 21st Century: The Evolving Roles of Tribbles Pseudokinases in Biology and Disease. Trends Cell Biol (2017) 27(4):284–98. doi: 10.1016/j.tcb.2016.11.002
2. Kiss-Toth E, Wyllie DH, Holland K, Marsden L, Jozsa V, Oxley KM, et al. Functional mapping and identification of novel regulators for the Toll/Interleukin-1 signalling network by transcription expression cloning. Cell Signal (2006) 18(2):202–14. doi: 10.1016/j.cellsig.2005.04.012
3. Hegedus Z, Czibula A, Kiss-Toth E. Tribbles: novel regulators of cell function; evolutionary aspects. Cell Mol Life Sci (2006) 63(14):1632–41. doi: 10.1007/s00018-006-6007-9
4. Lohan F, Keeshan K. The functionally diverse roles of tribbles. Biochem Soc Trans (2013) 41(4):1096–100. doi: 10.1042/BST20130105
5. Röthlisberger B, Heizmann M, Bargetzi MJ, Huber AR. TRIB1 overexpression in acute myeloid leukemia. Cancer Genet Cytogenet (2007) 176(1):58–60. doi: 10.1016/j.cancergencyto.2007.03.003
6. Yoshida A, Kato JY, Nakamae I, Yoneda-Kato N. COP1 targets C/EBPα for degradation and induces acute myeloid leukemia via Trib1. Blood (2013) 122(10):1750–60. doi: 10.1182/blood-2012-12-476101
7. Ostertag A, Jones A, Rose AJ, Liebert M, Kleinsorg S, Reimann A, et al. Control of adipose tissue inflammation through TRB1. Diabetes (2010) 59(8):1991–2000. doi: 10.2337/db09-1537
8. Satoh T, Kidoya H, Naito H, Yamamoto M, Takemura N, Nakagawa K, et al. Critical role of Trib1 in differentiation of tissue-resident M2-like macrophages. Nature (2013) 495(7442):524–8. doi: 10.1038/nature11930
9. Johnston JM, Angyal A, Bauer RC, Hamby S, Suvarna SK, Baidžajevas K, et al. Myeloid Tribbles 1 induces early atherosclerosis via enhanced foam cell expansion. Sci Adv (2019) 5(10):eaax9183. doi: 10.1126/sciadv.aax9183
10. Mashima T, Soma-Nagae T, Migita T, Kinoshita R, Iwamoto A, Yuasa T, et al. TRIB1 supports prostate tumorigenesis and tumor-propagating cell survival by regulation of endoplasmic reticulum chaperone expression. Cancer Res (2014) 74(17):4888–97. doi: 10.1158/0008-5472.CAN-13-3718
11. Liu ZZ, Han ZD, Liang YK, Chen JX, Wan S, Zhuo YJ, et al. TRIB1 induces macrophages to M2 phenotype by inhibiting IKB-zeta in prostate cancer. Cell Signal (2019) 59:152–62. doi: 10.1016/j.cellsig.2019.03.017
12. Sharova LV, Sharov AA, Nedorezov T, Piao Y, Shaik N, Ko MS. Database for mRNA half-life of 19 977 genes obtained by DNA microarray analysis of pluripotent and differentiating mouse embryonic stem cells. DNA Res (2009) 16(1):45–58. doi: 10.1093/dnares/dsn030
13. Sung HY, Francis SE, Crossman DC, Kiss-Toth E. Regulation of expression and signalling modulator function of mammalian tribbles is cell-type specific. Immunol Lett (2006) 104(1-2):171–7. doi: 10.1016/j.imlet.2005.11.010
14. Salomé M, Hopcroft L, Keeshan K. Inverse and correlative relationships between TRIBBLES genes indicate non-redundant functions during normal and malignant hemopoiesis. Exp Hematol (2018) 66:63–78.e13. doi: 10.1016/j.exphem.2018.07.005
15. Soubeyrand S, Martinuk A, Lau P, McPherson R. TRIB1 Is Regulated Post-Transcriptionally by Proteasomal and Non-Proteasomal Pathways. PLoS One (2016) 11(3):e0152346. doi: 10.1371/journal.pone.0152346
16. Bartel DP. MicroRNAs: genomics, biogenesis, mechanism, and function. Cell (2004) 116(2):281–97. doi: 10.1016/S0092-8674(04)00045-5
17. Hornung V, Bauernfeind F, Halle A, Samstad EO, Kono H, Rock KL, et al. Silica crystals and aluminum salts activate the NALP3 inflammasome through phagosomal destabilization. Nat Immunol (2008) 9(8):847–56. doi: 10.1038/ni.1631
18. Betel D, Wilson M, Gabow A, Marks DS. Sander C:The microRNA.org resource: targets and expression. Nucleic Acids Res (2008) 36:D149–153. doi: 10.1093/nar/gkm995
19. Agarwal V, Bell GW, Nam JW, Bartel DP. Predicting effective microRNA target sites in mammalian mRNAs. Elife (2015) 4:1–38. doi: 10.7554/eLife.05005
20. Chen Y, Wang X. miRDB: an online database for prediction of functional microRNA targets. Nucleic Acids Res (2020) 48(D1):D127–D31. doi: 10.1093/nar/gkz757
21. Li JH, Liu S, Zhou H, Qu LH, Yang JH. starBase v2.0: decoding miRNA-ceRNA, miRNA-ncRNA and protein-RNA interaction networks from large-scale CLIP-Seq data. Nucleic Acids Res (2014) 42:D92–97. doi: 10.1093/nar/gkt1248
22. Sticht C, De La Torre C, Parveen A, Gretz N. miRWalk: An online resource for prediction of microRNA binding sites. PLoS One (2018) 13(10):e0206239. doi: 10.1371/journal.pone.0206239
23. Karagkouni D, Paraskevopoulou MD, Chatzopoulos S, Vlachos IS, Tastsoglou S, Kanellos I, et al. DIANA-TarBase v8: a decade-long collection of experimentally supported miRNA-gene interactions. Nucleic Acids Res (2018) 46(D1):D239–D45. doi: 10.1093/nar/gkx1141
24. Paraskevopoulou MD, Georgakilas G, Kostoulas N, Vlachos IS, Vergoulis T, Reczko M, et al. Hatzigeorgiou AG:DIANA-microT web server v5.0: service integration into miRNA functional analysis workflows. Nucleic Acids Res (2013) 41:W169–173. doi: 10.1093/nar/gkt393
25. Kozomara A. Griffiths-Jones S:miRBase: annotating high confidence microRNAs using deep sequencing data. Nucleic Acids Res (2014) 42:D68–73. doi: 10.1093/nar/gkt1181
26. Kozomara A, Birgaoanu M, Griffiths-Jones S. miRBase: from microRNA sequences to function. Nucleic Acids Res (2019) 47(D1):D155–D62. doi: 10.1093/nar/gky1141
27. Xie B, Ding Q, Han H, Wu D. miRCancer: a microRNA-cancer association database constructed by text mining on literature. Bioinformatics (2013) 29(5):638–44. doi: 10.1093/bioinformatics/btt014
28. Low H, Hoang A, Sviridov D. Cholesterol efflux assay. J Vis Exp (2012) 61:e3810. doi: 10.3791/3810
29. Willer CJ, Sanna S, Jackson AU, Scuteri A, Bonnycastle LL, Clarke R, et al. Newly identified loci that influence lipid concentrations and risk of coronary artery disease. Nat Genet (2008) 40(2):161–9. doi: 10.1038/ng.76
30. Teslovich TM, Musunuru K, Smith AV, Edmondson AC, Stylianou IM, Koseki M, et al. Biological, clinical and population relevance of 95 loci for blood lipids. Nature (2010) 466(7307):707–13. doi: 10.1038/nature09270
31. Willer CJ, Schmidt EM, Sengupta S, Peloso GM, Gustafsson S, Kanoni S, et al. Discovery and refinement of loci associated with lipid levels. Nat Genet (2013) 45(11):1274–83. doi: 10.1038/ng.2797
32. Arndt L, Dokas J, Gericke M, Kutzner CE, Müller S, Jeromin F, et al. Tribbles homolog 1 deficiency modulates function and polarization of murine bone marrow-derived macrophages. J Biol Chem (2018) 293(29):11527–36. doi: 10.1074/jbc.RA117.000703
33. Kaminska B. MAPK signalling pathways as molecular targets for anti-inflammatory therapy–from molecular mechanisms to therapeutic benefits. Biochim Biophys Acta (2005) 1754(1-2):253–62. doi: 10.1016/j.bbapap.2005.08.017
34. Kiss-Toth E, Bagstaff SM, Sung HY, Jozsa V, Dempsey C, Caunt JC, et al. Human tribbles, a protein family controlling mitogen-activated protein kinase cascades. J Biol Chem (2004) 279(41):42703–8. doi: 10.1074/jbc.M407732200
35. Sung HY, Guan H, Czibula A, King AR, Eder K, Heath E, et al. Human tribbles-1 controls proliferation and chemotaxis of smooth muscle cells via MAPK signaling pathways. J Biol Chem (2007) 282(25):18379–87. doi: 10.1074/jbc.M610792200
36. Guan H, Shuaib A, Leon DD, Angyal A, Salazar M, Velasco G, et al. Competition between members of the tribbles pseudokinase protein family shapes their interactions with mitogen activated protein kinase pathways. Sci Rep (2016) 6:32667. doi: 10.1038/srep32667
37. Moya L, Lai J, Hoffman A, Srinivasan S, Panchadsaram J, Chambers S, et al. Association Analysis of a Microsatellite Repeat in the. Front Genet (2018) 9:428. doi: 10.3389/fgene.2018.00428
38. Formosa A, Lena AM, Markert EK, Cortelli S, Miano R, Mauriello A, et al. DNA methylation silences miR-132 in prostate cancer. Oncogene (2013) 32(1):127–34. doi: 10.1038/onc.2012.14
39. Qu W, Ding SM, Cao G, Wang SJ, Zheng XH, Li GH. miR-132 mediates a metabolic shift in prostate cancer cells by targeting Glut1. FEBS Open Bio (2016) 6(7):735–41. doi: 10.1002/2211-5463.12086
40. Wei X, Tang C, Lu X, Liu R, Zhou M, He D, et al. MiR-101 targets DUSP1 to regulate the TGF-β secretion in sorafenib inhibits macrophage-induced growth of hepatocarcinoma. Oncotarget (2015) 6(21):18389–405. doi: 10.18632/oncotarget.4089
41. Zhang N, Lei J, Lei H, Ruan X, Liu Q, Chen Y, et al. MicroRNA-101 overexpression by IL-6 and TNF-α inhibits cholesterol efflux by suppressing ATP-binding cassette transporter A1 expression. Exp Cell Res (2015) 336(1):33–42. doi: 10.1016/j.yexcr.2015.05.023
42. Friedman RC, Farh KK, Burge CB, Bartel DP. Most mammalian mRNAs are conserved targets of microRNAs. Genome Res (2009) 19(1):92–105. doi: 10.1101/gr.082701.108
43. Ozen M, Creighton CJ, Ozdemir M, Ittmann M. Widespread deregulation of microRNA expression in human prostate cancer. Oncogene (2008) 27(12):1788–93. doi: 10.1038/sj.onc.1210809
44. Coppola V, De Maria R, Bonci D. MicroRNAs and prostate cancer. Endocr Relat Cancer (2010) 17(1):F1–17. doi: 10.1677/ERC-09-0172
45. Ramassone A, Pagotto S, Veronese A, Visone R. Epigenetics and MicroRNAs in Cancer. Int J Mol Sci (2018) 19(2):459–87. doi: 10.3390/ijms19020459
46. Gan BL, Zhang LJ, Gao L, Ma FC, He RQ, Chen G, et al. Downregulation of miR-224-5p in prostate cancer and its relevant molecular mechanism via TCGA, GEO database and in silico analyses. Oncol Rep (2018) 40(6):3171–88. doi: 10.3892/or.2018.6766
47. Lin ZY, Huang YQ, Zhang YQ, Han ZD, He HC, Ling XH, et al. MicroRNA-224 inhibits progression of human prostate cancer by downregulating TRIB1. Int J Cancer (2014) 135(3):541–50. doi: 10.1002/ijc.28707
48. Grosshans J, Wieschaus E. A genetic link between morphogenesis and cell division during formation of the ventral furrow in Drosophila. Cell (2000) 101(5):523–31. doi: 10.1016/S0092-8674(00)80862-4
49. Mata J, Curado S, Ephrussi A, Rørth P. Tribbles coordinates mitosis and morphogenesis in Drosophila by regulating string/CDC25 proteolysis. Cell (2000) 101(5):511–22. doi: 10.1016/S0092-8674(00)80861-2
50. Keeshan K, He Y, Wouters BJ, Shestova O, Xu L, Sai H, et al. Tribbles homolog 2 inactivates C/EBPalpha and causes acute myelogenous leukemia. Cancer Cell (2006) 10(5):401–11. doi: 10.1016/j.ccr.2006.09.012
51. Prudente S, Sesti G, Pandolfi A, Andreozzi F, Consoli A, Trischitta V. The mammalian tribbles homolog TRIB3, glucose homeostasis, and cardiovascular diseases. Endocr Rev (2012) 33(4):526–46. doi: 10.1210/er.2011-1042
52. Bauer RC, Sasaki M, Cohen DM, Cui J, Smith MA, Yenilmez BO, et al. Tribbles-1 regulates hepatic lipogenesis through posttranscriptional regulation of C/EBPα. J Clin Invest (2015) 125(10):3809–18. doi: 10.1172/JCI77095
53. Yokoyama T, Nakamura T. Tribbles in disease: Signaling pathways important for cellular function and neoplastic transformation. Cancer Sci (2011) 102(6):1115–22. doi: 10.1111/j.1349-7006.2011.01914.x
54. Tian B, Manley JL. Alternative polyadenylation of mRNA precursors. Nat Rev Mol Cell Biol (2017) 18(1):18–30. doi: 10.1038/nrm.2016.116
55. Ye Y, Wang G, Zhuang J, He S, Song Y, Ni J, et al. The Oncogenic Role of Tribbles 1 in Hepatocellular Carcinoma Is Mediated by a Feedback Loop Involving microRNA-23a and p53. Front Physiol (2017) 8:789. doi: 10.3389/fphys.2017.00789
56. Strum JC, Johnson JH, Ward J, Xie H, Feild J, Hester A, et al. MicroRNA 132 regulates nutritional stress-induced chemokine production through repression of SirT1. Mol Endocrinol (2009) 23(11):1876–84. doi: 10.1210/me.2009-0117
57. Gendelman R, Xing H, Mirzoeva OK, Sarde P, Curtis C, Feiler HS, et al. Bayesian Network Inference Modeling Identifies TRIB1 as a Novel Regulator of Cell-Cycle Progression and Survival in Cancer Cells. Cancer Res (2017) 77(7):1575–85. doi: 10.1158/0008-5472.CAN-16-0512
58. Tang Y, Pan J, Huang S, Peng X, Zou X, Luo Y, et al. Downregulation of miR-133a-3p promotes prostate cancer bone metastasis via activating PI3K/AKT signaling. J Exp Clin Cancer Res (2018) 37(1):160. doi: 10.1186/s13046-018-0813-4
59. Li S, Xu JJ, Zhang QY. MicroRNA-132-3p inhibits tumor malignant progression by regulating lysosomal-associated protein transmembrane 4 beta in breast cancer. Cancer Sci (2019) 110(10):3098–109. doi: 10.1111/cas.14164
60. Hsing AW, Sakoda LC, Chen J, Chokkalingam AP, Sesterhenn I, Gao YT, et al. MSR1 variants and the risks of prostate cancer and benign prostatic hyperplasia: a population-based study in China. Carcinogenesis (2007) 28(12):2530–6. doi: 10.1093/carcin/bgm196
61. Rose AM, Krishan A, Charakova CF, Moya L, Lambers SK, Hollands M, et al. MSR1 repeats modulate gene expression and affect risk of breast and prostate cancer. Ann Oncol (2018) 29(5):1292–303. doi: 10.1093/annonc/mdy082
62. Shahrouzi P, Astobiza I, Cortazar AR, Torrano V, Macchia A, Flores JM, et al. Genomic and Functional Regulation of TRIB1 Contributes to Prostate Cancer Pathogenesis. Cancers (Basel) (2020) 12(9):2593–618. doi: 10.3390/cancers12092593
63. Shaked I, Meerson A, Wolf Y, Avni R, Greenberg D, Gilboa-Geffen A, et al. MicroRNA-132 potentiates cholinergic anti-inflammatory signaling by targeting acetylcholinesterase. Immunity (2009) 31(6):965–73. doi: 10.1016/j.immuni.2009.09.019
64. Liu F, Li Y, Jiang R, Nie C, Zeng Z, Zhao N, et al. miR-132 inhibits lipopolysaccharide-induced inflammation in alveolar macrophages by the cholinergic anti-inflammatory pathway. Exp Lung Res (2015) 41(5):261–9. doi: 10.3109/01902148.2015.1004206
65. Leinders M, Üçeyler N, Pritchard RA, Sommer C, Sorkin LS. Increased miR-132-3p expression is associated with chronic neuropathic pain. Exp Neurol (2016) 283(Pt A):276–86. doi: 10.1016/j.expneurol.2016.06.025
66. Dong Q, Meng P, Wang T, Qin W, Wang F, Yuan J, et al. MicroRNA let-7a inhibits proliferation of human prostate cancer cells in vitro and in vivo by targeting E2F2 and CCND2. PLoS One (2010) 5(4):e10147. doi: 10.1371/journal.pone.0010147
67. Tang G, Du R, Tang Z, Kuang Y. MiRNALet-7a mediates prostate cancer PC-3 cell invasion, migration by inducing epithelial-mesenchymal transition through CCR7/MAPK pathway. J Cell Biochem (2018) 119(4):3725–31. doi: 10.1002/jcb.26595
68. Nadiminty N, Tummala R, Lou W, Zhu Y, Shi XB, Zou JX, et al. MicroRNA let-7c is downregulated in prostate cancer and suppresses prostate cancer growth. PLoS One (2012) 7(3):e32832. doi: 10.1371/journal.pone.0032832
69. Hao Y, Gu X, Zhao Y, Greene S, Sha W, Smoot DT, et al. Enforced expression of miR-101 inhibits prostate cancer cell growth by modulating the COX-2 pathway in vivo. Cancer Prev Res (Phila) (2011) 4(7):1073–83. doi: 10.1158/1940-6207.CAPR-10-0333
70. Chakravarthi BV, Goswami MT, Pathi SS, Robinson AD, Cieślik M, Chandrashekar DS, et al. MicroRNA-101 regulated transcriptional modulator SUB1 plays a role in prostate cancer. Oncogene (2016) 35(49):6330–40. doi: 10.1038/onc.2016.164
71. Huang S, Yang Z, Ma Y, Yang Y, Wang S. miR-101 Enhances Cisplatin-Induced DNA Damage Through Decreasing Nicotinamide Adenine Dinucleotide Phosphate Levels by Directly Repressing Tp53-Induced Glycolysis and Apoptosis Regulator Expression in Prostate Cancer Cells. DNA Cell Biol (2017) 36(4):303–10. doi: 10.1089/dna.2016.3612
72. Mu H, Xiang L, Li S, Rao D, Wang S, Yu K. MiR-10a functions as a tumor suppressor in prostate cancer via targeting KDM4A. J Cell Biochem (2019) 120(4):4987–97. doi: 10.1002/jcb.27774
73. Xu S, Yi XM, Zhou WQ, Cheng W, Ge JP, Zhang ZY. Downregulation of miR-129 in peripheral blood mononuclear cells is a diagnostic and prognostic biomarker in prostate cancer. Int J Clin Exp Pathol (2015) 8(11):14335–44. doi: 10.1016/j.biopha.2017.10.037
74. Xu S, Ge J, Zhang Z, Zhou W. MiR-129 inhibits cell proliferation and metastasis by targeting ETS1 via PI3K/AKT/mTOR pathway in prostate cancer. BioMed Pharmacother (2017) 96:634–41. doi: 10.1016/j.biopha.2017.10.037
75. Ramalho-Carvalho J, Martins JB, Cekaite L, Sveen A, Torres-Ferreira J, Graça I, et al. Epigenetic disruption of miR-130a promotes prostate cancer by targeting SEC23B and DEPDC1. Cancer Lett (2017) 385:150–9. doi: 10.1016/j.canlet.2016.10.028
76. Zheng H, Guo Z, Zheng X, Cheng W, Huang X. MicroRNA-144-3p inhibits cell proliferation and induces cell apoptosis in prostate cancer by targeting CEP55. Am J Transl Res (2018) 10(8):2457–68. doi: 10.26355/eurrev_201811_16383
77. Hong X, Yu JJ. MicroRNA-150 suppresses epithelial-mesenchymal transition, invasion, and metastasis in prostate cancer through the TRPM4-mediated β-catenin signaling pathway. Am J Physiol Cell Physiol (2019) 316(4):C463–C80. doi: 10.1152/ajpcell.00142.2018
78. Zhu C, Shao P, Bao M, Li P, Zhou H, Cai H, et al. miR-154 inhibits prostate cancer cell proliferation by targeting CCND2. Urol Oncol (2014) 32(1):31.e9–16. doi: 10.1016/j.urolonc.2012.11.013
79. Borrego-Diaz E, Powers BC, Azizov V, Lovell S, Reyes R, Chapman B, et al. A potential regulatory loop between Lin28B:miR−212 in androgen-independent prostate cancer. Int J Oncol (2014) 45(6):2421–9. doi: 10.3892/ijo.2014.2647
80. Ramalinga M, Roy A, Srivastava A, Bhattarai A, Harish V, Suy S, et al. MicroRNA-212 negatively regulates starvation induced autophagy in prostate cancer cells by inhibiting SIRT1 and is a modulator of angiogenesis and cellular senescence. Oncotarget (2015) 6(33):34446–57. doi: 10.18632/oncotarget.5920
81. Xin M, Qiao Z, Li J, Liu J, Song S, Zhao X, et al. miR-22 inhibits tumor growth and metastasis by targeting ATP citrate lyase: evidence in osteosarcoma, prostate cancer, cervical cancer and lung cancer. Oncotarget (2016) 7(28):44252–65. doi: 10.18632/oncotarget.10020
82. Fu H, He HC, Han ZD, Wan YP, Luo HW, Huang YQ, et al. MicroRNA-224 and its target CAMKK2 synergistically influence tumor progression and patient prognosis in prostate cancer. Tumour Biol (2015) 36(3):1983–91. doi: 10.1007/s13277-014-2805-0
83. Goto Y, Nishikawa R, Kojima S, Chiyomaru T, Enokida H, Inoguchi S, et al. Tumour-suppressive microRNA-224 inhibits cancer cell migration and invasion via targeting oncogenic TPD52 in prostate cancer. FEBS Lett (2014) 588(10):1973–82. doi: 10.1016/j.febslet.2014.04.020
84. Cai S, Chen R, Li X, Cai Y, Ye Z, Li S, et al. Downregulation of microRNA-23a suppresses prostate cancer metastasis by targeting the PAK6-LIMK1 signaling pathway. Oncotarget (2015) 6(6):3904–17. doi: 10.18632/oncotarget.2880
85. Majid S, Dar AA, Saini S, Arora S, Shahryari V, Zaman MS, et al. miR-23b represses proto-oncogene Src kinase and functions as methylation-silenced tumor suppressor with diagnostic and prognostic significance in prostate cancer. Cancer Res (2012) 72(24):6435–46. doi: 10.1158/0008-5472.CAN-12-2181
86. Zhang GM, Bao CY, Wan FN, Cao DL, Qin XJ, Zhang HL, et al. MicroRNA-302a Suppresses Tumor Cell Proliferation by Inhibiting AKT in Prostate Cancer. PLoS One (2015) 10(4):e0124410. doi: 10.1371/journal.pone.0124410
87. Lee KH, Chen YL, Yeh SD, Hsiao M, Lin JT, Goan YG, et al. MicroRNA-330 acts as tumor suppressor and induces apoptosis of prostate cancer cells through E2F1-mediated suppression of Akt phosphorylation. Oncogene (2009) 28(38):3360–70. doi: 10.1038/onc.2009.192
88. Mao Y, Chen H, Lin Y, Xu X, Hu Z, Zhu Y, et al. microRNA-330 inhibits cell motility by downregulating Sp1 in prostate cancer cells. Oncol Rep (2013) 30(1):327–33. doi: 10.3892/or.2013.2452
89. Li S, Wang C, Yu X, Wu H, Hu J, Wang S, et al. miR-3619-5p inhibits prostate cancer cell growth by activating CDKN1A expression. Oncol Rep (2017) 37(1):241–8. doi: 10.3892/or.2016.5250
90. Kong X, Qian X, Duan L, Liu H, Zhu Y, Qi J. microRNA-372 Suppresses Migration and Invasion by Targeting p65 in Human Prostate Cancer Cells. DNA Cell Biol (2016) 35(12):828–35. doi: 10.1089/dna.2015.3186
91. Qu HW, Jin Y, Cui ZL, Jin XB. MicroRNA-373-3p inhibits prostate cancer progression by targeting AKT1. Eur Rev Med Pharmacol Sci (2018) 22(19):6252–9. doi: 10.26355/eurrev_201810_16032
Keywords: miRNA, Tribbles, macrophages, prostate cancer, inflammation
Citation: Niespolo C, Johnston JM, Deshmukh SR, Satam S, Shologu Z, Villacanas O, Sudbery IM, Wilson HL and Kiss-Toth E (2020) Tribbles-1 Expression and Its Function to Control Inflammatory Cytokines, Including Interleukin-8 Levels are Regulated by miRNAs in Macrophages and Prostate Cancer Cells. Front. Immunol. 11:574046. doi: 10.3389/fimmu.2020.574046
Received: 18 June 2020; Accepted: 27 October 2020;
Published: 27 November 2020.
Edited by:
Luminita Aurelia Stanciu, Imperial College London, United KingdomReviewed by:
Warren Pear, University of Pennsylvania, United StatesTomohide Takaya, Shinshu University, Japan
Leire Moya, Queensland University of Technology, Australia
Copyright © 2020 Niespolo, Johnston, Deshmukh, Satam, Shologu, Villacanas, Sudbery, Wilson and Kiss-Toth. This is an open-access article distributed under the terms of the Creative Commons Attribution License (CC BY). The use, distribution or reproduction in other forums is permitted, provided the original author(s) and the copyright owner(s) are credited and that the original publication in this journal is cited, in accordance with accepted academic practice. No use, distribution or reproduction is permitted which does not comply with these terms.
*Correspondence: Endre Kiss-Toth, e.kiss-toth@sheffield.ac.uk; Chiara Niespolo, c.niespolo@sheffield.ac.uk
†Present address: Oscar Villacanas, Department of Material Science and Physical Chemistry, University of Barcelona, Barcelona, Spain