Dynamic Network Connectedness of Bitcoin Markets: Evidence from Realized Volatility
 Shuanglian Chen
 Hao Dong
- 1Guangzhou International Institute of Finance and Guangzhou University, Guangzhou, China
- 2School of Economics and Statistics, Guangzhou University, Guangzhou, China
In this paper, we explore the volatility spillovers across different Bitcoin markets. We decompose the realized volatility into common and idiosyncratic volatilities, as well as the good and bad volatilities. Then the asymmetry in volatility spillovers between Bitcoin markets is measured by the DY (Diebold and Yilmaz) index. In addition, we construct statistics to test the asymmetry in volatility spillovers between different Bitcoin markets. The results are achieved as follows. The spillovers of systematic and idiosyncratic volatilities dominate the connectedness among different Bitcoin markets. In addition, the idiosyncratic volatility spillovers are more easily influenced by policies. Good volatility spillovers dominate the Bitcoin markets and change over time. The further results suggest that there is significant asymmetry between systematic and idiosyncratic volatility spillovers in the Bitcoin markets, while the asymmetries between good and bad volatility spillovers are heterogeneous in different markets. The findings in this paper can provide some suggestions for regulators controlling market stability and investors generating investment strategies.
Introduction
Both the market value and amount of cryptocurrency have risen greatly since 2016. Meanwhile, the increased price has been accompanied with strong volatility. For instance, the Bitcoin as the leading cryptocurrency fell more than 40% to less than $12,000 within a month from more than $20,000 on December 17, 2017. Some people attribute such a rapid rise to the block chain technology, believing that Bitcoin can exceed $100,000, while some others deem that cryptocurrencies are speculation products rather than exchange mediums (10; [17, 37]; and Bitcoin is prone to bubble [20, 31]. In order to further recognize the price discovery function of Bitcoin in the financial market, meeting the investors demand on cryptocurrencies, the U.S. financial corporations CME and CBOE have issued Bitcoin futures, respectively. In addition, Bitcoin is an option for portfolio, asset allocation, and hedging [28] as it is distinctly different in return, volatility, and correlation from other assets [11]. The Bitcoin, which is a leading cryptocurrency with a long history as well as the largest market capitalization, has a total amount at the early design stage. The Bitcoin markets, whose pricing data are available immediately and free of charge to anyone worldwide with internet access, usually behave differently in prices across different markets. Price volatility as an important indicator investigating market dynamics, reflects the market reaction to new information, and influences the trading volume, whose fluctuation reflects different investor understanding on the new information. Indeed, connectedness among price volatilities across different Bitcoin markets provides knowledge on the spread and absorption of market information flows and extend to which price reflects the market information. The volatility connectedness has been explored in stock markets [16, 19, 48, 53], futures markets [36, 58], and commodity markets [3, 4, 21, 34]. We believe that it is necessary to pay attention to the volatility connectedness across Bitcoin markets. Reference [61] analyzed the cross-correlations of the return-volume relationship across the Bitcoin markets. Reference [52] identified the price inconsistencies across the markets. In this paper, the volatility connectedness across the Bitcoin markets is addressed.
Systematic and idiosyncratic decompositions for financial variables have been considered important in main stream finance literature [32]. Reference [50] used the quantile-on-quantile Granger causality test to investigate extreme risk spillover from the crude oil market to firm return in China. They provided evidence of extreme risk spillovers from crude oil price shocks to firm returns. Their results indicate that the industrial characteristics of a firm matters. Reference [18] investigated the relationship between crude oil and stock using firm-level data and a bottom-up approach. Following the same logic of Ref. [47]; they explicitly modeled systematic and idiosyncratic risks using a capital asset pricing model in the oil-stock relationship for each stock and then aggregated them for the market-wide results. Reference [45] investigated the inter-connectedness between WTI oil price returns and the returns of listed firms in the U.S. energy sector. They focused on the issue of whether firm-level idiosyncratic information matters. A generalized dynamic factor model was used to separate systematic components from idiosyncratic components in these energy stocks. On the other hand, systematic and idiosyncratic contagion are underlined in the existing literature. In a financial system, systematic contagion is driven by common factors that affect all the participants, while idiosyncratic contagion is caused by factors that are specific to the individuals [6]. This distinction contributes to making clear the potential contagion drivers and the channels by which contagion occurs. They are essential for regulators and policymakers to monitor financial stability. Some works distinguish the systematic and idiosyncratic contagion through the traditional regression models [9, 25–27]. Reference [6] applied principal component analysis and a generalized vector autoregressive framework proposed by Ref. [22]) to differentiate the systematic and idiosyncratic contagion. Ref. [38] proposed a network-based framework to distinguish systematic and idiosyncratic contagion and dealt with the situation that the number of financial institutes involved in the contagion is sufficiently large. Most existing literature on systematic and idiosyncratic decomposition contribute to the oil-stock relationship and financial crisis. To our knowledge, it has not been applied in the cryptocurrency market. In this paper, we will explore systematic and idiosyncratic volatility in the Bitcoin markets. In addition, network connectedness of systematic and idiosyncratic volatility in the Bitcoin markets is constructed.
Despite the popularity and versatility of the DY index, which was developed by Ref. [22] to measure both total and directional volatility spillovers, it cannot not distinguish potential asymmetry in spillovers that originate due to both good and bad uncertainty. A market volatility may be higher as institutes in that market make it advantageous for firms to take risks that lead to greater market growth [1, 24, 39]. Alternatively, a market volatility may also be high because of the market-specific forces, such as political risks, that impose risks on firms that they can not shed [8]. In the former case, volatility is good as it results from positive shocks that enable markets to be more productive. In contrast, the bad volatility associated with the latter case can destabilize the market and prevent its growth. As suggested by Ref. [54]; one can decompose the aggregate volatility into “good” and “bad” volatility components, which are associated with positive and negative innovations to market returns. These two volatility components have opposite impacts on asset prices and market growth. Ref. [7] decomposed the realized daily volatility calculated by intraday returns into good and bad volatility, which separately captured the volatility component associated with positive and negative movements in oil prices and the exchange rate, permitting someone to determine whether good volatility shocks propagate differently across currency and oil markets compared to bad volatility shocks. Ref. [13] quantified asymmetries in volatility spillovers that emerge due to bad and good volatility by using data covering most liquid U.S. stocks in seven sectors. They provided sample evidence for the asymmetric connectedness of stocks at the disaggregate level, while they provided evidence for asymmetric volatility connectedness on forex markets by showing how bad and good volatility propagate through forex markets [14]. Reference [15] analyzed total, asymmetric, and frequency connectedness between the oil and forex markets using high-frequent intraday data by employing variance decompositions and spectral representation in combination with realized semi-variances to account for asymmetric and frequency connectedness. Reference [2] paid attention to the potential asymmetries from good and bad volatility in the causal linkages between the crude oil and forex markets. Reference [55] examined asymmetric volatility spillovers between crude and international stock markets. They provided evidence that bad total volatility spillovers dominate the system and change over time, suggesting that a pessimistic mood and uninformed traders who tend to increase volatility dominate in the markets. However, among the existing literature on asymmetries from good and bad volatility, as well as their volatility spillovers, we should note that sufficient attention has not been paid in the cryptocurrency markets. In this paper, we will construct a network connectedness of good volatility and bad volatility among Bitcoin markets and explore the asymmetric spillovers of good and bad volatility in Bitcoin markets.
The contribution of the current paper can be summarized as follows. First, we explore the time-varying characteristic of leading roles played by systematic and idiosyncratic volatilities in different Bitcoin markets. The time-varying dominance of common volatility and characteristic volatility spillovers in the Bitcoin markets helps to identify the influencing factors of Bitcoin price changes, that is, whether the Bitcoin price changes are caused by the evolution of Bitcoin itself or by changes in market policy attitudes and investor sentiment. The leading roles between Bitcoin markets enable global investors to use Bitcoin assets for the purposes of diversification and to reduce risks. The leading roles also allow the possibility of forming portfolios to increase returns, which can generate clear benefits for financial market investors and risk management. Second, we continue to explore the time-varying characteristic of leading roles played by good and bad volatilities in different Bitcoin markets. In this way, we complete the construction of network connectedness of Bitcoin markets. This dominant time variability helps investors identify the impact of policy news on Bitcoin price volatility. Concretely, volatility is good in that it results from positive policy news that enables Bitcoin price to be more productive. In contrast, the bad volatility associated with negative policy news can destabilize the market and prevent its growth. Third, we examine the asymmetric spillovers of systematic and idiosyncratic volatility in Bitcoin markets and lastly, asymmetric spillovers of good and bad volatility are addressed as well. This could shed light on whether spillovers are higher or lower during a specific period. Asymmetric spillover in volatility on Bitcoin markets indicates that past returns are highly correlated with present volatility. As volatility is transferred across markets by spillovers, it is reasonable to believe that volatility spillovers exhibit asymmetries as well and that such asymmetries might stem from qualitative differences due to different information. Our evidence supports this prediction. In this way, we construct the asymmetric network connectedness of Bitcoin markets.
The paper is organized as follows. In Section 2, we present the network connectedness of systematic and idiosyncratic volatility in Bitcoin markets, involving the measurement of systematic and idiosyncratic volatility, and static and dynamic analysis of the network connectedness. Similar results for good and bad volatility in Bitcoin markets are presented in Section 3. The asymmetric network connectedness in Bitcoin markets is addressed in Section 4. In Section 5, we conclude the paper with some policy implications.
Network Connectedness of Common and Idiosyncratic Volatility in Bitcoin Markets
The Measurement of Realized Volatility
The realized volatility can better reflect the Bitcoin price volatility. On the one hand, different from traditional financial assets, as it does not admit price limit, together with the globalization and convenience, the Bitcoin price can fluctuate strongly in a short time. Accordingly, we measure the Bitcoin price volatility by using highly frequent data. On the other hand, the price of Bitcoin, which is one of speculative assets, can be influenced by information acquisition and propagation rate. Considering the instantaneity of information, highly frequent data may better reflect the effects of information on the Bitcoin price volatility [33, 57]. Accordingly, we use the realized volatility, proposed by Ref. [5]; to measure the price volatilities in different Bitcoin markets.
Denote by
where
Accordingly, for the market i and a specific business day
where
In this paper, we decompose the realized volatility into systematic and idiosyncratic volatilities, to explore the asymmetry between systematic and idiosyncratic volatility spillovers. To identify the role of idiosyncratic information in the spillover among the Bitcoin markets, this paper employs generalized dynamic factor models (GDFM), proposed by Ref. [12]; to decompose the realized volatility into both systematic and idiosyncratic components. The method is also used by Ref. [30]. Consider a six-dimensional vector of realized volatility
where,
The Measurement of Network Connectedness
In this paper, we measure the connectedness among different Bitcoin markets by the DY spillover index. Most existing literature measures connectedness by the DCC-GARCH model [46, 56] and copula model (41; [35, 44]. On the one hand, these models focus on the connectedness of two or three markets rather than measuring the connectedness among many markets. On the other hand, the delay effect of Bitcoin price volatility and the interplay among the Bitcoin markets motivate us to investigate the volatility spillovers. Recently the connectedness model, which is based on a VAR model approach proposed by Ref. 23, has been widely used to measure system spillover in the finance and commodity market [40–43, 59, 60]. Using forecasting error variance decomposition (FEVD) of the VAR model and a rolling-windows approach, the method provides a simple yet effective way for understanding the static and dynamic spillovers among different Bitcoin markets.
Start from a
where,
Standard FEVD results tend to be sensitive to the ordering of variables in VAR models. Reference 23 suggested to use the generalized FEVD approach [51] to solve this problem. They define
where
By excluding self-contributions in the system, the total spillover index (TSI), denoted by S(H), can be written as:
We calculate the from and to spillovers among different Bitcoin markets by Formulas (3) and (4)
Furthermore, we calculate the net spillover
Similarly, the net pairwise measure can be written as
Asymmetric Network Connectedness of Common and Idiosyncratic Volatility
In this paper, we chose six Bitcoin markets according to their trading volume, which were USD (BitStamp), EUR (Kraken), JPY (Coincheck), PLN (BitBay), IDR (Infomax), and KRW (Korbit), where the largest trading platforms in corresponding Bitcoin markets are pointed out in the brackets. According to the availability, the data range from March 6, 2016 to March 15, 2020. The measurement for spillover is through R-3.6.3, while the network figure is through Gephi-0.9.2.
The empirical results show the static and dynamic spillovers of systematic volatility and idiosyncratic volatility among different Bitcoin markets. According to the AIC criterion, we applied the VAR model with a delay order of three to measure the realized volatility in Bitcoin markets while the VAR model with a lagged value of four was applied to measure the systematic and idiosyncratic volatility in Bitcoin markets. Accordingly, we calculated the static volatility spillovers among Bitcoin markets. With regard to dynamic spillovers, in this paper, we set the roll-windows by 60 according to the duration of Bitcoin volatility. We set the n. ahead describing dynamic spillovers of systematic volatility among the Bitcoin markets by 20, while it was set by 10 to describe dynamic spillovers of idiosyncratic volatility among the Bitcoin markets. The numbers 20 and 10 reflect the periods when the volatility shocks in the Bitcoin markets become stable. Table 1 shows the static volatility spillovers among different Bitcoin markets.
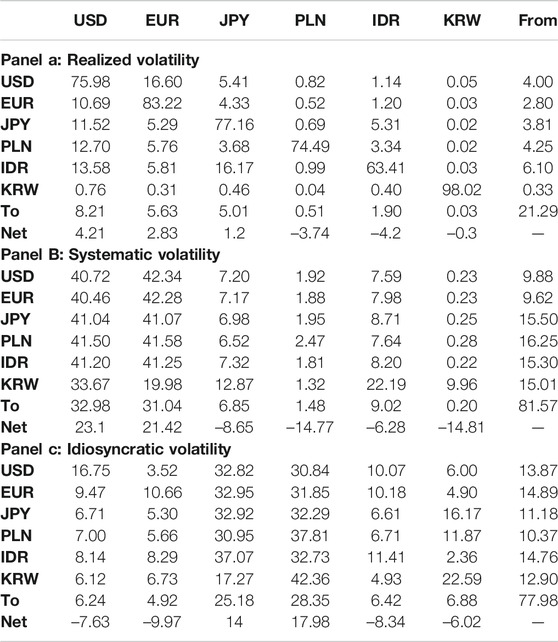
TABLE 1. Static spillover in realized, common, and idiosyncratic volatility.
The spillovers between systematic volatility and idiosyncratic volatility dominate the connectedness across different Bitcoin markets. The volatility spillovers among Bitcoin markets after volatility decomposition are significantly stronger than that before decomposition. We can see from the rows “Net” in Table 1 that the most significantly enhanced volatility spillover after volatility decomposition compared with the total realized volatility spillover before volatility decomposition is captured in the KRW market, which are given as 14.81/0.3 = 49 and 6.99/0.3 = 20. It is followed by the JPY market, which is 8.65/1.2 = 7 and 14/1.2 = 11. The most insignificantly enhanced volatility spillover after volatility decomposition compared with the total realized volatility spillover before volatility decomposition is captured in the IDR market, which is 6.28/4.2 = 1.5 and 8.34/4.2 = 2. With regard to spillover direction, the systematic volatility spillover direction is almost consistent with the overall volatility spillover direction, while the idiosyncratic volatility spillover direction is significantly different from that of overall volatility spillover. The volatility spillovers change their directions in the USD, EUR, JPY, and PLN markets, but they stayed the same in the IDR and KRW markets, which can be seen by the signs of values in the rows “Net” in Table 1.
The difference of Bitcoin market efficiency determines the asymmetry between systematic volatility spillover and idiosyncratic volatility spillover. On the one hand, the market efficiency determines the level variation of volatility spillover. The market efficiency determines market ability replying to shocks. Considering the speculative nature of Bitcoin, the higher market efficiency leads to stronger market ability replying to shocks, that is a Bitcoin market can well eliminate spillover effects from other Bitcoin markets. Hence, for those entities who have more comprehensive financial markets like USD and EUR, their cryptocurrency markets, like Bitcoin, are more likely to show a stronger ability when replying to market shocks. Due to China’s policies on the Bitcoin market, the barycenter of the Bitcoin market has begun to shift to the KRW and JPY markets. Many investors are attracted to invest on these markets, resulting in new challenges for market efficiency. However, the market efficiency cannot realize regulation and control, which results in a larger variation of volatility spillovers in the KRW and JPY markets. Besides, considering aims of speculators to pursue excess return, the development of emerging Bitcoin markets affects the investing decisions of speculators. Accordingly, spillovers from markets like IDR vary weakly.
On the other hand, the market efficiency determines the variation of spillover directions. The markets with higher efficiency, like USD and EUR, play leading roles in the development of Bitcoin. Hence, both USD and EUR show positive spillover directions of systematic volatility, namely that USD and EUR transmit volatilities to other markets. The idiosyncratic volatility reflects the particular roles played by different markets in the development of Bitcoin. The USD and EUR markets usually attract investor attention from other Bitcoin markets, which may affect their price evolution. Thus, the efficiency of Bitcoin markets determines their roles in the price evolution of Bitcoin. This implies the importance of systematic and idiosyncratic volatility spillovers among the Bitcoin markets. We will further analyze the net pairwise spillovers of systematic and idiosyncratic volatility among different Bitcoin markets.
Figure 1 shows the net pairwise spillovers of systematic and idiosyncratic volatility among different Bitcoin markets. The size of the node represents the self-spillover of Bitcoin markets. The lines between two nodes represent the net pairwise spillovers between two Bitcoin markets, while the arrows represent the spillover direction. We can see from Figure 1 that the spillover direction of systematic volatility is significantly different from that of idiosyncratic volatility. With regard to systematic volatility, it mainly spills from markets with large capitalization to those with small capitalization. More precisely, the systematic volatilities spill significantly from the USD, EUR, and JPY markets to the KRW, PLN, and IDR markets. With regard to idiosyncratic volatility, it spills from markets with small capitalization like KRW, PLN, and IDR to those with large capitalization like USD, EUR, and JPY. These phenomena result from the heterogeneity of different Bitcoin markets in leading the price volatility characteristics of Bitcoin. The systematic volatility depicts the roles played by different markets in the price volatility characteristics. Markets with small capitalization usually learn from markets with large capitalization on Bitcoin price. More investors are attracted to catch more information on price from markets with large capitalization and generate investment strategies in other Bitcoin markets. Thus the systematic volatility spills from markets with large capitalization to those with small capitalization. The idiosyncratic volatility mainly embodies the heterogeneity of market efficiency. The Bitcoin markets with small capitalization usually admit low market efficiency, which result in a weak ability when replying to price volatility. Markets with large capitalization have strong ability when replying to price volatility. Therefore, as the Bitcoin price fluctuates, the markets with small capitalization show higher market risks due to their weak stability, while those markets with large capitalization show stronger stability. At this time, investors disperse their investment risks by investing across different Bitcoin markets. Accordingly, the idiosyncratic volatility spills from markets with small capitalization to those with large capitalization.
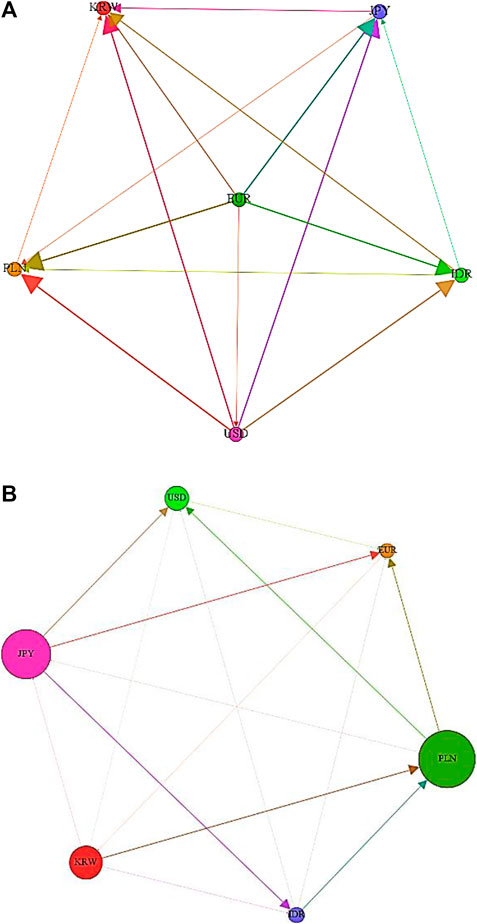
FIGURE 1. Net pairwise spillover in different Bitcoin markets. Note: I. The lines between two nodes represent the net pairwise spillovers between two Bitcoin markets, while the arrows represent the spillover direction. II. (A) stands for net pairwise spillover for systematic volatility, while (B) stands for idiosyncratic volatility.
The idiosyncratic volatility spillovers among different Bitcoin markets are more easily influenced by policies. With regard to systematic volatility spillover, the spillover directions almost stay the same in the sample period. In addition, spillovers fluctuate moderately. We can see from Figure 2A that the net spillovers between USD and other markets are almost positive, which is also the case in the EUR market. However, it is not the case in the KRW, PLN, IDR, and JPY markets. With regard to idiosyncratic volatility, the spillover directions change more frequently and the spillover fluctuates strongly. This implies the effects of major events on the idiosyncratic volatility spillovers among different Bitcoin markets. For instance, since September 2017, China has forbidden the issue and trading of cryptocurrencies like Bitcoin. The global Bitcoin market has shifted to the JPY and KRW markets. At this moment, the systematic volatility spillovers among Bitcoin markets fluctuate moderately, while the idiosyncratic volatility spillovers in the JPY and KRW markets fluctuate strongly. Besides, volatility spillovers from other financial markets like stock markets to Bitcoin markets are almost dominated by idiosyncratic volatility spillovers. At the beginning of 2018, regular stock markets around the world were in a state of stagnation. More and more investors began to pay attention to Bitcoin, which resulted in the strong price volatility of Bitcoin. Similarly, the systematic volatility spillovers fluctuated moderately, while the idiosyncratic volatility spillovers among the Bitcoin markets showed stronger fluctuations. As the attitudes to Bitcoin positively grew in different countries, the idiosyncratic volatility spillovers as well as the spillover fluctuations became weaker.
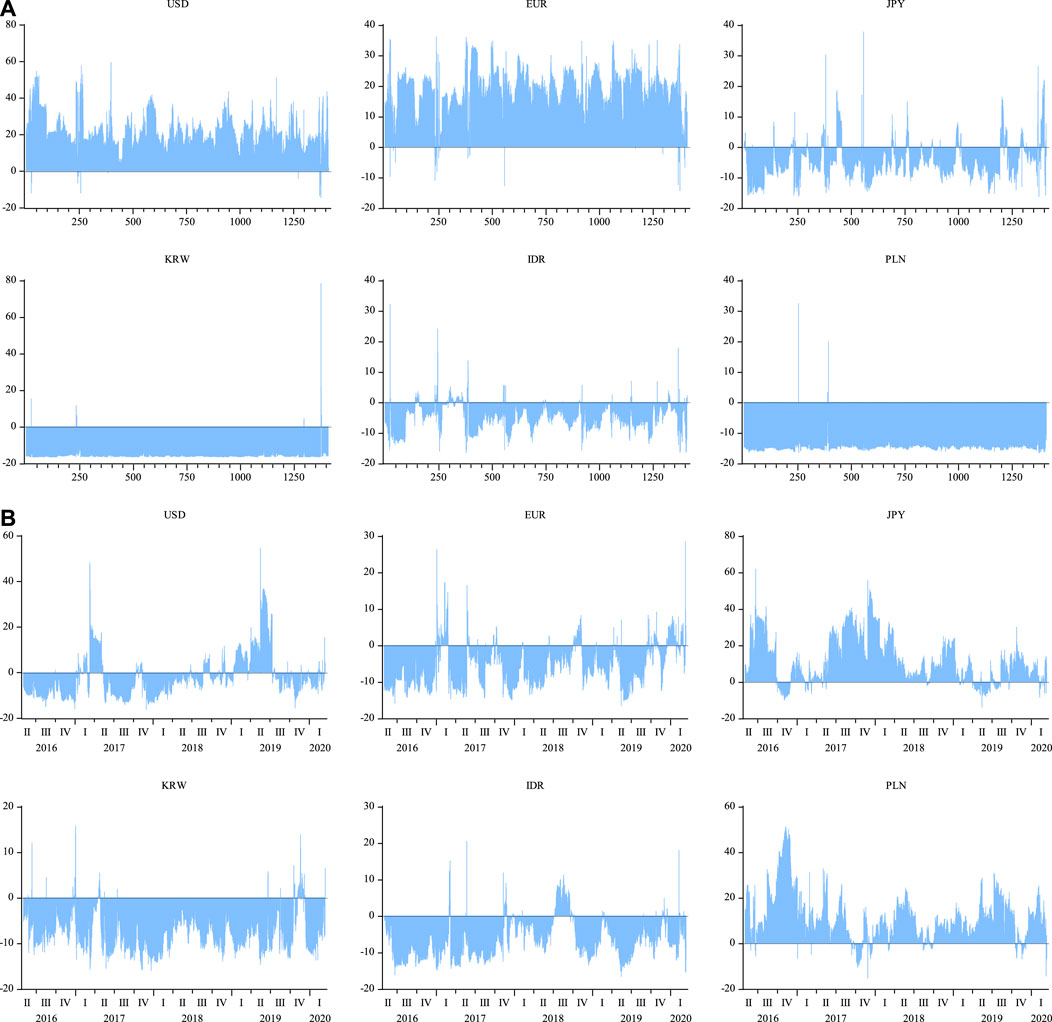
FIGURE 2. Dynamic net spillover among different Bitcoin markets. (A) stands for the dynamic spillover for systematic volatility; (B) reports the dynamic spillover for idiosyncratic volatility.
Network Connectedness of Good and Bad Volatility in Bitcoin Markets
The Measurement of Good and Bad Volatility
The transmission of good and bad information among different Bitcoin markets also catches the attention of investors. In fact, the bad volatilities of Bitcoin are related to negative information, such as earnings, spending, and investor sentiment, while the good volatilities are related to the positive information of these variables. Accordingly, we further explored the spillovers between good and bad volatilities in Bitcoin returns. Recently, Ref. [7] decomposed the realized volatility into estimators of realized semi-variance (RS) that captured the variance due to negative or positive movements in bad and good volatility of Bitcoin markets. The technique was quickly adopted in several recent contributions (29; [49, 54]. This method can better measure the evolution of good and bad volatilities in the sample period. Concretely, the good volatility of Bitcoin is measured by the positive return of Bitcoin, while the bad volatility is measured by negative return. Accordingly, this method can better reflect the good and bad volatilities of Bitcoin. In addition, it can better capture the relationship between the Bitcoin volatilities in the future and the Bitcoin returns in the past. Thus, we used the realized semi-variance in a similar manner. The negative and positive realized semi-variances (
where
and can serve as a measure of downside and upside risk. For instance, negative semi-variance corresponds to bad information causing the return volatility of Bitcoin, and we can use the measure as the empirical proxy for bad volatility as in Ref. [54]. Similarly, positive semi-variance corresponds to good information causing the return volatility of Bitcoin and serves as a proxy for good volatility. In this section, we substitute
Static Analysis of Asymmetric Network Connectedness
Considering the heterogeneity in investor reactions to good (bad) information, we discuss the static asymmetry of good and bad volatility spillovers among different Bitcoin markets. Table 2 shows the static spillovers of good and bad volatility. Figure 3 shows the net pairwise spillover of good and bad volatility.
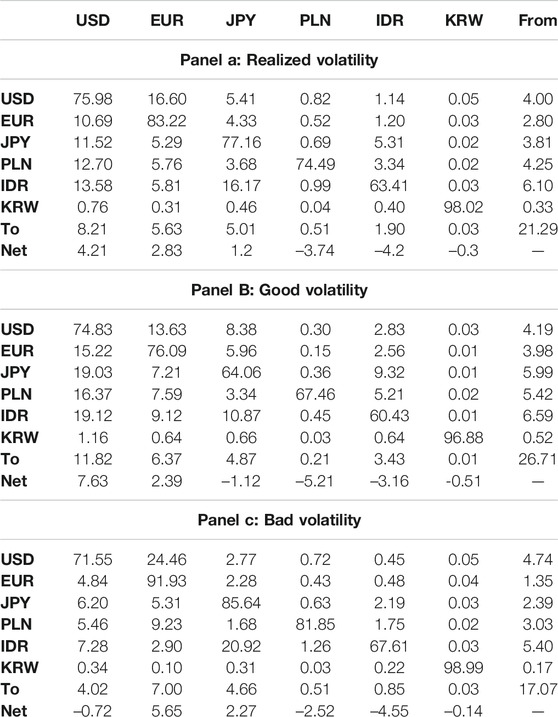
TABLE 2. Static spillover in realized, good, and bad volatility.
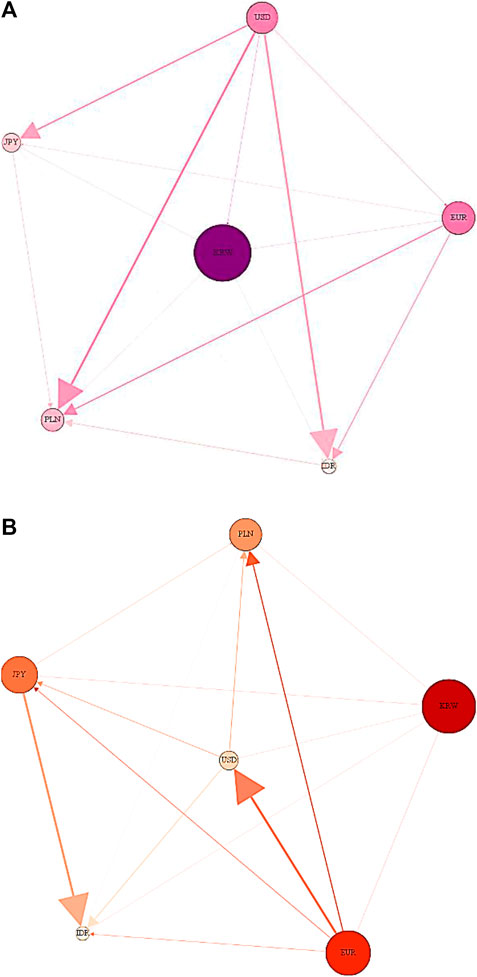
FIGURE 3. Net pairwise spillover in good and volatility. Note: I. The lines between two nodes represent the net pairwise spillovers between two Bitcoin markets, while the arrows represent the spillover direction. II. (A) stands for net pairwise spillover for good volatility, while (B) stands for bad volatility.
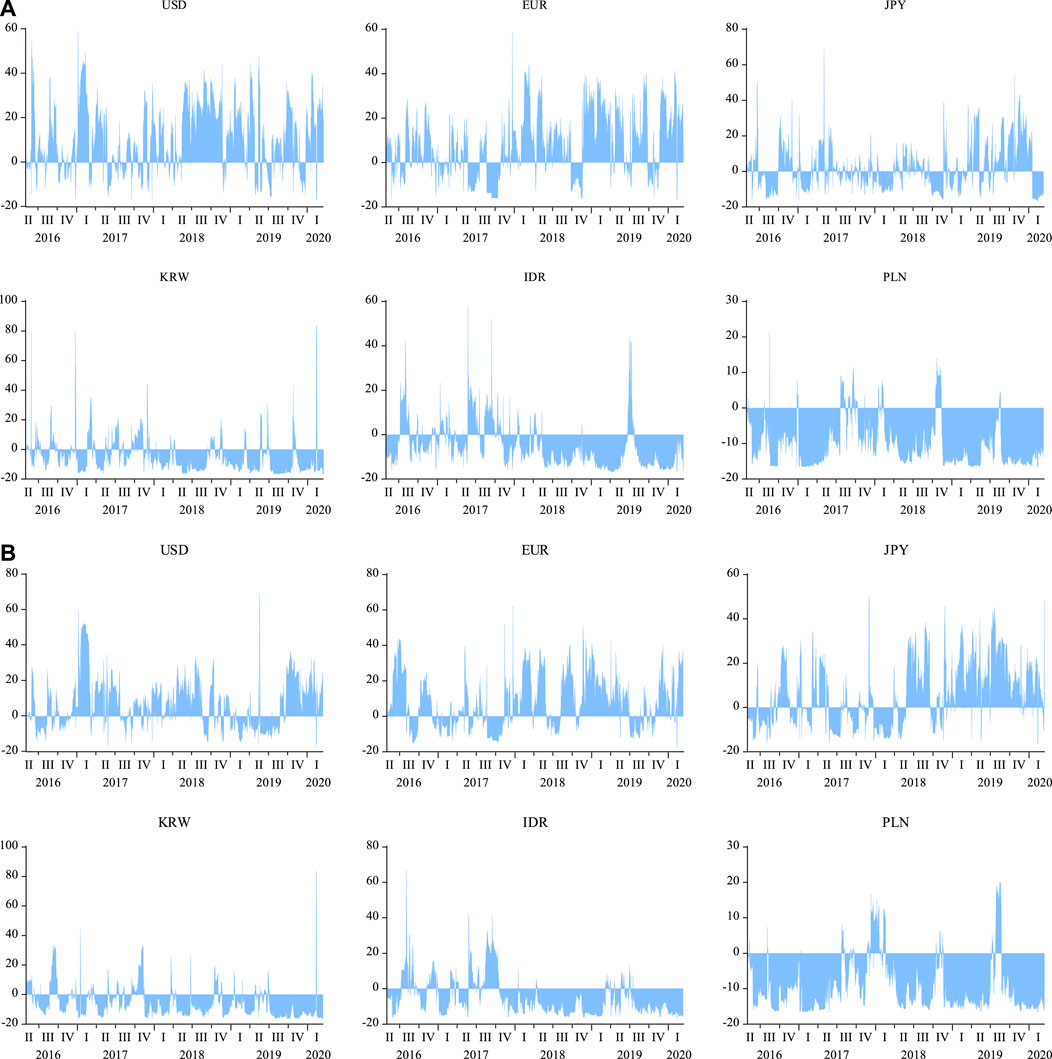
FIGURE 4. Dynamic net spillover between different Bitcoin markets. (A) stands for the dynamic spillover for good volatility; (B) reports the dynamic spillover for bad volatility.
The good volatility dominates the spillovers among different Bitcoin markets. With regard to good volatility spillover, the self-spillovers of individual markets are all weaker than that of the full sample, which suggests that in the environment of good information, the connectedness across different Bitcoin markets is stronger than that in the full sample. On the contrary, for bad volatility spillover, the self-spillovers of individual markets are stronger than that of the full sample, which suggests that in the environment of bad information, the connectedness across different Bitcoin markets is weaker than that in the full sample. This results from the heterogeneity of investor expectation in good and bad volatility spillovers. Therefore, we further analyze the asymmetry between good volatility spillover and bad volatility spillover.
The asymmetry between good and bad volatility spillover among the Bitcoin markets is captured by the self-spillovers of individual markets and mutual spillovers among different markets. The diagonal elements in Panel b and c of Table 2 depicts the self-spillovers of individual Bitcoin markets, while the net spillover depicts the spillovers among the markets. With regard to the self-spillover, except the U.S. market, other markets show stronger bad volatility spillovers. With regard to mutual spillovers among the markets, the spillover directions of both good and bad volatility are almost the same, while the spillover degrees are significantly different. More precisely, we can see from the rows of “Net” that the spillover levels in the USD, PLN, and KRW markets decrease, while they increase in the EUR, JPY, and IDR markets compared with good volatility. This may result from the heterogeneity of investor expectation in different markets. Good information leads to positive investor expectation on the Bitcoin price. Due to heterogeneous conveniences catching information of investors, besides assimilating good information in the autologous markets, the Bitcoin investors usually obtain information from other markets to generate their investment strategies. Thus, good volatility spillovers among different Bitcoin markets are stronger. On the contrary, bad information not only decreases the investor expectations on Bitcoin, but also challenges the market system. On the one hand, for those markets with more comprehensive market systems like USD, considering the regulation complexity caused by spillovers as well as protecting investors, they usually reduce the spillovers to other markets, reaching a balance status. On the other hand, the migration of primary Bitcoin markets influences the development of the market system. With regard to bad information, for those weakly stable markets like the PLN and KRW markets, investors decide their investor expectation by looking at the price trend of Bitcoin in other markets and then generate their investment strategies. Besides, the markets reduce spillovers from other markets by setting relevant admittance criterion. Thus, relative to good volatility spillovers, the bad volatility spillovers in the USD, PLN, and KRW markets are significantly reduced. The digestive ability of the market itself also determines the asymmetry of spillover. To reply to bad information, the market implements the digestion of information by enhancing autologous efficiency and perfecting an autologous system. At this moment, the self-spillovers of the Bitcoin markets are strong. However, for those markets where investors are diversiform, like EUR, JPY, and IDR, increasing the autologous spillovers cannot better digest bad information. They have to strengthen the connectedness with other markets. Accordingly, relative to good volatility spillovers, the bad volatility spillovers in the EUR, JPY, and IDR markets are significantly enhanced.
The asymmetry of spillover direction between good volatility and bad volatility is not evident. We can see from the arrows in (a) and (b) of Figure 3 that except the USD, EUR, and KRW markets, both the good volatility and bad volatility spill from markets with large capitalization to markets with small capitalization. It also deserves to be noted that good volatility spills from USD to EUR, while the bad volatility spills from EUR to USD. Besides, KRW receives both good and bad volatility spillovers.
As the markets with large capitalization play the leading roles in the development of Bitcoin price, investors from markets with small capitalization generate rational investment strategies to earn more profits by looking at the price trend of Bitcoin. For the USD and EUR markets, the similarity and superiority of the market system determine the asymmetry of good and bad volatility spillover directions between these two markets. Meanwhile, the policy attitude on financial assets like Bitcoin in the USD and EUR markets also determines the asymmetry of spillover directions. In addition, the particularity of the KRW market creates opportunities for Bitcoin investors to transfer risks. Due to China’s policy attitude toward Bitcoin, the KRW and JPY are gradually becoming primary Bitcoin markets, which attract a great deal of investors. But as the JPY market follows some superior design of the market system, it can better reply to good and bad volatility spillovers of Bitcoin. The instability of the KRW market creates opportunities for speculators to earn excessive profits. Meanwhile, as the attitude of KRW on Bitcoin and the advance of internet technology, the KRW market has been an accepter of volatility spillover.
Dynamic Analysis of Asymmetric Network Connectedness
Figure 4 shows the dynamic net spillovers of good and bad volatility among different Bitcoin markets, where a) shows the good volatility spillovers and b) shows the bad volatility spillovers. The leading roles of good and bad volatility spillovers are time-varying and heterogeneous in different markets. The good and bad volatility spillover levels determine their leading roles. We can see from the figure that good volatility spillover played a leading role in the USD market before 2017 and after 2018, while the bad volatility spillover played the leading role in other time periods. The bad volatility spillovers played a leading role in the EUR market before 2017, while both good and bad volatility spillovers played the leading roles in the market after then. For the JPY market, both good and bad volatility spillovers played leading roles before 2018 while the bad volatility spillover played the leading role after 2018. The good volatility spillover played the leading role in the KRW market during the whole period of the sample. For the IDR market, before 2017 the bad volatility spillover played the leading role. The good volatility spillover played the leading role during the periods of 2017II-2018I and 2019II-2019III. Both good and bad volatility spillovers played the leading roles the rest of the time. With regard to the PLN market, the bad volatility spillover played the leading role during the periods of 2017IV-2018I and 2019III-2020I, while both the good and bad volatility spillovers played the leading roles in other time periods.
The difference of market system determines the heterogeneity in leading roles of good and bad volatility spillovers among the Bitcoin markets. The policy attitude from the USD market on new assets like cryptocurrencies and the developing trend of Bitcoin in the USD market provide a favorable environment for investors to generate investment strategies. The good information from the USD market enhances the investor expectations. Thus, the leading role of good volatility in the USD market persists during the whole sample period. However, the development of other cryptocurrencies challenged Bitcoin during 2017 to 2018. At this moment, the Bitcoin price volatility induced by bad information had begun to contaminate different Bitcoin markets, resulting in the joint leading roles played by good and bad volatility spillovers in the USD market. Protecting investors in the USD market enhances the market efficiency. The increase of the Bitcoin market efficiency gradually digests price volatility caused by bad information. Therefore, after 2018, the good volatility spillover recovered the leading role in the USD market.
The different perfection levels of the Bitcoin markets determine the heterogeneity in leading roles of good and bad volatility spillovers among different markets. This may result from the effects of major events on the Bitcoin markets. Bitcoin futures were born in December 2017 and were welcomed into the USD and EUR markets. This provided an opportunity for the EUR market. With a similar system to the USD market, EUR attracts many investors into the market, changing the leading role of EUR in volatility spillover. On the other hand, although JPY followed the system from other markets, it cannot perfect the market to adapt to the increase of investors. The JPY market highlighted the legality of Bitcoin by issuing some relevant laws in 2018. However, as the investor heterogeneity, the issued laws cannot well serve the market perfection. Thus, JPY mainly spilled bad volatility after 2018. Due to the instability of the KRW market, it has been the main receiver of both good and bad volatility spillovers. Besides, as the newly developing Bitcoin markets, IDR and PLN, the origins leading to market imperfection and investor complexity are still unclear. The investor expectations fluctuate strongly. Thus, the leading roles of good and bad volatility spillovers in the IDR and PLN markets do not show evident characteristics.
Test Asymmetric Dynamic Network Connectedness in Bitcoin Markets
Using the results of dynamic spillovers in Sections 2 and 3, in this section, we test the asymmetry between systematic (good) volatility and idiosyncratic (bad) volatility. In the first subsection, we construct statistical magnitudes to test the asymmetry. In the second subsection, we test the asymmetry between systematic and idiosyncratic volatility spillovers, while in the third subsection, we test the asymmetry between good and bad volatility spillovers.
Conducting Test Statistics of Asymmetric Dynamic Network
We now describe how to test asymmetries in volatility spillovers. This procedure is addressed by two steps. In the first step, we propose a hypothesis, while in the second step, we construct statistical magnitudes.
A comparison of the spillover values opens the following possibilities. If the systematic (good) volatility spillovers equal to the idiosyncratic (bad) volatility spillovers, the spillovers are symmetric, and we expect the spillovers to be of the same magnitude as spillovers from RV. The test for dynamic net pairwise spillover among the markets also follows this principle. These properties enable us to test the following hypotheses:
where
If the null hypothesis holds, it suggests that the spillover levels are coincident in the time dimension among different Bitcoin markets. Accordingly, we construct four statistical magnitudes as Eqs 5–8:
where Eqs 5 and 6 are statistical magnitudes testing the dynamic spillovers and net pairwise spillovers of systematic and idiosyncratic volatilities, while Eqs 7 and 8 are statistical magnitudes testing the dynamic spillovers and net pairwise spillovers of good and bad volatilities.
According to the hypothesis and statistical magnitudes, the hypotheses in this paper are as follows:
where (1) and (2) test the asymmetry of dynamic spillovers (net pairwise spillovers) between systema-tic and idiosyncratic volatilities, while (3) and (4) test the asymmetry of dynamic spillovers (net pairwise spillovers) between good and bad volatilities. In addition,
In this paper, we first address test (1) and test (3), namely that the comparison of dynamic spillovers or net pairwise spillovers between systematic (good) and idiosyncratic (bad) volatilities. After rejecting the null hypothesis, we further test the spillover levels, namely test 2) and test (4).
Test the Asymmetric Connectedness of Common and Idiosyncratic Volatility
In this section, we report the asymmetry of systematic and idiosyncratic volatility dynamic spillovers among different Bitcoin markets. On the basis of the static spillovers of systematic and idiosyncratic volatilities in Section 3, Figure 5 shows the dynamic spillovers of systematic and idiosyncratic volatilities among the Bitcoin markets. Table 3 discusses the dynamic net pairwise spillover of systematic and idiosyncratic volatilities among the Bitcoin markets.
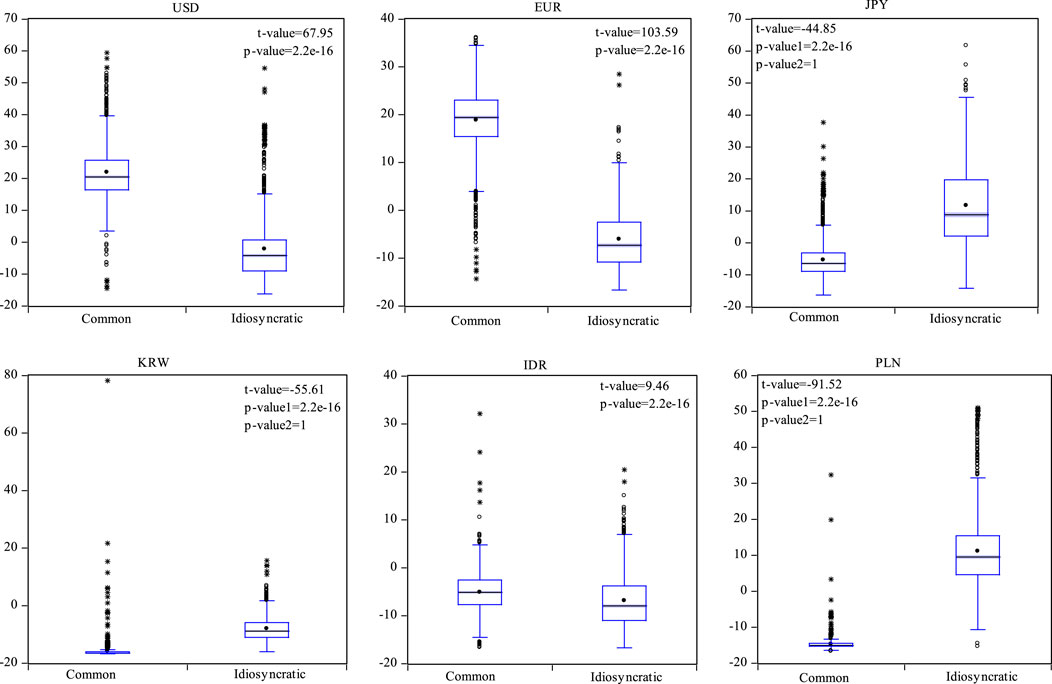
FIGURE 5. Test results of net spillover between systematic and idiosyncratic volatilities (p < 0.05). Note: I: The boxplot show the dynamic net pairwise spillovers of systematic and idiosyncratic volatilities among the Bitcoin markets. II: The t-value is the value of t-statistics. The p-value1 is the p-value of test (1). The p-value2 is the p-value of test (2). If both the p-value1 and p-value2 are smaller than 0.05, then it is replaced by p-value. III: Test (1):
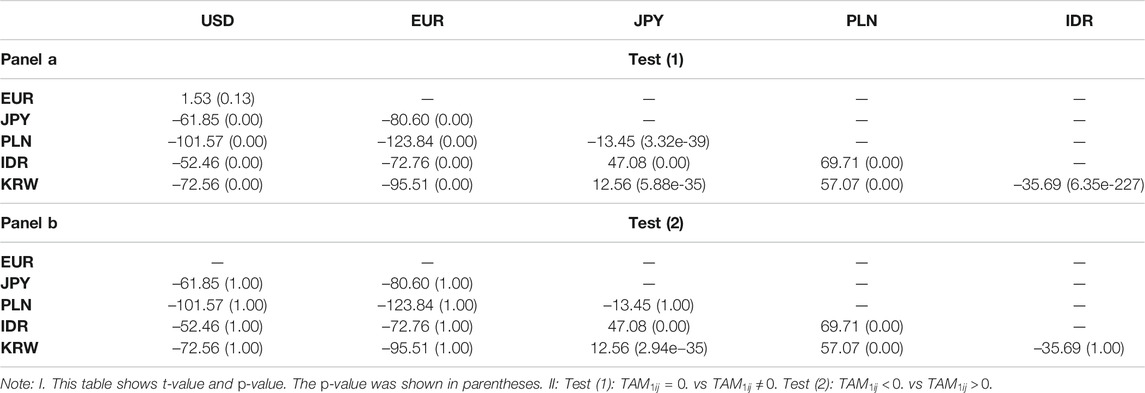
TABLE 3. Test results of net pairwise spillover between systematic and idiosyncratic volatility.
The asymmetry between systematic and idiosyncratic volatility spillovers is captured. In Figure 5, t-value is the value of t-statistics, p-value1 represents the p-value of test (1), while p-value2 represents the p-value of test (2). If the p-value1 and p-value2 are both smaller than the confidence level 0.05, then it is replaced by the p-value. From the p-value or p-value1, we can find the significant asymmetry between the dynamic spillovers of systematic and idiosyncratic volatilities. Furthermore, we test and compare the dynamic spillover levels of systematic and idiosyncratic volatilities. We can see that in the USD, EUR, and IDR markets, the p-value2 is smaller than 0.05, while in the JPY, KRW, and PLN markets, p-value2 is larger than 0.05. According to the null hypothesis and alternative hypothesis of test (2), in the USD, EUR, and IDR markets, the dynamic spillovers of systematic volatilities are significantly stronger than that of idiosyncratic volatilities. Inverse results hold in the JPY, KRW, and PLN markets.
On the one hand, the asymmetry between systematic and idiosyncratic volatility spillovers is induced by the heterogeneity of the influencing mechanism. The systematic volatility is influenced by the autologous information and price evolution of Bitcoin, while the idiosyncratic volatility is influenced by the idiosyncratic information in different markets. From the perspective as a financial asset, the effect of systematic information on the Bitcoin price depends on the autologous security, convenience, and particularity. Decentralization is the most significant characteristic in the development of Bitcoin. The blockchain is the primary technique support. This particularity provides convenience for investors to generate investment strategies, which attracts many investors to consider Bitcoin as a financial asset. Meanwhile, due to the rapid development of the internet, Bitcoin thefts happen all the time. Its security is another problem that should be paid attention to. From the perspective of markets, the effect of idiosyncratic information on the Bitcoin price depends on the shocks of major events and policy attitudes. The idiosyncratic policy attitude determines the legality and security of Bitcoin transactions in the market as well as the protection for investors, which can enhance the investment expectation of Bitcoin investors. The development of financial integration results in that one market may receive spillovers of policy attitudes from other markets, which may make differences to the investment expectations of investors. Accordingly, there shows significant asymmetry between systematic and idiosyncratic volatility spillovers among different Bitcoin markets.
On the other hand, the asymmetry between systematic and idiosyncratic volatility spillovers among different Bitcoin markets results from the heterogeneity of roles played by different markets in deciding the price evolution of Bitcoin. The USD and EUR, as the markets with large capitalization, focus more on the advantages brought by the development of Bitcoin, especially the development of blockchain technology. The attitude of IDR, who focuses more on technology, toward Bitcoin determines the impact of the IDR market on the Bitcoin price evolution. Due to China’s policy attitude toward Bitcoin, the weight shifts to the JPY and KRW markets, such that more speculators flood into their markets, which results in the weakening of market stability. Meanwhile, that supervision is supplemented sparingly is another reason for the weakening of market stability. Even though one market focuses more on technology, the idiosyncratic characteristics of individual markets still impact the Bitcoin price evolution. These markets reflect the roles of different markets in the Bitcoin price evolution. More precisely, USD, EUR and IDR influence the Bitcoin price by spreading public information, while JPY, KRW, and PLN spread idiosyncratic information.
This shows asymmetry between systematic and idiosyncratic volatility spillovers. Panel a in Table 3 reports the dynamic net pairwise spillovers among different Bitcoin markets. On the basis of asymmetry in panel a, in this paper, we further test the dynamic net pairwise spillover levels of systema-tic and idiosyncratic volatilities in different markets, see panel b in Table 3. From panel a in Table 3, it can be seen that among the fifteen net pairwise spillovers, only the pair USD-EUR accepts the null hypothesis on the inexistence of asymmetry, which reflects the almost asymmetry of dynamic net pairwise spillovers. Further looking at panel b in Table 3, among the fourteen asymmetric net pairwise spillovers, ten pairs show that the dynamic spillovers of systematic volatility are weaker than that of idiosyncratic volatility. Accordingly, from the net pairwise spillovers among the markets, the idiosyncratic volatility spillover plays a leading role among the Bitcoin markets.
The effect of idiosyncratic information on the Bitcoin price evolution highlights the leading roles of idiosyncratic volatility spillover among the Bitcoin markets. The development of Bitcoin has driven the development of emerging technology such as blockchain technology. The development of this technology attracts much attention from different countries and regions. However, the security of Bitcoin challenges the design of financial systems and the supervision of financial risk in the countries and regions. The difference between cryptocurrency assets like Bitcoin and traditional assets leads to different policy attitudes of markets on the Bitcoin. The difference of policy attitudes gives rise to barriers for investors and speculators to earn profits. Meanwhile, one market may be infected by policy attitudes from other markets, leading to the fluctuation of investor expectations and change of market stability, resulting in the price volatility of Bitcoin in the market. However, as with the similar market systems of USD and EUR, there does not appear to be any asymmetric net pairwise spillovers between systematic and idiosyncratic volatilities in these two markets.
Test the Asymmetric Connectedness of Good and Bad Volatility
In this section, we report the asymmetry between good and bad volatility dynamic spillovers among different Bitcoin markets. On the basis of the dynamic net spillovers of good and bad volatilities in Section 4, Figure 6 shows the dynamic net spillovers of good and bad volatilities among different Bitcoin markets. Table 4 shows the dynamic net pairwise spillovers of good and bad volatilities among different Bitcoin markets.
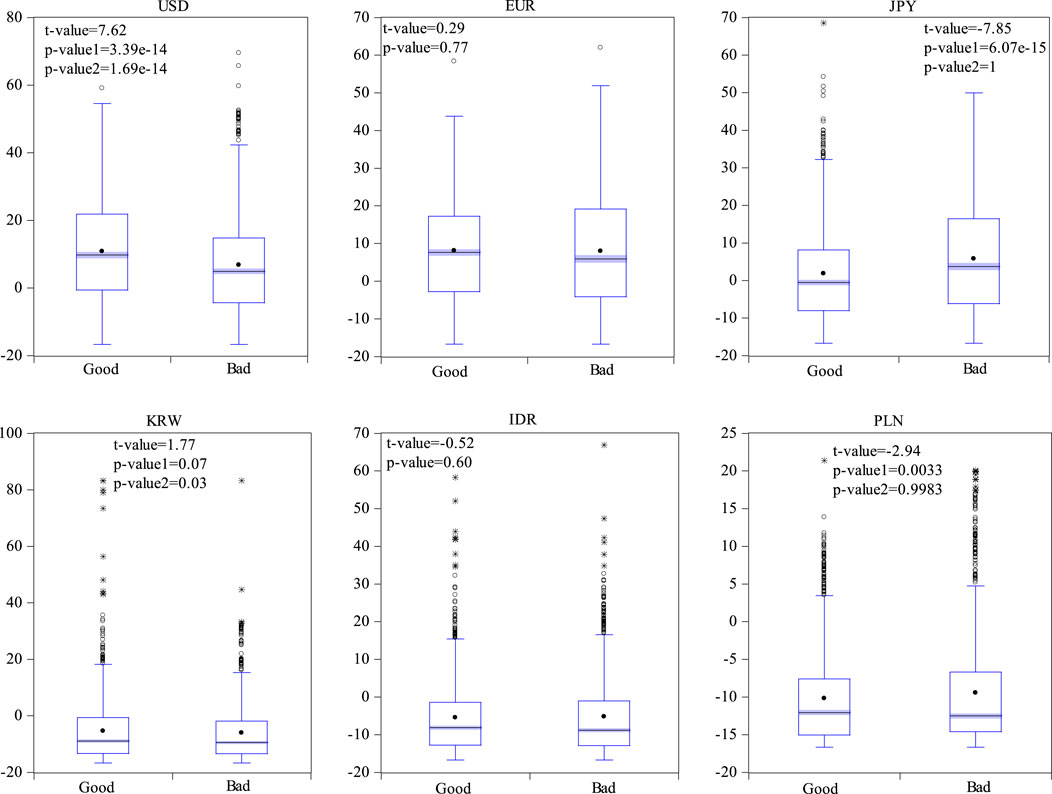
FIGURE 6. Test results of net spillovers between good and bad volatilities (p < 0.05). Note: I. The boxplot show the dynamic net spillovers of good and bad volatilities among different Bitcoin markets. II. The t-value is the value of t-statistics. The p-value1 is the p-value of test (3). The p-value2 is the p-value of test (4). If the p-value1 is larger than 0.05, it is replaced by p-value. III: Test (3):
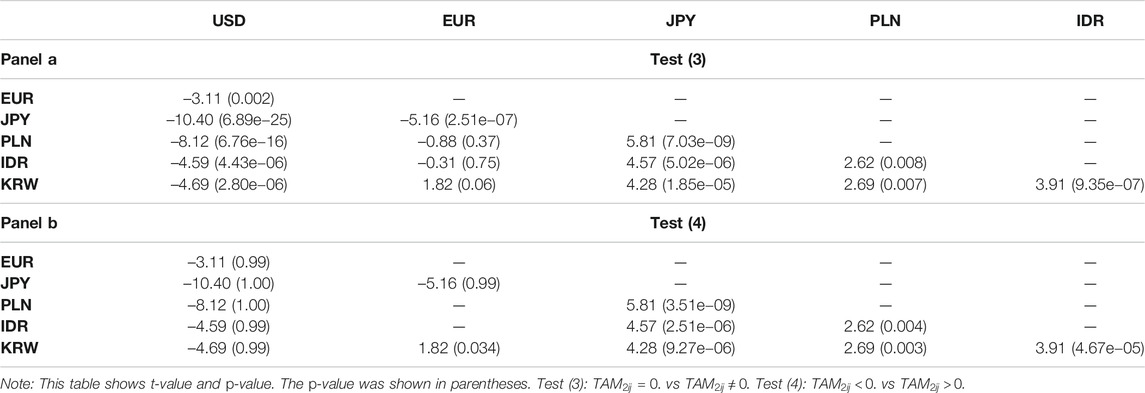
TABLE 4. Test results of net pairwise spillover between good and bad volatilities
The asymmetry of good and bad volatility spillovers is heterogeneous in different markets. In Figure 6, the t-value is the value of statistics t. The p-value1 is the p-value of test (3). The p-value2 is the p-value of test (4). If the p-value1 is larger than 0.05, then it is replaced by p-value. From the p-value or p-value1 in Figure 6, we can see the significant heterogeneity of asymmetry between good and bad volatility dynamic spillovers in different markets. More precisely, the p-value suggests accepting the null hypothesis on the inexistence of asymmetry in the EUR and IDR markets. The p-value2 is less than 0.05 in the USD and KRW markets, while it is more than 0.05 in the JPY and PLN markets. According to the null hypothesis and alternative hypothesis of test (4), we can see that the good volatility dynamic spillovers are significantly stronger than the bad volatility dynamic spillovers in the USD and KRW markets, while the inverse case holds in the JPY and PLN markets.
The market information brought into the public determines the heterogeneity of asymmetric spillovers between good and bad volatilities among different markets. If more market information is brought to the public, the investors can better grasp the Bitcoin price and generate correct investment strategies, which may strengthen the market stability. Thus, the Bitcoin price admits positive returns. On the contrary, if less market information is brought into the markets, the uncertainty of investor expectations may be higher and the market stability is lower, resulting in stronger volatility. At this moment, the Bitcoin price admits negative returns. For the USD and KRW markets, influenced by the necessity to protect investor interests and construct financial market systems, the good volatility spillovers are significantly stronger than the bad volatility spillovers. From the perspective of protecting investor interests, the investor can better grasp the Bitcoin price by the market information brought into the public. Moreover, the market may release advantageous information to prevent the instability of other markets from influencing the price in the autologous markets. At this moment, the investors may show good expectations and generate rational investment strategies. In addition, the insecurity of Bitcoin markets, such as events like hacker attacking and Bitcoin theft, requires the markets to enhance the perfection of autologous market systems. This enhancement shows positive effects on the Bitcoin price. Therefore, the good volatility contributes more to the Bitcoin price than the bad volatility in the USD and KRW markets. The inverse case arises in the JPY and PLN markets. Influenced by the shift of key Bitcoin markets, there is a high proportion of speculators in the JPY and PLN markets. At this moment, the market stability is lower and the investor expectations are unstable. This causes some issues for investors when generating investment strategies. Thus, the bad information produces a negative effect on the Bitcoin price. In the EUR and IDR markets, the good and bad information shows almost equivalent effects on the Bitcoin price volatility. Furthermore, we analyze the spillover effects of price volatility across different Bitcoin markets.
The bad volatility spillovers play leading roles in the Bitcoin markets with large capitalization. Panel a in Table 4 reports the asymmetry of dynamic net pairwise spillovers among the Bitcoin markets. On the basis of asymmetry existing in the markets in panel a, we further test the levels of dynamic net pairwise spillovers of good and bad volatilities in different markets, see panel b in Table 4. From panel a in Table 4, among the fifteen pairs of net pairwise spillovers, only the pairs EUR-PLN and EUR-IDR accept the null hypothesis on the inexistence of asymmetry. Therefore, the dynamic net pairwise spillovers among different Bitcoin markets are almost all asymmetric. By looking at panel b in Table 4, among the thirteen asymmetric net pairwise spillovers, there are six pairs showing that good volatility spillovers are weaker than bad volatility spillovers, where five of them are relevant to the USD market. Accordingly, the results of net pairwise spillovers suggest the heterogeneity in dynamic spillovers of good and bad volatilities among different Bitcoin markets.
The Bitcoin market system design leads to the heterogeneity in asymmetric spillovers of good and bad volatilities. The efficiency and perfection of the USD market are both higher than other markets. This market superiority can well protect the profits of investors. The investor expectations are also higher. At this moment, the investors and policy makers aim to decrease the market volatility, through releasing advantageous information. Therefore, the good volatility spillover plays a leading role from the USD market to other markets. The difference between virtual assets like Bitcoin and traditional financial assets means that the Bitcoin can be shocked greatly by major events, which challenges the design of Bitcoin market systems. At present, most markets are in the stage of exploring Bitcoin. There shows higher uncertainty of investor expectations in the markets. This uncertainty enhances the instability of markets and then the Bitcoin price volatility. Thus, the bad volatility spillovers play leading roles in the connectedness of other Bitcoin markets.
Conclusions and Policy Implications
Information transmission is an important link of Bitcoin price volatility spillovers. In this paper, the sample data were from six Bitcoin markets whose capitalizations are within the top ten. The sample period was from March 6, 2016 to March 15, 2020. First, we measured the realized volatilities of Bitcoin in each market with the data frequency of 5 min. Second, we decomposed the realized volatility into systematic and idiosyncratic volatilities (good and bad volatilities), and then analyzed the static and dynamic spillovers. Finally, we tested the asymmetry between systematic and idiosyncratic volatility spillovers (good and bad volatility spillovers) by constructing statistics. The conclusions are summarized as follows:
The spillovers between systematic and idiosyncratic volatilities in different Bitcoin markets play leading roles. In addition, the idiosyncratic volatility spillovers are more easily influenced by policies. The most enhancement on volatility spillover after decomposition of the realized volatility was found in the KRW market, which was given as 14.81/0.3 = 49 and 6.99/0.3 = 20, which was followed by the JPY market, given as 8.65/1.2 = 1 and 14/1.2 = 11. The least enhancement on volatility spillover after decomposition of the realized volatility was found in the IDR market, which was given as 6.28/4.2 = 1.5 and 8.34/4.2 = 2. The spillover directions changed after decomposition in the USD, EUR, JPY, and PLN markets, while they did not change in the IDR and KRW markets. Besides, the systematic volatility spillovers almost did not change their signs during the sample period. The signs of the idiosyncratic volatility spillovers among different markets showed strong relationship to policies.
Good volatility spillovers dominated the Bitcoin markets and changed over time. More precisely, comparing the good and bad volatility spillovers, the spillover levels decreased in the USD, PLN, and KRW markets, while they increased in the EUR, JPY, and IDR markets. Good volatility spillovers played leading roles in the USD market before 2017 and after 2018, while bad volatility spillovers played leading roles in other time periods. Bad volatility spillovers played leading roles in the EUR market before 2017, while both the good and bad volatility spillovers played leading roles after 2017. Both the good and bad volatility spillovers played leading roles in the JPY market before 2018, while the bad volatility spillovers played the leading roles after 2018. Good volatility spillovers played leading roles in the sample period. In the IDR market, bad volatility spillovers played the leading roles before 2017. The good volatility spillovers played leading roles during the periods from 2017II to 2018I and 2019II to 2019III. Both the good and bad volatility spillovers played the leading roles in other time periods. In the PLN market, the bad volatility spillovers played the leading roles during the periods from 2017IV to 2018I and 2019III to 2020I. Both the good and bad volatility spillovers played the leading roles in other time periods.
There was significant asymmetry between systematic and idiosyncratic volatility spillovers among different Bitcoin markets. The asymmetries between good and bad volatility spillovers were heterogeneous in different markets. More precisely, the dynamic spillovers of systematic volatility were significantly stronger than that of idiosyncratic volatility in the USD, EUR, and IDR markets. With regard to good and bad volatility spillovers, there was no asymmetry in the EUR and IDR markets. The dynamic spillovers of good volatility in the USD and KRW markets were significantly stronger than that of bad volatility. The inverse results hold in the JPY and PLN markets.
Indeed, the empirical results in this paper can provide some policy suggestions for regulators and investors. For the regulators, on the one hand, it should strengthen the establishment of market systems and information public degrees. The Bitcoin price volatility results from the difficulties for investors to obtain information, the strong hysteresis, and the imperfection of market systems. We should be familiar with the Bitcoin price evolution and its internal logic by strengthening the establishment of market systems, which is important to take the advantages of Bitcoin and protect the legal interests of investors. On the other hand, it should prevent information shocks from other markets. The regulators should guide the investors to invest rationally. Markets should learn form those markets with higher perfection like USD and EUR to prevent idiosyncratic information from other markets from causing strong volatility of the Bitcoin price. For the investors, the heterogeneity of information volatilities among cryptocurrencies should be paid attention to for the generation of investment strategies. Information and major events have large impacts on the Bitcoin price volatility. The investors should grasp the information of Bitcoin price by various ways and invest rationally. The investors should well filter the information and generate investment strategies. The analysis on the asymmetry of volatility spillovers among different Bitcoin markets provides some help for investors to estimate event shocks.
Data Availability Statement
The raw data supporting the conclusions of this article will be made available by the authors, without undue reservation.
Author Contributions
Substantial contributions to the conception or design of the work: SC and HD. The acquisition, analysis, or interpretation of data for the work: SC and HD. Drafting the work or revising it critically for important intellectual content: SC and HD. SC and HD provided approval for the publication of the content.
Funding
This research was funded by the National Science Foundation of Guangdong Province, grant number 2020A1515010746.
Conflict of Interest
The authors declare that the research was conducted in the absence of any commercial or financial relationships that could be construed as a potential conflict of interest.
References
1. Acemoglu D, Zilibotti F. Was prometheus unbound by chance? Risk, diversification, and growth. J Polit Econ (1997). 105(4):709–51. doi:10.1086/262091
2. Alam MS, Shahzad SJH, Ferrer R. Causal flows between oil and forex markets using high-frequency data: asymmetries from good and bad volatility. Energy Econ (2019). 84:104513. doi:10.1016/j.eneco.2019.104513
3. Algieri B, Leccadito A. Assessing contagion risk from energy and non-energy commodity markets. Energy Econ (2017). 62:312–22. doi:10.1016/j.eneco.2017.01.006
4. An S, Gao X, An H, Liu S, Sun Q, Jia N. Dynamic volatility spillovers among bulk mineral commodities: a network method. Resour Pol (2020). 66:101613. doi:10.1016/j.resourpol.2020.101613
5. Andersen TG, Bollerslev T. Answering the skeptics: yes, standard volatility models do provide accurate forecasts. Int Econ Rev (1998). 39(4):885–905. doi:10.2307/2527343
6. Ballester L, Casu B, González-Urteaga A. Bank fragility and contagion: evidence from the bank CDS market. J Empir Finance (2016). 38:394–416. doi:10.1016/j.jempfin.2016.01.011
7. Barndoff-Nielsen O, Kinnebrock S, Shephard N. Measuring downside risk-realized semi variance. In: T Bollerslev, J Russell, and M Watson, editors. Volatility and time series econometrics: essays in honor of Robert F. Engle. Oxford, UK: Oxford University Press (2010). p. 117–36.
8. Bartram SM, Brown G, Stulz RM. Why are U.S. Stocks more volatile? J Finance (2012). 67(4):1329–70. doi:10.1111/j.1540-6261.2012.01749.x
9. Baur DG. Financial contagion and the real economy. J Bank Finance (2012). 36(10):2680–92. doi:10.1016/j.jbankfin.2011.05.019
10. Baur DG, Hong KH, Lee A. Bitcoin: medium of exchange or speculative assets? J Int Financ Mark Inst Money (2017). 54:177–89. doi:10.1016/j.intfin.2017.12.004
11. Baur DG, Dimpfl T, Kuck K. Bitcoin, gold and the US dollar--A replication and extension. Finance Res Lett (2017). 25:103–10. doi:10.1016/j.frl.2017.10.012
12. Barigozzi M, Hallin M. Generalized dynamic factor models and volatilities: recovering the market volatility shocks. Econom J (2016). 19(1):33–60. doi:10.1111/ectj.12047
13. Baruník J, Kočenda E, Vácha L. Asymmetric connectedness on the U.S. stock market: bad and good volatility spillovers. J Financ Mark (2016). 27:55–78. doi:10.1016/j.finmar.2015.09.003
14. Baruník J, Kočenda E, Vácha L. Asymmetric volatility connectedness on the forex market. J Int Money Finance (2017). 77:39–56. doi:10.1016/j.jimonfin.2017.06.003
15. Barunik J, Kocenda E. Total, asymmetric and frequency connectedness between oil and forex markets. Energy J (2019). 40(01):3233. doi:10.5547/01956574.40.si2.jbar
16. BenSaïda A, Litimi H, Abdallah O. Volatility spillover shifts in global financial markets. Econ Modell (2018). 73:343–53. doi:10.1016/j.econmod.2018.04.011
17. Blau BM. Price dynamics and speculative trading in bitcoin. Res Int Bus Finance (2017). 41:493–9. doi:10.1016/j.ribaf.2017.05.010
18. Broadstock DC, Fan Y, Ji Q, Zhang D. Shocks and stocks: a bottom-up assessment of the relationship between oil prices, gasoline prices and the returns of Chinese firms. Energy J (2016). 37(01):2703. doi:10.5547/01956574.37.si1.dbro
19. Chow HK. Volatility spillovers and linkages in Asian stock markets. Emerg Mark Finance Trade (2017). 53(12):2770–81. doi:10.1080/1540496x.2017.1314960
20. Corbet S, Lucey BM, Yarovaya L. Datestamping the bitcoin and ethereum bubbles. Finance Res Lett (2017). 26:81–8. doi:10.1016/j.frl.2017.12.006
21. Nicola Fd., De Pace P, Hernandez MA. Co-movement of major energy, agricultural, and food commodity price returns: a time-series assessment. Energy Econ (2016). 57:28–41. doi:10.1016/j.eneco.2016.04.012
22. Diebold FX, Yilmaz K. Better to give than to receive: predictive directional measurement of volatility spillovers. Int J Forecast (2012). 28(1):57–66. doi:10.1016/j.ijforecast.2011.02.006
23. Diebold FX, Yilmaz K. On the network topology of variance decompositions: measuring the connectedness of financial firms. J Econom (2011). 182(1):119–34. doi:10.2139/ssrn.1937613
24. Dong H, Chen L, Zhang X, Failler P, Xu S. The asymmetric effect of volatility spillover in global virtual financial asset markets: the case of Bitcoin. Emerg Mark Finance Trade (2020). 56(6):1293–311. doi:10.1080/1540496x.2019.1671819
25. Dungey M, Fry R, Martin VL. Equity transmission mechanisms from Asia to Australia: interdependence or contagion? Aust J Manag (2003). 28(2):157–82. doi:10.1177/031289620302800203
26. Dungey M, Martin VL. Unravelling financial market linkages during crises. J Appl Econ (2007). 22(1):89–119. doi:10.1002/jae.936
27. Dungey M, Gajurel D. Contagion and banking crisis - international evidence for 2007-2009. J Bank Finance (2015). 60(11):271–83. doi:10.1016/j.jbankfin.2015.08.007
28. Dyhrberg AH. Hedging capabilities of bitcoin. Is it the virtual gold? Finance Res Lett (2016). 16(16):139–44. doi:10.1016/j.frl.2015.10.025
29. Feunou B, Jahan-Parvar MR, Tédongap R. Modeling market downside volatility*. Rev Finance (2013). 17(1):443–81. doi:10.1093/rof/rfr024
30. Forni M, Lippi M. The generalized dynamic factor model: representation theory. Econom Theory (2001). 17(6):1113–41. doi:10.1017/s0266466601176048
31. Fry J, Cheah E-T. Negative bubbles and shocks in cryptocurrency markets. Int Rev Financ Anal (2016). 47(47):343–52. doi:10.1016/j.irfa.2016.02.008
32. Goyal A, Santa-Clara P. Idiosyncratic risk matters! J Finance (2003). 58(3):975–1007. doi:10.1111/1540-6261.00555
33. Gyamerah SA. Modelling the volatility of Bitcoin returns using GARCH models. Quant Finance Econ (2019). 3(4):739–53. doi:10.3934/QFE.2019.4.739
34. He Z, He L, Wen F. Risk compensation and market returns: the role of investor sentiment in the stock market. Emerg Mark Finance Trade (2019). 55(3):704–18. doi:10.1080/1540496x.2018.1460724
35. Kumar S, Tiwari AK, Chauhan Y, Ji Q. Dependence structure between the BRICS foreign exchange and stock markets using the dependence-switching copula approach. Int Rev Financ Anal (2019). 63:273–84. doi:10.1016/j.irfa.2018.12.011
36. Kapar B, Olmo J. An analysis of price discovery between Bitcoin futures and spot markets. Econ Lett (2019). 174:62–4. doi:10.1016/j.econlet.2018.10.031
37. Li Z, Dong H, Dong H, Huang Z, Failler P Asymmetric effects on risks of virtual financial assets (VFAs) in different regimes: a case of bitcoin. Quantitative Finance and Economics (2018). 2(4):860–83. doi:10.3934/qfe.2018.4.860
38. Li J, Yao Y, Li J, Zhu X. Network-based estimation of systematic and idiosyncratic contagion: the case of Chinese financial institutions. Emerg Mark Rev (2019). 40:100624. doi:10.1016/j.ememar.2019.100624
39. Li Z, Zhong J. Impact of economic policy uncertainty shocks on China’s financial conditions. Finance Res Lett (2020). 35:101303. doi:10.1016/j.frl.2019.101303
40. Luo J, Ji Q. High-frequency volatility connectedness between the US crude oil market and China's agricultural commodity markets. Energy Econ (2018). 76:424–38. doi:10.1016/j.eneco.2018.10.031
41. Ji Q, Bouri E, Roubaud D, Shahzad SJH. Risk spillover between energy and agricultural commodity markets: a dependence-switching CoVaR-copula model. Energy Econ (2018). 75:14–27. doi:10.1016/j.eneco.2018.08.015
42. Ji Q, Bouri E, Roubaud D. Dynamic network of implied volatility transmission among US equities, strategic commodities, and BRICS equities. Int Rev Financ Anal (2018). 57:1–12. doi:10.1016/j.irfa.2018.02.001
43. Ji Q, Zhang D. How much does financial development contribute to renewable energy growth and upgrading of energy structure in China? Energy Pol (2019). 128:114–24. doi:10.1016/j.enpol.2018.12.047
44. Ji Q, Liu B-Y, Fan Y. Risk dependence of CoVaR and structural change between oil prices and exchange rates: a time-varying copula model. Energy Econ (2019). 77:80–92. doi:10.1016/j.eneco.2018.07.012
45. Ma Y-R, Zhang D, Ji Q, Pan J. Spillovers between oil and stock returns in the US energy sector: does idiosyncratic information matter? Energy Econ (2019). 81:536–44. doi:10.1016/j.eneco.2019.05.003
46. Nan Z, Kaizoji T, Kaizoji T Bitcoin-based triangular arbitrage with the Euro/U.S. dollar as a foreign futures hedge: modeling with a bivariate GARCH model. Quant Finance Econ (2019). 3(2):347–65. doi:10.3934/qfe.2019.2.347
47. Narayan PK, Sharma SS. New evidence on oil price and firm returns. J Bank Finance (2011). 35(12):3253–62. doi:10.1016/j.jbankfin.2011.05.010
48. Nishimura Y, Sun B. The intraday volatility spillover index approach and an application in the Brexit vote. J Int Financ Mark Inst Money (2018). 55:241–53. doi:10.1016/j.intfin.2018.01.004
49. Patton AJ, Sheppard K. Good volatility, bad volatility: signed jumps and the persistence of volatility. Rev Econ Stat (2015). 97(3):683–97. doi:10.1162/rest_a_00503
50. Peng C, Zhu H, Guo Y, Chen X. Risk spillover of international crude oil to China’s firms: evidence from granger causality across quantile. Energy Econ (2018). 72:188–99. doi:10.1016/j.eneco.2018.04.007
51. Pesaran MH, Shin Y. An autoregressive distributed-lag modelling approach to cointegration analysis. Econ Soc Monogr (1998). 31:371–413. doi:10.1017/CCOL0521633230.011
52. Pieters G, Vivanco S. Financial regulations and price inconsistencies across bitcoin markets. Inf Econ Pol (2017). 39:1–14. doi:10.1016/j.infoecopol.2017.02.002
53. Prasad N, Grant A, Kim S-J. Time varying volatility indices and their determinants: evidence from developed and emerging stock markets. Int Rev Financ Anal (2018). 60:115–26. doi:10.1016/j.irfa.2018.09.006
54. Segal G, Shaliastovich I, Yaron A. Good and bad uncertainty: macroeconomic and financial market implications. J Financ Econ (2015). 117(2):369–97. doi:10.1016/j.jfineco.2015.05.004
55. Wang X, Wu C. Asymmetric volatility spillovers between crude oil and international financial markets. Energy Econ (2018). 74:592–604. doi:10.1016/j.eneco.2018.06.022
56. Wang Y, Pan Z, Liu L, Wu C. Oil price increases and the predictability of equity premium. J Bank Finance (2019). 102(5):43–58. doi:10.1016/j.jbankfin.2019.03.009
57. Wen F, Zhao Y, Zhang M, Hu C. Forecasting realized volatility of crude oil futures with equity market uncertainty. Appl Econ (2019). 51(59):6411–27. doi:10.1080/00036846.2019.1619023
58. Yarovaya L, Brzeszczyński J, Lau CKM. Asymmetry in spillover effects: evidence for international stock index futures markets. Int Rev Financ Anal (2017). 53:94–111. doi:10.1016/j.irfa.2017.07.007
59. Zhang D, Broadstock DC. Global financial crisis and rising connectedness in the international commodity markets. Int Rev Financ Anal (2020). 68:101239. doi:10.1016/j.irfa.2018.08.003
60. Zhang D, Ji Q, Kutan AM. Dynamic transmission mechanisms in global crude oil prices: estimation and implications. Energy (2019). 175:1181–93. doi:10.1016/j.energy.2019.03.162
Keywords: asymmetric, connectedness, bitcoin, realized volatility, good and bad volatility, common and idiosyncratic volatility
Citation: Chen S and Dong H (2020) Dynamic Network Connectedness of Bitcoin Markets: Evidence from Realized Volatility. Front. Phys. 8:582817. doi: 10.3389/fphy.2020.582817
Received: 13 July 2020; Accepted: 30 September 2020;
Published: 26 November 2020.
Edited by:
Jianguo Liu, Shanghai University of Finance and Economics, ChinaReviewed by:
Jie Cao, Nanjing University of Finance and Economics, ChinaQing Cheng, National University of Defense Technology, China
Copyright © 2020 Chen and Dong. This is an open-access article distributed under the terms of the Creative Commons Attribution License (CC BY). The use, distribution or reproduction in other forums is permitted, provided the original author(s) and the copyright owner(s) are credited and that the original publication in this journal is cited, in accordance with accepted academic practice. No use, distribution or reproduction is permitted which does not comply with these terms.
*Correspondence: Hao Dong, donghao@e.gzhu.edu.cn