Large Pelagic Fish Are Most Sensitive to Climate Change Despite Pelagification of Ocean Food Webs
 Colleen M. Petrik
 Charles A. Stock
 Ken H. Andersen
 P. Daniël van Denderen
 James R. Watson4
- 1Department of Oceanography, Texas A&M University, College Station, TX, United States
- 2Geophysical Fluid Dynamics Laboratory, National Oceanic and Atmospheric Administration, Princeton, NJ, United States
- 3Centre for Ocean Life, DTU Aqua, Technical University of Denmark, Lyngby, Denmark
- 4College of Earth, Ocean and Atmospheric Sciences, Oregon State University, Corvallis, OR, United States
Global climate change is expected to impact ocean ecosystems through increases in temperature, decreases in pH and oxygen, increased stratification, with subsequent declines in primary productivity. These impacts propagate through the food chain leading to amplified effects on secondary producers and higher trophic levels. Similarly, climate change may disproportionately affect different species, with impacts depending on their ecological niche. To investigate how global environmental change will alter fish assemblages and productivity, we used a spatially explicit mechanistic model of the three main fish functional types reflected in fisheries catches (FEISTY) coupled to an Earth system model (GFDL-ESM2M) to make projections out to 2100. We additionally explored the sensitivity of projections to uncertainties in widely used metabolic allometries and their temperature dependence. When integrated globally, the biomass and production of all types of fish decreased under a high emissions scenario (RCP 8.5) compared to mean contemporary conditions. Projections also revealed strong increases in the ratio of pelagic zooplankton production to benthic production, a dominant driver of the abundance of large pelagic fish vs. demersal fish under historical conditions. Increases in this ratio led to a “pelagification” of ecosystems exemplified by shifts from benthic-based food webs toward pelagic-based ones. The resulting pelagic systems, however, were dominated by forage fish, as large pelagic fish suffered from increasing metabolic demands in a warming ocean and from declines in zooplankton productivity that were amplified at higher trophic levels. Patterns of relative change between functional types were robust to uncertainty in metabolic allometries and temperature dependence, though projections of the large pelagic fish had the greatest uncertainty. The same accumulation of trophic impacts that underlies the amplification of productivity trends at higher trophic levels propagates to the projection spread, creating an acutely uncertain future for the ocean’s largest predatory fish.
Introduction
Anthropogenic greenhouse gas emissions are increasing global ocean temperatures, altering stratification and mixed layer depths, and decreasing pH and dissolved oxygen (Stocker et al., 2013). Centennial-scale projections with coupled climate-ocean-biogeochemistry Earth system models (ESMs) show global increases in temperature, and most project decreases in primary productivity (Bopp et al., 2013; Stocker et al., 2013). Ocean temperature and productivity exert strong controls on marine fish biomasses and distributions. Temperature directly impacts physiological rates and thus energy supply and demand. As a consequence, cooler habitats can support greater biomasses per unit of energy supply than warmer ones (Brown et al., 2004). Additionally, temperature indirectly affects ecosystem structure through the effects of stratification on primary production. Thermal stratification maintains phytoplankton in the euphotic zone while it impedes the upward movement of nutrients from below the mixed layer. Regionally, the temporally evolving interplay between access to light and nutrients shapes both the total amount of primary production, its seasonality, and the size of primary producers (e.g., Behrenfeld and Boss, 2014). Beyond temperature, fish abundances are also related to measures of ecosystem productivity. The total amount of energy available at the base of the ecosystem and phytoplankton size affect the number of trophic steps between primary producers and fish, and thus the amount of energy available to upper trophic levels (Ryther, 1969; Pauly and Christensen, 1995).
The combined effect of decreased energy at the base of the food web and increased energy demand from higher temperatures leads to projections of decreased fish biomasses (Cheung et al., 2010; Blanchard et al., 2012; Bryndum-Buchholz et al., 2019; Carozza et al., 2019; Lotze et al., 2019) and smaller individual sizes (Blanchard et al., 2012; Audzijonyte et al., 2013; Cheung et al., 2013; Lefort et al., 2015; Lotze et al., 2019) under climate change. However, many of these models rely on net primary production (NPP) as a forcing variable, yet there is a large degree of uncertainty in NPP across ESM projections (Bopp et al., 2013). Furthermore, the connections between primary productivity and fish catches are complex. Empirical studies have found that NPP alone is a weak predictor of regional variations in total fish biomass (Ryther, 1969; Friedland et al., 2012; Stock et al., 2017). Rather, the production of fish biomass is closely tied to the separation of NPP into pelagic and benthic secondary production and the total amounts of these two types (Friedland et al., 2012; Stock et al., 2017). van Denderen et al. (2018) expanded this work by hypothesizing that the ratio of the two pathways from NPP to fishes influences which fish functional type dominates. The ratio of the fraction of NPP that remained in the pelagic to the fraction that was exported to the seafloor explained the majority of the deviance in the relative biomass of large pelagic fish vs. demersal fish in commercial landings (van Denderen et al., 2018). When the amounts of pelagic and benthic resources are similar, the generalist demersals are able to outcompete the large pelagic specialists by feeding on both resource pools while the large pelagics only have access to one. Mechanistic food web models have also verified this statistical relationship between the fraction of pelagic and benthic resources (van Denderen et al., 2018; Petrik et al., 2019). Global simulations of the Fisheries Size and Functional Type (FEISTY) model using a recent historic climatology indicated that large-scale spatial differences in the dominance of large pelagic vs. demersal fishes is strongly related to the ratio of pelagic zooplankton production to benthic production (Petrik et al., 2019).
The partitioning of production between pelagic and benthic pathways also helps explain latitudinal patterns in the distributions of large pelagic fish and demersal fish. In oligotrophic waters, like the continuously stratified subtropical gyres, the majority of NPP is recycled within the mixed layer via microbial pathways that support microzooplankton grazers in the pelagic zone. In contrast, the light-limited high latitudes experience strong but short blooms in NPP with high interannual variability. The variability in bloom timing can lead to a mismatch between phytoplankton and the zooplankton grazer population, which has been reduced to low levels via deep winter mixing, resulting in an ungrazed fraction of NPP that is available for export (e.g., Lutz et al., 2007). The degree of zooplankton-phytoplankton coupling, quantified as the fraction of NPP grazed by zooplankton, is projected to increase in the more stratified conditions produced by climate change (Stock et al., 2014a). Direct temperature effects reinforce bloom-driven latitudinal patterns in pelagic vs. benthic resources, and introduce additional sensitivities to climate change. Increasing particle remineralization rates under warmer temperatures during export may reduce the amount of organic carbon that reaches the seafloor (Pomeroy and Deibel, 1986; Laws et al., 2000; Laufkötter et al., 2017), though remineralization is also modulated by oxygen and biogenic and lithogenic minerals (Armstrong et al., 2002; Klaas and Archer, 2002).
The diverse pathways connecting ocean productivity and fisheries and their myriad susceptibilities to climate change underscores the need for models capable of resolving these pathways and resolving the fish functional type-specific responses to the climate-driven changes in them. Furthermore, to integrate climate drivers, global fish models such as those considered by Lotze et al. (2019) often rely on emergent regularities between physiological/ecological rates and organism size and temperature (e.g., von Bertalanffy, 1960; Perrin, 1995). These relationships are subject to significant uncertainties (e.g., Clarke and Johnston, 1999; Rall et al., 2012) whose impacts on projected changes in fish abundance and production have not been systematically explored, to the best of our knowledge.
In this paper, we contribute to addressing these limitations by assessing the impacts of changing energy flow pathways between phytoplankton and fish by projecting the changes in global production of three primary commercial fisheries functional types, forage, large pelagic, and demersal fishes, under IPCC RCP 8.5 through 2100. We use the FEISTY model (Petrik et al., 2019), which resolves trophic interactions and basic life cycle processes for each of the functional types of interest (Figure 1). We focus on patterns of trophic amplification, contrasts in the response of fish functional types, and the sensitivity of both these critical processes to uncertainties in widely applied metabolic allometries and temperature dependences in fisheries models.
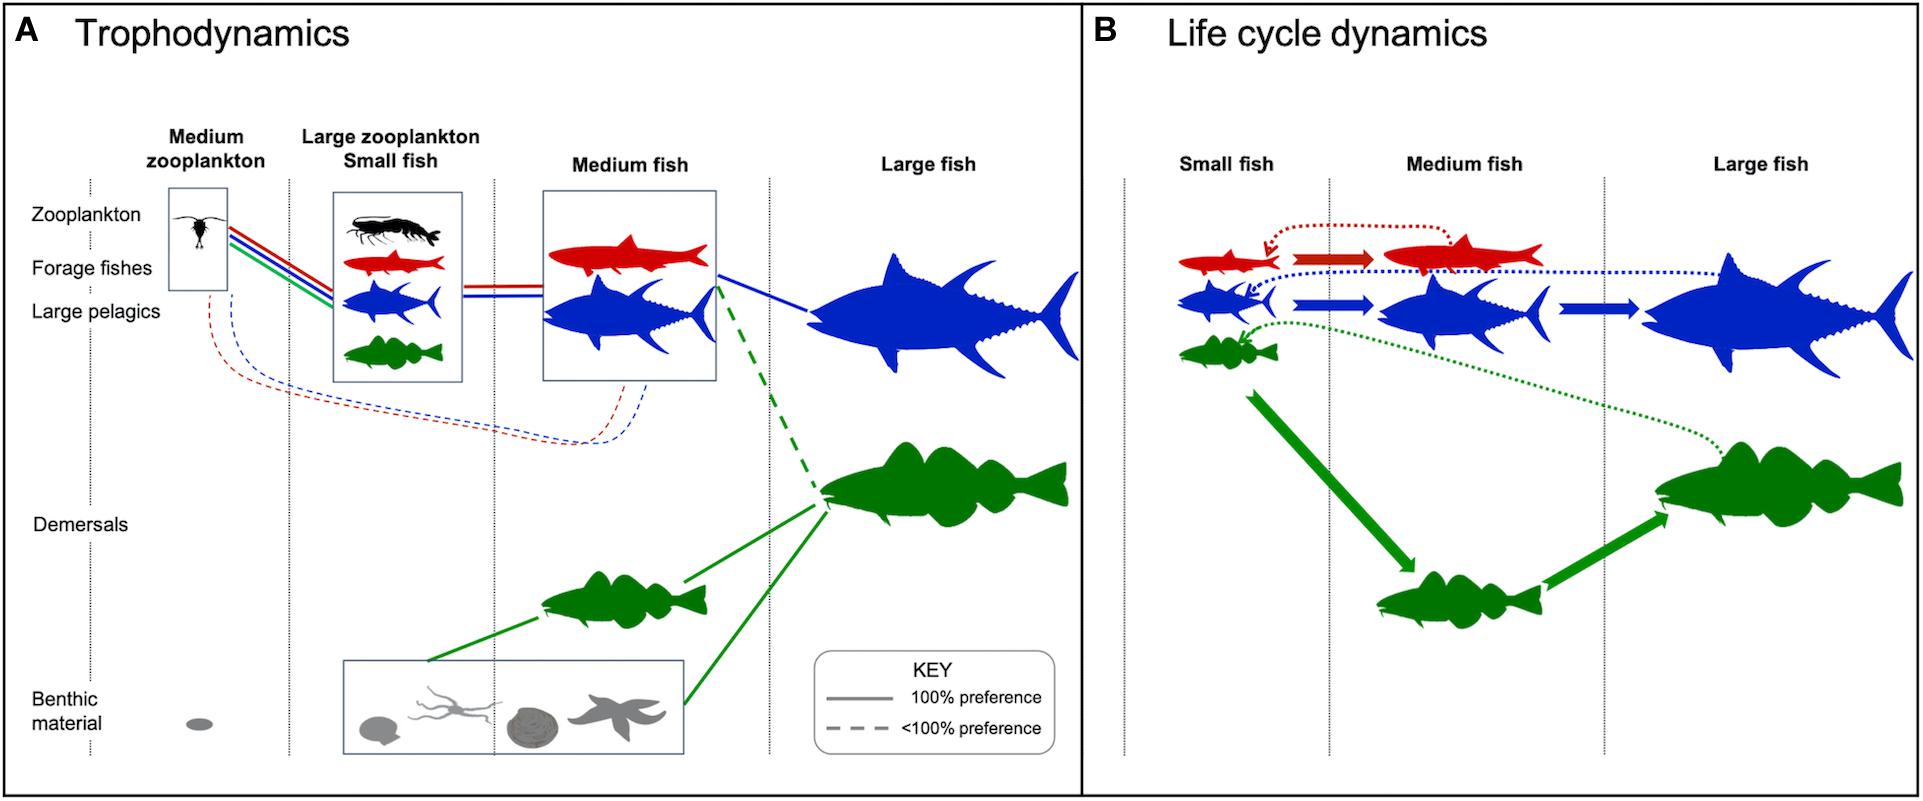
Figure 1. Model structure denoting the two zooplankton size classes, three fish size classes, three functional types, two habitats, and two prey categories. (A) Size-based feeding interactions. Dashed line denotes feeding preference of <100%. For demersal fish (green), feeding in the pelagic only occurs in regions ≤200 m deep. (B) Life cycle dynamics including growth into a different stage/size class (solid arrows) and reproduction (dotted arrows). Fauna silhouettes courtesy of the Integration and Application Network, University of Maryland Center for Environmental Science (ian.umces.edu/symbols/).
Materials and Methods
The projections integrate three model complexes that span physics, biogeochemistry, lower trophic level production, and fish production. In the following sections, we present an overview of the fish production (FEISTY) model (section “FEISTY: A Global Fisheries Model”), details on the Earth system model (ESM2M-COBALT) that provides the physics, biogeochemistry, and lower trophic level production (section “Ocean and Biogeochemical Projections”), a description of how parameter uncertainty was incorporated into projections (section “Projection Uncertainty”), and specifications on the simulations that were run and their analysis (section “Simulations and Analyses”).
FEISTY: A Global Fisheries Model
The fish community in FEISTY describes the three main commercially harvested fish functional types. Each type resolves the life cycle from eggs to adults, with growth and reproduction depending on consumed food. The model is based on the physiology of an individual fish of a given size: its prey encounter, ingestion, and assimilation, its metabolic costs, and its allocation of net energy between somatic growth and reproduction. The scaling from individuals to the fish community is done by respecting mass balance. A detailed description of the fish model is given in Petrik et al. (2019).
The three functional types are forage fish, large pelagic fish, and (large) demersal fish. Each functional type is defined by its maximum body size (medium for forage fish; large for large pelagics and demersals), its habitat, and its prey preference. Within each group the size structure is represented by 2–3 life stages from 1 mg to 0.25 kg (all types) and to 125 kg (only large pelagics and demersals) (Table 1). The prey preference changes with body size. Fish eat prey that is smaller than themselves, either zooplankton, other fish, or benthos, and that live in the same habitat (Figure 1A). The habitat is either benthic or pelagic and changes with ontogeny. All larvae (fish in the first size group) are pelagic. Forage fish and large pelagics are also pelagic in the one or two next size groups. Demersal fish transition to benthic feeding in the medium (juvenile) size group. The adults are fully benthic in areas where the water column is >200 m, while in shallower areas they may feed in both the benthic and pelagic zones. This difference in habitat means that the forage and large pelagic fishes feed only on the pelagic energy pathway, while the demersal fish act as generalists that also feed on benthos. Benthic invertebrates are modeled separately from the fish functional types. They are represented by a biomass pool with no explicit size that is governed by additions via the detrital flux to the seafloor multiplied by a transfer efficiency and losses to predation by demersal fish.
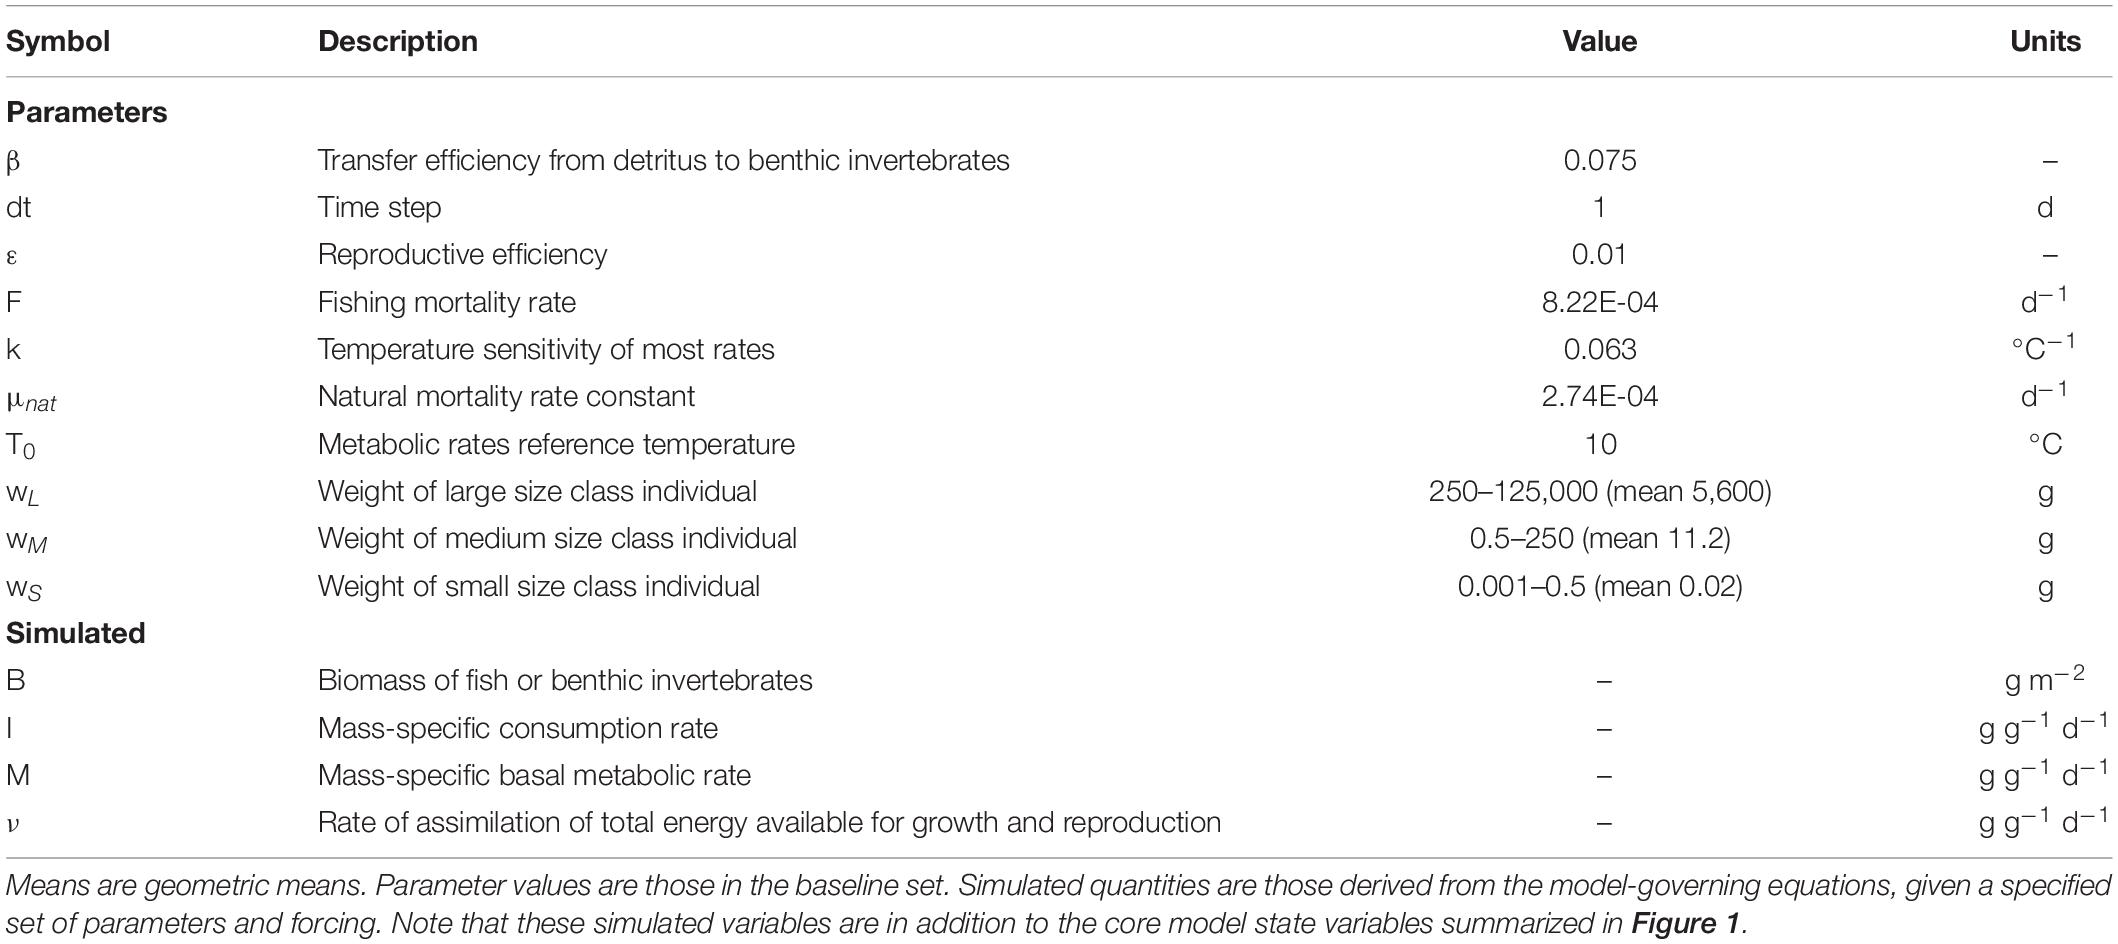
Table 1. Model parameters and simulated variables referenced in the main text (see Table 2 and Petrik et al., 2019 for full list).
The energy budget of an individual fish is described through ingestion with a Type II functional response. There is a constant fraction lost in the assimilation process and another loss to metabolism. The rate of biomass-specific available energy assimilation is:
where Mi (d–1) is the metabolic rate of size group i, a is the assimilation efficiency, and I (d–1) is the ingestion rate. The available energy is used for somatic growth and reproduction, with reproduction only by the last size class (Figure 1B). Metabolism and all components of ingestion (encounter rate and maximum consumption rate) scale with body size via empirically determined allometric relationships of the form:
where k governs temperature sensitivity by comparing habitat temperature, T, to the reference, T0, w is weight, b is the size scaling exponent, and a is a constant factor. The exponential increase with temperature is akin to other forms such as the Arrhenius equation, based on Boltzmann activation energy, or the Q10 function, representing the rate of change with an increase of 10°C. Similar temperature- and mass-dependent functions are broadly applied in fisheries and marine ecosystem models (e.g., Tittensor et al., 2018), and sensitivity of trophic amplification and functional type-specific responses to these scalings will be a key facet of the analyses herein (see section “Projection Uncertainty”). Natural mortality, which represents mortality from sources other than piscivory, is independent of size and temperature and set at the constant value of 0.1 y–1 for all fish.
Scaling from the available energy to the group level is done as a size structured model (Andersen et al., 2016) based on a simple numerical scheme that reduces each size group to an ordinary differential equation coupled to the other size groups (De Roos et al., 2008). In this way the entire fish community is represented by 2+3+3 = 8 ordinary differential equations. Each spatial grid cell is comprised of this set of 8 equations and is independent of its neighbors. At this time there is no movement of the fishes or invertebrates, though the ESM inputs used to drive the model (see section “Ocean and Biogeochemical Projections”) reflect the effects of temporally varying horizontal and vertical velocities. The model is advanced in time with a forward-Euler scheme integrated with a daily time step, which is stable at these temporal and spatial scales (Watson et al., 2015; Petrik et al., 2019).
The structure of FEISTY shares many characteristics with other size-based fish community models (Maury, 2010; Blanchard et al., 2011; Jennings and Collingridge, 2015; Carozza et al., 2016; Andersen, 2019): it is based upon predation fueling growth and reproduction while inflicting mortality on the prey. The model differs from others in three ways. For one, production of new offspring directly relies on energy available for reproduction without any other density dependent effects or carrying capacity. Further, it represents the difference between pelagic and benthic energy pathways (as in Blanchard et al., 2011) by representing pelagic and demersal fish functional groups. Finally, FEISTY is mass-balanced with respect to its coupling with zooplankton and benthic resources. By using the zooplankton mortality rates from the ESM to limit the ingestion of zooplankton, fishes never consume more than what is lost to upper trophic levels in the independent ESM (see section “Ocean and Biogeochemical Projections”).
Ocean and Biogeochemical Projections
As described above, FEISTY requires estimates of mesozooplankton biomass, mesozooplankton production, the flux of organic matter to the benthos, and depth-resolved temperature. For this analysis, we used outputs from GFDL’s ESM2M (Dunne et al., 2012, 2013) integrated with the Carbon, Ocean Biogeochemistry, and Lower Trophics (COBALT) ecosystem model (Stock et al., 2014b). This coupled climate-atmosphere-ocean model includes the CM2.1 climate model (Delworth et al., 2006), the AM2 atmospheric model (Anderson et al., 2004; Lin, 2004), and the MOM4p1 ocean model (Griffies, 2009). The horizontal resolution in the ocean submodel is 1° that decreases down to 1/3° at the equator and is tripolar in the Arctic above 65°N (Griffies et al., 2005), while the atmospheric submodel is 2° × 2.5°. There are 50 vertical layers in the ocean, with 10 m vertical resolution over the top 200 m. The minimum depth is 40 m, which treats all locations <40 m as if they are 40 m deep.
COBALT resolves cycles of carbon, nitrogen, phosphate, silicate, iron, calcium carbonate, oxygen, and lithogenic material at the global scale using 33 state variables (Stock et al., 2014b). The planktonic food web within COBALT is better-resolved than most global ESMs (Laufkötter et al., 2015; Séférian et al., 2020) and includes interactions between bacteria, small and large phytoplankton, diazotrophs, and small, medium, and large zooplankton. Trophic interactions are rooted in allometric and bioenergetic relationships and use mean predator to prey size ratios (Hansen et al., 1994). The model was parameterized to be quantitatively accordant with observed large-scale planktonic food web dynamics, including primary production, zooplankton production, and export fluxes (Stock et al., 2014b). Detritus is produced via phytoplankton aggregation and zooplankton egestion, with a larger fraction of egested material contributing to the sinking flux for larger organisms. The near surface e-folding depth for the remineralization of sinking material is consistent with Martin et al. (1987), with biogenic and lithogenic minerals inhibiting remineralization for an increasing “protected fraction” as particles sink (Armstrong et al., 2002; Klaas and Archer, 2002; Dunne et al., 2005).
A primary shortcoming of ESM2M-COBALT, and other global climate models and ESMs (Stock et al., 2011), is its coarse ocean resolution. This degrades the capacity of general circulation models to simulate coastal regions (e.g., Liu et al., 2019). We addressed this in the initial FEISTY development by using a simulation from a prototype high-resolution ESM (GFDL-ESM2.6; Stock et al., 2017), which featured 10 km ocean resolution. The computational costs of such models, however, prevents the hundreds to thousands of years required for a full climate change projection, forcing global fisheries projections to rely on the large-scale patterns revealed by global general circulation models (e.g., Lotze et al., 2019). However, we found that the FEISTY simulation characteristics were similar at coarse and high-resolution, and the model’s capacity to capture observed catch patterns across functional types lessened only slightly (Supplementary Appendix A1).
We recognize that there are differences between ESMs in the projected changes in the plankton ecosystem properties required to drive fisheries projections with FEISTY (Bopp et al., 2013; Frölicher et al., 2016). We chose to focus our uncertainty analysis on the relatively unexplored spread in projections related to uncertainty in allometric relationships defining the environmental dependence of the fisheries relationships (see section “Projection Uncertainty”), leaving exploration of uncertainty routed in different ESMs and climate scenarios to other work (Lotze et al., 2019). Projected changes in plankton productivity in ESM2M-COBALT are described in detail in Stock et al. (2014a). Projected global NPP changes of –3.6% by the latter half of the twenty-first century are consistent with declines projected in the majority of global ESMs and near the mid-point of the simulated range (Bopp et al., 2013; Laufkötter et al., 2015; Kwiatkowski et al., 2020). ESM2M-COBALT’s simulated amplification of projected changes for mesozooplankton (–7.9%) rests on first-order trophodynamic principles, and has now been shown to be a robust feature across ESMs (Kwiatkowski et al., 2019).
ESM2M-COBALT is linked to FEISTY by an “offline” coupling with no feedbacks of the fish on the plankton dynamics, but in a way that ensures fish do not have more food available than is produced. As described in Stock et al. (2014b), higher predation losses are imposed on medium and large zooplankton in COBALT. Feeding rates are determined by extrapolating the relationship of Hansen et al. (1997) and assuming that the biomass of unresolved predators scales in proportion to the biomass of prey (e.g., Steele and Henderson, 1992). This approach results in simulated mesozooplankton biomass and productivity that are consistent with observations, with just over half of mesozooplankton production (∼1 Pg C yr–1) being routed to higher trophic levels (Stock et al., 2014b). This rate of biomass loss by higher predators sets an upper bound on ingestion of zooplankton by fish in FEISTY. Specifically, FEISTY is forced by the COBALT outputs: medium and large zooplankton biomass integrated over the top 100 m (biomass m–2), the rate of biomass loss by higher predators of medium and large zooplankton integrated over the top 100 m (biomass m–2 s–1), the flux of detrital matter to the ocean floor (biomass m–2 s–1), the mean temperature in the upper 100 m, and the bottom temperature. All biomasses and fluxes from COBALT were converted from moles of nitrogen (molN) to grams wet weight (gWW) assuming Redfield (1934) stoichiometry and the wet weight to carbon ratio (9:1) of Pauly and Christensen (1995). Henceforth, all biomasses are expressed as wet weight (i.e., g signifies gWW). A daily time-step was used for FEISTY, with plankton and ocean forcing interpolated from monthly values.
Projection Uncertainty
A previous parameter perturbation analysis of FEISTY exposed multiple ways of regulating the relative abundance of different functional types and their latitudinal distribution (Petrik et al., 2019). In order to encompass the sensitivity and uncertainty of these parameter choices into projections of fish biomass, we constructed an ensemble of simulations with multiple parameter sets that maintained (1) low squared deviation from/high correlation with estimated fish catch by functional type and (2) coexistence between forage fish and large pelagic fish in high productivity areas. The second condition was imposed to prevent globally skillful ensemble members that nonetheless produced highly unrealistic results in a small number of regions. This was enforced by increasing the weight (i.e., the misfit penalty) associated with forage fish in upwelling systems.
For catch comparisons, we used a global catch reconstruction that includes estimates of industrial fisheries, small-scale fisheries, and discards from the Sea Around Us (SAU) project (Pauly and Zeller, 2015; v43). We compared SAU catches to those simulated by the model under contemporary ocean conditions at the spatial level of large marine ecosystems (LMEs). Model simulations were evaluated with the Akaike Information Criterion (AIC) and model misfits from SAU catches were calculated by functional type by LME for the 45 LMEs that have not been identified as low-catch and/or low-effort regions (c.f., Stock et al., 2017). As a baseline, we considered simulations generated with the parameter values described in Petrik et al. (2019), which we will refer to as our “baseline parameter values.” These values produced moderate matches with total, large pelagic, and demersal catches, including reproduction of observed spatial variations in fish catch spanning two orders of magnitude across LMEs (Petrik et al., 2019). A similar methodology for selecting ensemble members that combines comparison to SAU catch peaks at the LME level with other ecologically meaningful constraints has also been used by Carozza et al. (2017).
We restricted the search of parameter space to the 5 most influential parameters, defined by the total magnitude of the combined five indicator metrics (Supplementary Table A2-1) of Petrik et al. (2019). The most critical parameters were the assimilation efficiency and the coefficients controlling the ingestion and respiration allometry (α, bM, bE, aM, aE). We added the temperature scaling of metabolism (kM) to this parameter set due to its potential importance in a warming ocean. We tested all permutations of high, mid, and low values of literature ranges for each variable (Table 2), yielding 729 potential combinations. From this set, we considered 43 parameter sets (Supplementary Table A2-2) with AIC values equal to or better than our baseline parameter values (Petrik et al., 2019) and that also satisfied co-existence conditions (see Supplementary Appendix A2). We did not apply any further weighting to the ensemble members based on AIC differences (e.g., Burnham and Anderson, 2002), as the intent here was to elucidate the basic characteristics of the parameter sensitivity characteristics and the magnitude of the uncertainty generated by this under-explored aspect of model uncertainty.
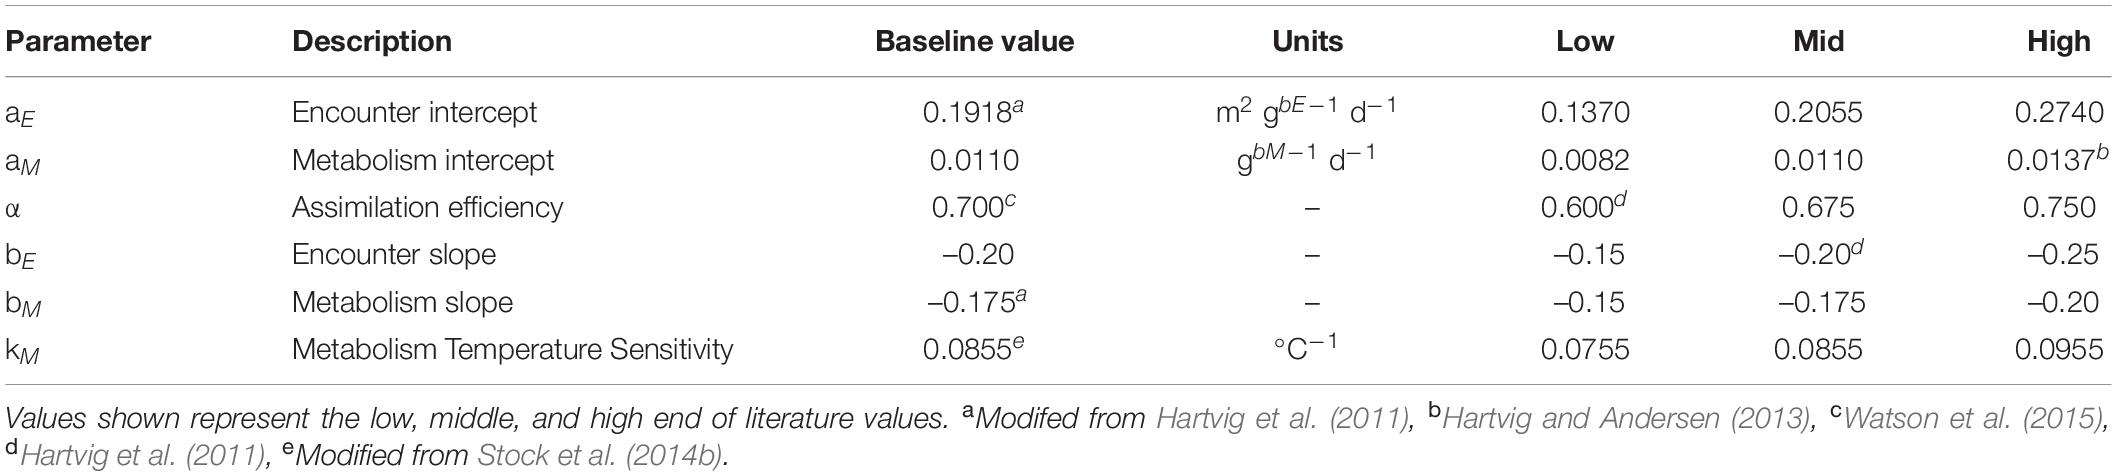
Table 2. Parameters varied in ensemble simulations from their baseline value used in the baseline set.
The temperature dependence of respiration rates exceeded that of the ingestion rates in the baseline parameter set, which was replicated in the above ensemble. While this is justified by several lines of evidence (Perrin, 1995; Rall et al., 2012; Carozza et al., 2017), there is also support for similar scalings (Brown et al., 2004). Thus, to further examine the role of the temperature dependence in the simulation results, we generated a separate set of parameters where all rates used the same value (see Appendix A2). The same permutations of the five most critical parameters were combined with the temperature sensitivities of physiological rates k = kM = 0.0630, 0.0793, and 0.0955 C–1 (equivalent Q10 = 1.88, 2.21, and 2.60), which are low, mid, and high values bounded by the temperature dependence of ingestion rates in the baseline set and the highest temperature dependence of respiration rate tested. Of this set of 729, 15 were skillful (Supplementary Table A2-3). This parameter set is referred to as the “equal temperature dependence ensemble” to distinguish it from the “varying temperature dependence ensemble” described above.
Simulations and Analyses
FEISTY was run from 1860 to 2100 using offline forcing of the ESM2M-COBALT Historical (1860–2005) and RCP 8.5 Projection (2006–2100) conditions. Simulations with the baseline parameter set were used to illustrate the basic characteristics of the response of fish production, fisheries yield, food web structure, and environmental conditions. Production is the biomass generated via growth and/or reproduction and was quantified as the product of biomass, B (g m–2), and the biomass-specific assimilation rate of energy available for growth and reproduction, ν (d–1; Eq. 1). We performed a global area-integration of production (g m–2 d–1) to produce total production in units of mass per time (g d–1 or g y–1). Fishing effort was represented by a fishing mortality rate F (Table 1). In reality, fishing effort varies globally and across the three functional groups. In the absence of a coherent assessment of these differences, both historically and under future scenarios, and to isolate the bottom-up effects of climate change on fish production, we used the same constant fishing mortality on all functional groups. We set F = 0.3 y–1 to roughly correspond with the fishing effort that gives the maximum sustainable yield (Andersen and Beyer, 2015). This leads to a fisheries yield (MT y–1) that is proportional to abundance and a decent estimate of the maximum fisheries production. Analyses of fisheries yield present the total area-integrated biomass harvested in LMEs. Food web structure was quantified as the relative fractions of production of the different fish functional types. Transfer efficiency between different trophic levels of the food web was calculated as in Petrik et al. (2019) by examining the ratio of production of secondary production (medium zooplankton, large zooplankton, benthos) to net primary production (NPP), of the highest trophic level (HTL; pelagics and demersals in the large size class) fish production to secondary production, and of HTL production to NPP. Our results focused on time series from 1951 to 2100. Spatial results present the mean conditions of the last 50 years of the Projection (2051–2100) compared to the 50-year period from the century prior (1951–2000), whereas time series results are changes relative to 1951 conditions. In addition to the analyses performed on the baseline set, the varying temperature dependence ensemble simulations were used to identify the parameter sets that resulted in maximum and minimum changes relative to 1951 in total fish production and for each functional type. These ensemble simulations of the 1+43+15 = 59 total parameter sets provided estimates of minimum and maximum fish production, as well as measures of uncertainty.
Results
Historic Patterns
Historic simulations of ESM2M-COBALT reproduce established large-scale patterns of primary and secondary production, with high net primary production and mesozooplankton production in upwelling regions as well as temperate and subpolar areas, and high seafloor detritus in shallow shelf environments (Figures 2A–C). Global distributions of forage fish and large pelagic fish largely mimic those of primary and mesozooplankton production (Figures 2E,F), whereas demersal distributions (Figure 2G) reflect benthic production (Figure 2D). Primary production rates span <1 order of magnitude (90% range: 1.13–7.85 g m–2 d–1) whereas the rates of mesozooplankton, detritus, and benthos span 1.5–2 orders of magnitude (0.05–1.09; 7.13⋅10–3–4.35⋅10–1; 5.35⋅10–4–3.26⋅10–2 g m–2 d–1). Fish production rates vary over 4 orders of magnitude. The smaller bodied forage fish cover a 90% range of 6.71⋅10–5–1.07⋅10–1 g m–2 d–1. The bottom dwelling demersal fish span a smaller range (9.38⋅10–5–1.59⋅10–2 g m–2 d–1) owing to the lower and more stable temperatures outside of coastal areas. Production of large pelagic fish varies greatly (4.26⋅10–12–4.91⋅10–2 g m–2 d–1), with rates that exceed those of the equally large demersal fish, but also experiencing diminished production in oligotrophic regions. Reductions in absolute production occur moving up trophic levels (Figure 2) as expected from the efficiency of trophic transfers up the food chain.
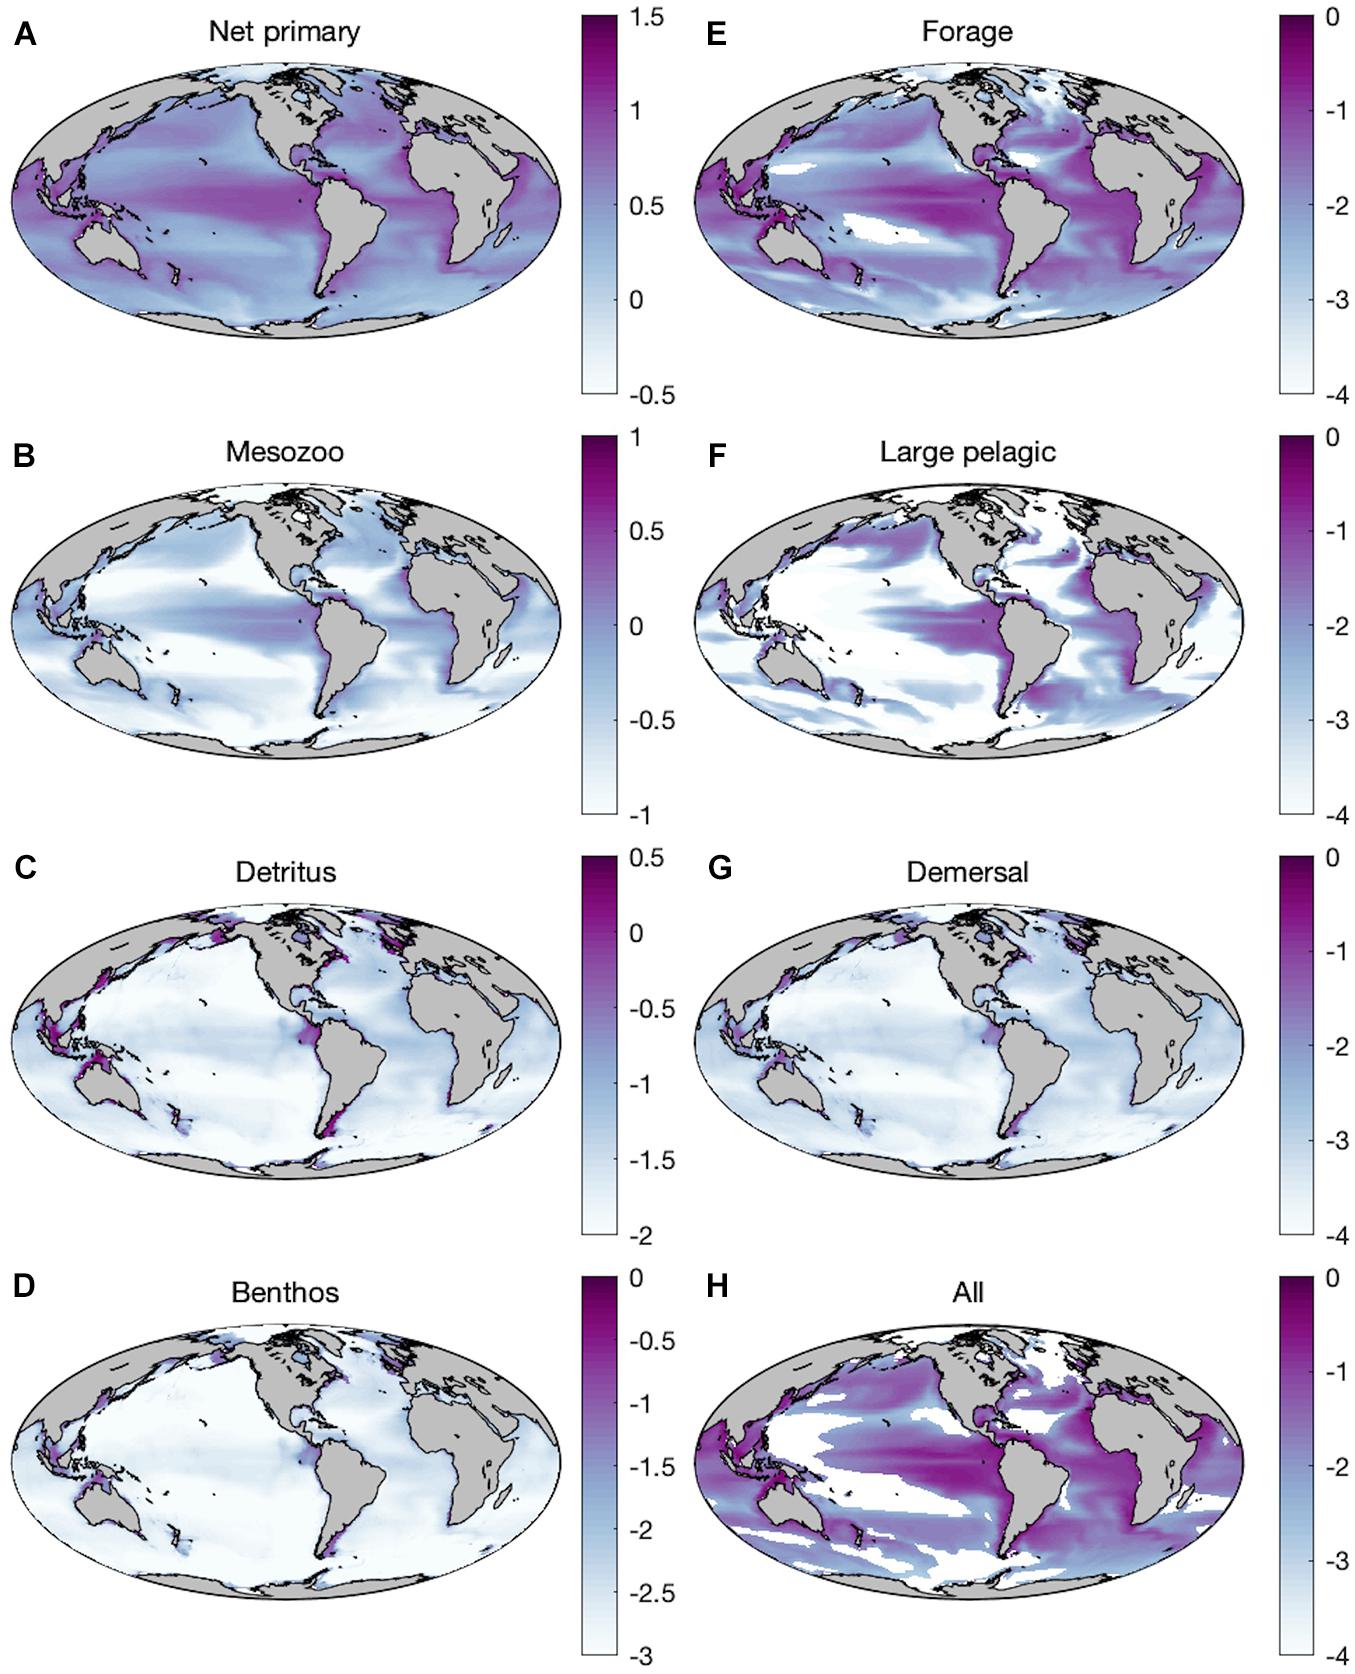
Figure 2. Mean historic (1951–2000) distributions of production (log10 g WW m–2 d–1) of (A) net primary producers, (B) mesozooplankton (medium + large), (C) seafloor detritus, (D) benthic invertebrates, (E) forage fish, (F) large pelagic fish, (G) demersal fish, and (H) all fishes combined with the baseline parameterization.
Trophic Amplification
Changes in production of primary producers, secondary producers, and fish consumers over the last 50 years of the twenty-first century (2051–2100) compared to the last 50 years of the twentieth century exhibit regional variations with decreases in the subtropics and the majority of low-latitude regions (Figure 3). Plankton and forage fish experience increases in production in polar areas, and scattered areas of enhanced productivity elsewhere (Figures 3A,B,E). Plankton productivity trends and forage fish trends are generally well correlated, but there are regions where forage fish production increases despite declining zooplankton production due to changes in predation on forage fish. Forage fish productivity, for example, increases across much of the northern sub-polar Atlantic and Pacific despite mixed trends in NPP and mesozooplankton productivity. The production of large pelagic fish, in contrast, is less well correlated with local plankton productivity changes and exhibits sharp declines in many regions, including across the Arctic (Figure 3F). The correspondence of several areas of sharp large pelagic declines with areas of forage increase (e.g., the sub-polar North Atlantic) is indicative of top-down control on some productivity trends. Conversely, production of seafloor detritus and demersal fish decreases nearly globally, with the exception of the Arctic and sub-Arctic, and two localized spots in southeast Pacific and southeast Atlantic near the Humboldt and Benguela upwelling systems, respectively (Figure 3D,G). Such regional “hot-spots” are often associated with shifts in physical and biogeochemical boundaries, and their locations are generally not robust across ESMs (e.g., Bopp et al., 2013; Laufkötter et al., 2015). Their presence is thus indicative of the potential for limited regional increases, but not strong evidence for increases in the exact locations where they occur.
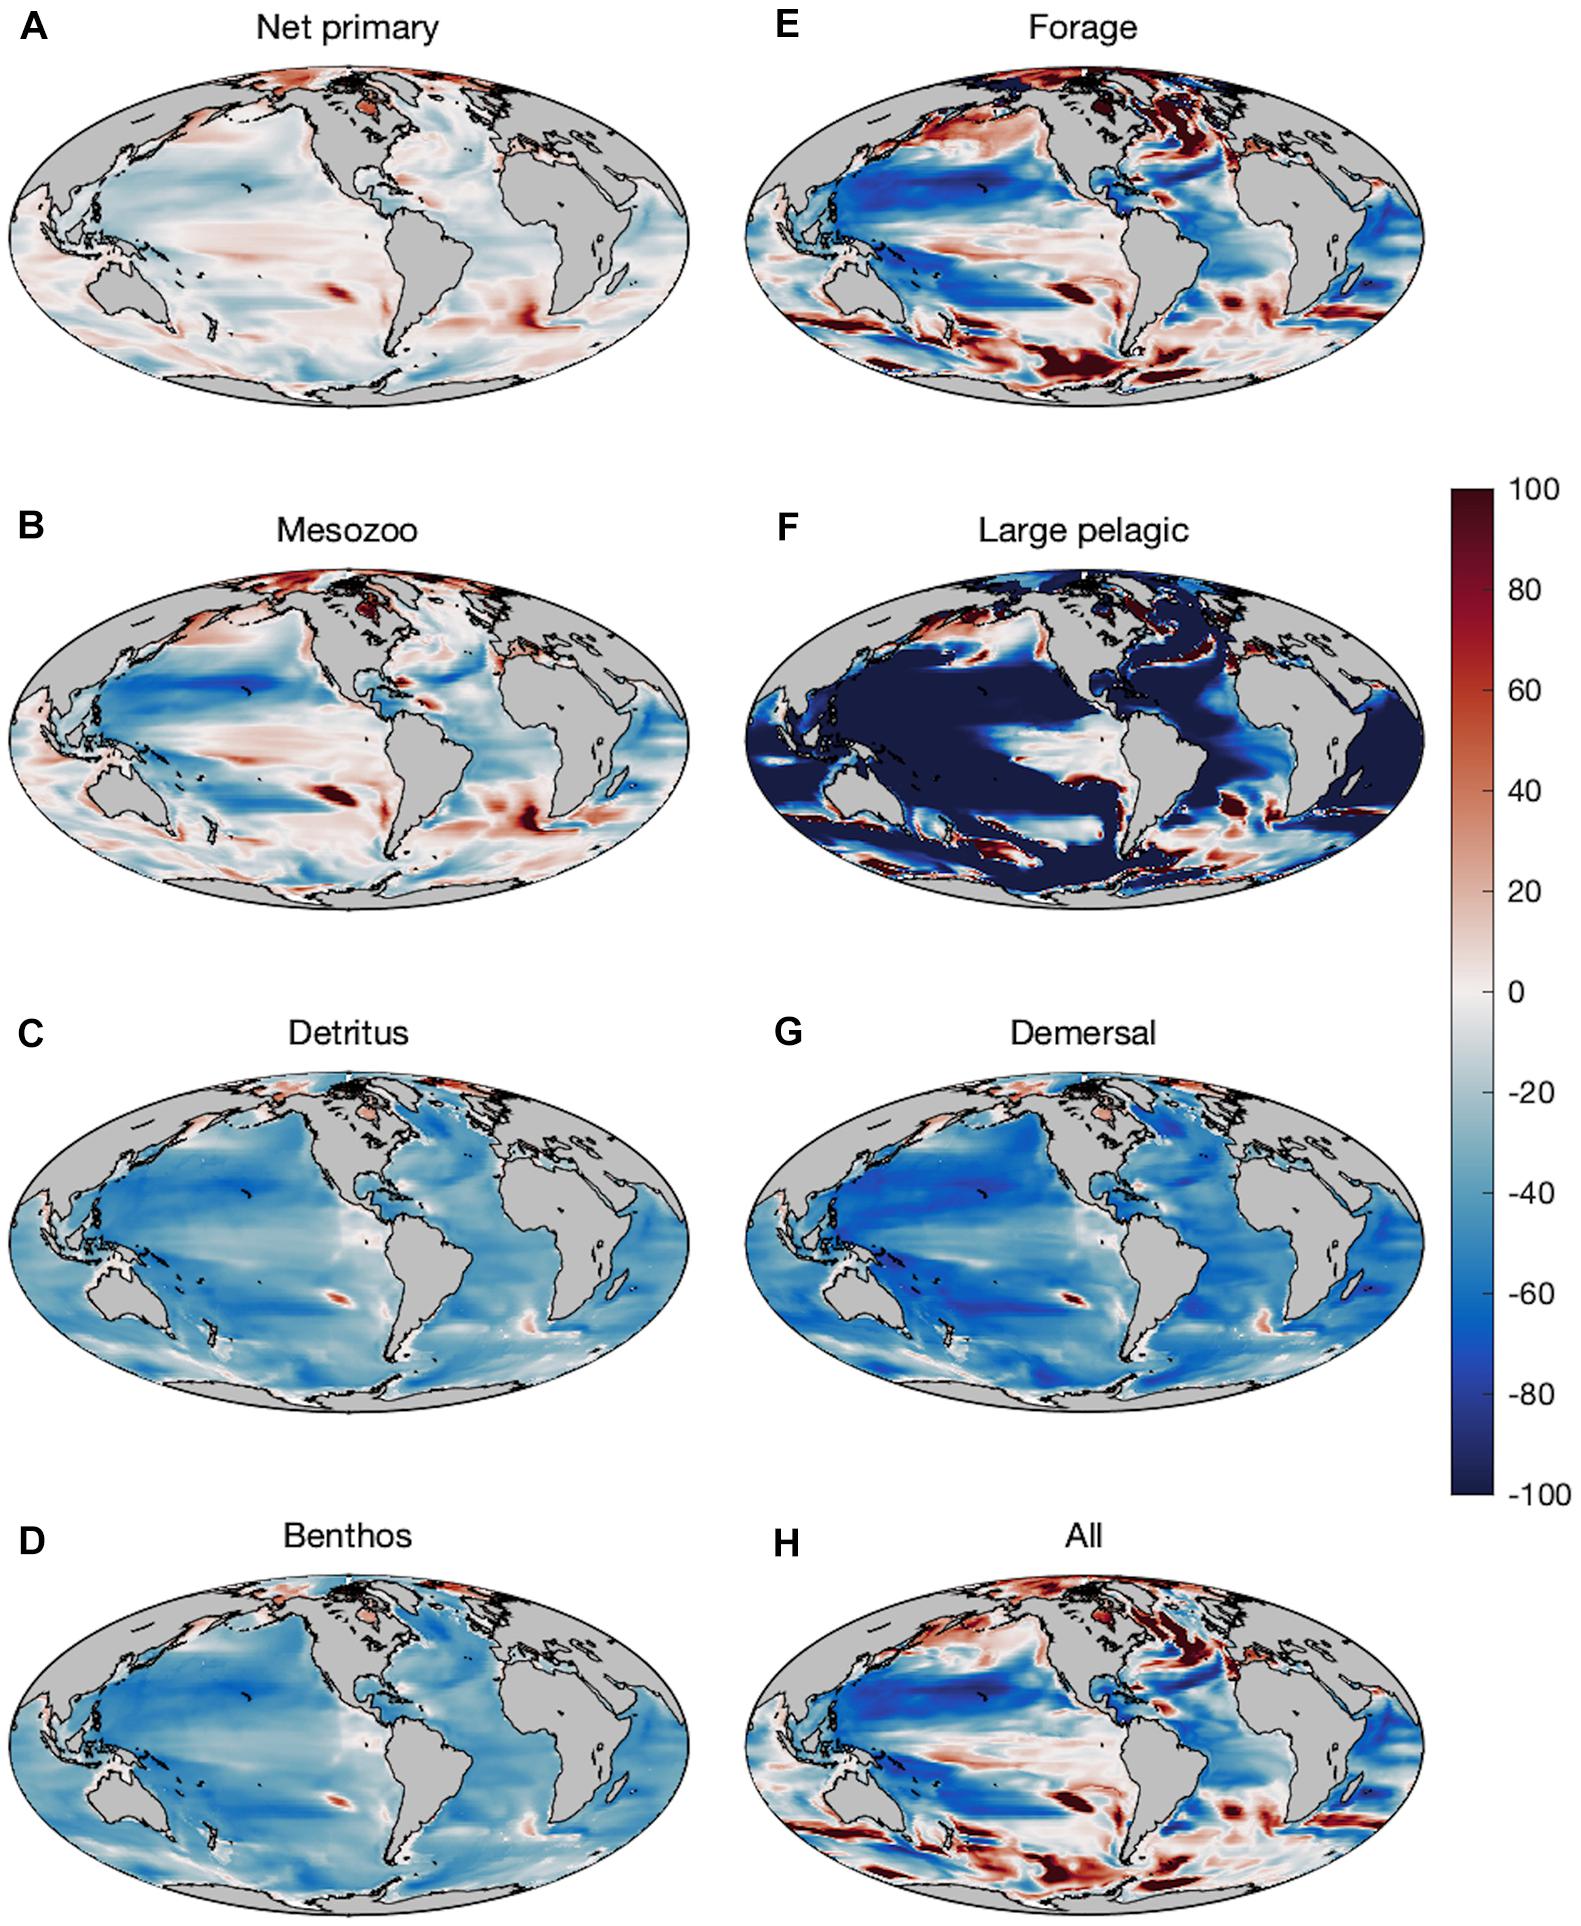
Figure 3. Percent change in production in the Projection (2051–2100) compared to the Historic (1951–2000) time period of (A) net primary producers, (B) mesozooplankton (medium + large), (C) seafloor detritus, (D) benthic invertebrates, (E) forage fish, (F) large pelagic fish, (G) demersal fish, and (H) all fishes combined.
Fractional increases and decreases in production generally become greater for larger organisms higher in the food chain, consistent with “trophic amplification,” in both the pelagic and benthic ecosystems (Figure 3). This is clearly illustrated in the increasing magnitude of global declines of each size class of organisms, with a mean decline of 13.1% (±1.1%) across all medium fishes and a decline of 19.2% (±1.5%) across all large fishes in the varying temperature dependence ensemble (Figure 4A). Both decreases are substantially greater than the primary production (3.6%) and mesozooplankton production (7.2%) declines that underlie them (Figure 4). The magnitude of these changes in fish production are smaller in the equal temperature dependence ensemble, at 9.6% (±1.2%) and 12.1% (±2.1%) for medium and large fish, respectively, but the amplification pattern is consistent (Figure 4B).
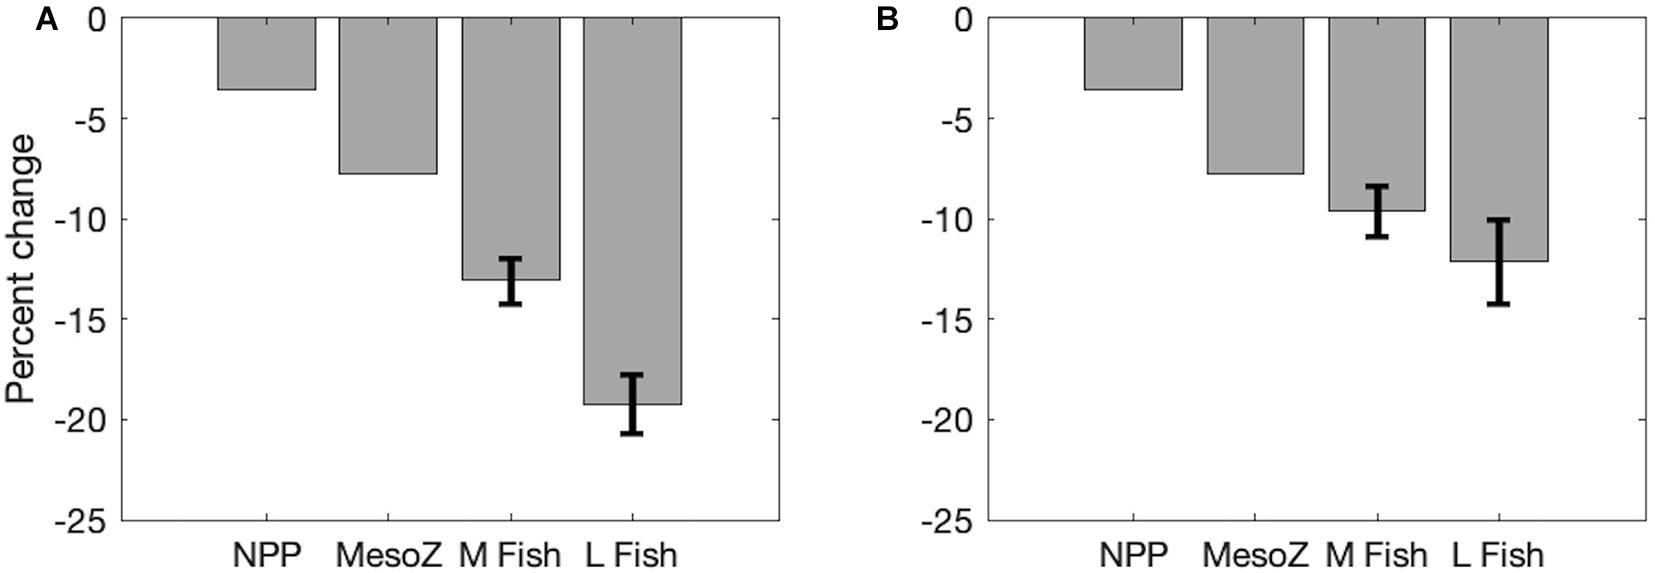
Figure 4. Area-integrated changes in production in the Projection (2051–2100) compared to the Historic (1951–2000) time period illustrating trophic amplification of net primary production (NPP), mesozooplankton (MesoZ = medium + large zooplankton) production, all medium (M) fishes, and all large (L) fishes. Mean (± 1 SD) of (A) varying temperature dependence parameter ensembles and (B) equal temperature dependence parameter ensembles.
Community Reorganization
In addition to changes in the magnitude of plankton productivity available to fish, the end of the twenty-first century also exhibits a near-global increase in the ratio of zooplankton production to seafloor detritus flux (Figure 5A). Increases are especially large in upwelling and temperate/subpolar regions of the North and Equatorial Pacific, the Humboldt Current, south of Greenland, and in the Argentine Basin (Figure 5A). Despite area-integrated declines in both zooplankton production and detritus flux, this ratio increases in future projections due to the greater reductions of detritus over time compared to mesozooplankton (Figure 5B), denoting a “pelagification” of food resources. It is notable that the strong pelagification in deep ocean areas (Figure 5A) often occurs where the flux of material to the benthos is quite low. For example, regions with a change >15 have a mean depth of 4,591 m, historic mean detrital flux of 0.02 g m–2 d–1, and historic mean Zoo:Det ratio of 33.2. However, consideration of the temporally evolving ratio of the globally integrated zooplankton production to the globally integrated benthic flux (which includes outsized contributions from coastal areas) reveals the same pelagification trend (Figure 5B). This pelagification is evidenced in areas shallower than 1,000 m where the mean change in Zoo:Det is 0.13 and the projected mean Zoo:Det is 1.25.
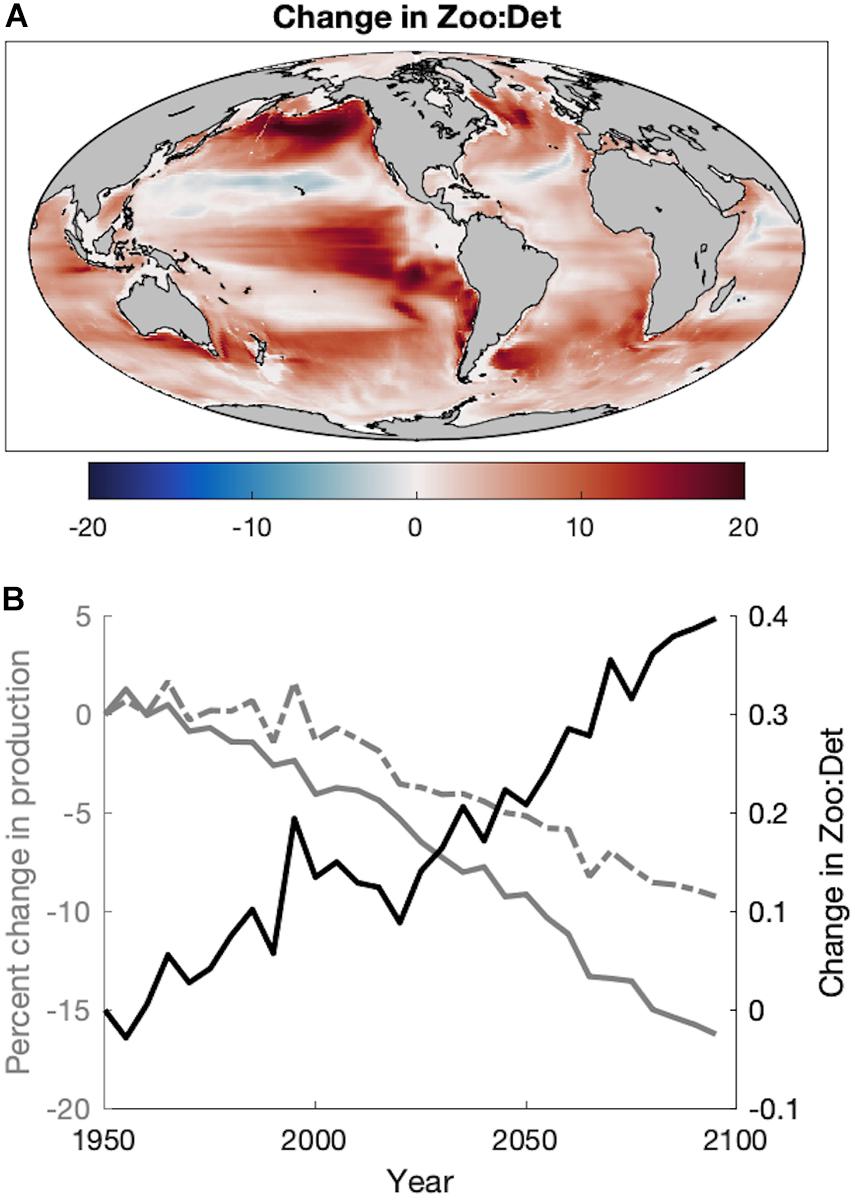
Figure 5. (A) The absolute change in the ratio of zooplankton production to seafloor detrital flux (Zoo:Det) as the difference of the Projection (2051–2100) from the Hindcast (1951–2000). (B) Time series of the percent change in the global area-integrated mean zooplankton production (dashed gray), the percent change in the global area-integrated mean flux of detritus to the seafloor (solid gray), and the absolute change in the ratio of their global area-integrated means (Zoo:Det) during the Historic and Projection time periods relative to 1951.
Though the ratio of zooplankton to detritus production explains a large proportion of the historic spatial variance in the dominance of large pelagic fish compared to demersal fish (van Denderen et al., 2018; Petrik et al., 2019), future changes in the fraction of large pelagic fish do not mirror the regional patterns of the zooplankton:detritus production ratio (Figure 6A). Rather, the fraction of all fishes that is composed of large pelagics decreases out to 2100 despite the pelagification of food resources (Figures 6A,D). Any positive impact of the pelagification of food resources on large pelagics is overwhelmed by the negative impacts of global productivity reductions and warming-driven increased respiratory demands that act to amplify productivity reductions at higher trophic levels. There is, however, a marked shift toward forage fishes (Figures 6B,D) that leads to an overall increase in the fraction of total pelagic fish production (forage + large pelagic) at 2100 (Figure 6D) and large regional increases in the fraction of total pelagic fish in the subpolar and polar oceans (Figure 6C), areas with a historically large fraction of demersal fish.
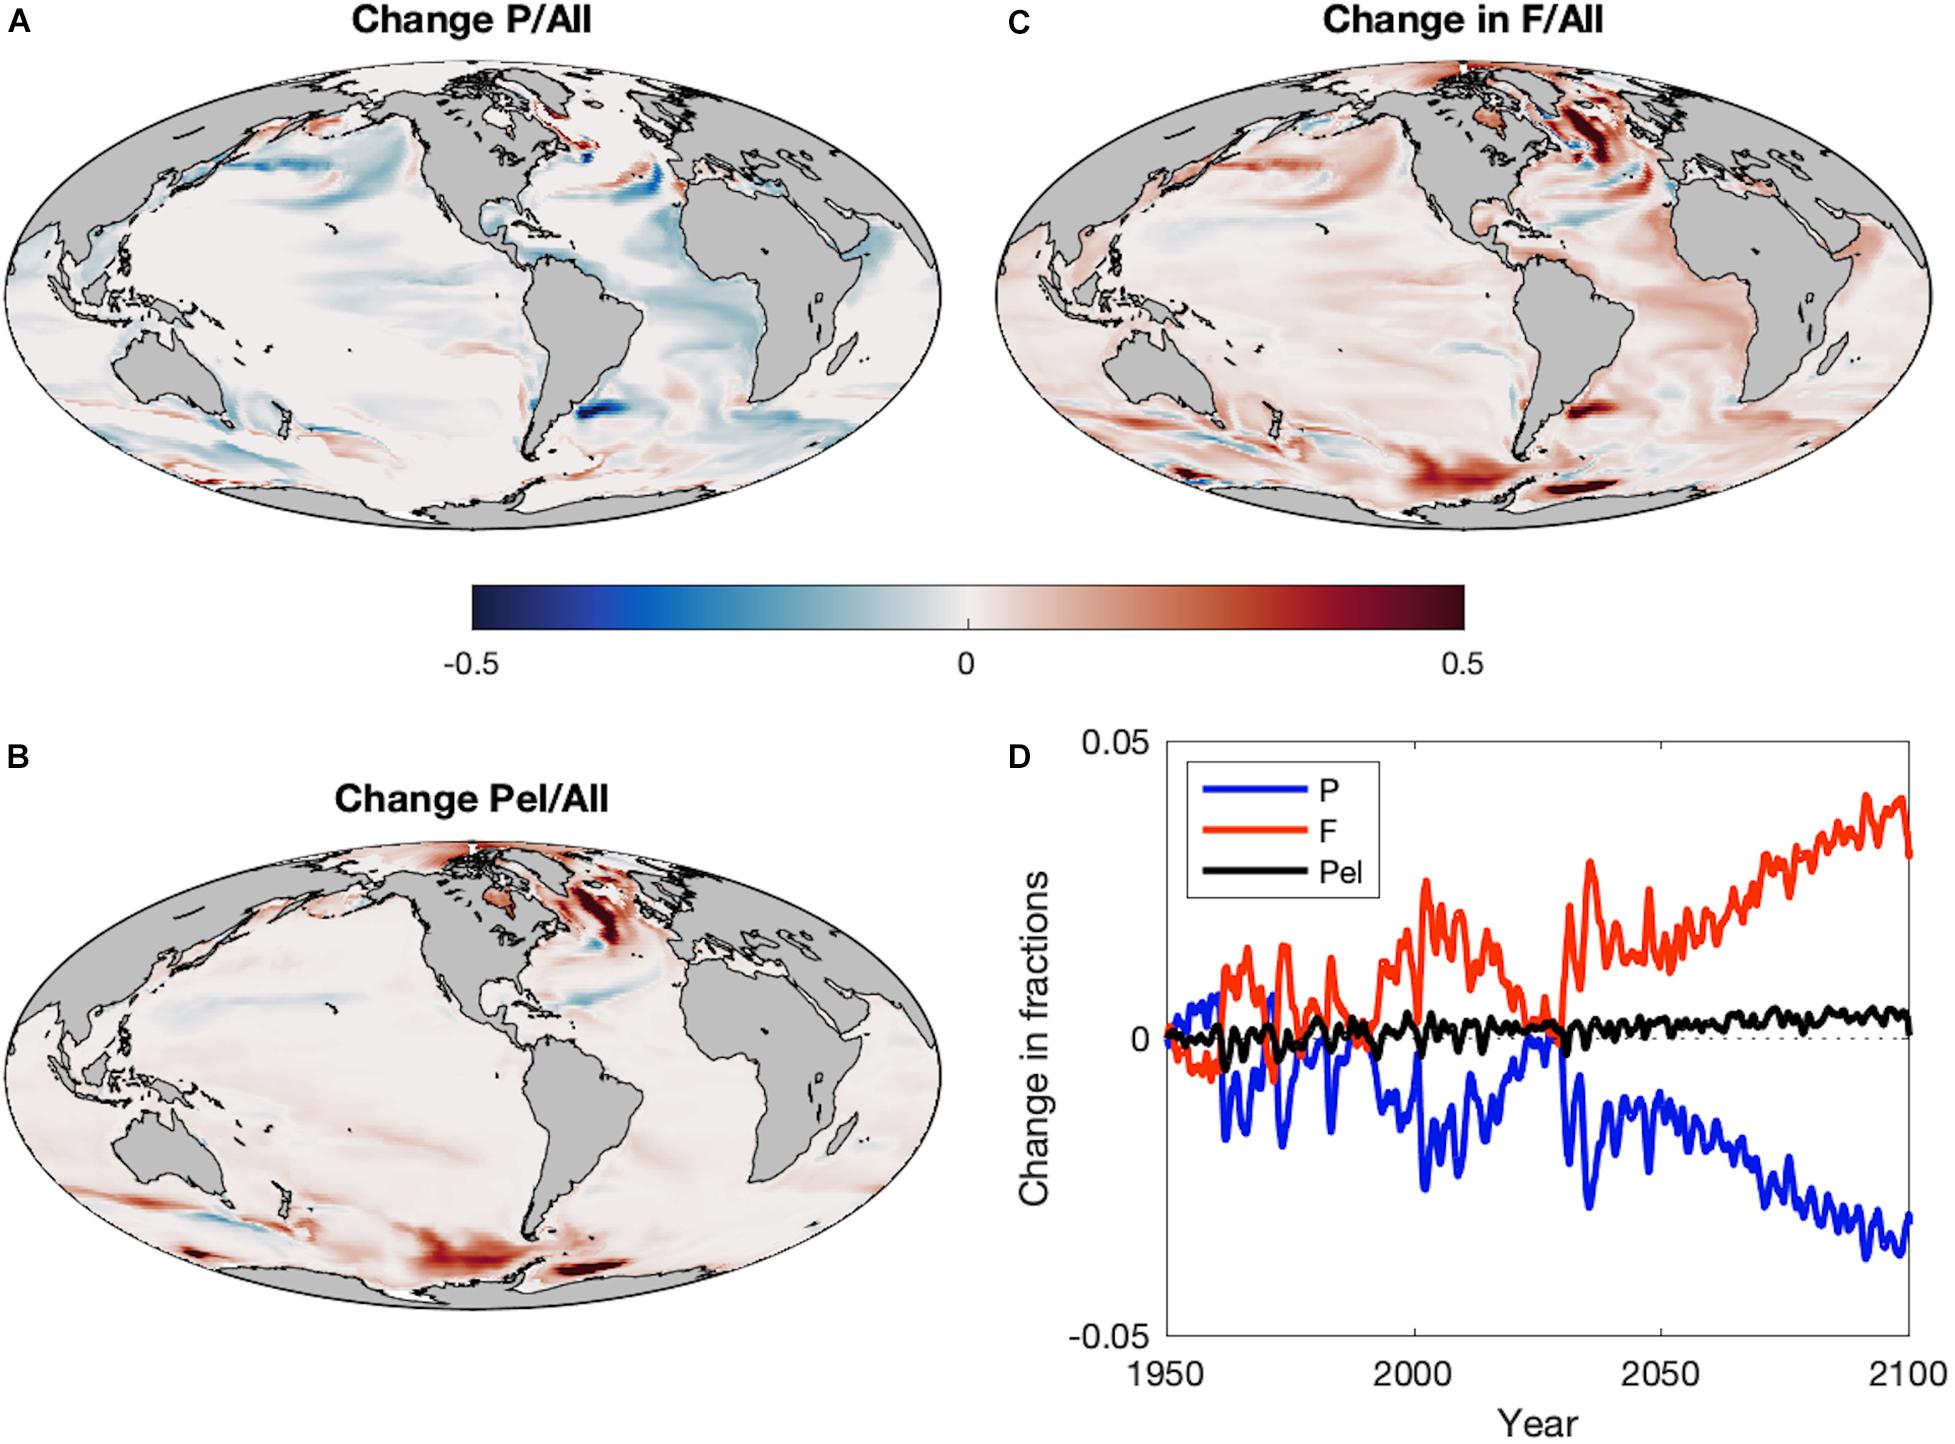
Figure 6. The change in the fractions of (A) large pelagics (P), (B) all pelagics (Pel = F+P), and (C) forage fish (F) out of all fish during Projection (2051–2100) period compared to the Historic (1951–2000) period. (D) Time series of the area-integrated mean fractions of large pelagics (P: blue), all pelagics (Pel = F+P: black), and forage fish (F: red) out of all fishes during the Historic and Projection time periods relative to 1951.
Ensemble Results
The predominant projected changes in the functional types were robust to parameter uncertainty (Figure 7). When globally averaged, forage fish production decreased the least with the least variation (Table 3 and Figure 7A). Demersal fish had intermediate levels of production decline and uncertainty, while large pelagic fish had the greatest mean change and variance (Table 3 and Figure 7A). Simulated fisheries yield, calculated as a fraction of stock of biomass rather than production, exhibited slightly different patterns (Figure 7B). The yield of forage fish experienced the smallest changes with a moderate degree of uncertainty (Table 3 and Figure 7B). On average, demersal fish suffered greater losses than the forage fish, though the uncertainty bounds of the ensemble simulations (±1 SD) overlapped (Table 3 and Figure 7B). Similar to percent changes in production, yield of large pelagic fish fell by the greatest extent with the largest degree of uncertainty out of all functional types (Table 3 and Figure 7B). Despite the high uncertainty in projected changes in large pelagic production and fishing yield, declines exceeded those of the other functional types after 2070 at the latest (Figure 7). The degree of uncertainty in both production and fishing yield of each functional type increased over time in ensemble simulations (Figure 7). Changes to production and yield in projections under equal temperature dependence were qualitatively similar (Supplementary Table A2-4 and Supplementary Figure A2-1).
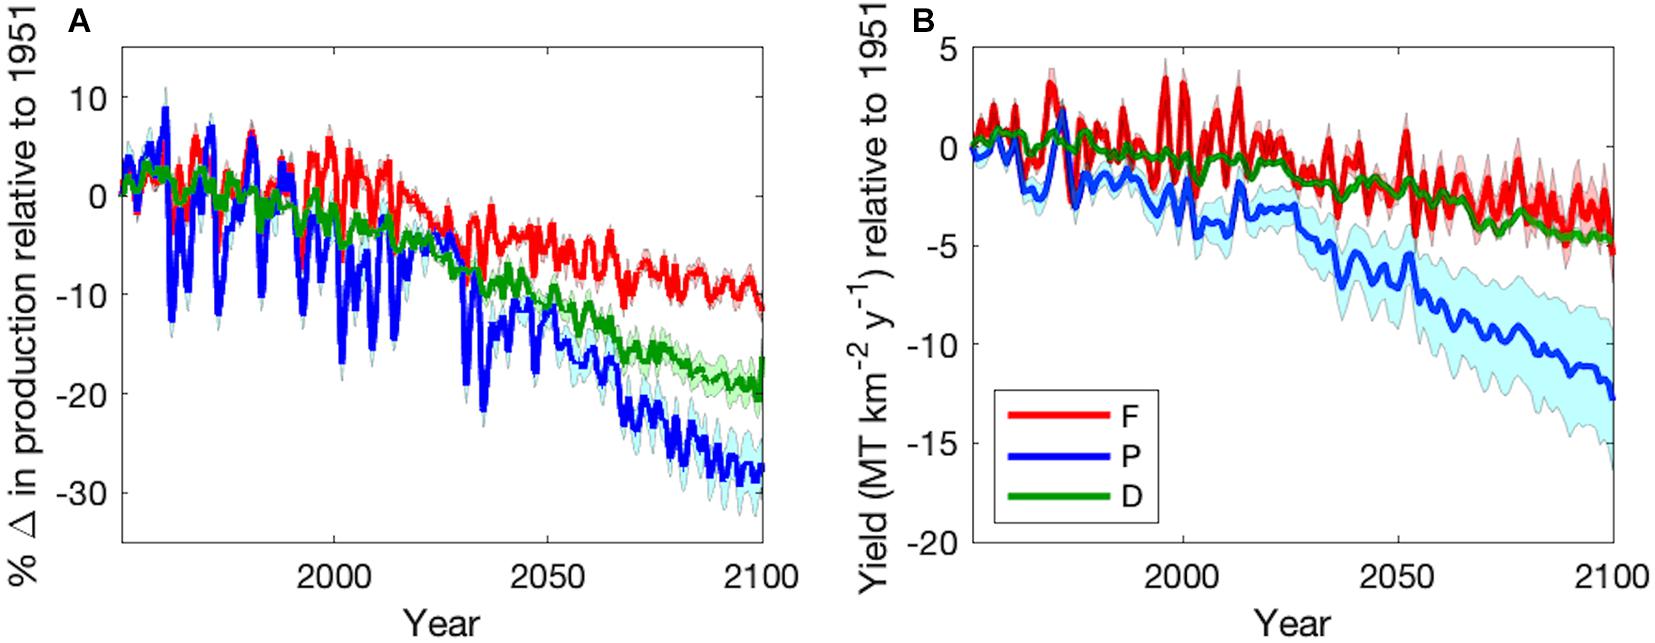
Figure 7. Time series of varying temperature dependence ensemble mean (±1 SD) (A) percent change in production relative to 1951 and (B) total change in fishing yield (MT km–2 y–1) relative to 1951 of forage fish (red), large pelagic fish (blue), and demersal fish (green) during the Historic (1951–2000) and Projection (2051–2100) time periods. Monthly values in (A) were smoothed with a 12-month moving mean. Yield in (B) reflects harvest of adults only.
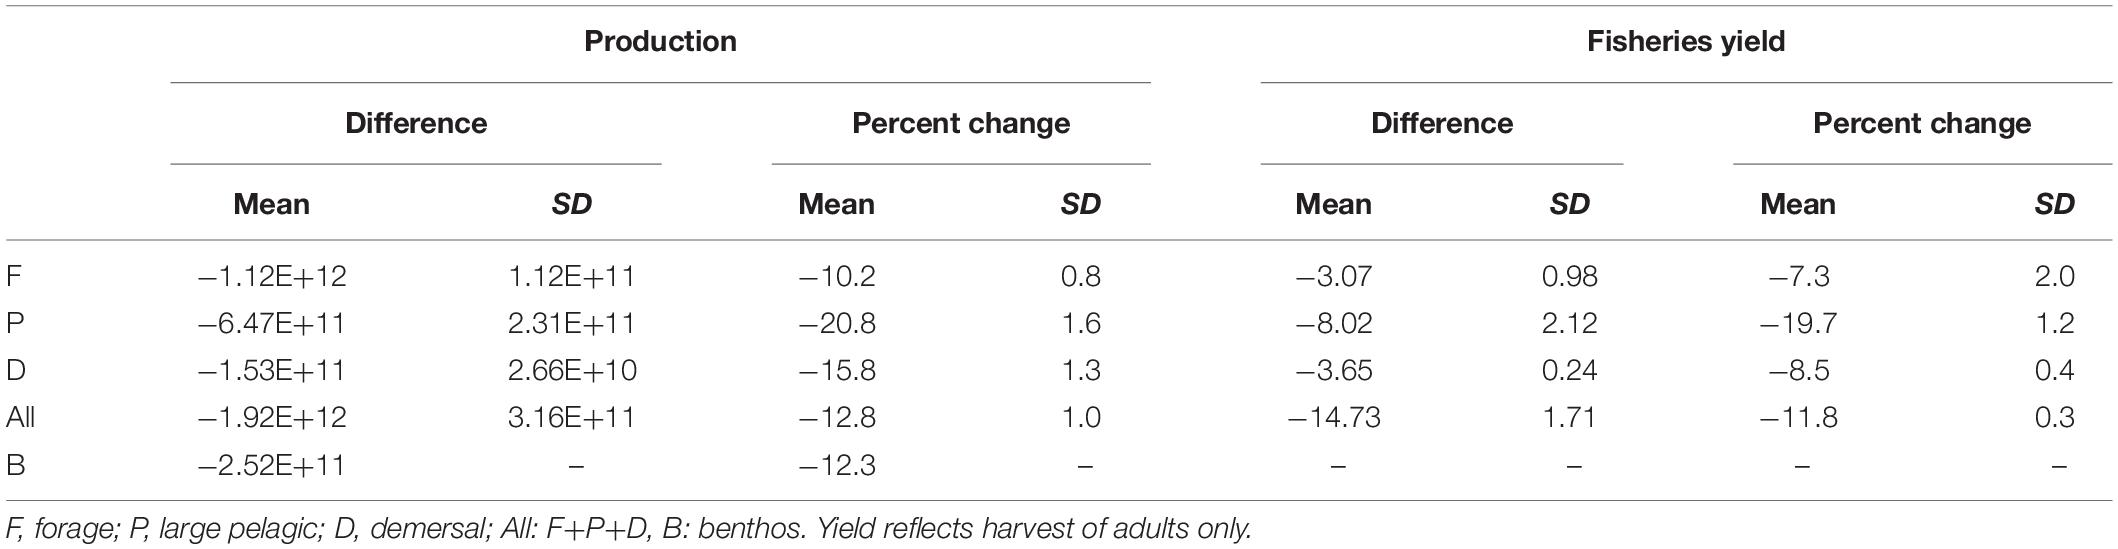
Table 3. The difference and percent change in production (g y–1) and fisheries yield (MT y–1) of the 2051–2100 mean from the 1951–2000 mean of each functional type and all fishes combined across the 44 member varying temperature dependence parameter ensemble.
Of the parameter sets that produced viable solutions, those producing the largest declines for the total fish productivity and the productivity of each functional type all featured the highest temperature dependence of metabolic costs (Table 4 and Supplementary Table A2-5). Similarly, the most resilient projections for all fish, large pelagic fish, and demersal fish all featured the lowest temperature dependence of metabolic costs (Table 4 and Supplementary Table A2-5). Other aspects of the response differed by functional type and highlight competitive and/or predatory interactions. For example, the least perturbed forage fish projection valued steep allometric penalties on the encounter rate and a large temperature dependence for the metabolic rate. Both of these characteristics are associated with the steepest declines in large pelagic fish, suggesting decreased top-down control is an essential element for the resilience of forage fish in these simulations. In contrast, the least impaired large pelagic and demersal fish projections value weak allometric penalties on the encounter rate. Surprisingly, resilient large pelagic and demersal projections also feature low assimilation efficiency and, in the case of demersals, low overall encounter rates. These seemingly counter-intuitive results emphasize the importance of interactions with forage fish: parameter combinations that hinder forage fish more than demersals and large pelagics lead to less vulnerable projections for these larger functional types. Resilient projections for large pelagic and demersal also both favored small allometric penalties and the most unchanged patterns for forage fish favored large ones in the equal temperature dependence ensemble (Supplementary Table A2-5).
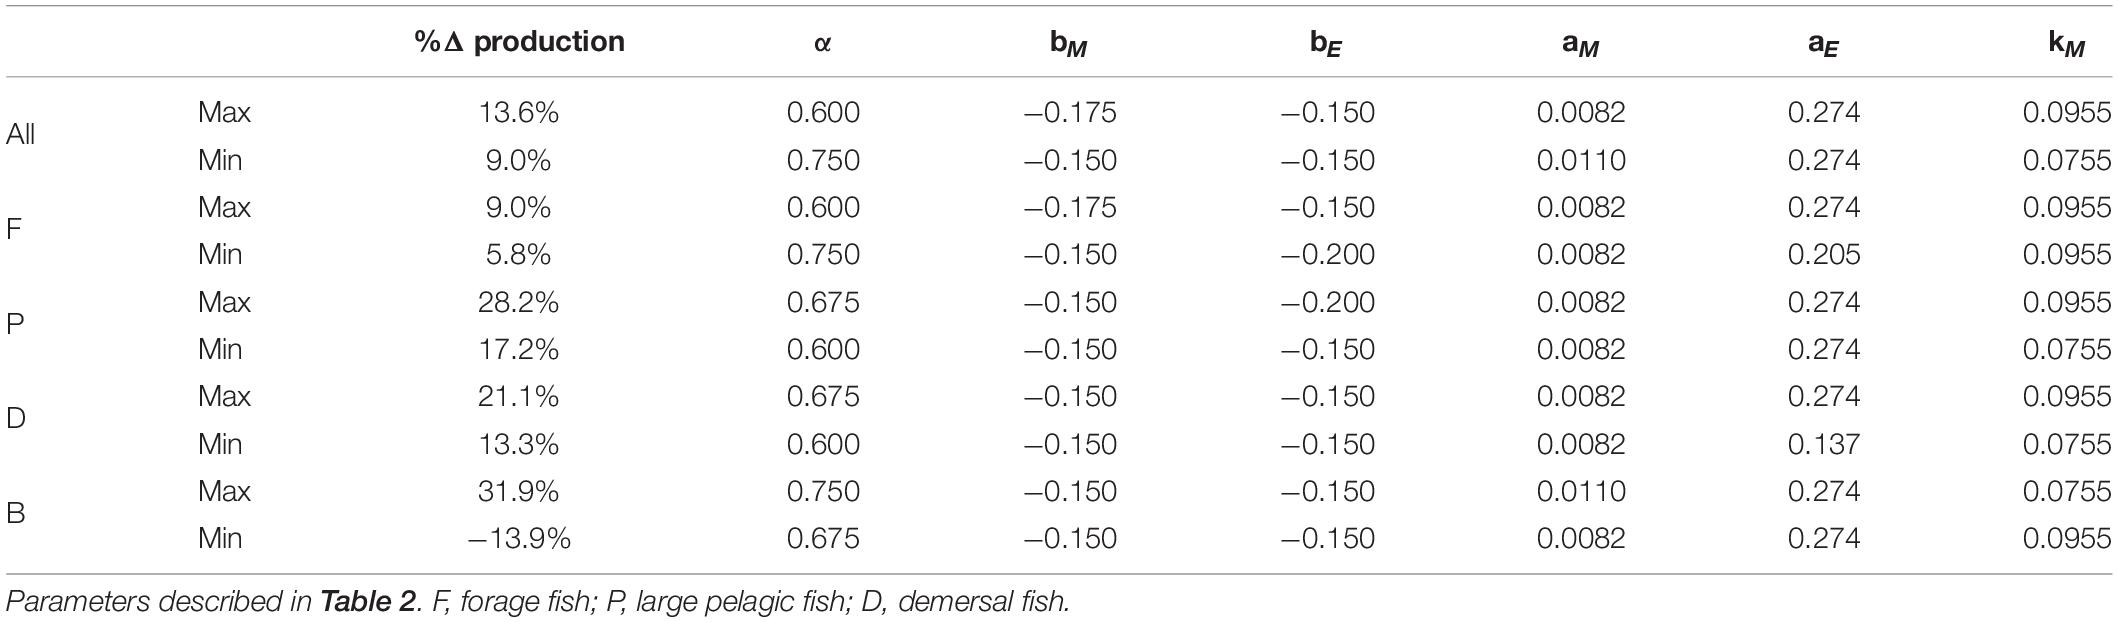
Table 4. Parameter sets in the varying temperature dependence ensemble that resulted in maximum and minimum percent changes in production relative to 1951 of each functional type and all fishes combined.
Discussion
Our work contributes to a growing set of projected changes in global fish production and biomass distribution under climate change. Our results move beyond species-based and size-based models by examining climate change effects on the food web structure of global marine ecosystems, the fish functional types composing them, and the sensitivity of responses to uncertainties in critical allometric and temperature scalings broadly applied in fish and fisheries modeling. Additionally, many other fish models use net primary production (NPP) from ocean biogeochemistry models and earth system models (ESMs) as the input at the base of the food chain. Unfortunately, NPP estimates are highly variable across ESMs (Bopp et al., 2013), thereby introducing uncertainty in the fish projections based on which ESM was used as forcing. A significant fraction of this uncertainty, however, is linked to differences in the response of recycled production within plankton food webs (e.g., Taucher and Oschlies, 2011). These fluxes are not available to fish. Following Dugdale and Goering (1967), the NPP available to higher trophic levels is more accurately assessed by NPP supported by the supply of “new” nutrients to the euphotic zone. Over time, this supply of new nutrients must be balanced by export from the euphotic zone. There is greater agreement on export production trends across ESMs (Bopp et al., 2013; Fu et al., 2016), reducing uncertainty relative to projections based on NPP alone. In the present study, this reduction in uncertainty was achieved through explicit representation of the plankton food web processes that determine recycled and new production and subsequent pathways of energy flow between phytoplankton and fish (Ryther, 1969; Friedland et al., 2012; Stock et al., 2017). While far from perfect, the underlying plankton food web dynamics simulation used in this study accurately captures observed variations in mesozooplankton biomass and productivity and export fluxes across ocean biomes (Stock and Dunne, 2010; Stock et al., 2014b). Thus, by using zooplankton and seafloor detritus as resources rather than deriving secondary production from NPP, FEISTY may be considered a more robust indicator of future changes in the dynamics between pelagic and demersal components of food webs.
Trophic Amplification
When grouped by trophic level, the amplification of projected productivity declines from primary producers to fishes is apparent in the results of FEISTY, despite differences in feeding preferences and habitats of the three functional types. Projections of primary and secondary production across ESMs have previously been examined in the literature. The ESM2M-COBALT decline in NPP of 3.6% is moderate with respect to other CMIP5 ESMs (Bopp et al., 2013), while the approximate doubling of production changes from net primary producers to mesozooplankton from 3.6 to 7.9% using ESM2M-COBALT (Stock et al., 2014a) is similar to the doubling of biomass changes that occur in the IPSL ESM (Chust et al., 2014) and ensembles of 12 CMIP5 ESMs (Kwiatkowski et al., 2019). That is, there is “negative amplification” as defined by Kwiatkowski et al. (2019).
Earth system model intercomparison of the flux of detritus to the seafloor has not been assessed, though export production out of the euphotic zone has. Studies have found differing ranges of decrease that span 1–18% based on the ESMs used in the comparison (Bopp et al., 2013; Fu et al., 2016; Laufkötter et al., 2016). The 12.3% drop in seafloor detritus flux in ESM2M-COBALT simulations comparing 2051–2100 to 1951–2000 is in the center of 7–18% range in export flux of Fu et al. (2016) who compared 2091–2100 to 1991–2000. Variations across ESMs are due to the number of size classes of phytoplankton and differences in aggregation and sinking formulations (Fu et al., 2016; Laufkötter et al., 2016). Larger projected declines in export from the euphotic zone relative to projected primary productivity declines within it is consistent with a shift toward smaller plankton sizes as stratification increases. This shift leads to more effective recycling and, as deep winter mixing is reduced, more efficient coupling between phytoplankton and grazers (Behrenfeld and Boss, 2014; Stock et al., 2014a). Reductions in export at the base of the euphotic zone can be further amplified by increased remineralization in warming waters at depth (Marsay et al., 2015; Laufkötter et al., 2017) or decreased ballast minerals due to acidification (e.g., Gehlen et al., 2007; Gangstø et al., 2008).
Though processes governing benthic biomass in FEISTY are less detailed than those that dictate fish biomass, projected changes in biomass are consistent with past results. Jones et al. (2014) used the empirical relationship of Wei et al. (2010) between benthic biomass and carbon export to estimate changes in benthic biomass from carbon flux to 500 m above seafloor derived from 8 CMIP5 ESMs. They found a global decrease of 5.2%, which was an attenuation of the 11.4% average drop in seafloor carbon flux. Conversely, Yool et al. (2017) achieved an amplified decline of 17.6% using a size-based model of benthic invertebrates forced by the coupled ocean-biogeochemistry model NEMO-MEDUSA under RCP 8.5, which displayed 3.9% decreases in seafloor carbon flux. The FEISTY decrease estimates of 9.0 ± 4.6% fell within the low end of these values and exhibited analogous patterns of spatial change to both models (Supplementary Figure S1A). Similar to the results of Jones et al. (2014), simulated benthic biomass did not amplify the changes in seafloor detrital flux. The effect of the decline in detrital flux on benthic biomass was counteracted by increases in the benthic biomass as a result of release from top-down predation mortality by the large demersal fish. Combined with the results of Jones et al. (2014), the FEISTY simulations suggest that considerations of size and respiration, as in Yool et al. (2017), are necessary to produce trophic amplification in benthic organisms.
Unsurprisingly, increases in metabolic demands with size and temperature are drivers of modeled trophic amplifications up through fishes. Firstly, increases in temperature lead to greater basal metabolic demands, which are more difficult to meet given decreases in net primary production. This mechanism contributes the greatest amount to trophic amplification from phytoplankton to zooplankton in ESM2M-COBALT (Stock et al., 2014a). Secondly, marine predator-prey relationships tend to be size-structured, whereby decreases in plankton size lead to longer food chains with more transfers between trophic levels (c.f., Ryther, 1969). For instance, in a food chain consisting of diatoms, copepods, and forage fish, the forage fish at trophic level (TL) 3 would receive a fraction of NPP equal to TE2, where TE (transfer efficiency) is the fraction of production that is transferred between trophic levels and the exponent is determined by the number of transfers (TL-1). If the primary production shifted to smaller phytoplankton (but did not change in amount) such that the phytoplankton had to be consumed by microzooplankton before it could be eaten by copepods, the forage fish would move to TL4 and would only receive NPP⋅TE3. Though trophic levels are semi-fixed in FEISTY, change in trophic level is another mechanism responsible for trophic amplification in ESM2M-COBALT, though of lesser importance than metabolism (Stock et al., 2014a). Finally, decreases in transfer efficiency with climate change have been revealed in mesocosm studies (Ullah et al., 2018) and both empirical (Moore et al., 2018) and mechanistic (du Pontavice et al., 2020) models forced by ESMs. Thusly, fish would likely receive a reduced fraction of NPP with increasing temperature without any underlying changes to NPP or TL. Similar reductions in TE are demonstrated with climate change projections of FEISTY (Supplementary Figure A2-3). With varying temperature dependence, decreases in transfers between consumers (TL2 to TL4) are greater than the decline from primary to secondary producers (TL1 to TL2; Supplementary Figure A2-3). Since fish production is controlled by the balance of metabolic needs with assimilated energy from ingestion, which are functions of size, temperature, and prey abundance, it was the greater temperature-dependence of the metabolic rate compared to feeding rates that caused the strong decrease in high trophic level TE. The decline in high trophic level TE was similar to that of low trophic levels under equal temperature-dependence (Supplementary Figure A2-3), suggesting that there are other mechanisms involved in TE declines.
Trophic amplification of fish production in FEISTY was consistent with multi-model ensembles of 5 global fisheries and marine ecosystem models forced by 2 ESMs (GFDL-ESM2M and IPSL-CM5A-LR) that spanned –5 to –28% under RCP 8.5 when all groups of consumers at trophic levels higher than zooplankton were combined (Lotze et al., 2019). The spatial distribution of percent biomass change of all fishes (Supplementary Figure S1F) agreed well with the multi-model mean of Lotze et al. (2019), displaying increases in polar regions and declines in subtropical and temperate areas. The only area of disagreement was in the central North Atlantic, a region of higher inter-model variability and lower model agreement (Lotze et al., 2019), where FEISTY projected increases in fish biomass while the multi-model mean projected decreases.
Community Reorganization
Projections of lower trophic levels and fishes show a “pelagification” of marine food webs. The ratio of zooplankton production to the seafloor detritus flux increased in nearly all marine ecosystems. When averaged globally, both types of secondary production decreased in the future, but seafloor detritus experienced greater reductions. At a regional level, increases in this ratio were the result of either (I) an increase in zooplankton production and decrease in seafloor detritus flux, (II) an increase in zooplankton production greater than the increase in seafloor detritus flux, or (III) a decrease in zooplankton production less than the decrease in seafloor detritus flux. Type I was responsible for the increased ratio in the central Arctic, Northwest Pacific, upwelling areas, the eastern Caribbean, and the Southern Ocean. Unequal increases were the least common and accounted for the increased ratio in the coastal Arctic and two localized spots southwest of the Humboldt and Benguela upwelling regions. On the other hand, the strong increases in the zooplankton to detritus production ratio south of Greenland and in the Argentine Basin were on account of unequal decreases in production, which was the most prevalent cause of an increase in the ratio.
Despite a large proportion of the spatial variance in historic observed and simulated catches of large pelagic fish compared to demersal fish being explained by the ratio of zooplankton to detritus production (van Denderen et al., 2018; Petrik et al., 2019), it was the fraction of forage fish (Figures 6C,D), rather than the fraction of large pelagic fish, that best mimicked the projected regional patterns of alteration in the zooplankton:detritus production ratio (Figure 5). The degree of change in the fraction of forage fish did not necessarily match that of the zooplankton:detritus ratio, but the directions of change did. In general, the projected variations in demersal fish biomass reflected the modifications in the seafloor detrital flux, whereas the relative fraction of demersal fish was approximately the inverse of the relative fraction of forage fishes. This could be of particular concern in coastal regions of temperate and subpolar oceans that have historically hosted large populations of demersal fishes that support valuable fisheries. Recent observations of these demersal fisheries have detected poleward shifts (Fossheim et al., 2015), which also arose in model results via increases in biomass in polar regions and declines in temperate and subpolar areas (Supplementary Figure S1E). Demersal fish biomass increased in most coastal regions of the Arctic, but decreased in the central Arctic. The areas with reduced demersal biomass experienced a concomitant increase in all pelagic fishes, mostly forage fish, with the exception of the Faroe Plateau where all fishes suffered losses. Though not directly comparable, simulations of the size-based model of Blanchard et al. (2012) at 2050 under the SREASA1B scenario displayed decreases in benthic biomass in nearly all 28 non-arctic Large Marine Ecosystems studied and increases in pelagic biomass in several northern ecosystems. The Blanchard et al. (2012) model does not include the interactions between pelagic and demersal fish, so the similarity of the results to FEISTY indicates that the major pattern of pelagification is driven by the changes in primary and secondary production.
While copious research suggest that large-scale patterns in fish biomass and catch reflect patterns in ocean productivity (i.e., bottom-up drivers; Ryther, 1969; Friedland et al., 2012; Stock et al., 2017), “trophic cascades” associated with strong fishing pressure have also been observed (e.g., Pauly et al., 1998). In some cases, evidence suggests that these cascades have extended to plankton communities (e.g., Frank et al., 2005). While our simulations did not consider sharp increases in fishing pressure implicated in such cascades, pronounced shifts in forage fish dominance could produce similar effects on plankton communities. Resolving such feedbacks, however, would require a “two-way” coupling between fish and plankton models (e.g., Maury, 2010; Kearney et al., 2012) that was beyond the scope of this work. This should be addressed in future efforts, though we note that doing so will make parameter uncertainty investigations far more difficult. A further complication is to represent climate change-driven shifts in geographical range (Pinsky et al., 2013). It is not clear, though, whether geographical range expansions (or contractions) on the level of functional group requires a specific description of migration (see section “Assumptions and Limitations”) or whether just representing demographical change, as in the current model, is sufficient. In this respect a particular focus should be the large pelagic fish whose migrations span oceanic basins and have a considerable predation impact during feeding migrations (Watson et al., 2015; Mariani et al., 2017). Increased understanding of fisheries responses to climate change will thus ultimately need combinations of sensitivity studies in the one-way coupled context (such as those presented herein) and targeted two-way coupled experiments to explore trophic cascades and assess the higher predation closures used by biogeochemical models.
Ensemble Results
The ensemble of diverse parameter sets was used to quantify uncertainty and understand the sensitivity of the physiological dimensions underlying the model structure. Parameter sets varied in terms of assimilation efficiency, weight-dependence of prey encounter rates, and temperature and weight dependence of metabolic rates. These are comparable to the parameters governing trophic scaling, growth rates, and mortality rates of Carozza et al. (2017), who also identified their importance in generating parameter ensembles that simulated fish biomasses and catches in accordance with ecological constraints and observed catches. Though it was too computationally expensive to search the full parameter space, over 700 parameter sets were explored, resulting in the 59 sets used in this analysis. As expected, parameter sets with the highest temperature sensitivity of metabolism resulted in the greatest percent reductions in production of all fish functional types and all fishes combined. However, this pattern was not seen in the equal temperature dependence ensemble. Resilient projections of large pelagic and demersal production favored small allometric penalties (e.g., metabolism that declines more rapidly with size than prey encounter, bM < bE) while those for forage fish production favored large penalties on size in both ensembles. The differential responses of the functional types emphasize the importance of their competitive and predatory interactions in addition to their life history traits. To some extent, the emergent combinations of parameters represent the physiological constraints on simulating contemporary fish catches and producing coexistence between forage fish and large pelagic fish in high productivity regions. It is likely that a very limited area of parameter space meets these conditions and that this hinders identification of clear relationships between parameter combinations and the magnitude of projected changes.
Regardless, parameter sets produced variability between end members and ensemble projections yielded robust results of the response of fish productivity under climate change. The forage fish experienced lesser declines in production compared to the other, larger functional types. Large pelagic fish suffered the greatest reductions in both production and fisheries yield, and with the highest degree of uncertainty. Even when factoring in parameter uncertainty, these changes were substantially larger than those of forage and demersal fish when the temperature dependence of metabolism exceeded that of ingestion rates. With rates of equal temperature dependence, all results were qualitatively similar, with the exception of the mean percent change in large pelagic fish production being comparable to that of demersal fish. The difference between simulations with varying vs. equal temperature dependence is effectively demonstrated by a simpler analysis of the fish community with a 0-dimensional model of FEISTY. With equal temperature dependence of respiration, encounter, and maximum consumption rates, warming above the reference temperature of 10°C leads to a drop in large pelagic biomass, even with high prey resources (Supplementary Figures A2-4A,B). This illustrates that the baseline parameters related to the size dependence of rates disadvantage the large fish, as was necessary to achieve coexistence between large pelagic fish and forage fish (Petrik et al., 2019). When metabolic rates are more sensitive to temperature, large fish are doubly hit by their maximum size and warming, resulting in larger biomass declines and a greater minimum level of prey production needed to support large pelagic fish (Supplementary Figures A2-4C,D). A similar shrinking under warming was seen in simulations of fish communities when metabolism was more sensitive to temperature than assimilated ingestion (Guiet et al., 2016).
Our lack of knowledge on the temperature dependence of these physiological rates does not compromise the qualitative predictions. Though our simulations are able to robustly predict the directionality of change in production, they are poor at estimating the magnitude, which is driven by some largely unknown set of temperature-scaling parameters. The strong temperature dependence of metabolic rates is well-known (e.g., von Bertalanffy, 1960). In contrast, the temperature dependence of encounter and consumption rates are less certain, though both theoretical (Rall et al., 2012) and empirical (Perrin, 1995) studies suggest that they are lower than basal metabolism. Unequal temperature sensitivity of metabolism and other rates is adopted by some global fish models (e.g., Cheung et al., 2010; Jennings and Collingridge, 2015; Guiet et al., 2016; Carozza et al., 2017), but not all, thereby making it one of many factors contributing to inter-model variability. The ensemble results of FEISTY reveal the importance of better constraining estimates of the temperature sensitivity of physiological rates, especially for projecting the impacts of climate change on large pelagic fishes. Furthermore, interactions between temperature and oxygen (e.g., Deutsch et al., 2015; Pauly and Cheung, 2018) and ontogenetic variations in thermal tolerance (e.g., Dahlke et al., 2020) advocate the need for thorough examinations of marine ecosystems under a warming climate.
Impacts on Fisheries
To predict the bottom-up effects of climate change on ecosystem productivity, we used a simple representation of fishing (constant in space and time) that captured the main basin-scale patterns under contemporary conditions. Thus, results of simulated fisheries yield reflect the isolated bottom-up effects of environmental change on fish communities rather than the effects of changes in human behavior such as a redistribution of effort in amount, space, time, or toward different functional types. In this case, total fisheries yield declined by 11.8% (±0.3%; Table 3) with decreases of 7.4% (±2.0%) at TL3 and 13.9% (±0.7%) at TL4. These estimates were greater than the 5.7% and 6.8% losses in fisheries yield of TL3 and TL4, respectively, estimated by Moore et al. (2018) who used an empirical model of fish catch as a function of zooplankton biomass from an ESM. Our changes in total fisheries yield are more in line with the “no conservation” fishing scenario of Carozza et al. (2019) who found a 15% (12, 20%) change at 2081–2100 under RCP 8.5 from 1851 to 1900 conditions in the IPSL ESM. The decrease in the yield of large pelagic fish (19.7 ± 1.2%; Table 3) at 2100 with FEISTY was closer to their change of 32% with fishing rates “optimized for human food” (Carozza et al., 2019), and similar to the >20% decline of Moore et al. (2018) that did not occur until 2300. While other marine ecosystem models have employed reconstructions of historical fishing effort, more work is needed on developing scenarios of plausible projections of fishing effort like those of Carozza et al. (2019). As such, the FEISTY levels of uncertainty in fisheries yields should be considered underestimates, as future changes in fishing effort and technology will further increase uncertainty. The FEISTY results highlight the importance of considering the non-uniform effect of climate change on the three different functional types of fish. The projected pelagification of ecosystems will promote some parts of the fisheries sector and weaken others, which could require large structural changes. Though fishers can switch gears and participate in multiple fisheries (e.g., Fuller et al., 2017), and boats can move (e.g., Watson et al., 2018), previously unfished regions will require management plans, while old ones will need to be renegotiated (Pinsky et al., 2018). In addition to affecting fishing communities, the shifts toward pelagic food webs could impact the ecology of populations not represented in the model, such as marine mammals and sea birds.
Assumptions and Limitations
We note that the structure of FEISTY and how it was implemented for this study makes certain assumptions and presents limitations. These include, but are not limited to, simplistic fishing (addressed above), the representation of only three fish functional types, no movement, and environmental forcing. There are numerous factors that may influence the productivity of fish, especially under a changing climate. This analysis focused on the effects of temperature and secondary production, while climate-induced changes to oxygen (e.g., Deutsch et al., 2015), pH (Branch et al., 2013), and nutrient content of prey [such as lipid density (e.g., Heintz et al., 2013; Peterson et al., 2013) or iron content (Galbraith et al., 2019)] should be considered in future studies.
The current COBALT configuration does not include vertical migrations of zooplankton, which results in most of the zooplankton biomass, and thus energy available to fish, being located in the upper 100 m of the water column. As such, we expect that the FEISTY predictions of forage fish biomass incorporates both epi- and mesopelagic fish. How the biomass is distributed between the two groups will depend on the vertical migration behavior of these fish types, their prey, and their predators (Pinti and Visser, 2019). This work is currently under investigation.
Our model makes the case that large pelagics are fundamentally disadvantaged in warm water. This is a result of the high temperature scaling of standard metabolism. However, large pelagics are most commonly observed in warmer tropical regions, which appears at odds with the model. We discussed this issue at length in Petrik et al. (2019). First, large pelagics experience competition from demersal fish, thriving in regions where the demersals do not have support from benthic production (van Denderen et al., 2018), most notably in the low export, oligotrophic tropics. Second, the relationship between growth and temperature is lower for large pelagic fish than for small pelagic fishes (van Denderen et al., 2020), which could arise from metabolic rates that increase with temperature at a rate greater than the feeding rates and supports our parameterization. Third, basin-wide migrations of large pelagics across oligotrophic regions are often in search of favorable larval environments (e.g., Bakun, 2013; Reglero et al., 2014) during which adults feed advantageously at mesoscale features (e.g., Polovina et al., 2001; Nieblas et al., 2014) that are not represented in our global model with a 1° resolution. Horizontal movement has the potential to rectify some of the discrepancy between simulated and observed catches of large pelagic fish, particularly in the western tropics (Watson et al., 2015; Petrik et al., 2019). Our simulations that exclude movement capture the first-order spatio-temporal patterns of energy flow in marine food webs. Future work that incorporates swimming behavior will add value to these initial results, particularly on the stabilizing potential of movement (Murdoch, 1977; Briggs and Hoopes, 2004) that may reduce some of the negative climate change impacts on large pelagic fish. We recognize the many advantages of the FEISTY framework, while its limitations promote the value obtained by using a diversity of model approaches, each with their own strengths and weaknesses, rather than promising one correct single model (Tittensor et al., 2018).
Conclusion
Projections under the business-as-usual carbon emissions scenario (RCP 8.5) of fish functional types with FEISTY resulted in trophic amplification of the decreases in primary and secondary production seen in GFDL-ESM2M-COBALT. The biomass and production of all fish decreased globally, though with differences between functional types. Large pelagic fish suffered the greatest declines but also with the highest degree of projection uncertainty. The reduction in large pelagic fish occurred despite a pelagification of the food webs. Pelagification was a result of unequal decreases in secondary production, leading to increases in the ratio of pelagic zooplankton production to seafloor detritus production, which shifted benthic-based ecosystems historically dominated by demersal fish toward pelagic-based ones dominated by forage fish.
Data Availability Statement
The raw data supporting the conclusions of this article will be made available by the authors, without undue reservation.
Author Contributions
CP and CS developed the initial conceptualization of research and established the manuscript structure and key figures. KA, PD, and JW further refined analyses. CP performed simulations and analyses and wrote the initial draft. All authors contributed to the interpretation of results and editing of the manuscript.
Funding
CP was funded by the Nereus Program. KA and PD were funded by the “Ocean Life” VKR center of excellence supported by the Villum foundation.
Conflict of Interest
The authors declare that the research was conducted in the absence of any commercial or financial relationships that could be construed as a potential conflict of interest.
Acknowledgments
We would like to thank Vicky Lam for the Sea Around Us data, and Hyung-Gyu Lim and Jessica Luo for helpful reviews of earlier drafts. Portions of this research were conducted with the advanced computing resources and consultation provided by Texas A&M High Performance Research Computing.
Supplementary Material
The Supplementary Material for this article can be found online at: https://www.frontiersin.org/articles/10.3389/fmars.2020.588482/full#supplementary-material
References
Andersen, K. H. (2019). Fish Ecology, Evolution, and Exploitation. Princeton: Princeton University Press.
Andersen, K. H., and Beyer, J. E. (2015). Size structure, not metabolic scaling rules, determines fisheries reference points. Fish Fish. 16, 1–22. doi: 10.1111/faf.12042
Andersen, K. H., Jacobsen, N. S., and Farnsworth, K. D. (2016). The theoretical foundations for size spectrum models of fish communities. Can. J. Fish. Aquat. Sci. 73, 575–588. doi: 10.1139/cjfas-2015-0230
Anderson, J. L., Balaji, V., Broccoli, A. J., Cooke, W. F., Delworth, T. L., Dixon, K. W., et al. (2004). The new GFDL global atmosphere and land model AM2-LM2: evaluation with prescribed SST simulations. J. Clim. 17, 4641–4673. doi: 10.1175/jcli-3223.1
Armstrong, R. A., Lee, C., Hedges, J. I., Honjo, S., and Wakeham, S. G. (2002). A new, mechanistic model for organic carbon fluxes in the ocean based on the quantitative association of POC with ballast minerals. Deep Sea Res. II 49, 219–236. doi: 10.1016/s0967-0645(01)00101-1
Audzijonyte, A., Kuparinen, A., Gorton, R., and Fulton, E. A. (2013). Ecological consequences of body size decline in harvested fish species: positive feedback loops in trophic interactions amplify human impact. Biol. Lett. 9:20121103. doi: 10.1098/rsbl.2012.1103
Bakun, A. (2013). Ocean eddies, predator pits and bluefin tuna: implications of an inferred ‘low risk–limited payoff’ reproductive scheme of a (former) archetypical top predator. Fish Fish. 14, 424–438. doi: 10.1111/faf.12002
Behrenfeld, M. J., and Boss, E. S. (2014). Resurrecting the ecological underpinnings of ocean plankton blooms. Annu. Rev. Mar. Sci. 6, 167–208. doi: 10.1146/annurev-marine-052913-021325
Blanchard, J. L., Jennings, S., Holmes, R., Harle, J., Merino, G., Allen, J. I., et al. (2012). Potential consequences of climate change for primary production and fish production in large marine ecosystems. Philos. Trans. R. Soc. B 367, 2979–2989. doi: 10.1098/rstb.2012.0231
Blanchard, J. L., Law, R., Castle, M. D., and Jennings, S. (2011). Coupled energy pathways and the resilience of size-structured food webs. Theor. Ecol. 4, 289–300. doi: 10.1007/s12080-010-0078-9
Bopp, L., Resplandy, L., Orr, J. C., Doney, S. C., Dunne, J. P., Gehlen, M., et al. (2013). Multiple stressors of ocean ecosystems in the 21st century: projections with CMIP5 models. Biogeosciences 10, 6225–6245. doi: 10.5194/bg-10-6225-2013
Branch, T. A., DeJoseph, B. M., Ray, L. J., and Wagner, C. A. (2013). Impacts of ocean acidification on marine seafood. Trends Ecol. Evol. 28, 178–186. doi: 10.1016/j.tree.2012.10.001
Briggs, C. J., and Hoopes, M. F. (2004). Stabilizing effects in spatial parasitoid–host and predator–prey models: a review. Theor. Popul. Biol. 65, 299–315. doi: 10.1016/j.tpb.2003.11.001
Brown, J. H., Gillooly, J. F., Allen, A. P., Savage, V. M., and West, G. B. (2004). Toward a metabolic theory of ecology. Ecology 85, 1771–1789. doi: 10.1890/03-9000
Bryndum-Buchholz, A., Tittensor, D. P., Blanchard, J. L., Cheung, W. W., Coll, M., Galbraith, E. D., et al. (2019). Twenty-first-century climate change impacts on marine animal biomass and ecosystem structure across ocean basins. Glob. Change Biol. 25, 459–472.
Burnham, K. P., and Anderson, D. R. (2002). Model Selection Multimodel Inference A Practical Information-Theoretic Approach, 2nd Edn. New York, NY: Springer.
Carozza, D. A., Bianchi, D., and Galbraith, E. D. (2016). The ecological module of BOATS-1.0: a bioenergetically constrained model of marine upper trophic levels suitable for studies of fisheries and ocean biogeochemistry. Geosci. Model Dev. 9, 1545–1565. doi: 10.5194/gmd-9-1545-2016
Carozza, D. A., Bianchi, D., and Galbraith, E. D. (2017). Formulation, general features and global calibration of a bioenergetically-constrained fishery model. PLoS One 12:e0169763. doi: 10.1371/journal.pone.0169763
Carozza, D. A., Bianchi, D., and Galbraith, E. D. (2019). Metabolic impacts of climate change on marine ecosystems: implications for fish communities and fisheries. Glob. Ecol. Biogeogr. 28, 158–169. doi: 10.1111/geb.12832
Cheung, W. W., Sarmiento, J. L., Dunne, J., Frölicher, T. L., Lam, V. W., Palomares, M. D., et al. (2013). Shrinking of fishes exacerbates impacts of global ocean changes on marine ecosystems. Nat. Clim. Chang. 3, 254–258. doi: 10.1038/nclimate1691
Cheung, W. W. L., Lam, V. W. Y., Sarmiento, J. L., Kearney, K., Watson, R., Zeller, D., et al. (2010). Large-scale redistribution of maximum fisheries catch potential in the global ocean under climate change. Glob. Change Biol. 16, 24–35. doi: 10.1111/j.1365-2486.2009.01995.x
Chust, G., Allen, J. I., Bopp, L., Schrum, C., Holt, J., Tsiaras, K., et al. (2014). Biomass changes and trophic amplification of plankton in a warmer ocean. Glob. Change Biol. 20, 2124–2139. doi: 10.1111/gcb.12562
Clarke, A., and Johnston, N. M. (1999). Scaling of metabolic rate with body mass and temperature in teleost fish. J. Anim. Ecol. 68, 893–905. doi: 10.1046/j.1365-2656.1999.00337.x
Dahlke, F. T., Wohlrab, S., Butzin, M., and Pörtner, H. O. (2020). Thermal bottlenecks in the life cycle define climate vulnerability of fish. Science 369, 65–70. doi: 10.1126/science.aaz3658
De Roos, A. M., Schellekens, T., Van Kooten, T., Van De Wolfshaar, K., Claessen, D., and Persson, L. (2008). Simplifying a physiologically structured population model to a stage-structured biomass model. Theor. Popul. Biol. 73, 47–62. doi: 10.1016/j.tpb.2007.09.004
Delworth, T. L., Broccoli, A. J., Rosati, A., Stouffer, R. J., Balaji, V., Beesley, J. A., et al. (2006). GFDL’s CM2 global coupled climate models, Part I: formulation and simulation characteristics. J. Clim. 19, 643–674.
Deutsch, C., Ferrel, A., Seibel, B., Pörtner, H. O., and Huey, R. B. (2015). Climate change tightens a metabolic constraint on marine habitats. Science 348, 1132–1135. doi: 10.1126/science.aaa1605
du Pontavice, H., Gascuel, D., Reygondeau, G., Maureaud, A., and Cheung, W. W. L. (2020). Climate change undermines the global functioning of marine food webs. Glob. Change Biol. 26, 1306–1318. doi: 10.1111/gcb.14944
Dugdale, R. C., and Goering, J. J. (1967). Uptake of new and regenerated forms of nitrogen in primary productivity 1. Limnol. Oceanogr. 12, 196–206. doi: 10.4319/lo.1967.12.2.0196
Dunne, J. P., Armstrong, R. A., Gnanadesikan, A., and Sarmiento, J. L. (2005). Empirical and mechanistic models for the particle export ratio. Glob. Biogeochem. Cycles 19:GB4026.
Dunne, J. P., John, J. G., Adcroft, A. J., Griffies, S. M., Hallberg, R. W., Shevliakova, E., et al. (2012). GFDL’s ESM2 global coupled climate-carbon earth system models, Part I: physical formulation and baseline simulation characteristics. J. Clim. 25, 6646–6665. doi: 10.1175/Jcli-D-11-00560.1
Dunne, J. P., John, J. G., Shevliakova, E., Stouffer, R. J., Krasting, J. P., Malyshev, S. L., et al. (2013). GFDL’s ESM2 global coupled climate-carbon earth system models, Part II: carbon system formulation and baseline simulation characteristics. J. Clim. 26, 2247–2267. doi: 10.1175/Jcli-D-12-00150.1
Fossheim, M., Primicerio, R., Johannesen, E., Ingvaldsen, R. B., Aschan, M. M., and Dolgov, A. V. (2015). Recent warming leads to a rapid borealization of fish communities in the Arctic. Nat. Clim. Chang. 5, 673–677. doi: 10.1038/nclimate2647
Frank, K. T., Petrie, B., Choi, J. S., and Leggett, W. C. (2005). Trophic cascades in a formerly cod-dominated ecosystem. Science 308, 1621–1623. doi: 10.1126/science.1113075
Friedland, K. D., Stock, C., Drinkwater, K. F., Link, J. S., Leaf, R. T., Shank, B. V., et al. (2012). Pathways between primary production and fisheries yields of large marine ecosystems. PLoS One 10:e0133794. doi: 10.1371/journal.pone.0028945
Frölicher, T. L., Rodgers, K. B., Stock, C. A., and Cheung, W. W. (2016). Sources of uncertainties in 21st century projections of potential ocean ecosystem stressors. Glob. Biogeochem. Cycles 30, 1224–1243. doi: 10.1002/2015gb005338
Fu, W., Randerson, J. T., and Moore, J. K. (2016). Climate change impacts on net primary production (NPP) and export production (EP) regulated by increasing stratification and phytoplankton community structure in the CMIP5 models. Biogeosciences 13, 5151–5170. doi: 10.5194/bg-13-5151-2016
Fuller, E. C., Samhouri, J. F., Stoll, J. S., Levin, S. A., and Watson, J. R. (2017). Characterizing fisheries connectivity in marine social–ecological systems. ICES J. Mar. Sci. 74, 2087–2096. doi: 10.1093/icesjms/fsx128
Galbraith, E. D., Le Mézo, P., Solanes Hernandez, G., Bianchi, D., and Kroodsma, D. (2019). Growth limitation of marine fish by low iron availability in the open ocean. Front. Mar. Sci. 6:509. doi: 10.3389/fmars.2019.00509
Gangstø, R., Gehlen, M., Schneider, B., Bopp, L., Aumont, O., and Joos, F. (2008). Modeling the marine aragonite cycle: changes under rising carbon dioxide and its role in shallow water CaCO3 dissolution. Biogeosciences 5, 1057–1072. doi: 10.5194/bg-5-1057-2008
Gehlen, M., Gangstø, R., Schneider, B., Bopp, L., Aumont, O., and Ethe, C. (2007). The fate of pelagic CaCO3 production in a high CO 2 ocean: a model study. Biogeosciences 4, 505–519. doi: 10.5194/bg-4-505-2007
Griffies, S. M., Gnanadesikan, A., Dixon, K. W., Dunne, J. P., Gerdes, R., Harrison, M. J., et al. (2005). Formulation of an ocean model for global climate simulations. Ocean Sci. 1, 45–79. doi: 10.5194/os-1-45-2005
Guiet, J., Aumont, O., Poggiale, J. C., and Maury, O. (2016). Effects of lower trophic level biomass and water temperature on fish communities: a modelling study. Prog. Oceanogr. 146, 22–37. doi: 10.1016/j.pocean.2016.04.003
Hansen, B. W., Bjornsen, P. K., and Hansen, P. J. (1994). The size ratio between planktonic predators and their prey. Limnol. Oceanogr. 39, 395–402. doi: 10.4319/lo.1994.39.2.0395
Hansen, P. J., Bjornsen, P. K., and Hansen, B. W., (1997). Zooplankton grazing and growth: scaling within the 2–2000-mm body size range. Limnol. Oceanogr. 42, 687–704. doi: 10.4319/lo.1997.42.4.0687
Hartvig, M., and Andersen, K. H. (2013). Coexistence of structured populations with size-based prey selection. Theor. Popul. Biol. 89, 24–33. doi: 10.1016/j.tpb.2013.07.003
Hartvig, M., Andersen, K. H., and Beyer, J. E. (2011). Food web framework for size-structured populations. J. Theor. Biol. 272, 113–122. doi: 10.1016/j.jtbi.2010.12.006
Heintz, R. A., Siddon, E. C., Farley, E. V. Jr., and Napp, J. M. (2013). Correlation between recruitment and fall condition of age-0 walleye pollock (Theragra chalcogramma) from the eastern Bering Sea under varying climate conditions. Deep Sea Res. II 94, 150–156. doi: 10.1016/j.dsr2.2013.04.006
Jennings, S., and Collingridge, K. (2015). Predicting consumer biomass, size-structure, production, catch potential, responses to fishing and associated uncertainties in the world’s marine ecosystems. Mar. Ecol. Prog. Ser. 410, 233–244.
Jones, D. O., Yool, A., Wei, C. L., Henson, S. A., Ruhl, H. A., Watson, R. A., et al. (2014). Global reductions in seafloor biomass in response to climate change. Glob. Change Biol. 20, 1861–1872. doi: 10.1111/gcb.12480
Kearney, K. A., Stock, C., Aydin, K., and Sarmiento, J. L. (2012). Coupling planktonic ecosystem and fisheries food web models for a pelagic ecosystem: description and validation for the subarctic Pacific. Ecol. Modell. 237, 43–62. doi: 10.1016/j.ecolmodel.2012.04.006
Klaas, C., and Archer, D. E. (2002). Association of sinking organic matter with various types of mineral ballast in the deep sea: implications for the rain ratio. Glob. Biogeochem. Cycles 16:1116.
Kwiatkowski, L., Aumont, O., and Bopp, L. (2019). Consistent trophic amplification of marine biomass declines under climate change. Glob. Change Biol. 25, 218–229. doi: 10.1111/gcb.14468
Kwiatkowski, L., Olivier Torres, O., Bopp, L., Aumont, O., Chamberlain, M., Christian, J., et al. (2020). Twenty-first century ocean warming, acidification, deoxygenation, and upper ocean nutrient decline from CMIP6 model projections. Biogeosciences 17, 3439–3470. doi: 10.5194/bg-2020-16
Laufkötter, C., John, J. G., Stock, C. A., and Dunne, J. P. (2017). Temperature and oxygen dependence of the remineralization of organic matter. Glob. Biogeochem. Cycles 31, 1038–1050. doi: 10.1002/2017gb005643
Laufkötter, C., Vogt, M., Gruber, N., Aita-Noguchi, M., Aumont, O., Bopp, L., et al. (2015). Drivers and uncertainties of future global marine primary production in marine ecosystem models. Biogeosciences 12, 6955–6984. doi: 10.5194/bg-12-6955-2015
Laufkötter, C., Vogt, M., Gruber, N., Aumont, O., Bopp, L., Doney, S. C., et al. (2016). Projected decreases in future marine export production: the role of carbon fluxes through the upper ocean ecosystem. Biogeosci. Discuss. 12, 19941–19998. doi: 10.5194/bgd-12-19941-2015
Laws, E. A., Falkowski, P. G., Smith, W. O., Ducklow, H., and McCarthy, J. J. (2000). Temperature effects on export production in the open ocean. Glob. Biogeochem. Cycles 14, 1231–1246. doi: 10.1029/1999gb001229
Lefort, S., Aumont, O., Bopp, L., Arsouze, T., Gehlen, M., and Maury, O. (2015). Spatial and body-size dependent response of marine pelagic communities to projected global climate change. Glob. Change Biol. 21, 154–164. doi: 10.1111/gcb.12679
Lin, S. J. (2004). A “vertically lagrangian” finite-volume dynamical core for global models. Mon. Weather Rev. 132, 2293–2307. doi: 10.1175/1520-04932004132<2293:Avlfdc<2.0.Co;2
Liu, X., Dunne, J. P., Stock, C. A., Harrison, M. J., Adcroft, A., and Resplandy, L. (2019). Simulating water residence time in the coastal ocean: a global perspective. Geophys. Res. Lett. 46, 13910–13919. doi: 10.1029/2019gl085097
Lotze, H. K., Tittensor, D. P., Bryndum-Buchholz, A., Eddy, T. D., Cheung, W. W., Galbraith, E. D., et al. (2019). Global ensemble projections reveal trophic amplification of ocean biomass declines with climate change. Proc. Natl. Acad. Sci. U.S.A. 116, 12907–12912.
Lutz, M. J., Caldeira, K., Dunbar, R. B., and Behrenfeld, M. J. (2007). Seasonal rhythms of net primary production and particulate organic carbon flux to depth describe the efficiency of biological pump in the global ocean. J. Geophys. Res. 112:C10011.
Mariani, P., Andersen, K. H., Lindegren, M., and MacKenzie, B. R. (2017). Trophic impact of Atlantic bluefin tuna migrations in the North Sea. ICES J. Mar. Sci. 74, 1552–1560. doi: 10.1093/icesjms/fsx027
Marsay, C. M., Sanders, R. J., Henson, S. A., Pabortsava, K., Achterberg, E. P., and Lampitt, R. S. (2015). Attenuation of sinking particulate organic carbon flux through the mesopelagic ocean. Proc. Natl. Acad. Sci. U.S.A. 112, 1089–1094. doi: 10.1073/pnas.1415311112
Martin, J. H., Knauer, G. M., Karl, D. M., and Broenkow, W. W., (1987). VERTEX: carbon cycling in the Northeast Pacific. Deep-Sea Res. 34, 267–285. doi: 10.1016/0198-0149(87)90086-0
Maury, O. (2010). An overview of APECOSM, a spatialized mass balanced “Apex Predators ECOSystem Model” to study physiologically structured tuna population dynamics in their ecosystem. Prog. Oceanogr. 84, 113–117. doi: 10.1016/j.pocean.2009.09.013
Moore, J. K., Fu, W., Primeau, F., Britten, G. L., Lindsay, K., Long, M., et al. (2018). Sustained climate warming drives declining marine biological productivity. Science 359, 1139–1143. doi: 10.1126/science.aao6379
Murdoch, W. W. (1977). Stabilizing effects of spatial heterogeneity in predator-prey systems. Theor. Popul. Biol. 11, 252–273. doi: 10.1016/0040-5809(77)90028-4
Nieblas, A. E., Demarcq, H., Drushka, K., Sloyan, B., and Bonhommeau, S. (2014). Front variability and surface ocean features of the presumed southern bluefin tuna spawning grounds in the tropical southeast Indian Ocean. Deep Sea Res. Part II 107, 64–76. doi: 10.1016/j.dsr2.2013.11.007
Pauly, D., and Cheung, W. W. (2018). Sound physiological knowledge and principles in modeling shrinking of fishes under climate change. Glob. Change Biol. 24, e15–e26.
Pauly, D., and Christensen, V. (1995). Primary production required to sustain global fisheries. Nature 374, 255–257. doi: 10.1038/374255a0
Pauly, D., Christensen, V., Dalsgaard, J., Froese, R., and Torres, F. (1998). Fishing down marine food webs. Science 279, 860–863. doi: 10.1126/science.279.5352.860
Pauly, D., and Zeller, D. (2015). “Reconstructing marine fisheries catch data,” in Catch Reconstructions: Concepts, Methods and Data Sources, eds D. Pauly and D. Zeller. (Vancouver: Sea Around Us).
Perrin, N. (1995). About Berrigan and Charnov’s life-history puzzle. Oikos 73, 137–139. doi: 10.2307/3545737
Peterson, W. T., Morgan, C. A., Peterson, J. O., Fisher, J. L., Burke, B. J., and Fresh, K. (2013). Ocean Ecosystem Indicators of Salmon Marine Survival in the Northern California Current. Seattle, WA: Northwest Fisheries Science Center, 77.
Petrik, C. M., Stock, C. A., Andersen, K. H., van Denderen, P. D., and Watson, J. R. (2019). Bottom-up drivers of global patterns of demersal, forage, and pelagic fishes. Prog. Oceanogr. 176:102124. doi: 10.1016/j.pocean.2019.102124
Pinsky, M. L., Reygondeau, G., Caddell, R., Palacios-Abrantes, J., Spijkers, J., and Cheung, W. W. (2018). Preparing ocean governance for species on the move. Science 360, 1189–1191. doi: 10.1126/science.aat2360
Pinsky, M. L., Worm, B., Fogarty, M. J., Sarmiento, J. L., and Levin, S. A. (2013). Marine taxa track local climate velocities. Science 341, 1239–1242. doi: 10.1126/science.1239352
Pinti, J., and Visser, A. W. (2019). Predator-prey games in multiple habitats reveal mixed strategies in diel vertical migration. Am. Nat. 193, E65–E77.
Polovina, J. J., Howell, E., Kobayashi, D. R., and Seki, M. P. (2001). The transition zone chlorophyll front, a dynamic global feature defining migration and forage habitat for marine resources. Prog. Oceanogr. 49, 469–483. doi: 10.1016/s0079-6611(01)00036-2
Pomeroy, L. R., and Deibel, D. O. N. (1986). Temperature regulation of bacterial activity during the spring bloom in Newfoundland coastal waters. Science 233, 359–361. doi: 10.1126/science.233.4761.359
Rall, B. C., Brose, U., Hartvig, M., Kalinkat, G., Schwarzmüller, F., Vucic-Pestic, O., et al. (2012). Universal temperature and body-mass scaling of feeding rates. Phil. Trans. R. Soc. B 367, 2923L–2934.
Redfield, A. C. (1934). “On the proportions of organic derivations in sea water and their relation to the composition of plankton,” in James Johnstone Memorial Volume, ed. R. J. Daniel (Liverpool: University Press of Liverpool), 176–192.
Reglero, P., Tittensor, D. P., Álvarez-Berastegui, D., Aparicio-González, A., and Worm, B. (2014). Worldwide distributions of tuna larvae: revisiting hypotheses on environmental requirements for spawning habitats. Mar. Ecol. Prog. Ser. 501, 207–224. doi: 10.3354/meps10666
Ryther, J. H. (1969). Photosynthesis and fish production in the sea. Science 166, 72–76. doi: 10.1126/science.166.3901.72
Séférian, R., Berthet, S., Yool, A., Palmieri, J., Bopp, L., Tagliabue, A., et al. (2020). Tracking improvement in simulated marine biogeochemistry between CMIP5 and CMIP6. Curr. Clim. Change 18, 1–25.
Steele, J. H., and Henderson, E. W. (1992). “The significance of interannual variability,” in Towards a Model of Ocean Biogeochemical Processes, eds G. T. Evans and M. J. R. Fasham (Heidelberg: Springer-Verlag), 227–260.
Stock, C., and Dunne, J. (2010). Controls on the ratio of mesozooplankton production to primary production in marine ecosystems. Deep Sea Res. I 57, 95–112. doi: 10.1016/j.dsr.2009.10.006
Stock, C. A., Alexander, M. A., Bond, N. A., Brander, K. M., Cheung, W. W., Curchitser, E. N., et al. (2011). On the use of IPCC-class models to assess the impact of climate on living marine resources. Prog. Oceanogr. 88, 1–27. doi: 10.1016/j.pocean.2010.09.001
Stock, C. A., Dunne, J. P., and John, J. G. (2014a). Drivers of trophic amplification of ocean productivity trends in a changing climate. Biogeosciences 11, 7125–7135. doi: 10.5194/bg-11-7125-2014
Stock, C. A., Dunne, J. P., and John, J. G. (2014b). Global-scale carbon and energy flows through the marine planktonic food web: an analysis with a coupled physical-biological model. Prog. Oceanogr. 120, 1–28. doi: 10.1016/j.pocean.2013.07.001
Stock, C. A., John, J. G., Rykaczewski, R. R., Asch, R. G., Cheung, W. W. L., Dunne, J. P., et al. (2017). Reconciling fisheries catch and ocean productivity. Proc. Natl. Acad. Sci. U.S.A. 114, E1441–E1449. doi: 10.1073/pnas.1610238114
Stocker, T. F., Qin, D., Plattner, G., Tignor, M., Allen, S. K., Boschung, J., et al. (eds) (2013). IPCC, 2013: Summary for Policymakers in Climate Change 2013: the Physical Science Basis, Contribution of Working Group I to the Fifth Assessment Report of the Intergovernmental Panel On Climate Change. Cambridge: Cambridge University Press.
Taucher, J., and Oschlies, A. (2011). Can we predict the direction of marine primary production change under global warming? Geophys. Res. Lett. 38:L02603.
Tittensor, D. P., Eddy, T. D., Lotze, H. K., Galbraith, E. D., Cheung, W., Barange, M., et al. (2018). A protocol for the intercomparison of marine fishery and ecosystem models: fish-MIP v1.0. Geosci. Model Dev. 11, 1421–1442.
Ullah, H., Nagelkerken, I., Goldenberg, S. U., and Fordham, D. A. (2018). Climate change could drive marine food web collapse through altered trophic flows and cyanobacterial proliferation. PLoS Biol. 16:e2003446. doi: 10.1371/journal.pbio.2003446
van Denderen, D., Gislason, H., van den Heuvel, J., and Andersen, K. H., (2020). Global analysis of fish growth rates shows weaker responses to temperature than metabolic predictions. Glob. Ecol. Biogeogr. doi: 10.1111/geb.13189
van Denderen, D., Lindegren, M., MacKenzie, B. R., Watson, R. A., and Andersen, K. H. (2018). Global patterns in marine predatory fish. Nat. Ecol. Evol. 2, 65–70. doi: 10.1038/s41559-017-0388-z
von Bertalanffy, L. (1960). “Fundamental aspects of normal and malignant growth,” in Fundamental Aspects of Normal and Malignant Growth, ed. W. W. Nowinski (Amsterdam: Elsevier), 137–259. doi: 10.1016/b978-0-408-10638-2.50012-4
Watson, J. R., Fuller, E. C., Castruccio, F. S., and Samhouri, J. F. (2018). Fishermen follow fine-scale physical ocean features for finance. Front. Mar. Sci. 5:46. doi: 10.3389/fmars.2018.00046
Watson, J. R., Stock, C. A., and Sarmiento, J. L. (2015). Exploring the role of movement in determining the global distribution of marine biomass using a coupled hydrodynamic-size-based ecosystem model. Prog. Oceanogr. 138, 521–532. doi: 10.1016/j.pocean.2014.09.001
Wei, C.-L., Rowe, G. T., Escobar-Briones, E., Boetius, A., Soltwedel, T., Caley, M. J., et al. (2010). Global patterns and predictions of seafloor biomass using random forests. PLoS One 5:e15323. doi: 10.1371/journal.pone.0015323
Keywords: climate change, fish and fisheries, functional types, marine ecosystem model, metabolism, secondary production, trait-based model, trophic amplification
Citation: Petrik CM, Stock CA, Andersen KH, van Denderen PD and Watson JR (2020) Large Pelagic Fish Are Most Sensitive to Climate Change Despite Pelagification of Ocean Food Webs. Front. Mar. Sci. 7:588482. doi: 10.3389/fmars.2020.588482
Received: 29 July 2020; Accepted: 03 November 2020;
Published: 26 November 2020.
Edited by:
Kenneth Alan Rose, University of Maryland Center for Environmental Science (UMCES), United StatesReviewed by:
Eric D. Galbraith, McGill University, CanadaJeroen Gerhard Steenbeek, Ecopath International Initiative Research Association, Spain
Copyright © 2020 Petrik, Stock, Andersen, van Denderen and Watson. This is an open-access article distributed under the terms of the Creative Commons Attribution License (CC BY). The use, distribution or reproduction in other forums is permitted, provided the original author(s) and the copyright owner(s) are credited and that the original publication in this journal is cited, in accordance with accepted academic practice. No use, distribution or reproduction is permitted which does not comply with these terms.
*Correspondence: Colleen M. Petrik, cpetrik@tamu.edu