Intra-Annual Patterns in the Benthic-Pelagic Fluxes of Dissolved and Particulate Matter
 Saskia Rühl
 Charlie E. L. Thompson2
  Ana M. Queirós
 Stephen Widdicombe
- 1Plymouth Marine Laboratory, Plymouth, United Kingdom
- 2School of Ocean and Earth Science, University of Southampton, National Oceanography Centre, Southampton, United Kingdom
In coastal temperate environments, many processes known to affect the exchange of particulate and dissolved matter between the seafloor and the water column follow cyclical patterns of intra-annual variation. This study assesses the extent to which these individual short term temporal variations affect specific direct drivers of seafloor-water exchanges, how they interact with one another throughout the year, and what the resulting seasonal variation in the direction and magnitude of benthic-pelagic exchange is. Existing data from a multidisciplinary long-term time-series from the Western Channel Observatory, United Kingdom, were combined with new experimental and in situ data collected throughout a full seasonal cycle. These data, in combination with and contextualized by time-series data, were used to define an average year, split into five ‘periods’ (winter, pre-bloom, bloom, post-bloom, and autumn) based around the known importance of pelagic primary production and hydrodynamically active phases of the year. Multivariate analyses were used to identify specific sub-sets of parameters that described the various direct drivers of seafloor-water exchanges. Both dissolved and particulate exchange showed three distinct periods of significant flux during the year, although the specific timings of these periods and the cause-effect relationships to the direct and indirect drivers differed between the two types of flux. Dissolved matter exchange was dominated by an upward flux in the pre-bloom period driven by diffusion, then a biologically induced upward flux during the bloom and an autumn downward flux. The latter was attributable to the interactions of hydrodynamic and biological activity on the seafloor. Particulate matter exchanges exhibited a strongly hydrologically influenced upward flux during the winter, followed by a biologically induced downward flux during the bloom and a second period of downward flux throughout post-bloom and autumn periods. This was driven primarily through interactions between biological activity, and physical and meteorological drivers. The integrated, holistic and quantitative data-based analysis of intra-annual variability in benthic/pelagic fluxes presented in this study in a representative temperate coastal environment, demonstrates not only the various process’ inter-connectivity, but also their relative importance to each other. Future investigations or modeling efforts of similar systems will benefit greatly from the relationships and baseline rules established in this study.
Introduction
The marine ecosystem can perhaps be considered the most inter-connected ecosystem on Earth. There is a constant movement and flux of materials through the exchange of living organisms as well as the complex production, transformation and transport of particulate and dissolved matter throughout the system. Many of these connections are vital to the overall functioning of the marine ecosystem. For example, the influx of organic matter from the water column (pelagic) to the sea floor (benthos) provides a vital source of food for many benthic organisms (Middelburg, 2018), while nutrient depleted pelagic environments can be replenished from sedimentary sources (e.g., MacIntyre, 1998). As the exchange of dissolved and particulate matter between the benthos and the pelagic cannot be summarized in a single process, but rather comprises of a series of exchange pathways which are the product of physical, chemical and biological factors interacting in the environment, their joint consideration is required to gain a holistic understanding of the ecosystem in question (Rühl et al., 2020). In the present study, we explore how the complex network of benthic-pelagic (B/P) exchange pathways may be affected by phenological and other environmental patterns over the course of a year. Phenology, the cyclical and often intra-annual occurrence of important biological events, is known to shape environmental interactions in marine habitats around the globe, and especially the temperate coastal ocean (e.g., Rudnick et al., 1985; Schafer et al., 2002; Tonkin et al., 2017).
Many of the pathways and processes involved in the exchange of dissolved matter (DM) differ from those involved in the transport of particulate matter (PM). While there is a distinct group of direct drivers in the case of DM B/P exchange, the exchange of PM can be influenced by a broader set of direct drivers which are best grouped into two categories to avoid unnecessary complication. However, PM and DM B/P exchange do not occur completely in isolation, and there are overlaps between their drivers of exchange (e.g., biological and physical forms of resuspension). Due to the complexity of drivers involved, for simplicity, in this paper, the B/P exchange of DM and PM will therefore initially be considered separately before being integrated to form a holistic framework.
The primary drivers of DM exchange are (a) the biological pumping of water by macroinfauna known as bioirrigation (Volkenborn et al., 2007, 2012), (b) the physical resuspension of sediments and pore waters by currents or waves (Morris and Howarth, 1998; Tengberg et al., 2003; Durrieu de Madron et al., 2017), (c) the biological mixing of sediments and resulting release of pore waters by macro-infauna (Berg et al., 2001; van Hoey et al., 2008; Bouma et al., 2009; Montserrat et al., 2009), (d) advective flushing from tides, currents and waves (Ehrenhauss et al., 2004), and (e) diffusive flux (Berner, 1976; Revsbech and Jorgensen, 1980; Boudreau, 2001). Each of these primary processes affecting DM flux is driven by a number of secondary factors that thereby exert an indirect effect. The five direct drivers of DM B/P exchange are all weighted equally in this study, though depending on the environment their relative influences may vary (e.g., advection vs. diffusion depending on sediment type; Glud, 2008).
As there is a large number of drivers of PM exchange, these were grouped in this study, for simplicity, as: (a) those that affect resuspension and upward transport of benthic material into the water column (bioturbation, physical resuspension, meroplanktonic larvae release, etc.), and (b) those that affect downward flux and deposition of formerly pelagic particulate matter (zooplanktonic ingestion and vertical migration, hydrodynamic and thermodynamic water column properties, etc.). Secondary drivers of PM exchange within both groups are the specific processes which affect the likelihood and severity of particle flux as well as the nature of the PM in question.
Many drivers of B/P exchange of DM and PM exhibit periodic intra-annual variation. For example the periodic shifts in nitrification and microbe community activity (Hansen et al., 1981); variation in activity and abundance of vertical migrating organisms (Atkinson and Sinclair, 2000; Kane et al., 2018); variable quantities of pelagic POM supply and flux (Wakeham and Lee, 1993); periodically occurring primary production events (Barnes et al., 2015) and variation in the weather throughout the year (Keim et al., 2004). The interactions of all drivers result in net fluxes of DM and PM that vary throughout the year.
Previous studies that described phenological drivers of B/P exchange focused on intra-annual variation (e.g., Graf, 1992), and organic matter cycling (e.g., Meyer-Reil, 1983), but yet ignored hydrographic processes such as tidal currents and storm events which can drive physical resuspension and advective fluxes. Annual phytoplankton bloom events are known to be a major source of short-term (intra-annual) temporal variation (Barnes et al., 2015), but only over the summer months. In autumn, winter and pre-bloom periods it should thus not necessarily be assumed that biological drivers are key determinants of B/P exchange. In this study, we cover a complete intra-annual cycle, and combine biological, biogeochemical, oceanographic and hydrological data to provide a holistic picture of all intra-annual periods at our study site. To this end, existing time-series data that were collected in other contexts, were supplemented with highly resolved and targeted in situ sampling and experimental work. Thus, a unique holistic approach was used, including both biological and non-biological drivers of B/P exchange and closing the gaps left by previous studies that focused on either of the two instead of integrating both (e.g., Graf, 1992; Tonkin et al., 2017).
In addition, the integration of a comprehensive time series data set and targeted in situ and experimental measurements, enables us to investigate temporal patterns of B/P exchange at a widely representative temperate coastal site throughout the year, in a more integrated way than previously done. Because we could not practically assess all types of PM and DM exchange, and given the differences between B/P exchange pathways of DM and PM, we focus first on a specific type of DM, dissolved inorganic nitrite (DIN), and then on a specific type of PM, particulate organic carbon (POC), as examples individually. We then consider them together. We chose two fundamental types of DM and PM, which are deeply involved in key nutrient cycles in the global ocean, the biosphere, as well as being related to ecosystem services delivered by the global ocean, such as carbon sequestration, which are paramount to regulation of the global planetary system such as the climate system.
Initially, we assess periodic intra-annual variability in the environmental variables considered to be driving DM or PM B/P exchange. Patterns in B/P exchange drivers and processes following the phenological periods will then be identified. Finally, utilizing both sets of information, we evaluate whether the relative influence of different driver groups changes intra-annually and identify cause-effect relationships between drivers and processes.
Materials and Methods
A number of existing data sets from an established long-term monitoring station collected between 2009 and 2019 were averaged by month. This created a record of monthly conditions during an “average year,” thus minimizing the influences of extreme events which are known to occur sporadically in some years but not others (e.g., Zhang et al., 2015; Masselink et al., 2016). The time-series data were then combined with targeted experimental and in situ data collected from the same station across an annual cycle (see Supplementary Appendices 1, 2 for full list of variables included). To ensure the measurements made over a single intra-annual cycle were representative of “typical” conditions rather than outliers in a year shaped by extreme events, conditions of the year in question were investigated in context of the time-series data prior to the analysis. No extreme outliers could be identified in any of the variables in question, so they were found to be an acceptable representation of typical conditions at the study site.
The Western Channel Observatory
The majority of the data were collected at Station L4 of the Western Channel Observatory (WCO), which is situated in the English Channel 11 miles off the coast of Plymouth, United Kingdom (50.25°N; 4.22°W, see Figure 1). Water depth at this site is roughly 50 m, and the site is characterized as having dynamic water flow with semi-diurnal tidal flow and riverine influences, experiencing depth-averaged current speeds of roughly 0.35 m/s (Smyth et al., 2015a; Uncles et al., 2015). The seabed comprises of sandy mud hosting an abundance of bioturbating and bioirrigating organisms (Queirós et al., 2015b). An organic-rich layer can be found immediately above the seabed, that is re-suspended during the tidal cycle (Queirós et al., 2019), the nepheloid layer.
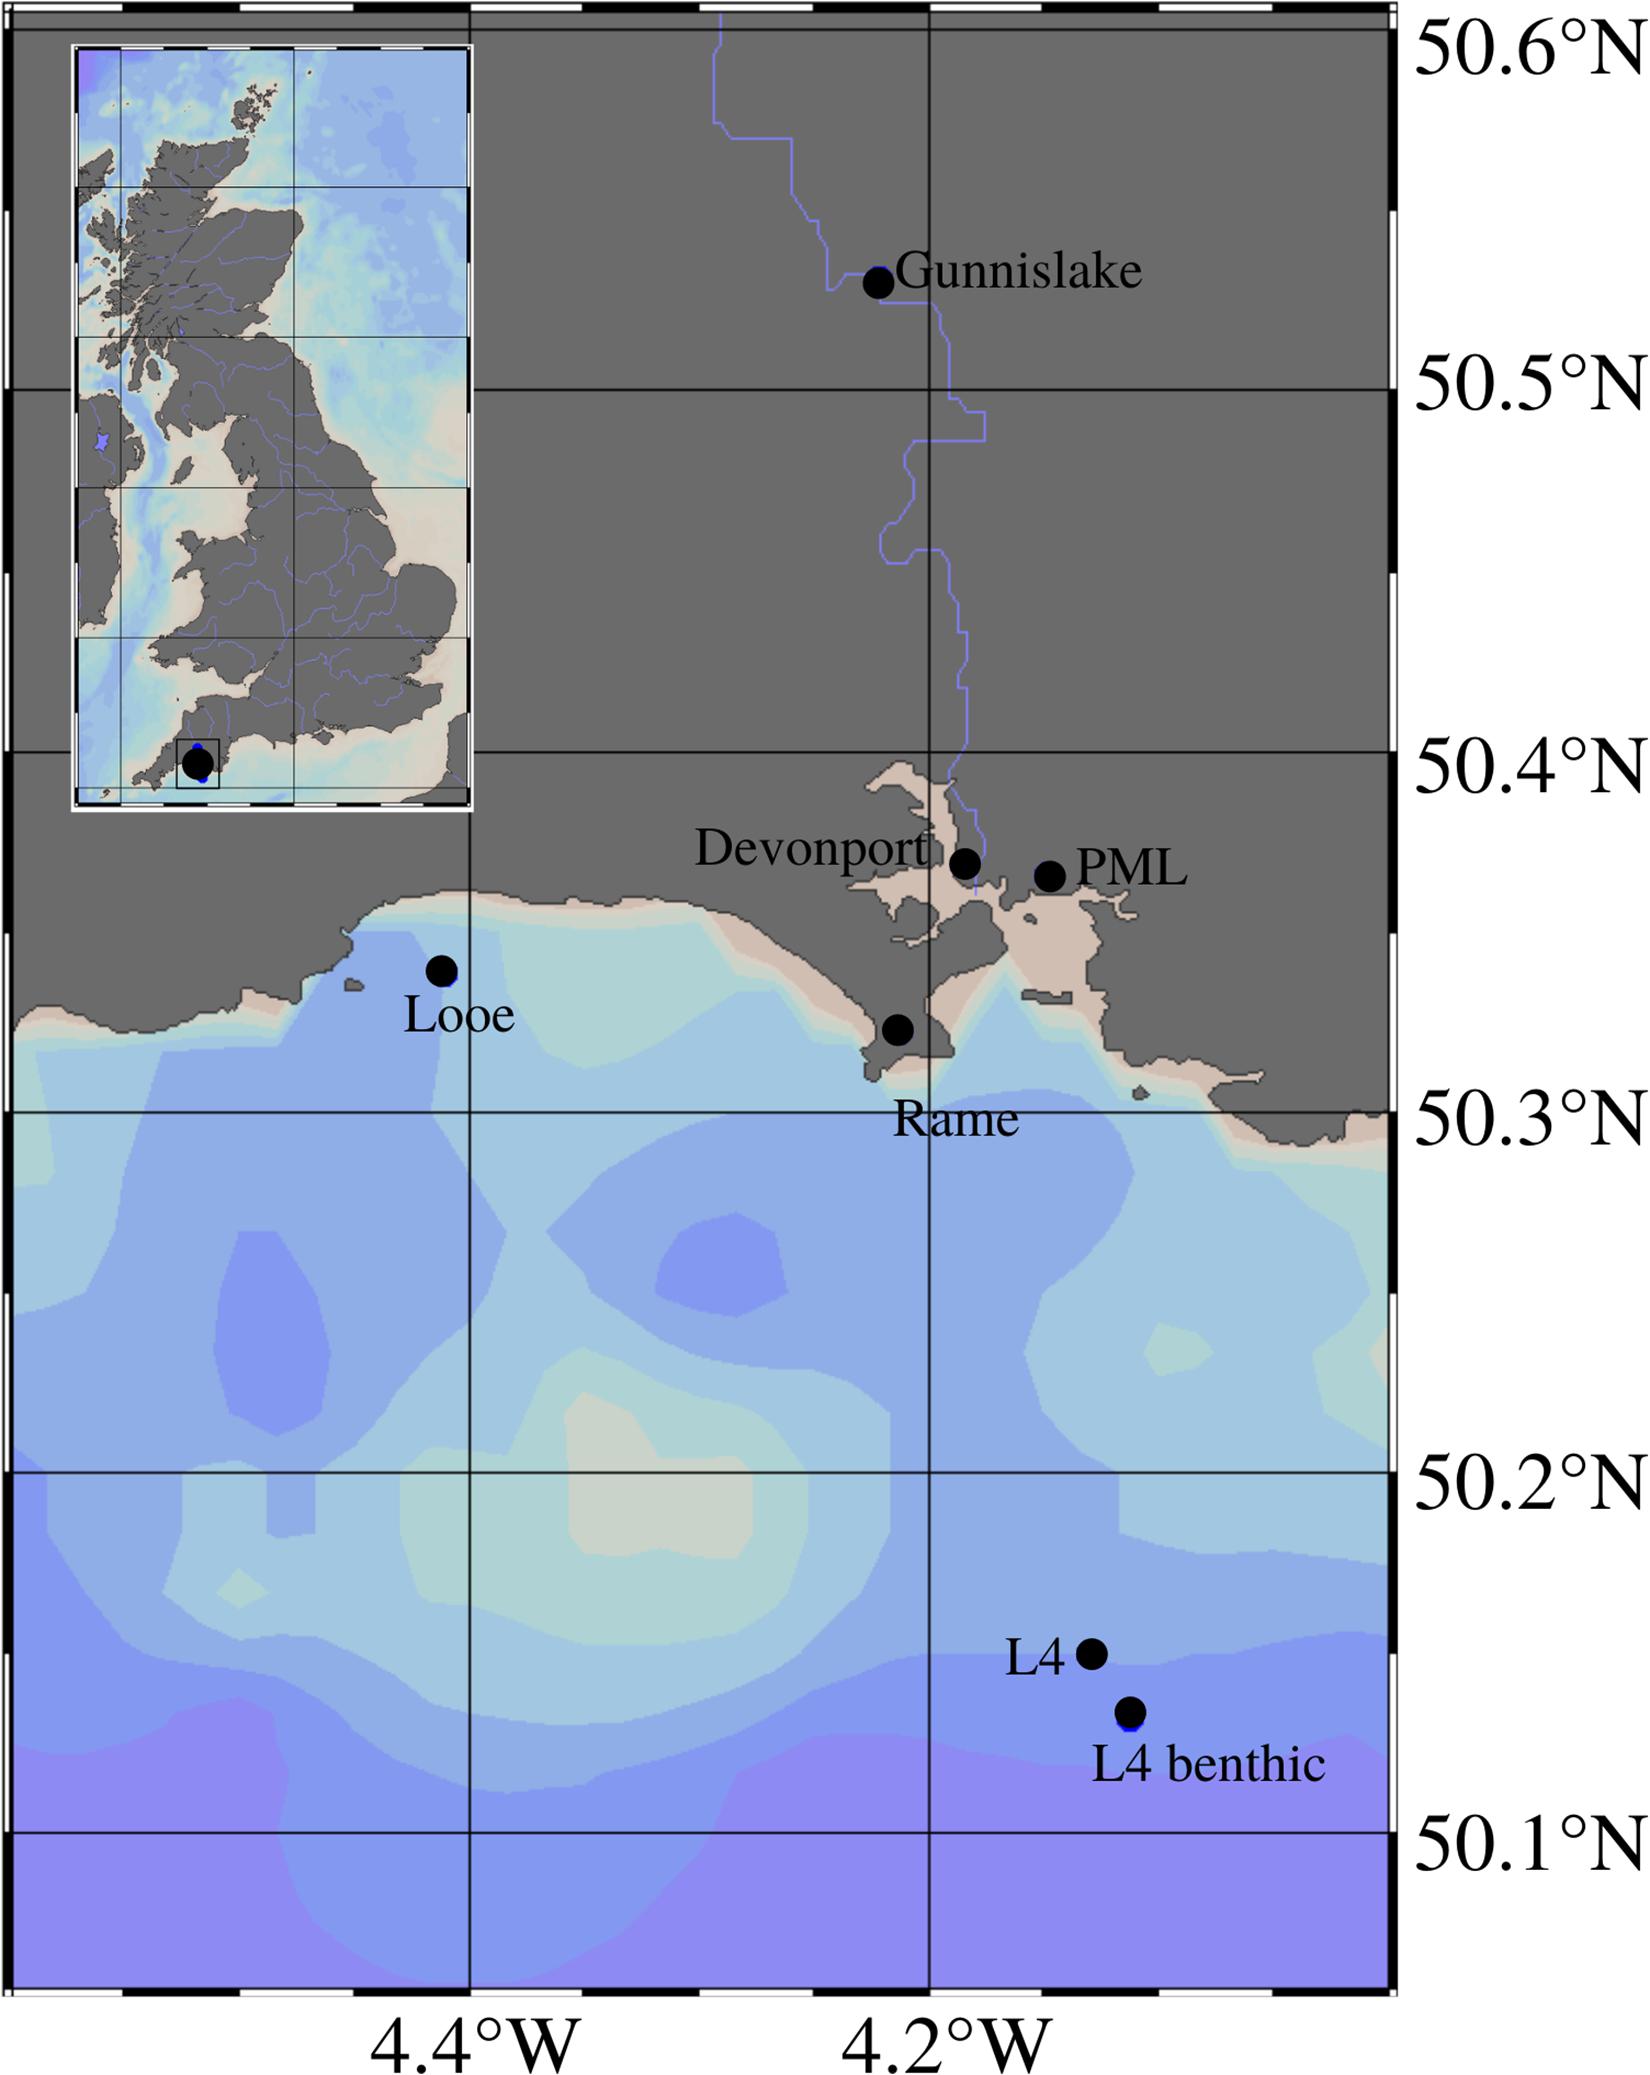
Figure 1. Location of sampling stations including the pelagic and benthic L4 sites, Rame Head MET station, Looe wave buoy, PML MET station, Devonport tidal gauge and Gunnislake river flow gauge, and their location relative to the UK in a broader geographical context in the top left corner box; map generated using Ocean Data Viewer (Alfred Wegener Institute, 2019).
A benthic station has been established close (1 km distance) to the pelagic site (50.13°N 4.11°W, see Figure 1), and has been sampled regularly since 2008. As connectivity between the pelagic and benthic monitoring sites is well documented (Smyth et al., 2015b; Tait et al., 2015; Zhang et al., 2015; Navarro-Barranco et al., 2017; etc.), both are hereafter collectively referred to as Station L4.
Station L4 annually experiences seasonal thermal stratification and nutrient depletion (Smyth et al., 2015a), which is typical of temperate coastal waters (e.g., Allen et al., 2004; Blomqvist et al., 2004; Holt and Umlauf, 2008; Jacobsen and Markager, 2016). Based on Conductivity/Temperature/Density water column profiles recorded between 2009 and 2018, thermal stratification at this site starts on average on the 24–25th of May and ends on the 03rd–4th of September, though it exhibits high inter-annual variation in both duration and timing (see also Smyth et al., 2010). Data collected through the WCO time series utilized in this study include measurements of total and organic particulate carbon and nitrogen (TPC, TPN, POC, PON), colored dissolved organic matter (CDOM; Groom et al., 2009), suspended particulate matter (SPM), dissolved oxygen (O2), phytoplankton abundance and biomass (Widdicombe et al., 2010) as well as zooplankton and meroplankton abundance (Eloire et al., 2010; Highfield et al., 2010), benthic macrofauna abundance and biomass (see e.g., Zhang et al., 2015), fluorescence and chlorophyll a (see e.g., Aiken et al., 2004), water temperature, photosynthetically active radiation (PAR), and mean sediment grain size (d50). More detail on the data sets listed above can be found in Supplementary Appendix 1.
In situ and Experimental Data Collection Specific to This Study
Sediment erosion thresholds and critical shear stresses were measured at four time points throughout the 2017–2018 period, using the PML annular laboratory flumes (Widdows et al., 1998b; see Supplementary Appendix 2). Sediment was collected using deployments of a 0.1 m2 box core, ensuring the overlying water layer and sediment surface would be disturbed as little as possible throughout the coring process. The boxes were then subsampled using eighth-annulus custom corers (hereafter “sub-corers”) which were pushed into each sediment core and had their bases sealed on deck using neoprene seal fitted plastic lids. Overlaying bottom water retained in the box corer was preserved when sub-cores were sampled in this way, and was gently aerated for the duration of the transport back to the laboratory. During transport, all sub-corers were kept in shaded tubs, cooled by a seawater bath to help maintain temperature. Jostling and other disturbances during transport were avoided as far as possible as disruptions in the sediment fabric which alter sedimentary properties have previously been shown to be caused by transport procedures (Blomqvist, 1991). Upon arrival at the Plymouth Marine Laboratory mesocosm facility, the sub-cores were inserted into the annular flumes by gentle removal of sub-scorers, and water level topped up using bottom water from the collection site, sampled with a Rosette sampler as described. Water level was achieved by pouring the bottom water over a layer of bubble wrap to reduce disturbance to the sediment surface (as introduced in Widdows et al., 1998a). The flumes were then left to settle for 7 days in darkened and aerated conditions at L4 bottom water temperatures. The mesocosm laboratory is an environment controlled room where, in addition to other controls, air, and thereby also water, temperature is regulated on a monthly basis to follow the seasonal cycle of bottom water temperature at L4 (Queirós et al., 2015a).
The flumes were run using the appended program (see Supplementary Appendix 3) and sediment erodibility and cohesion were measured in terms of optical backscatter using Optical Backscatter Sensors (OBS) as well as SPM samples at each velocity step. SPM samples were taken from the upper third of the water column during the run of the flume exactly 1 m before the end of each velocity step using a Swinnex syringe filter system with pre-ashed (450°C for 24 h) pre-weighed 25 mm Glass Fiber Filters (GFF; Whatmann). They were then placed in labeled containers and stored in a fridge at 2°C; if further analysis was not possible within the next 24 h, samples were transferred to a −20°C freezer immediately after sampling. To determine the quantity of SPM and POC in each sample, filters were dried in an oven in pre-weighed petri dishes over night at 60°C and weighed again. They were then placed in a furnace and ashed for 24 h at 450°C, after which they were weighed a final time. SPM quantities were derived from the dry weight of the loaded filters by subtracting the weight of each of the empty filters, and POC was determined through the quantity of filtered material that was lost on ignition during the ashing process.
In addition, 50 ml of in-flume water were extracted to assess nitrite, ammonium, silicate, and phosphate concentrations, as well as the nitrite/nitrate ratio. Samples were collected at regular time points; immediately before the run, 5 min into each velocity step, and at the end of the flume run. The water was filtered through acrodisk® supor® membrane filters 0.8/0.2 um (VWR) and stored at −20°C immediately after sampling. A 5 channel Bran and Luebbe AAIII segmented flow auto analyzer was used to measure concentrations.
Background SPM at the time of in situ core collection was measured by filtering, drying and ashing 10 l of water collected via a Rosette sampler from 0 m, 10 m, 20 m, 30 m, 40 m, 50 m depth, and water from 54 m (bottom water) was collected from multicorer deployments (four perspex tubes of 80 cm length and 10 cm diameter which capture the nepheloid layer immediately above the sediment surface). These water samples were processed in the same way as the flume water. Sediment properties were assessed during the field campaign, including bulk density, porosity, water content, permeability and POC content. Samples were collected using 50 ml syringe corers inserted vertically into the surface of three of the box cores at each time point. Syringe corers were sealed and transported from the field site to the laboratory upright to prevent water loss, in darkened, cool conditions. Each syringe core was used to extract sediment down to a depth of 5–6 cm, which was then split into four sections to create a depth profile: 0–1 cm, 1–2 cm, 2–3 cm, and 3–5 cm. Each section was placed in a pre-weighed petri dish, weighed, dried over night at 60°C, re-weighed, ashed for 24 h at 450°C and weighed again. The same types of sample were also collected from inside the flumes immediately after the end of the experiment. Sediment grain size was determined through sub-sampling the initial box cores using the same kind of 50 ml syringe corers. Samples were collected at 0–1 cm, 1–2 cm, 2–3 cm, and 3–5 cm depth by dividing each syringe core in situ, and several cores worth of segments were combined to gain samples of approximately 100 g of each depth. After transport in cold and dark conditions, samples were frozen at −20°C until the time of their analysis, for which a Coulter LS Variable Speed Fluid Module plus particle size analyzer was used. For the analysis, the sediment from each depth was mixed (depth-integrated 0–5 cm depth) and subsampled into a glass beaker, diluted with freshwater and stirred thoroughly, before being inserted directly into the particle size analyzer’s sample chamber using a pipette dripper to reach an obscuration of between 8 and 12%. Each sample was measured three times to ensure that all size fractions present in the sediment were represented in the output.
To measure bioturbation, four clear Perspex corers (12 × 12 × 40 cm) were pushed directly into box cores also sampled during field campaigns, sealed with plastic, rubber and neoprene seals at each time point, and transported to the laboratory for incubation under the same conditions as the flume cores. Imaging and image analysis methods for the time-lapse images collected during the bioturbation experiments was carried out as described in Queirós et al. (2015b). In short, particle tracing methods were used to measure bioturbation activity and depth of natural communities by use of 2D imaging under UV light of luminophore tracer distributions with images collected at hourly intervals over the course 7 days. Bioturbation activity was defined as the probability of particle displacement and bioturbation depth, or rather distance, and describes the average distance single particles are moved within a single time step. Both were determined by fitting a random-walk bioturbation model (Schiffers et al., 2011) to manually cropped automatically processed time-series using scripts and techniques described in Queirós et al. (2015b).
In addition, community bioturbation potentials (BPc) were calculated from WCO macrofauna abundance and biomass data using mobility and sediment reworking indices from Queirós et al. (2013) and methods outlined in Solan et al. (2004). Community bioirrigation potentials (BIPc) were calculated from the same data based on methods described in Renz et al. (2018) and indices derived from Queirós et al. (2013) as well as from the Marine Ecosystems Research Project Trait Explorer (Bruggeman, 2019). The inferring of potential bioturbation and bioirrigation levels from macrofauna abundance and biomass has been shown to underestimate regional variability based on variations in locally varying dominating species (Gogina et al., 2020). In temporal analyses of single locations with sufficiently diverse communities such as the one at this site (>50 species), BPc calculations are thought to be representative (Queirós et al., 2015b; Neumann and Wrede, 2020).
Additional Data Acquisition
Further supplementary data were gathered from the Meteorological office, the National River Flow Archive, the Permanent Service for Mean Sea Level and Looe Wave buoy services. While the Looe site is more coastal than L4, which is situated in the English Channel, modeling has shown that the wave heights measured in Looe are representative of those occurring at L4 (Cazenave, unpublished data). The insights gained through additions from these sources provide relevant information on the weather conditions, potential riverine input and tidal state, all of which are factors that have previously been shown to affect L4 and the general Plymouth Sound area (Eloire et al., 2010; Leynaert et al., 2011; Milliman and Farnsworth, 2013; Barnes et al., 2015; Smyth et al., 2015b). A complete list of the supplemental data sets used and their respective sources can be found in Supplementary Appendix 1.
Data Analyses
For the purpose of this study, the year was divided into phenological rather than meteorological periods (hereafter simply referred to as periods, Table 1). These periods were based around (a) the occurrence of the spring plankton bloom, as this has been shown to be a highly influential factor driving local intra-annual variability in a number of variables (Graf, 1992; Widdicombe et al., 2010), and (b) the historically more hydrologically active part of the year around winter time. From the WCO phytoplankton abundance and biomass data collection, the average phytoplankton bloom dates at L4 were determined to be between the 12th April and the 28th June, lasting on average 78 days. There can, however, be large variations in bloom timing, magnitude and duration between years, with standard deviations of the start date of 23 days and standard deviations of the bloom ending of 60 days. These data were used to establish the unfolding of phenological seasons at the site across the time-series. Based on this, the bloom period was assigned the months of May and June (Table 1), omitting April into the pre-bloom period as there typically is a delay between initial organic matter production and its interaction with the benthos. The winter period was defined as December to February (Table 1), as this is the time of year during which more than half the storm events that cause significant wave heights above the storm threshold (defined as storms with a ≥0.25 year return period) occur, based on the long-term records (NNRCMP, 2019). The pre-bloom season includes March and April (Table 1) as a period during which the conditions needed for the phytoplankton bloom to occur are established. July to September are defined as the post-bloom season (Table 1), during which thermal water column stratification and nutrient depletion prevail, as described above in Section “The Western Channel Observatory.” Autumn was assigned to the months of October and November as the period following this, a transition period between post-bloom and winter conditions.

Table 1. Splitting of the year into five phenological periods; each period is assigned a number by which it will be referred to here-after.
Variables were combined into a variety of data sub-sets for different parts of the analysis. To gain an understanding of the intra-annual variability of the L4 site as a whole, the complete data set with all variables was used (see Table 2). To investigate individual B/P exchange drivers or processes, variables were selected for analysis based on relationships identified in Rühl et al. (2020; see Table 2 for a list of which variables were included in the determination of which drivers/processes). For example, variables which are known to affect bioirrigation-driven DM B/P exchange processes, were grouped together to assess that particular driver. Many of the variables were of significance in multiple driver groups (e.g., sediment porosity and grain size have an effect on both bioirrigation- and diffusion-driven DM B/P exchanges). Where this was the case (verified through multiple correlation analysis), duplication was eliminated in the data sub set compiled for the investigation of the overall process to avoid an overestimation of any single variable’s relative impact (e.g., grain size was only included once in the assessment of overall DM B/P exchange processes, despite having an impact on several of the drivers).
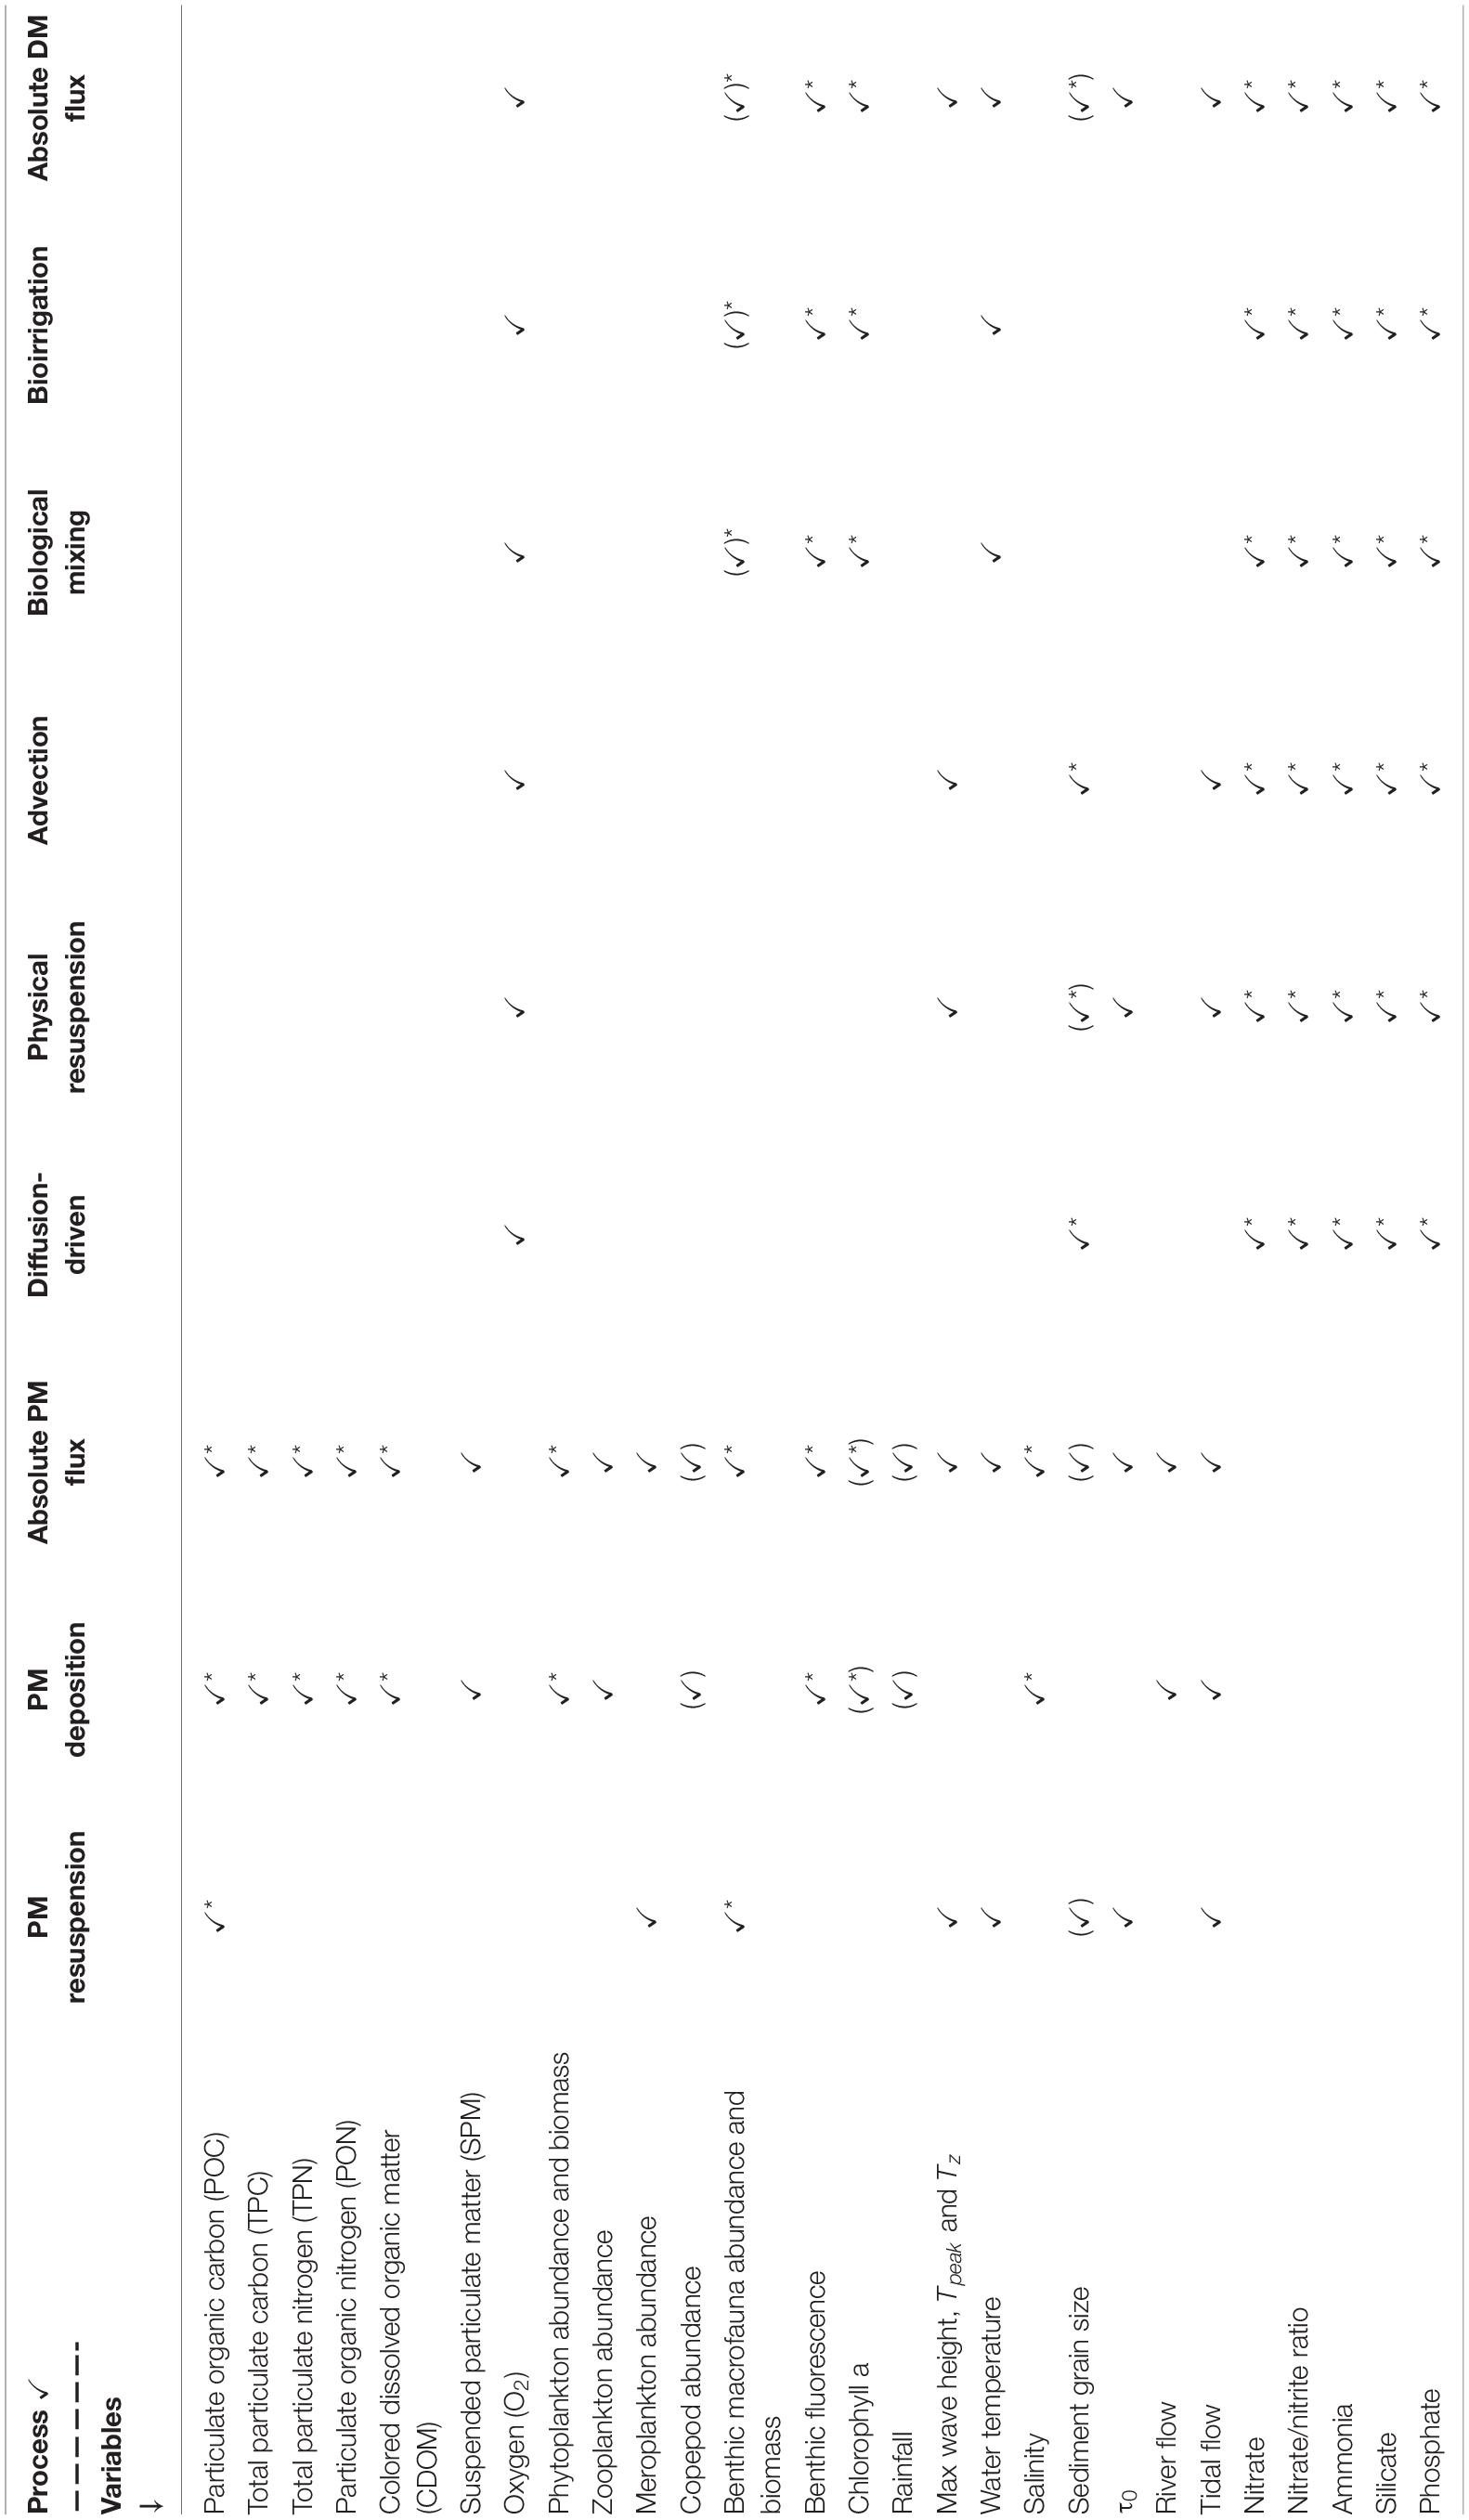
Table 2. Selection of variables into data sub sets corresponding to DM and PM B/P exchange drivers and processes; asterisks indicate variables in which DM and PM exchange processes affect one another (see analysis in section “Interactions Between DM and PM Exchange”).
Data sets were normalized to account for differences in scale and units between variables. To avoid an over-estimation of the impact of variables that are derived from one another (e.g., BPc and BPIc are both dependent on macrofauna biomass), factors considered to be affected by this were selectively excluded. For example, in data sub-sets used as response variables in analysis of similarity tests (ANOSIM; vegan package, Oksanen et al., 2019) and Orthogonal Partial Least Squares discriminant analyses (OPLS, ropls package; Thévenot et al., 2015), where both BPc and benthic macrofauna biomass were considered of importance, the latter was excluded, as it was already considered through the inclusion of BPc. Factors which were excluded through these considerations are indicated by brackets around their ticks in Table 2. Rain fall and Copepod abundance data, which through this was not considered directly in any of the data analyses, was used to aid in the interpretation of the results.
To address the first aim of the study and assess periodic intra-annual variability in environmental variables that drive DM or PM B/P exchange, datasets were tested using ANOSIM. For all ANOSIM tests, the five periods (see Table 1) were applied as the predictors and the respective groups of variables grouped into drivers and processes (see Table 2) were used as responses (see Supplementary Appendix 4 for a table detailing the specific predictor and response groups for each ANOSIM test). Initially the complete set of variables was tested, to assess intra-annual variability at this location in general. To determine cause-effect relationships, and identify which factors are most important for inter-periodic variability, OPLS were then applied. OPLS were chosen due to their suitability for in between-class discrimination when large within-class variation may be present, and to allow incorporation of the various data sets to equal degrees (Bylesjö et al., 2006). Within the OPLS, the month groups into which the data had been averaged (see data sets in Supplementary Appendix 2) or during which the data had been collected (see data sets in Supplementary Appendix 1) was applied as the class by which differences between dataset sub-groups were identified (for listing of predictors and responses of each model see Supplementary Appendix 5). Factors that contributed significantly to the model fit were identified by Variable Influence on Projection (VIP) values > 1. VIP values reflect loading weights of each model component as well as quantifying the variability of the response explained by the components (Mehmood et al., 2012).
Particulate organic carbon and DIN were chosen as model examples for PM and DM exchanges, respectively, based on data availability and quality. The inter-periodic variability of POC and DIN was investigated using ANOSIM testing, to gain an understanding of the specific periodic fluctuations of the solute and particulate example specimens chosen for this study. Where periodic intra-annual patterns in DIN or POC were expected to be linked to other environmental parameters, based on causal relationships identified in the literature, this was tested using Pearson’s correlation coefficient (Pearson, 1895).
Addressing the second study aim, net patterns in B/P exchange drivers and processes following the phenological periods were identified through directed OPLS modeling of the various data sub-sets (see Table 2). The third study aim, evaluating temporal variation in the relative influence of different driver groups, was achieved through the alignment of the temporal variation of the drivers within a year, with that of the overall processes. Recognition of particularly influential drivers and factors was accomplished through the identification of factors which contribute significantly to the intra-annual variation (VIP > 1). Identification of intra-annual temporal patterns and drivers through the OPLS modeling then facilitated the further testing of individual drivers of specific interest for inter-periodic variability in B/P exchanges using ANOSIM. As the ways in which DM and PM exchange processes overlap and influence one another, individual pairs of drivers of DM and PM (and associated secondary driving factors) that have been identified as such (one-way or both ways; see Rühl et al., 2020) were analyzed jointly using crossed two-way ANOSIM (see response variables marked with asterisks in Table 2).
To correct for potential familywise errors created through the repeated inclusion and analysis of the same variables in the various data sub-sets and tests, the Bonferroni correction was applied to p-values of ANOSIM tests, to adjust the alpha levels (Cabin and Mitchell, 2000). Bonferroni was chosen due to the large number of ANOSIM tests carried out on different parts of the same data set. To avoid the introduction of Type II errors, alpha levels were adjusted separately for analyses specific to DIN or POC (to p = 0.01, see tests in section “Periodic Intra-Annual Variation in Individual Environmental Variables”), and analyses of either the complete data set or the sub-sets specified in Table 2 (p = 0.002, see first test in section “Periodic Intra-Annual Variation in Individual Environmental Variables” and tests in section “Intra-Annual Periodic Variation in Drivers of B/P Exchange”), based on suggestions in Armstrong (2014). Statistical analyses were carried out using cran R (R Core Team, 2019) and PRIMER (PRIMERe version 7, Quest Research Limited).
Results
Periodic Intra-Annual Variation in Individual Environmental Variables
When all variables collected were considered, significant differences between the five periods were clear (ANOSIM, R = 0.906, p = 0.0001; for response and predictor variable details see Supplementary Appendix 4, test 1). Variation in the data throughout the year could be attributed to this (OPLS, R2X = 0.683, R2Y = 0.989, Q2Y = 0.945, pR2Y = 0.05, pQ2Y = 0.05). Variables which contributed significantly to the OPLS model fit are numerous, indicating that many of the variables considered in this study vary between the temporal periods defined in this study (VIP > 1, see Supplementary Appendix 5). VIPs include (in order of decreasing significance): Wave height, Silicate concentration in the water column, river flow rates, wave duration, phytoplankton abundance, water column phosphate concentration, nitrate:nitrite ratio, and ammonia concentration, surface SPM, near-bottom ammonia concentration and nitrate:nitrite ratio, phytoplankton biomass and wave peak period, near-bottom phosphate concentration, tidal flow, near-bottom fluorescence, critical shear stress, sediment OC content at 2–3 and 1–2 cm depth, SPM at 10 m depth, benthic macrofauna biomass, and finally near-bottom salinity and PAR.
Dissolved inorganic nitrite concentration at L4 follows periodic patterns of depletion through the annual phytoplankton bloom (bloom and post-bloom periods) and subsequent replenishment through water column destratification (autumn; see Figure 2 top) during which the distribution of DIN throughout the water column varies significantly (ANOSIM, R = 0.446, p = 0.013; see Supplementary Appendix 4, test 2). The potential of shear-stress driven DIN flux measured in the flume experiment shows that this is also intra-annually variable (ANOSIM, R = 0.608, p = 0.005; see Supplementary Appendix 4, test 3), as was already indicated by OPLS model 1 (see Supplementary Appendix 5). Shear-stress driven fluxes switch from a release of DIN from the sediment during the pre-bloom period, to an influx from the water into the sediment during the bloom (see Figure 2 bottom). It must be noted that while the results of these experiments show that the potential for shear stress-driven DIN fluxes is temporally variable, it is unlikely that the required near-bed velocities are reached during all periods (Uncles et al., 2015).
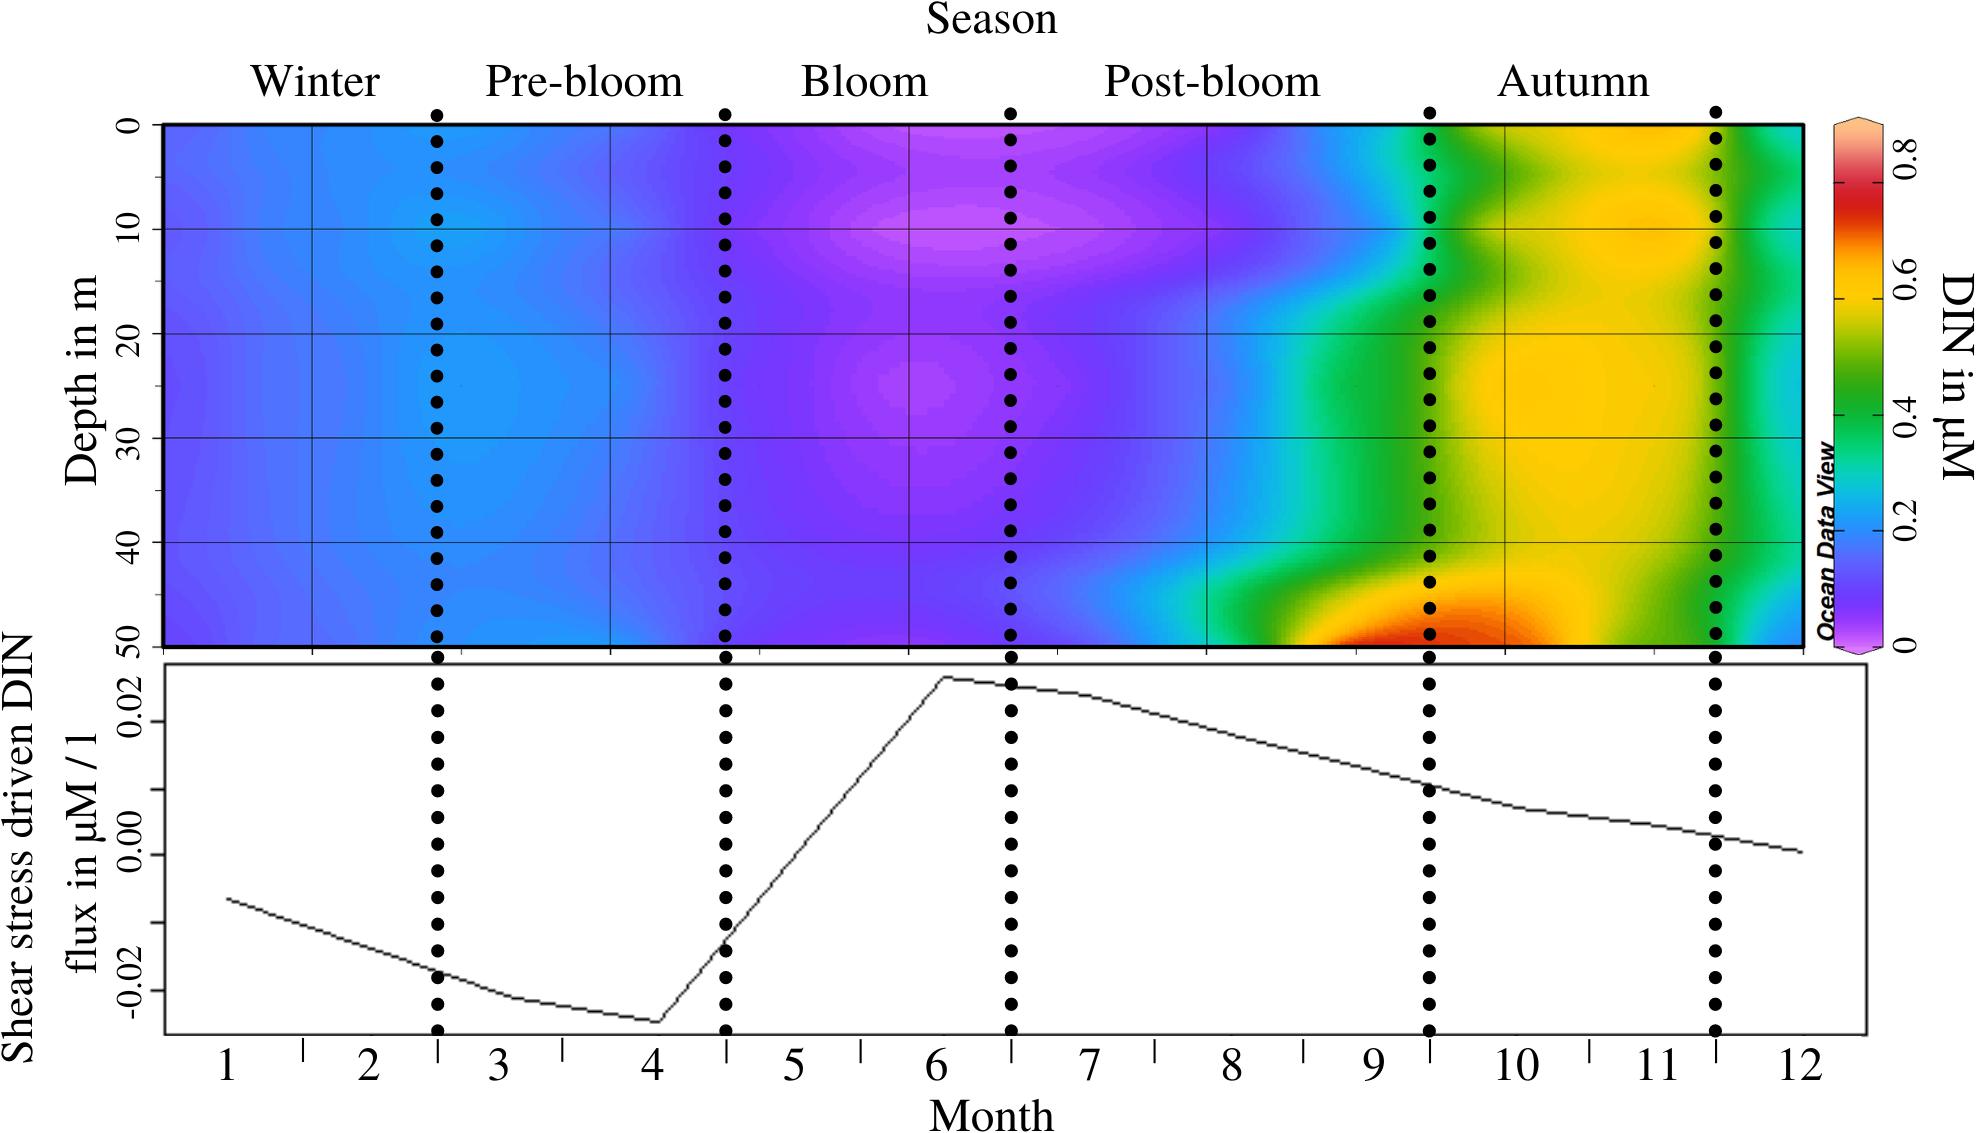
Figure 2. Top panel: Nitrite concentration throughout the water column at 0 m, 10 m, 25 m, and 50 m depth by month, during an “average year’s” cycle; Periods as indicated through the dotted lines are labelled at the top of the figure; Monthly resolution (x-axis) shown to illustrate concentration at 0, 10, 25, 30, and 50 m depth (y-axis); Bottom panel: Resuspension-driven B/P flux potential of Nitrite throughout the year, at critical erosion velocity; Negative values indicate influx from the water to the sediment and vice versa.
The distribution of POC throughout the water column also varies throughout the periods (ANOSIM, R = 0.501, p = 0.004; see Supplementary Appendix 4, test 4). The generally low levels of POC in the water column are interrupted by surface maximums throughout winter. This is linked to riverine influx, which is particularly strong during this period (Pearson’s, t = 2.9558, p = 0.01439; see also Uncles et al., 2015). Concentrations in the nepheloid layer near the seabed, though generally higher than water-column levels throughout the year, are elevated in post-bloom and autumn periods (Figure 3, top) following the deposition of organic matter after the end of the phytoplankton bloom (Pearson’s, t = −2.361, p = 0.03989). Within the sediment, the concentration of POC also changes with the periods (ANOSIM, R = 0.45, p = 0.004; see Supplementary Appendix 4, test 5), exhibiting high levels of POC in winter and autumn as well as a brief sediment surface maximum during the bloom and high levels of POC below 2 cm toward the end of winter (Figure 3, middle). The surface maximum in the bloom period is connected to the deposition of organic matter from the phytoplankton bloom. Peaks in POC concentration within the sediment in November and, especially intensely, February, are less clear, but are likely to be connected to riverine sources of POC, based on a previously published study of riverine influences in this area (Uncles et al., 2015). Sedimentary POC at 3–5 cm depth was positively correlated to benthic macrofauna biomass (Pearson’s, t = 2.2949, p = 0.04739) but not to bioturbation potential, activity, or depth. A potential correlation with bacterial activity (as seen in Tait et al., 2015) could not be explored as no microbial data was available for inclusion in this study. Shear-stress induced flux potential of POC across the sediment-water boundary does not exhibit periodic changes in direction, but rather in magnitude (Figure 3, bottom; ANOSIM, R = 0.635, p = 0.004; see Supplementary Appendix 4, test 6). Similarly to the shear-stress driven DIN flux in Figure 2, the POC fluxes in Figure 3 represent not necessarily fluxes that are present in the natural environment throughout the entire year, but rather the potential magnitude and direction of shear-stress-driven fluxes, given a high enough near-bed water velocity.
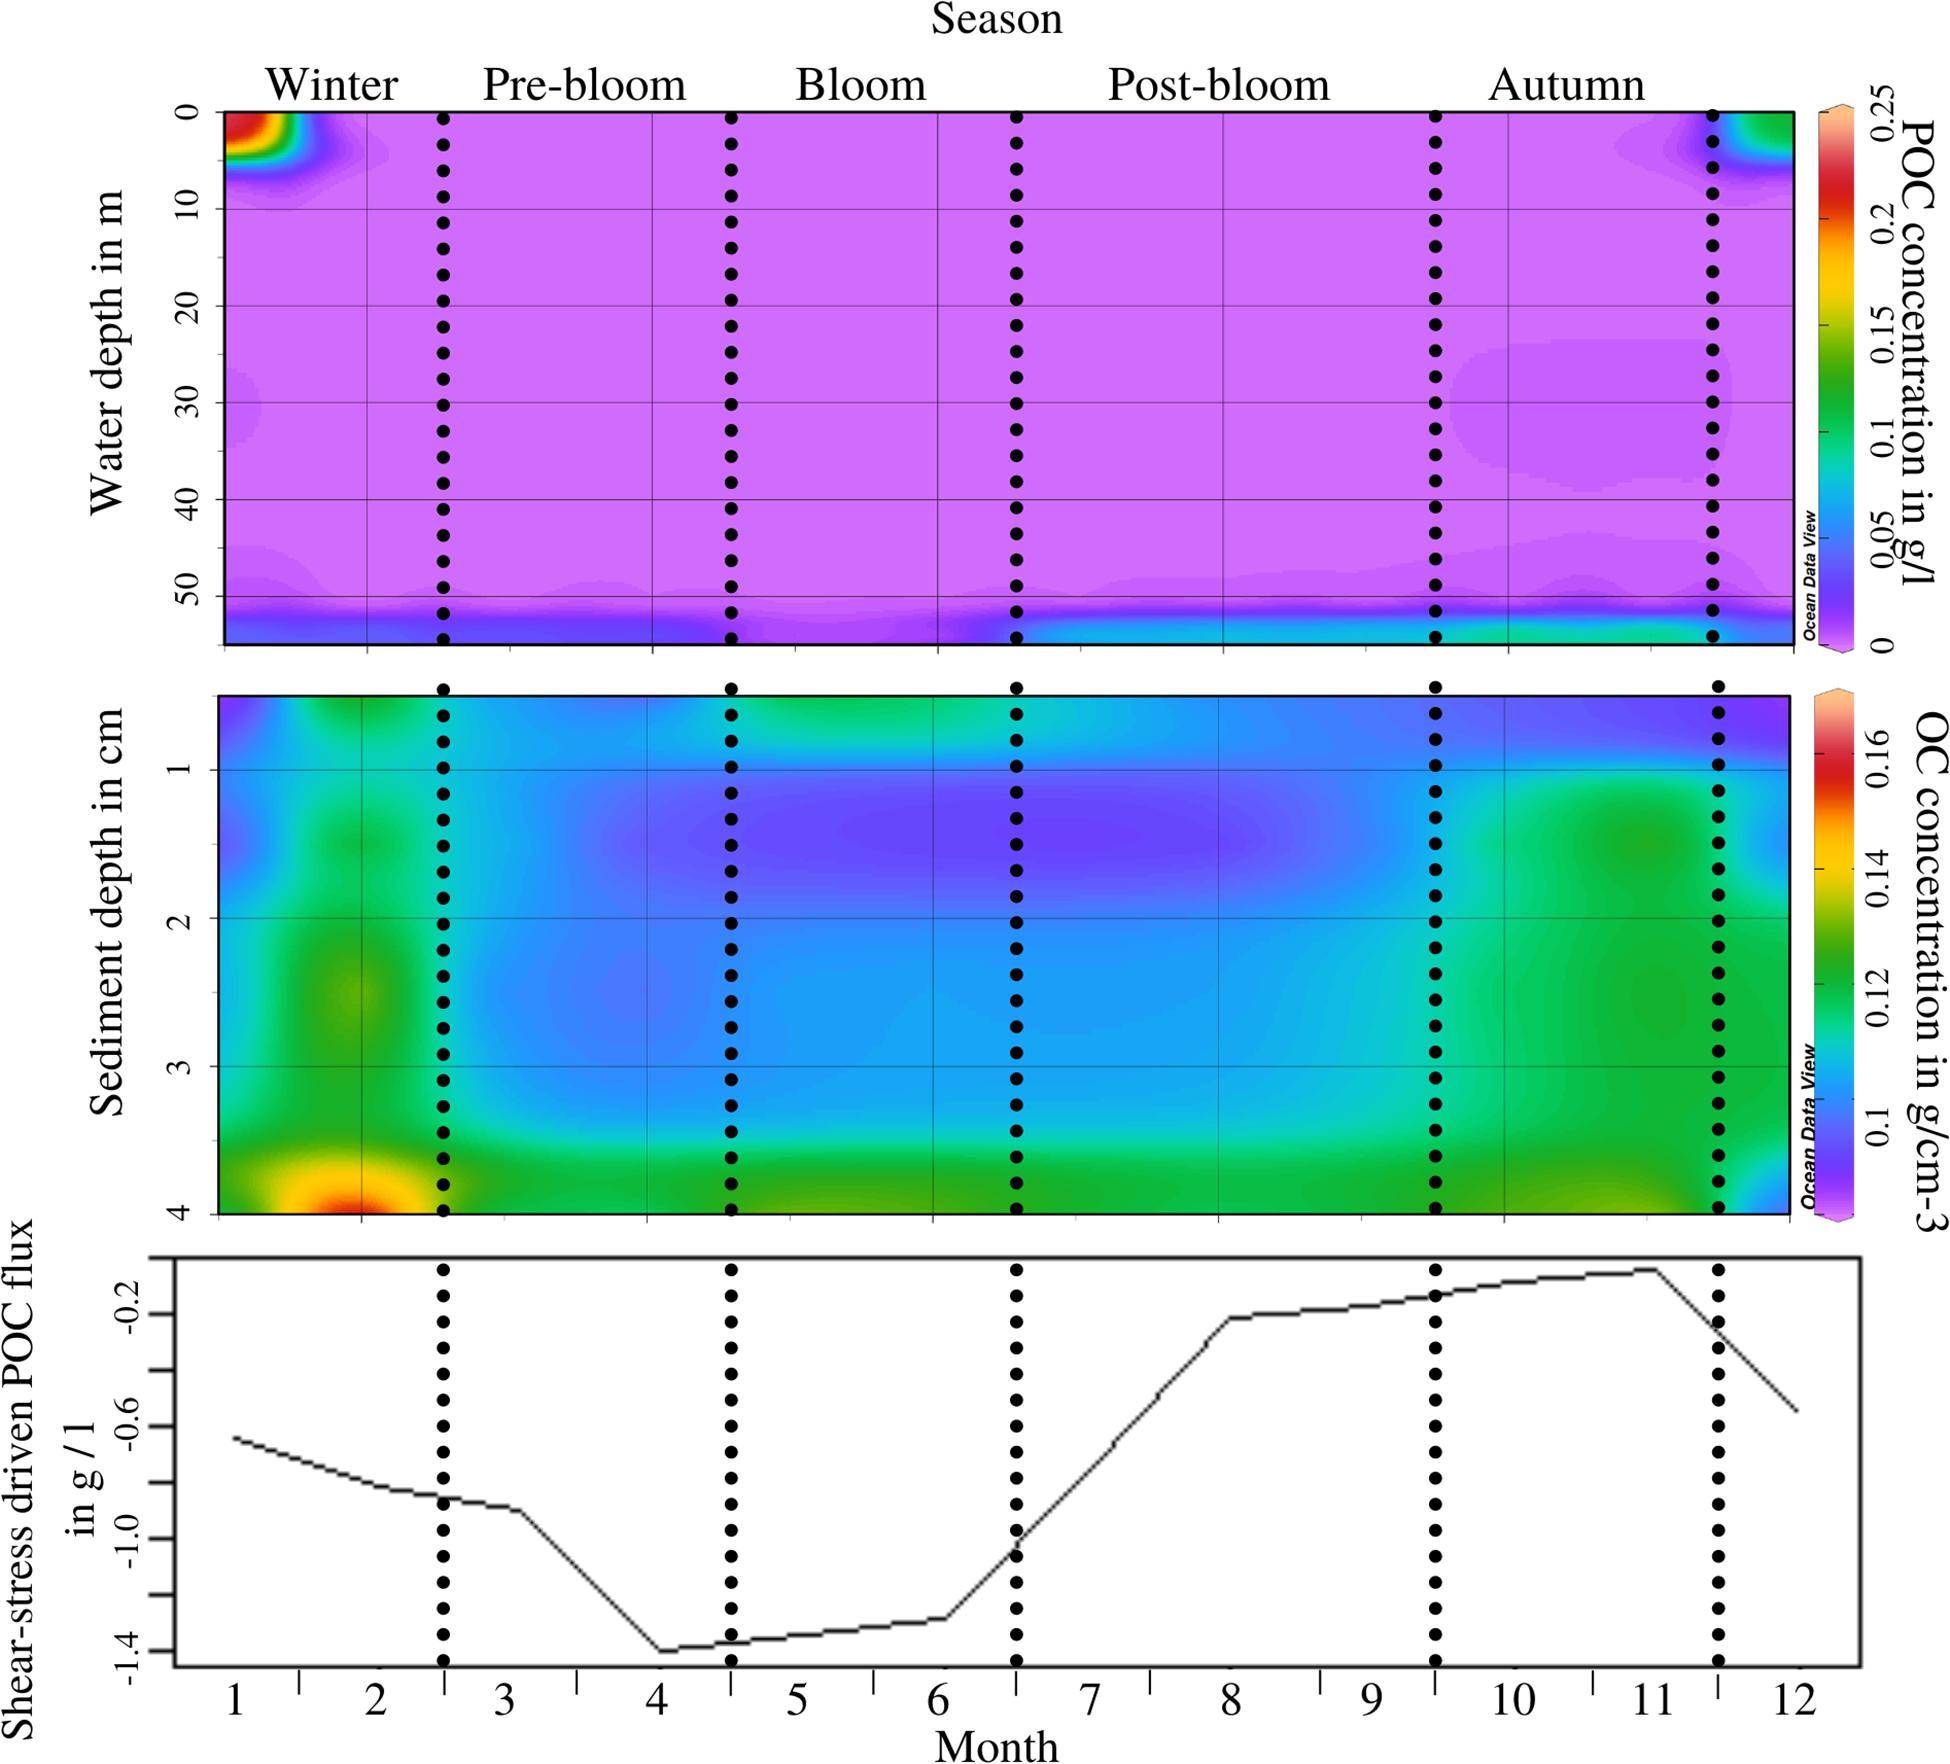
Figure 3. Top panel: POC concentration throughout the water column (depth scale from the surface on the Y-axis) by month, recorded during 2017/2018, including the nepheloid layer which is displayed at 54 m depth; Periods as indicated through the dotted lines are labelled at the top of the figure; Middle panel: POC concentration in the sediment (depth scale from the sediment surface (0) downwards on the Y-axis) by month; Bottom panel: Resuspension-driven B/P flux potential of POC from the water to the sediment throughout the year measured during flume experiments at critical erosion velocity; the consistently negative values indicate that the overall flux direction does not change, only its magnitude.
Intra-Annual Periodic Variation in Drivers of B/P Exchange
DM Flux (of DIN)
Intra-annual patterns of DM B/P exchanges and the variables driving it (as identified in Rühl et al., 2020, see Table 2) were investigated by focusing on DIN flux as an example.
Biological-mixing driven DM B/P exchange
There were no significant differences between the different periods (ANOSIM, R = 0.602, p = 0.003; see Supplementary Appendix 4, test 7; OPLS, R2X = 0.694, R2Y = 0.971, Q2Y = 0.623, pR2Y = 0.15, pQ2Y = 0.2; Supplementary Appendix 5, model 2). The OPLS model did, however, highlight a distinction between two groupings, winter and pre-bloom versus bloom to autumn periods, due to the rates of biological mixing being significantly larger in the second group than in the first. Variables of influence on the intra-annual variability of biological mixing were not only bioturbation activity and BPc, but also the water temperature at depth (as warmer temperatures lead to higher levels of faunal activity (Kinne, 1970) and mean sediment grain size in the top 0–1 and 1–2 cm. The latter parameter may be related to biological mixing conversely to what the model suggests as it is known that biogenic sediment mixing can alter grain size (Ginsburg and Lowenstam, 1958).
Advective flushing driven DM B/P exchange
Significant differences in advective flushing could be found between periods (ANOSIM, R = 0.891, p = 0.0001; see Supplementary Appendix 4, test 8; OPLS, R2X = 0.657, R2Y = 0.775, Q2Y = 0.655, pR2Y = 0.05, pQ2Y = 0.05; Supplementary Appendix 5, model 3). The potential for advective flushing was higher in the colder half of the year (autumn and winter) when sediment density below the surface is lower and waves are higher and have longer peak periods and durations. This is a simple physical effect, wherein stronger shear stresses caused by increased wave action, in a less densely packed sediment, are more likely to lead to advective flushing.
Bioirrigation driven DM B/P exchange
A significant intra-annual difference in bioirrigation, and factors affecting bioirrigation levels, could be found (ANOSIM, R = −0.446, p = 0.0013; see Supplementary Appendix 4, test 9; OPLS, R2X = 0.476, R2Y = 0.76, Q2Y = 0.417, pR2Y = 0.15, pQ2Y = 0.05). The OPLS indicated that the periodic variability of bioirrigation may be a product of the benthic animals’ rates of activity, which is higher when more or larger animals live at elevated temperatures (water temperature VIP > 1, see Supplementary Appendix 5), such as the conditions from bloom time to autumn provide.
Diffusive flux driven DM B/P exchange
There were significant differences in diffusive flux and factors affecting diffusive flux between periods (ANOSIM, R = 0.875, p = 0.0002; see Supplementary Appendix 4, test 10). The OPLS model also showed a clear separation between the periods with only minor overlap between winter and pre-bloom (OPLS, R2X = 0.954, R2Y = 0.975, Q2Y = 0.87, pR2Y = 0.05, pQ2Y = 0.05; Supplementary Appendix 5, model 5). The OPLS highlights a grouping of winter to pre-bloom periods as well as post-bloom and autumn periods and a slight overlap of the bloom period into July, which was classed as post-bloom period. Factors shaping the model were O2 and Nitrite concentration at depth and the density of the top 0–1 and 1–2 cm layers of sediment. Nutrient concentrations in the water column are known to fluctuate, driven by a depletion-replenishment cycle coupled to the pelagic phytoplankton bloom (Aiken et al., 2004; Smyth et al., 2010). The resulting concentration gradient between pelagic and benthic environments is what seems to be driving the intra-annually variable diffusion of solutes across the sediment-water boundary.
Physical resuspension driven DM B/P exchange
Overall, no significant difference in physical resuspension between the periods could be detected (ANOSIM, R = 0.899, p = 0.0001; see Supplementary Appendix 4, test 11), but the OPLS model showed some grouping and separation of the different periods (OPLS, R2X = 0.901, R2Y = 0.982, Q2Y = 0.959, pR2Y = 0.05, pQ2Y = 0.05; Supplementary Appendix 5, model 6). There was a clear difference between winter, pre-bloom and autumn periods versus bloom and post-bloom, with a higher potential for physical resuspension in the former group. As the model was shaped by hydrodynamic factors (wave period and duration; tidal flow) this may be attributable to the higher amounts of dynamic energy and shear stress the seabed is exposed to in winter, pre-bloom and autumn. The hydrological environment at L4 is known to be more dynamic in winter, when the water column isn’t stratified and storm events are more frequent and stronger, causing stronger mixing (Smyth et al., 2010; NNRCMP, 2019).
Net DM B/P exchange
Based on the results detailed above, the relative importance of the five drivers of benthic/pelagic solute exchange varies throughout the year. Physical resuspension and advective flushing are dominating the exchange in winter, diffusion is most influential during pre-bloom, and biological mixing and bioirrigation dominate starting during the bloom but most importantly in the post-bloom period. The dominance switches from physical to biological drivers early on in the bloom, and back again mid-way through autumn (see Figure 4).
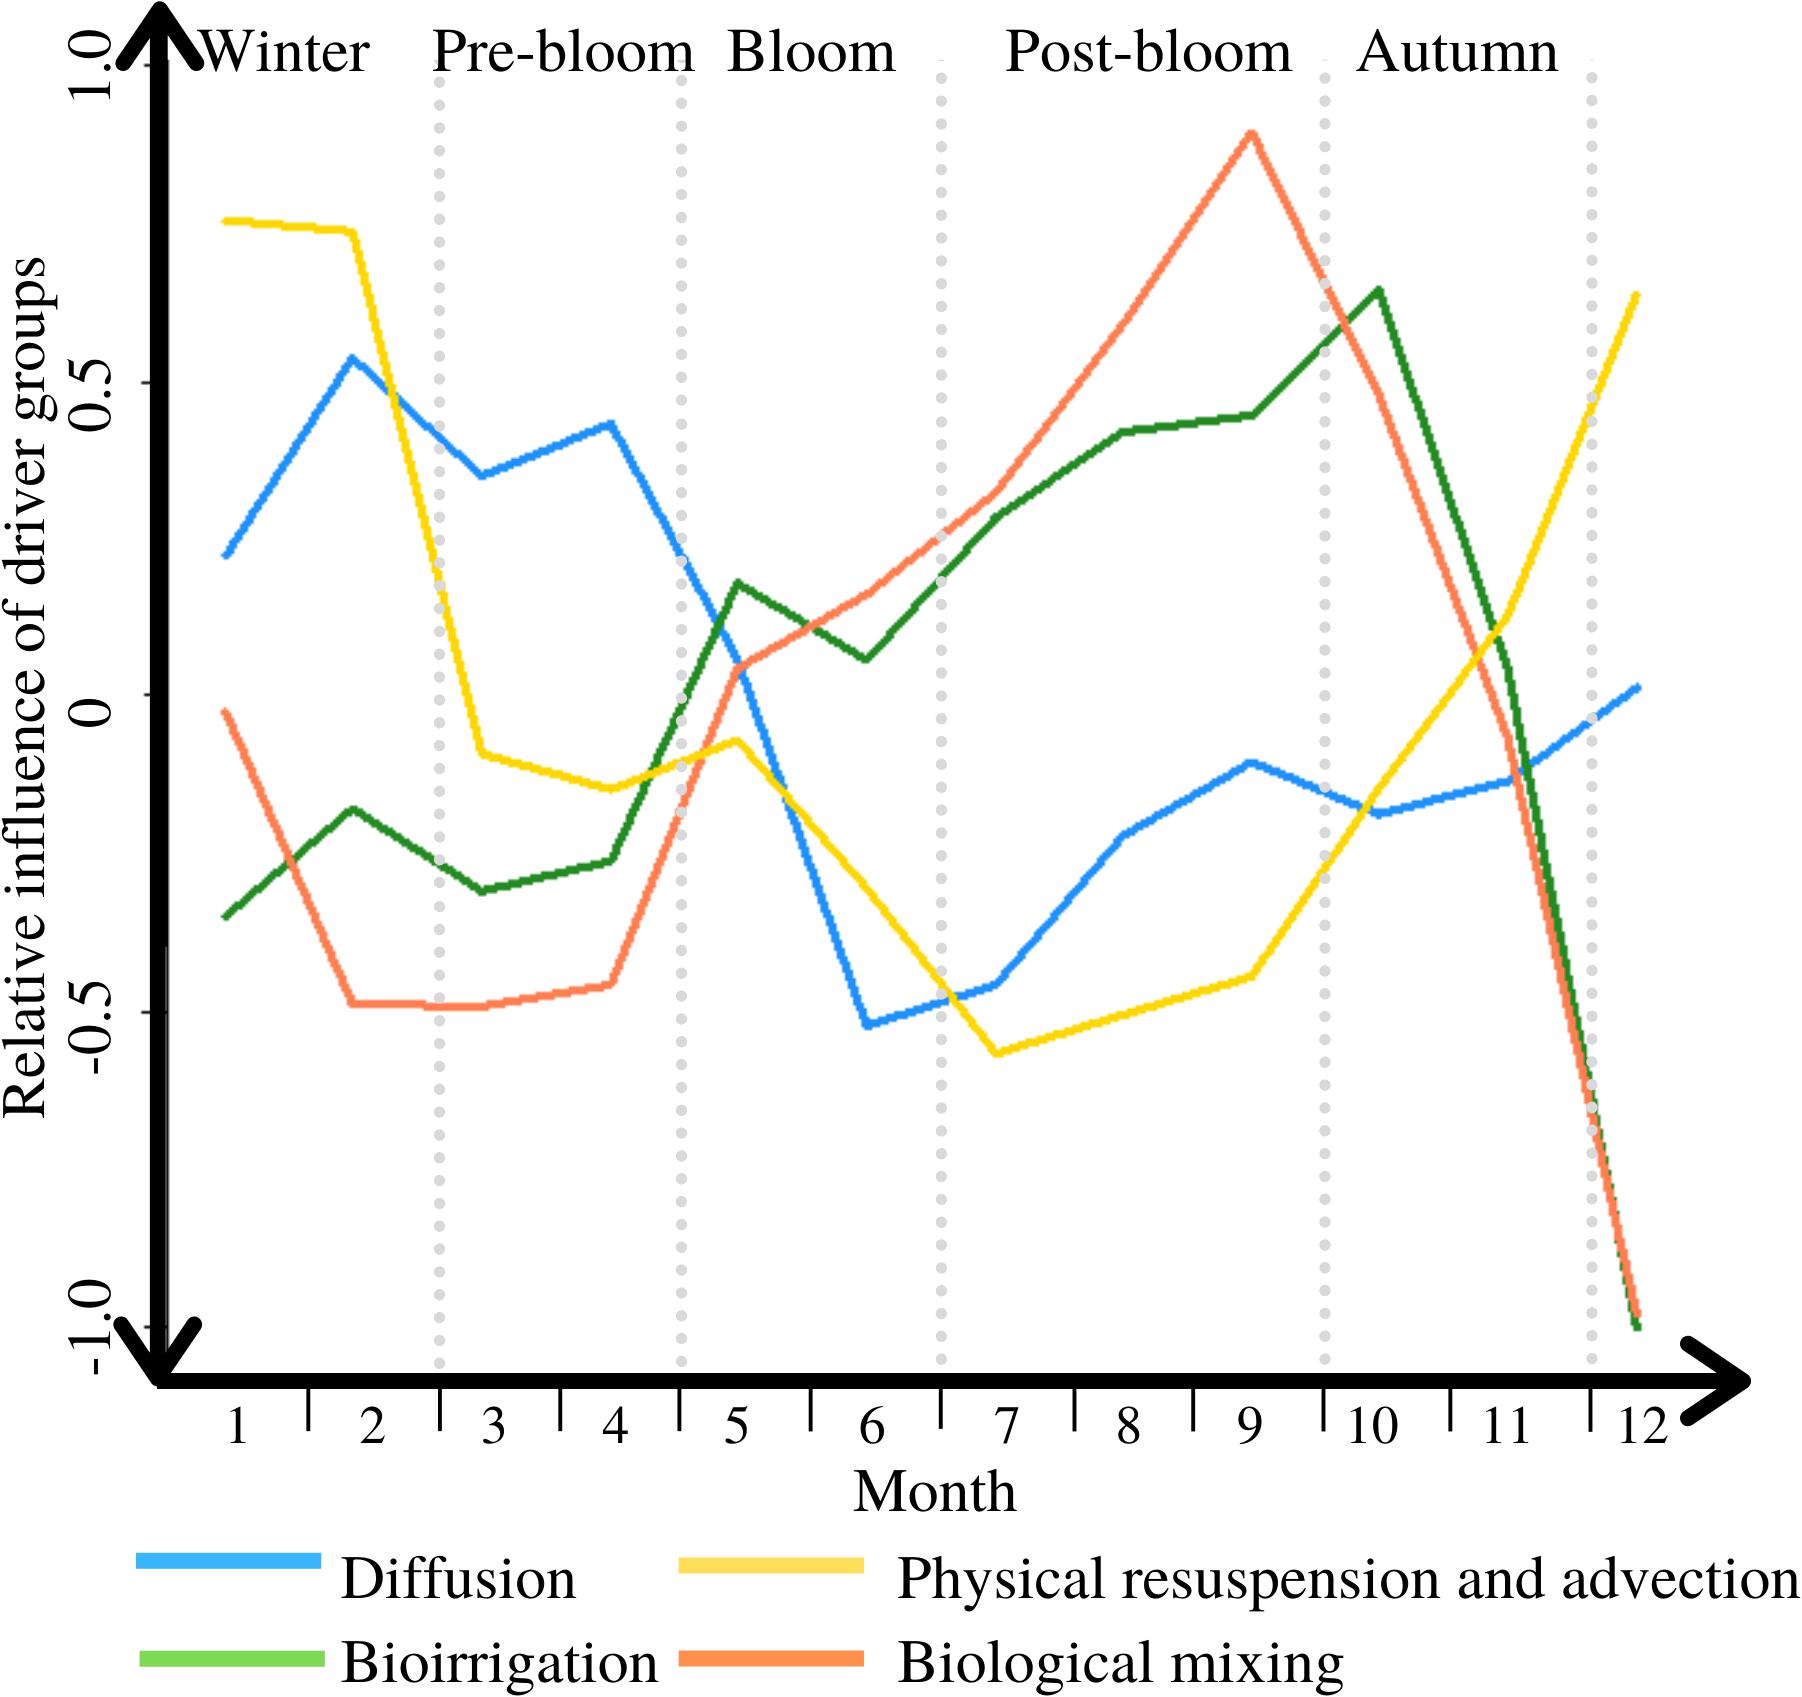
Figure 4. The variable influence of the DM exchange drivers throughout a typical year, between 1 = completely dominant, and −1 = irrelevant; periods are marked through light grey vertical dotted lines.
As advectively driven and physical resuspension-driven B/P DM flux were both dominated by hydrodynamic elements, these two drivers shared the same pattern of intra-annually variable impact relative to the other drivers. The inter-play of physical and biological drivers of DM B/P exchange throughout the periods leads to a distinct cycle of directional changes between upward and downward DM fluxes (see Figure 5).
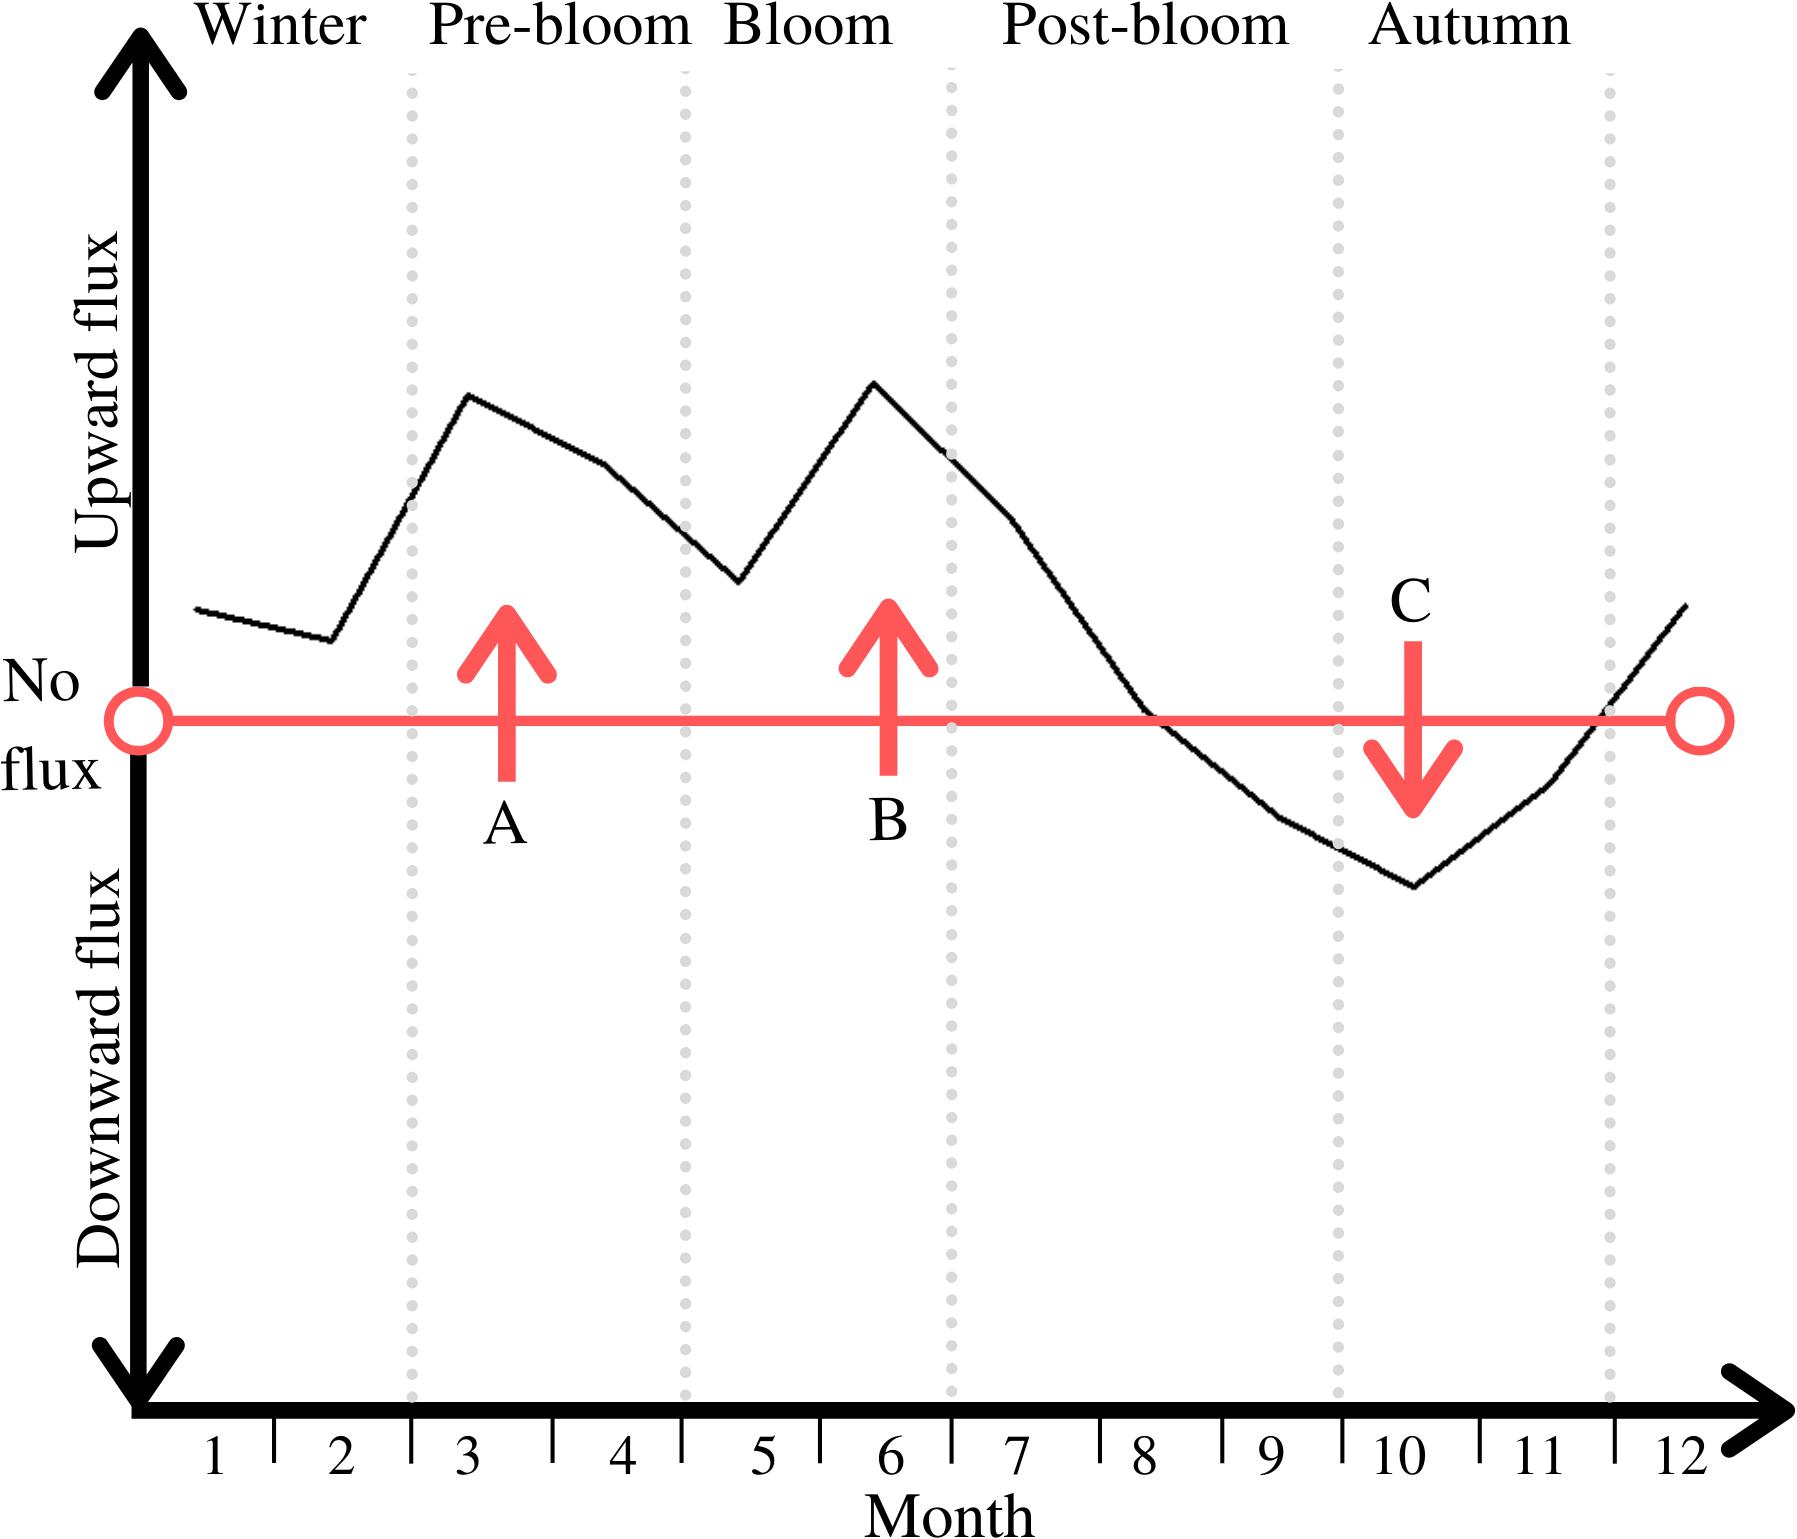
Figure 5. Direction of net DM B/P exchange throughout the five periods; periods are marked through light grey vertical dotted lines; notable peaks are labelled A, B and C.
The first peak in this cycle (see peak A in Figure 5) is an upward flux of DM, likely shaped by diffusion driven fluxes (see Figure 4). Advective and physical resuspension drivers may also play a role in this overall upward flux, through for example the physical flushing out of buried DIN, though less so than diffusion (see Figure 4). Nutrients from the organic matter that had been deposited on the seafloor in the previous bloom period have been mostly remineralized at this time of year (Hansen et al., 1981). Low concentrations of dissolved O2 in late summer and autumn can inhibit nitrification processes, but throughout the winter, well mixed conditions facilitate optimal conditions for DIN replenishment (Boynton et al., 2017). The resulting nutrient concentration gradient between seafloor and water column prompts this upward flux, and coupled with the high levels of hydrodynamic energy and river flow in winter and pre-bloom periods, this leads to the replenishment of nutrients in the water column (Justic et al., 1995; Barnes et al., 2015).
The upward directed flux starting during the bloom period and lasting half-way into post-bloom (see peak B in Figure 5) is associated with the phytoplankton bloom in the water column as this is known to deplete pelagic nutrients, thus facilitating a replenishment from benthic sources and therefore upward flux (e.g., Howarth, 1988; Cullen et al., 1992). Lastly, the direction of DM B/P exchanges changes in post-bloom and a peak period of downward directed DIN transport occurs in autumn (see peak C in Figure 5). This corresponds to the biogenic uptake of DM through biological mixing and bioirrigation, and subsequent incorporation of DM in the benthos. Biological activity is at its peak during this time (see Figure 4), and has thus the greatest impact on the direction and magnitude of overall DM B/P exchange processes.
POC Flux
Intra-annual patterns of PM B/P exchange and the variables driving it (as identified in Rühl et al., 2020; see Table 2) were investigated for the example of POC flux.
Upward transport and resuspension of particulates
There are significant periodic intra-annual differences in the factors that directly and indirectly influence resuspension (ANOSIM, R = 0.708, p = 0.0001; see Supplementary Appendix 4, test 12; OPLS, R2X = 0.449, R2Y = 0.775, Q2Y = −0.241, pR2Y = 0.15, pQ2Y = 0.5). The OPLS model fit was shaped most distinctly by wave height, period and duration, closely followed by critical shear stress and sediment density. However, sedimentary POC content, bottom water POC concentration, and bioturbation depth also played a role (see Model 7 VIP scores in Supplementary Appendix 5). This indicates that variations in the resuspension and upward transport of PM are affected by both hydrodynamic and biological parameters. Considering that the L4 environment has been shown to be more biologically active in the warmer half of the year (Smyth et al., 2015b) and that wave heights, peak periods and durations are typically higher in the winter months (NNRCMP, 2019), it can be assumed that the hydrodynamics are driving PM upward fluxes in winter and biological drivers take over in summer.
Downward transport and deposition of particulates
There were strong periodic intra-annual differences in PM deposition (ANOSIM, R = 0.934, p = 0.0001; see Supplementary Appendix 4, test 13), however the OPLS model did not show a clear Periodic separation (OPLS, R2X = 0.604, R2Y = 0.57, Q2Y = −0.222, pR2Y = 0.7, pQ2Y = 0.345). The model fit was most strongly driven by tidal flow, followed by suspended matter and POC concentrations throughout the water column at all depths except the one closest to the seafloor. Water temperature and river flow also played a role (see Model 8 VIP scores in Supplementary Appendix 5). When all factors that directly or indirectly drive PM deposition are considered, bloom and post-bloom periods are distinct from the others as times of higher deposition rates. In the model, pre-bloom and bloom times were separated from the others. The main reason for this divide is that during these two periods, a larger amount of SPM and less dynamic hydrographic forces are present in the water column than at other times in the year. Overall this suggests that depositional flux at this site is proportional to the amount of suspended material: the more suspended matter there is the more can be deposited. There are large inputs of suspended matter into the water column through pelagic primary production in summer and riverine and resuspension input in winter (Dobrynin et al., 2010; Widdicombe et al., 2010). This is likely the reason, why no significant periodic intra-annual variation in downward B/P flux could be identified: although the flux is unlikely to be constant, it is largely independent on the periods as there is always some material in suspension. To focus more specifically on POC, SPM concentrations (which include both organic and inorganic particulates) were excluded and the model run was repeated. The resulting OPLS showed a clear separation between pre-bloom, bloom and post-bloom periods while autumn and winter periods were separate from the rest but grouped together (OPLS, R2X = 0.749, R2Y = 0.865, Q2Y = 0.048, pR2Y = 0.15, pQ2Y = 0.3). This model was still influenced by POC concentrations at 0, 20, 30, and 40 m depth, but also by tidal and river flow, wave height, chlorophyll a concentration and zooplankton abundance (see Supplementary Appendix 5, Model 8a for VIP scores). This indicates that diel vertical migration, based on the additional copepod data most likely of copepods, in relation to the phytoplankton bloom reflected in the chlorophyll data plays a role in POC deposition, in addition to the factors previously mentioned to be impacting POC concentration in the water column and thereby the potential for downward transport and deposition.
Net PM B/P exchange
Overall these results indicate that inter-periodic differences in benthic/pelagic POC exchange at L4 are reflected in both deposition and resuspension. Comparing the intra-annual temporal variation in the net upward and downward fluxes, shows that the two alternate in terms of relative importance throughout the year (see Figure 6).
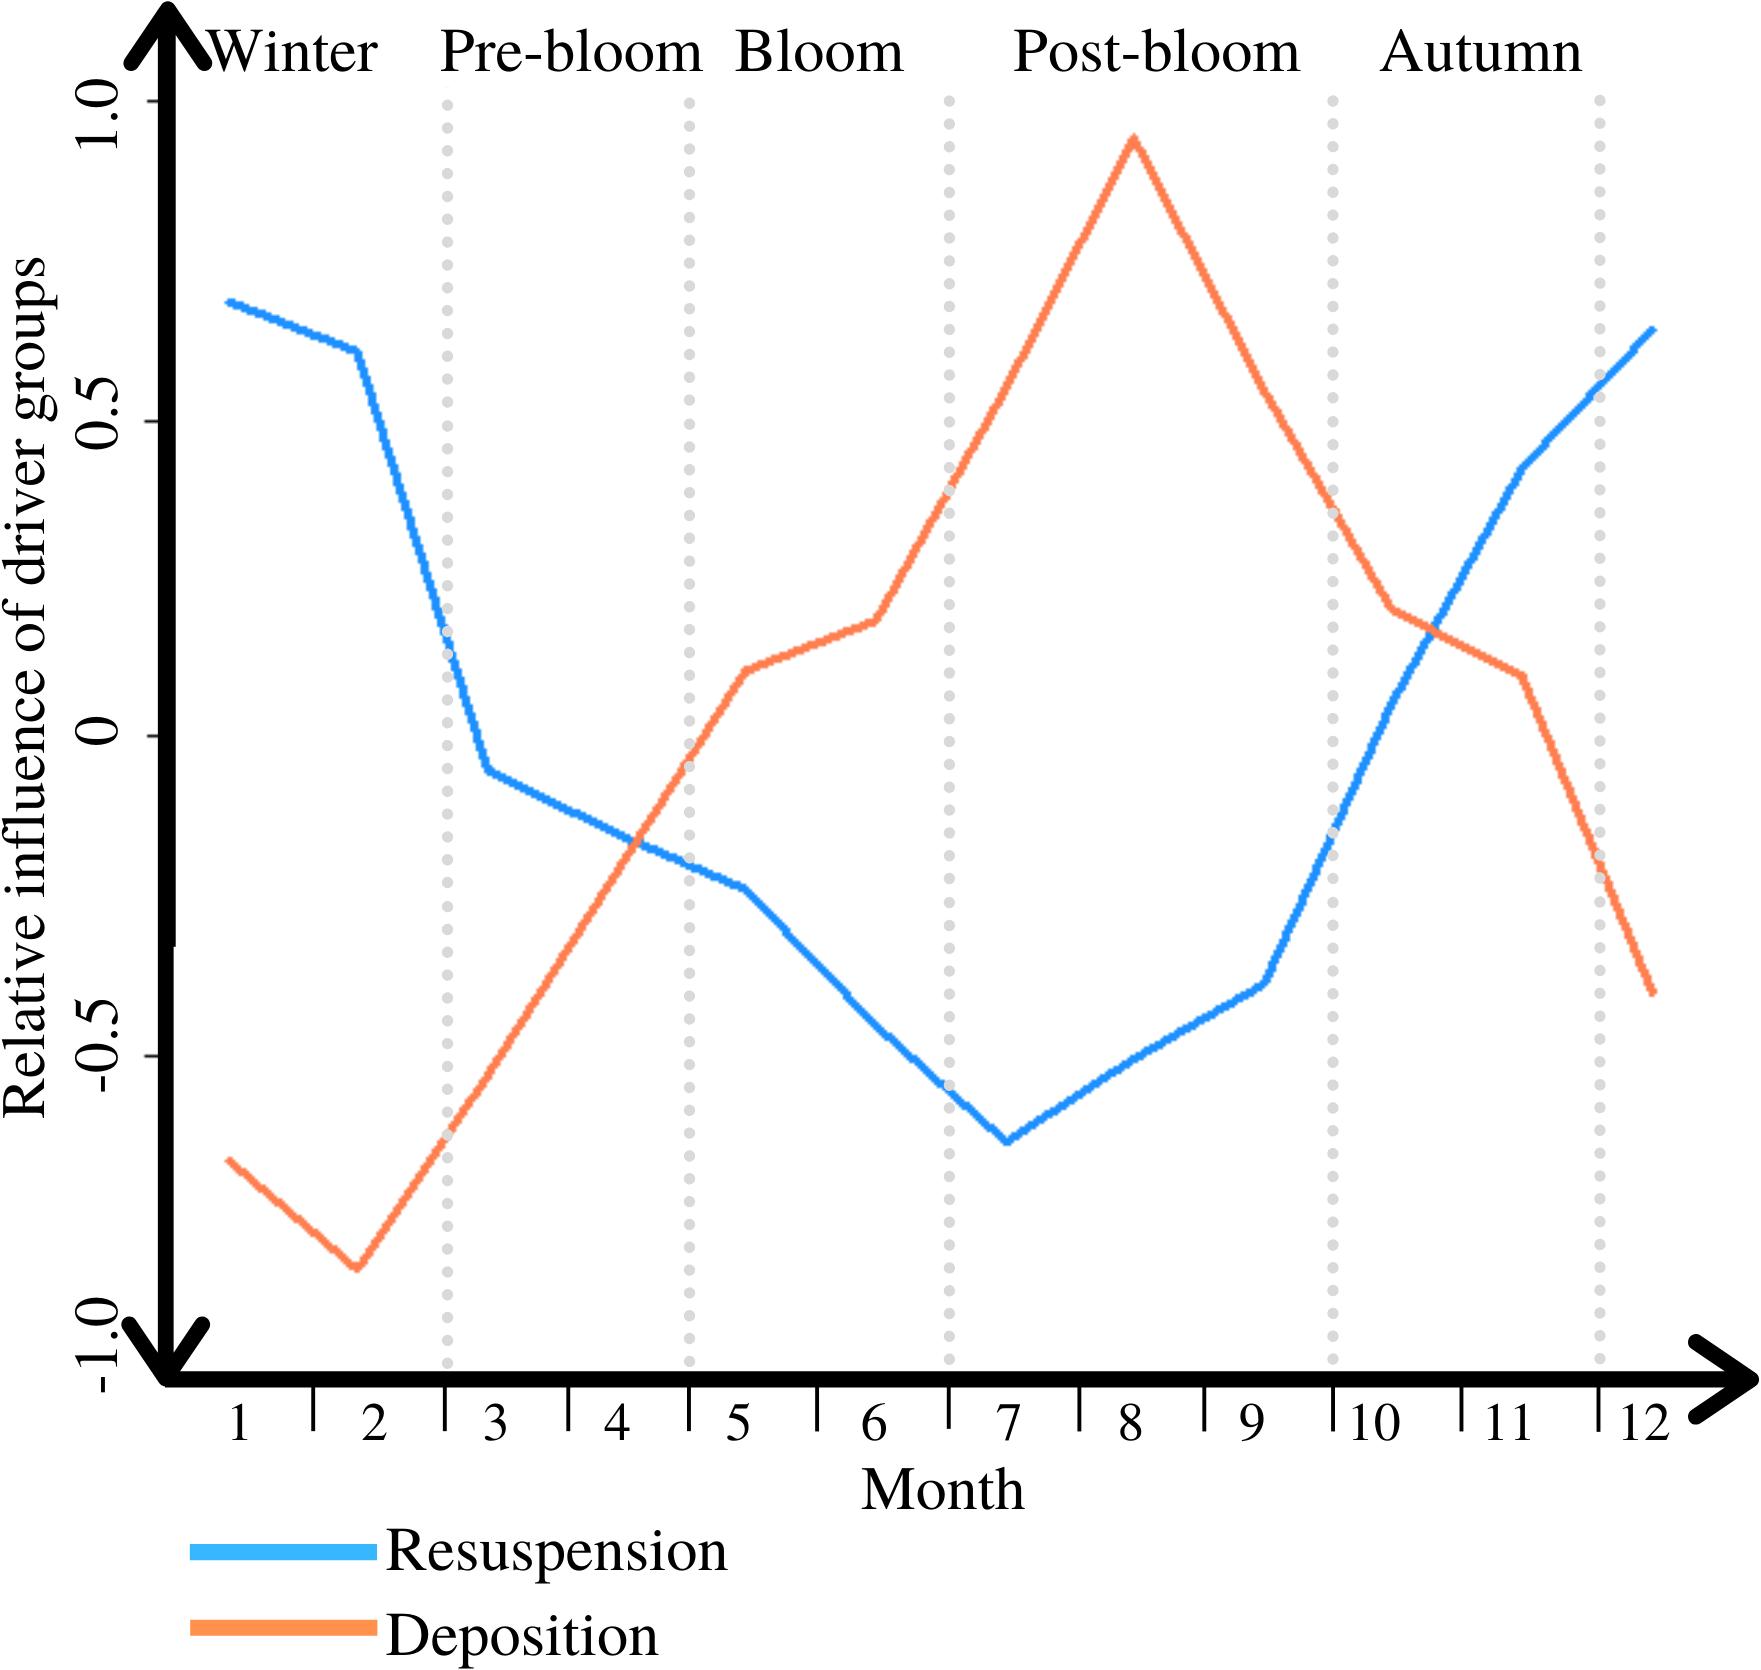
Figure 6. The variable influence of the dominant direction of PM exchange through the interactions of its two driver groups throughout a typical year, ranging from 1 = completely dominant, to −1 = irrelevant; periods are marked through light grey vertical dotted lines.
As with DIN exchange, there is a divide in PM B/P exchange drivers between the colder and the warmer halves of the year. The switch between net upward and downward transport through the alternation in relative importance of deposition and resuspension throughout the year lead to a different cyclical pattern in the overall direction of exchange than that of DM exchange (see Figure 7).
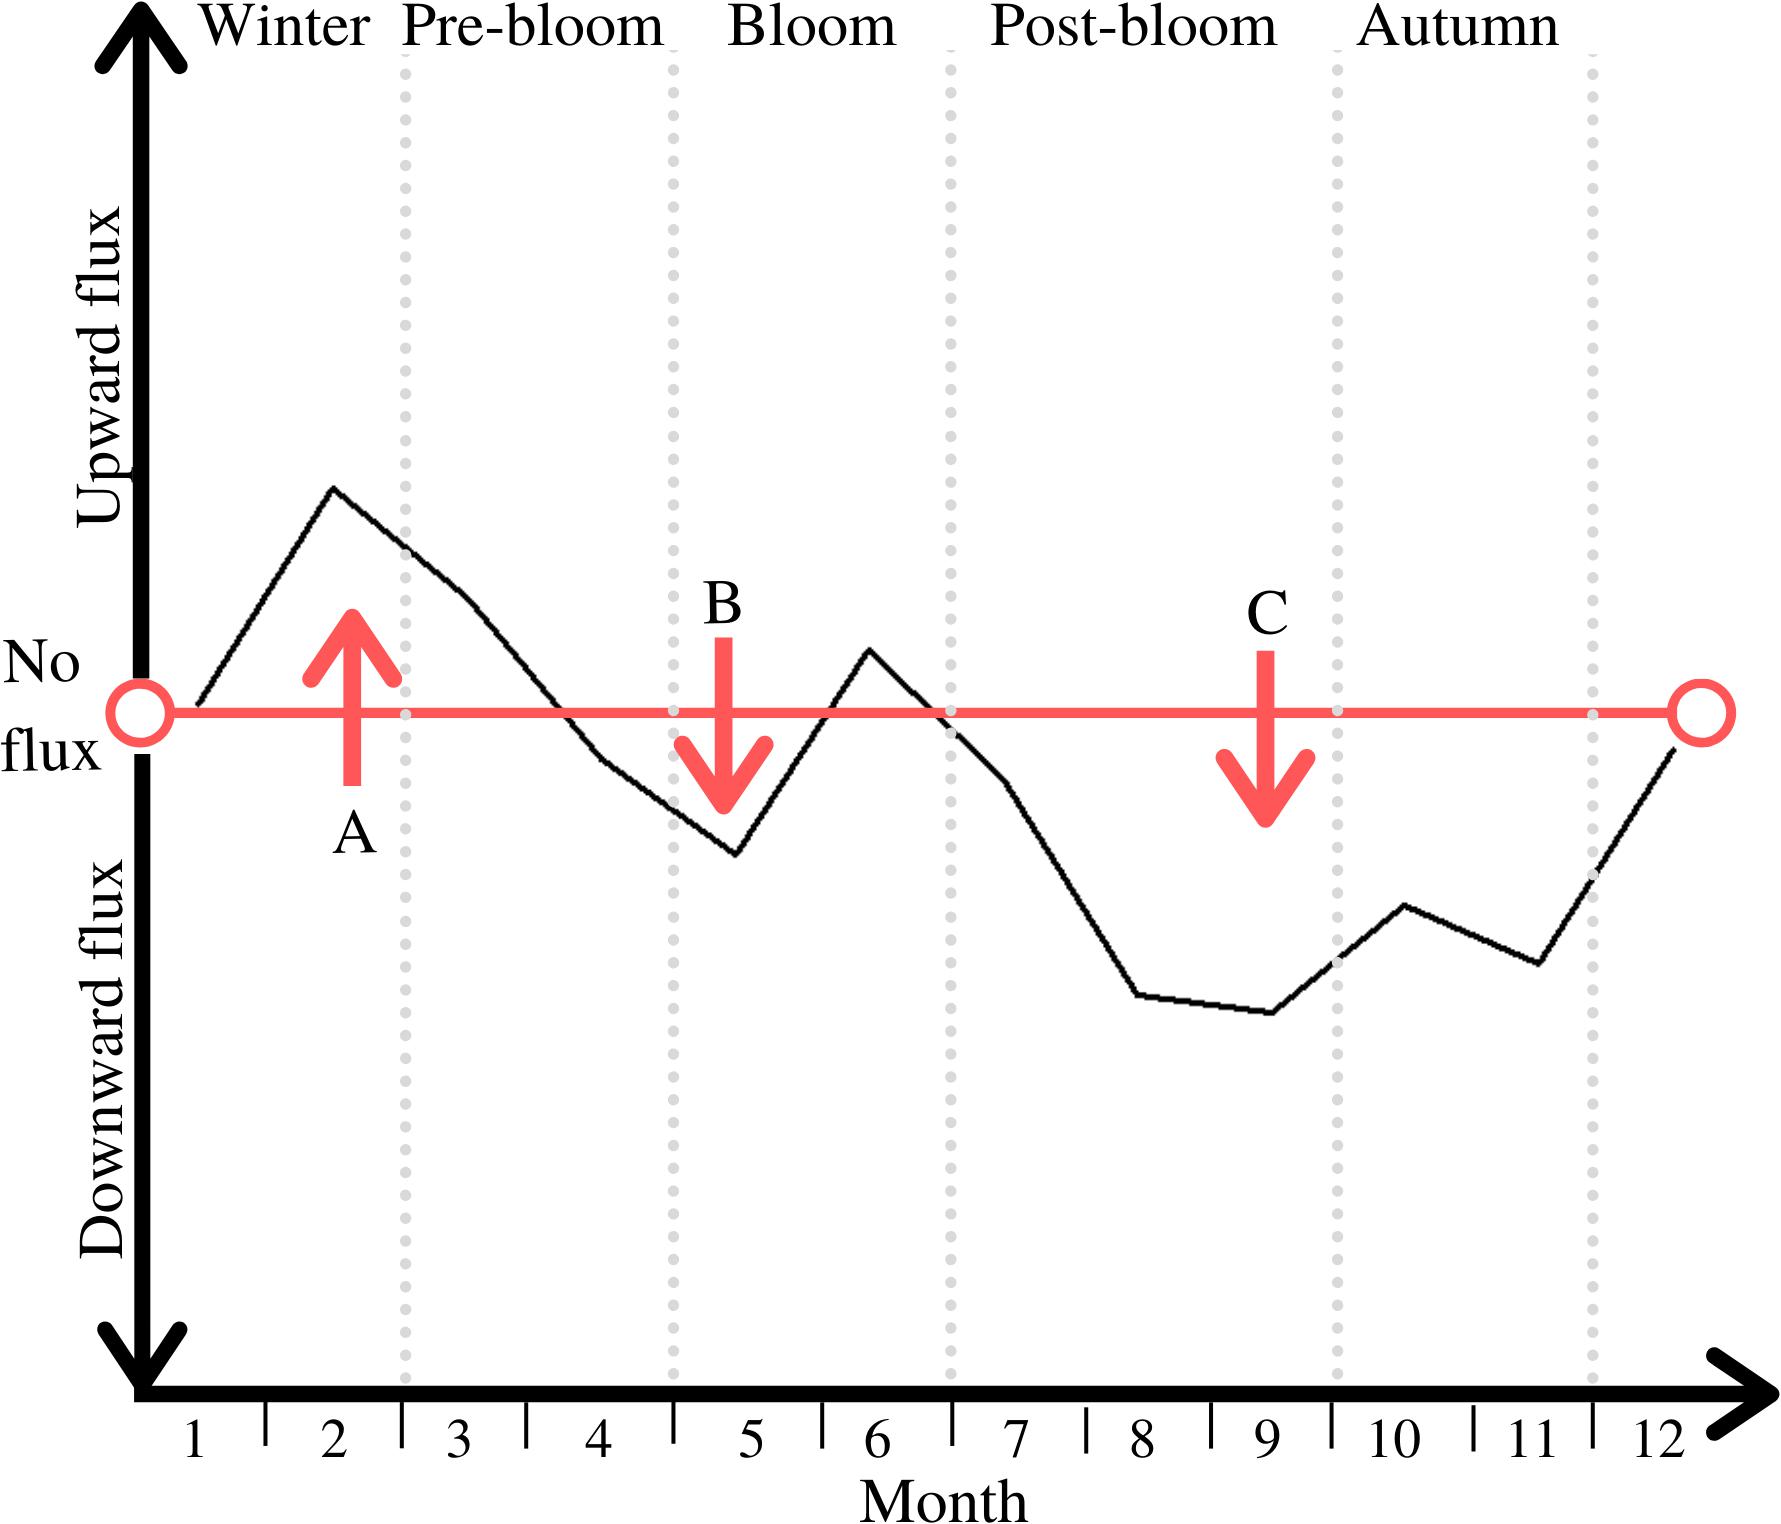
Figure 7. Direction of net PM B/P exchange throughout the five periods; periods are marked through light grey vertical dotted lines; notable peaks are labelled A, B, and C.
Unsurprisingly, there is a general upward flux of PM during winter and into the pre-bloom period (see peak A in Figure 7). As this lessens throughout pre-bloom, the particulates placed in suspension in winter sink downward again, leading to an overall downward flux prior to the bloom (see peak B in Figure 7), Another peak of deposition follows during the post-bloom period and into autumn, reflecting the organic matter generated in the bloom being deposited on the seafloor (see peak C in Figure 7). This downward-directed PM flux also represents POC burial during this time, as reflected in the POC distribution patterns within the sediment during that time (Figure 3).
Interactions Between DM and PM Exchange
The only DM driver whose inter-periodic variability was enhanced through the focus on those factors which were also affected by PM exchange (see Table 2) was biological mixing (ANOSIM, R = 0.571, p = 0.0002; see Supplementary Appendix 4, test 14). Intra-annual variability of the variables driving physical resuspension- (ANOSIM, R = 0.805, p = 0.0003; see Supplementary Appendix 4, test 15) and bioirrigation-driven DM exchange (ANOSIM, R = 0.4, p = 0.014; see Supplementary Appendix 4, test 16), which were overlapped with variables driving PM B/P exchange, was reduced. Diffusion- (ANOSIM, R = 0.875, p = 0.0002; see Supplementary Appendix 4, test 17) and advection-driven exchanges were unaffected (ANOSIM, R = 0.739, p = 0.0001; see Supplementary Appendix 4, test 18). Drivers of DM exchange were expected to affect more aspects of PM deposition than PM resuspension. This is because they affect only the biological factors playing into each of them, and while particle deposition is driven almost equally by biological and physical factors, resuspension is more heavily driven by physical factors. Hence, the analysis of secondary intra-annual patterns in the form of only those drivers affected by solute exchange revealed that while both main drivers still displayed intra-annual temporal patterns, differences between individual periods were not significant in in PM resuspension (ANOSIM, R = 0.4, p = 0.009; see Supplementary Appendix 4, test 19) but highly so in PM deposition (ANOSIM, R = 0.887, p = 0.0001; see Supplementary Appendix 4, test 20). This shows that while DM exchange plays a role in the intra-annual variation of PM deposition, it does not affect resuspension that much.
Discussion
The results presented in this study represent one of the most detailed diverse arrays of physical, chemical, meteorological and biological data that have been combined to identify and quantify the various processes that drive intra-annual variation in B/P coupling. This allowed us to determine the interactions and trade-offs that underpinned the net fluxes of PM and DM in temperate coastal ecosystems.
The results of this study revealed clear intra-annual periodic patterns in both DM and PM B/P exchange drivers and processes, and identified the environmental variables which have the most influence on these patterns in each instance. In the case of DM B/P exchanges, three peak periods of exchange were identified. Firstly an upward flux in pre-bloom period, driven by high levels of diffusive flux due to a concentration gradient between benthos and pelagic following a period of thorough water column mixing in the previous period. The supply of nutrients from the benthos to the water column during this time of year fuels the formation of the phytoplankton bloom in the following period (Rees et al., 2009).
The second upward flux, during the bloom period, is driven by high rates of biological activity in response to increased temperatures and the beginning of the pelagic phytoplankton bloom. Gradual nutrient depletion of pelagic nutrient levels in this period creates a concentration gradient and perpetuates the continued domination of upward-directed DM B/P exchanges (Smyth et al., 2010). Thirdly, a downward flux was detected in autumn. This was found to be influenced by a combination of biological and physical drivers, including high rates of biological mixing and bioirrigation, and an elevated potential for advective flushing due to low sediment densities in an increasingly hydrodynamic environment. This is likely connected to the bioirrigation and biological mixing-driven downward draft of DIN released from particulate organic matter deposited during the plankton bloom (Kristensen and Hansen, 1995). The high concentrations of DIN detected near the seafloor throughout the autumn are a sign that the turning point of this downward peak is reached, when the benthic remineralization leads to the emergence of DIN from the sediment into the water column through advective flushing (Kristensen, 1988).
Particulate matter B/P exchanges on the other hand exhibited a clearly physically driven upward flux in winter, driven by the physical resuspension of material from the seafloor and prevention of SPM settling through the highly hydrodynamic conditions at this time of year (Jago et al., 1993; Jones et al., 1998; Dobrynin et al., 2010). This was followed by a biologically driven downward flux in the bloom period, where particulates produced in the pelagic phytoplankton bloom were starting to be deposited on the seafloor. Biogenic vertical transport through zooplankton feeding and migratory activity is likely to intensify the downward flux during this time (van Duyl et al., 1992; Packard and Gómez, 2013). The small instance of upward PM flux during the bloom, between peaks B and C could be attributed to biogenic sources of resuspension, as physical drivers of B/P exchange were not of importance during this time of year. The source of this could for example be zooplankton activity (Eloire et al., 2010) or the ejection of benthic particles, larvae or gametes from the benthos (e.g., Bass and Brafield, 1972). The third notable feature in the intra-annual PM B/P exchange cycle was another peak period of downward flux throughout post-bloom and autumn. Though initially driven purely biologically, by the continued deposition of pelagic organic matter and influenced by migratory zooplankton activity, some hydrological influences also played a role in this period of net deposition. Drastic increases in river and tidal flow, and hydrodynamic energy in this period, are likely to cause an influx of PM from fluvial and terrestrial sources, as well as the mobilization of freshly deposited material, thereby increasing the potential for PM deposition (Lampitt et al., 1993; Milliman and Farnsworth, 2013). The downward flux of PM in the autumn period is likely not limited to exchange processes directed from pelagic to benthos, but also encapsulates exchanges within the sediment matrix. By autumn time, the POC deposited on the sediment surface after the pelagic phytoplankton bloom has been buried and while what was left at the surface has been depleted already, deeper layers are still saturated (Middelburg et al., 1993). In addition to this, sediment density was recorded to be lowest in winter and autumn periods, while hydrodynamic energy was highest, which is likely to cause some advective flushing of POC into the sedimentary pore spaces (see e.g., Ehrenhauss and Huettel, 2004).
The intra-annual patterns detected in this study, in the direction and magnitude of net DM and PM B/P exchange processes, and in the relative influences of the various drivers thereof, provide useful information to further our understanding of biogeochemical cycling and ecosystem functioning. For example, while seasonal nutrient depletion through pelagic bloom events and subsequent replenishment from benthic sources is a well-known phenomenon (e.g., Smyth et al., 2010), the insight provided in this study into the relative importance of the various potential drivers of the latter, aids our understanding of the overall process. Taking into account the periodic variability of drivers and processes in temperate environments provides a temporal context for in situ measurements and sampling campaigns. The timing and duration of the periods may vary slightly between years, but the characteristics of each should remain the same, and thus the overall patterns in B/P exchange drivers and processes hold up throughout any given year.
Previous studies of intra-annual patterns in B/P coupling have in many cases centered on the biological drivers of exchange such as phytoplankton bloom events (e.g., Graf, 1992; Tonkin et al., 2017). This placed the focus on downward fluxes and the more biologically active half of the year. In turn, studies that did focus on intra-annual variability in hydrodynamic and physically driven B/P transport, often broadly neglect biological contributions, including only pelagic primary production (e.g., Jones et al., 1998). There have been attempts to integrate biological and non-biological drivers of B/P coupling in estuaries (e.g., Ubertini et al., 2012) or at very shallow sites (e.g., Chipman et al., 2012) and through modeling (e.g., Lee et al., 2002). This however, is one of the first studies to take both aspects into account in a coastal environment, and to consider the interactions between biological and physical drivers of B/P exchanges throughout a full intra-annual cycle.
Single variable driver-process relationships, independently significant as each of them may be, need to be assessed in context of one another to recognize the true relative importance of each individual driver at the ecosystem scale. By investigating multiple drivers simultaneously and in relation to each other, the current study facilitates the identification of the most important driver-process relationships in the context of intra-annual variation in DM and PM B/P fluxes. Our current understanding of B/P exchange processes is largely based on short-term investigations of specific B/P coupling pathways, often within a single period or focused on the more biologically active half of the year (although there are some exceptions such as Chipman et al., 2012). From this we know that in winter, wave action and current flow can lead to resuspension and advective flushing events (Lou et al., 2000; Tengberg et al., 2003; Kassem et al., 2015), especially during storm events (Jago et al., 1993; Madsen et al., 1993; Corte et al., 2017). It is also known that pelagic primary productivity and specifically the deposition of organic matter from phytoplankton blooms is a major driver of benthic biological activity (Gooday and Turley, 1990; Zhang et al., 2015). The current study investigates not only how each of these processes varies throughout a full intra-annual cycle, but also the interactions between them to evaluate their relative influence and find the short-term temporal patterns in the direction and magnitude of net B/P exchanges. From this, annual net B/P fluxes may also be derived.
In different environments, the relative importance of each of the drivers may vary but the core mechanics should remain the same (e.g., animal activity is more heavily driven by temperature variations in temperate regions and more by food availability in arctic regions; Brockington and Clarke, 2001). Phenological patterns differ between locations and must be identified in each case to allow the appropriate definition of two or more periods which may occur throughout the year. One good way to identify such patterns, if resources and local infrastructure allow it, is the establishment of time series data collections that include multiple long-term complementary data sets at the same site. Where such approaches are not feasible, existing time-series collections at approximately comparable locations may be used as reference by which to judge the validity of short-term intra-annual patterns found in one-off data collections. By considering phenological and meteorological cycles and the state of the environment at the moment of investigation, field sampling and experimental designs of future studies can start off more well-informed and avoid miss-guided conclusions based on for instance differences in sampling period throughout a study. The result will be a higher level of comparability and cohesion between studies, and an ultimately better understanding of B/P exchange.
Indications of flux timing and directions as portrayed in this study are based on a typical year’s conditions, but there are multiple drivers which may at any time sway the balance one way or another. Extreme events such as uncharacteristically long or plentiful phytoplankton blooms or particularly stormy years can be enough to swing the balance between upward and downward fluxes of DM and change the timing of peaks and times of overlap between DM and PM B/P exchanges (Madsen et al., 1993; Zhang et al., 2015; Masselink et al., 2016). Interactions between dissolved and particulate matter exchange processes detected in this study are in accordance with existing literature which documents for example increased PM deposition through nutrient resuspension-fueled peaks in primary production (Fanning et al., 1982), triggering and exacerbation of DM exchange processes through PM resuspension (Tengberg et al., 2003) and enhanced rates of biological mixing and bioirrigation potentials driven by the deposition of particulate organic matter (e.g., Brockington and Clarke, 2001).
Conclusion
Dissolved matter and PM B/P exchange processes vary on a short-term intra-annual temporal scale in both magnitude and dominant direction of exchange. Biological, physical and biogeochemical factors drive the temporal variation and while biological variables were overall more dominant in the warmer months and physical drivers dominated in the colder months, there were significant periods of overlap during which several drivers affected the exchange processes interactively. These relationships between individual environmental variables and B/P exchange drivers and processes, identified in this study, further our understanding of B/P connectivity by providing a temporal ecological context. Future studies of biogeochemical cycles, or other ecosystem processes, will be able to utilize this contextualization, to better understand short-term intra-annual ecosystem variability.
Data Availability Statement
The datasets presented in this study can be found in online repositories. The names of the repository/repositories and accession number(s) can be found below: University of Southampton repository, https://doi.org/10.5258/SOTON/D1337.
Author Contributions
Each of the authors has contributed to the execution of this study with SR in the role of main author and SW, CT, and AQ each providing guidance for sample collection and analysis as well as contributing invaluable feedback and input to the writing process. Sample collection and analysis as well as data analysis was mainly carried out by SR. All authors have approved of this manuscript at the time of submission. The funding body financially supporting the study was not directly involved in the study design, data collection, or write-up process.
Funding
This work was supported by the Natural Environmental Research Council, grant number NE/L002531/1. The Western Channel Observatory is funded by the UK Natural Environment Research Council through its National Capability Long-term Single Centre Science Programme, Climate Linked Atlantic Sector Science; grant number NE/R015953/1. AMQ acknowledges funding from the UK NERC-HT programme ALICE.
Conflict of Interest
The authors declare that the research was conducted in the absence of any commercial or financial relationships that could be construed as a potential conflict of interest.
Acknowledgments
Scientists and technicians who have contributed to the collection of the various data sets used in this study are thanked for their efforts in sampling and publication of their data. Franki Perry is thanked for her efforts in providing an outside perspective to the authors and making suggestions for the improvement of the manuscript in the writing phase.
Supplementary Material
The Supplementary Material for this article can be found online at: https://www.frontiersin.org/articles/10.3389/fmars.2020.567193/full#supplementary-material
References
Aiken, J., Fishwick, J., Moore, G., and Pemberton, K. (2004). The annual cycle of phytoplankton photosynthetic quantum effciency, pigment composition and optical properties in the western English Channel. J. Mar. Biol. Assess. 84, 301–313. doi: 10.1017/s0025315404009191h
Alfred Wegener Institute (2019). ODV 5.2.0, Ocean Data Viewer. Bremerhaven: Alfred Wegener Institute.
Allen, J. I., Siddorn, J. R., Blackford, J. C., and Gilber, F. J. (2004). Turbulence as a control on the microbial loop in a temperate seasonally stratified marine systems model. J. Sea Res. 52, 1–20. doi: 10.1016/j.seares.2003.09.004
Armstrong, R. A. (2014). When to use the Bonferroni correction. Ophthalm. Physiol. Opt. 34, 502–508. doi: 10.1111/opo.12131
Atkinson, A., and Sinclair, J. D. (2000). Zonal distribution and seasonal vertical migration of copepod assemblages in the Scotia Sea. Pol. Biol. 23, 46–58. doi: 10.1007/s003000050007
Barnes, M. K., Tilstone, G. H., Suggett, D. J., Widdicombe, C. E., Bruun, J., Martinez-Vicente, V., et al. (2015). Temporal variability in total, micro- and nano-phytoplankton primary production at a coastal site in the Western English Channel. Prog. Oceanogr. 137, 470–483. doi: 10.1016/j.pocean.2015.04.017
Bass, N. R., and Brafield, A. E. (1972). The life-cycle of the polychaete Nereis virens. J. Mar. Biol. Assoc. U.K. 52, 701–726. doi: 10.1017/s0025315400021664
Berg, P., Rysgaard, S., Funch, P., and Sejr, M. K. (2001). Effects of bioturbation on solutes and solids in marine sediments. Aquat. Microb. Ecol. 26, 81–94. doi: 10.3354/ame026081
Berner, R. A. (1976). Inclusion of absorption in the modelling of early diagenesis. Earth Planet. Sci. Lett. 29, 333–340. doi: 10.1016/0012-821x(76)90137-0
Blomqvist, S. (1991). Quantitative sampling of soft-bottom sediments: problems and solutions. Mar. Ecol. Prog. Ser. 72, 295–304. doi: 10.3354/meps072295
Blomqvist, S., Gunnars, A., and Elmgren, R. (2004). Why the limiting nutrient differs between temperate coastal seas and freshwater lakes: a matter of salt. Limnol. Oceanogr. 49, 2236–2241. doi: 10.4319/lo.2004.49.6.2236
Boudreau, B. (2001). “‘The benthic boundary layer: transport processes and biogeochemistry,” in The Benthic Boundary Layer: Transport Processes and Biogeochemistry, eds B. Bourdeau and B. Jorgensen (Oxford: Oxford University Press), 104–122.
Bouma, T. J., Olenin, S., Reise, K., and Ysebaert, T. (2009). Ecosystem engineering and biodiversity in coastal sediments: posing hypotheses. Helgoland Mar. Res. 63, 95–106. doi: 10.1007/s10152-009-0146-y
Boynton, W. R., Ceballos, M. A. C., Bailey, E. M., Hodgkins, C. L. S., Humphrey, J. L., and Testa, J. M. (2017). Oxygen and nutrient exchanges at the sediment-water interface: a global synthesis and critique of estuarine and coastal Data. Estuar. Coasts 41, 301–333. doi: 10.1007/s12237-017-0275-5
Brockington, S., and Clarke, A. (2001). The relative influence of temperature and food on the metabolism of a marine invertebrate. J. Exper. Mar. Biol. Ecol. 258, 87–99. doi: 10.1016/S0022-0981(00)00347-346
Bylesjö, M., Rantalainen, M., Cloarec, O., Nicholson, J. K., Holmes, E., and Trygg, J. (2006). OPLS discriminant analysis: combining the strengths of PLS-DA and SIMCA classification. J. Chemometr. 20, 341–351. doi: 10.1002/cem
Cabin, R. J., and Mitchell, R. J. (2000). To Bonferroni or Not to Bonferroni: when and how are the questions. Bull. Ecol. Soc. Am. 81, 246–248.
Chipman, L., Huettel, M., and Laschet, M. (2012). Effect of benthic-pelagic coupling on dissolved organic carbon concentrations in permeable sediments and water column in the northeastern Gulf of Mexico. Contin. Shelf Res. Pergamon 45, 116–125. doi: 10.1016/j.csr.2012.06.010
Corte, G. N., Schlacher, T. A., Checon, H. H., Barboza, C. A. M., Siehle, E., Coleman, R. A., et al. (2017). Storm effects on intertidal invertebrates: increased beta diversity of few individuals and species. PeerJ 4, 1–18. doi: 10.7717/peerj.3360
Cullen, J. J., Yang, X., and MacIntyre, H. L. (1992). “Nutrient limitation of marine photosynthesis,” in Primary Productivity and Biogeochemical Cycles in the Sea. Environmental Science Research, Vol. 43, eds P. G. Falkowski, A. D. Woodhead, and K. Vivirito (Boston, MA: Springer), 69–88. doi: 10.1007/978-1-4899-0762-2_5
Dobrynin, M., Gayer, G., Pleskachevsky, A., and Günther, H. (2010). Effect of waves and currents on the dynamics and seasonal variations of suspended particulate matter in the North Sea. J. Mar. Syst. 82, 1–20. doi: 10.1016/j.jmarsys.2010.02.012
Durrieu de Madron, X., Ramondenc, S., Berline, L., Houpert, L., Bosse, A., Martini, S., et al. (2017). Deep sediment resuspension and thick nepheloid layer generation by open-ocean convection. J. Geophys. Res. Oceans 122, 2291–2318. doi: 10.1002/2016JC012062
Ehrenhauss, S., and Huettel, M. (2004). Advective transport and decomposition of chain-forming planktonic diatoms in permeable sediments. J. Sea Res. 52, 179–197. doi: 10.1016/j.seares.2004.01.004
Ehrenhauss, S., Witte, U., Bühring, S. I., and Huettel, M. (2004). Effect of advective pore water transport on distribution and degradation of diatoms in permeable North Sea sediments. Mar. Ecol. Prog. Ser. 271, 99–111. doi: 10.3354/meps271099
Eloire, D., Somerfield, P. J., Halsband-lenk, C., Harris, R., and Bonnet, D. (2010). Temporal variability and community composition of zooplankton at station L4 in the Western Channel?: 20 years of sampling. J. Plankton Res. 32, 1–23. doi: 10.1093/plankt/fbq009
Fanning, K. A., Carder, K. L., and Betzer, P. R. (1982). Sediment resuspension by coastal waters: a potential mechanism for nutrient re-cycling on the ocean’s margins. Deep Sea Res. 29, 953–965. doi: 10.1016/0198-0149(82)90020-90026
Ginsburg, R. N., and Lowenstam, H. A. (1958). The influence of marine bottom communities on the depositional environment of sediments. J. Geol. 66, 310–318. doi: 10.1086/626507
Glud, R. N. (2008). Oxygen dynamics of marine sediments. Mar. Biol. Res. 4, 242–289. doi: 10.1080/17451000801888726
Gogina, M., Zettler, M. L., Vanaverbeke, J., Dannheim, J., Van Hoey, G., Desroy, N., et al. (2020). Interregional comparison of benthic ecosystem functioning: community bioturbation potential in four regions along the NE Atlantic Shelf. Ecol. Indic. 110:105945. doi: 10.1016/j.ecolind.2019.105945
Gooday, A. J., and Turley, C. M. (1990). Responses by benthic organisms to inputs of organic material to the ocean floor: a review. Trans. R. Soc. Lond. A 331, 119–138. doi: 10.1098/rsta.1990.0060
Graf, G. (1992). Benthic-pelagic coupling: a benthic view. Oceanogr. Mar. Biol. Annu. Rev. 30, 149–190.
Groom, S., Martinez-Vicente, V., Fishwick, J., Tilstone, G., Moore, G., Smyth, T., et al. (2009). The Western english channel observatory?: optical characteristics of station L4. J. Mar. Syst. 77, 278–295. doi: 10.1016/j.jmarsys.2007.12.015
Hansen, J. I., Henriksen, K., and Blackburn, T. H. (1981). Seasonal distribution of nitrifying bacteria and rates of nitrification in coastal marine sediments. Microb. Ecol. 7, 297–304. doi: 10.1007/BF02341424
Highfield, J. M., Eloire, D., Conway, D. V. P., Lindeque, P. K., Attrill, M. J., and Somerfield, P. J. (2010). Seasonal dynamics of meroplankton assemblages at station L4. J. Plankton Res. 32, 681–691. doi: 10.1093/plankt/fbp139
Holt, J., and Umlauf, L. (2008). Modelling the tidal mixing fronts and seasonal stratification of the Northwest European continental shelf. Continent. Shelf Res. 28, 887–903. doi: 10.1016/j.csr.2008.01.012
Howarth, R. W. (1988). Nutrient limitation of net primary production in marine ecosystems. Annu. Rev. Ecol. Syst. 19, 89–110. doi: 10.1146/annurev.es.19.110188.000513
Jacobsen, H. H., and Markager, S. (2016). Carbon-to-Chlorophyll ration for phytoplankton in temperate coastal waters: Seasonal patterns and relationship to nutrients. Limnol. Oceanogr. 61, 1853–1868. doi: 10.1002/lno.10338
Jago, C. F., Bale, A. J., Green, M. O., Howarth, M. J., Jones, S. E., McCave, I. N., et al. (1993). Resuspension processes and seston dynamics, southern North Sea. Philos. Trans. R. Soc. Lond. Ser. A 343, 475–491. doi: 10.1098/rsta.1993.0060
Jones, S. E., Jago, C. F., Bale, A. J., Chapman, D., Howland, R. J. M., and Jackson, J. (1998). Aggregation and resuspension of suspended particulate matter at a seasonally stratified site in the southern North Sea: Physical and biological controls. Continent. Shelf Res. 18, 1283–1309. doi: 10.1016/S0278-4343(98)00044-42
Justic, D., Rabalais, N. N., Turner, R. E., and Dorth, Q. (1995). Changes in Nutrient Structure of River-dominated coastal waters: Stoichiometric nutrient balance and its consequences. Estuar Coast. Shelf Sci. 1, 339–356. doi: 10.1016/s0272-7714(05)80014-9
Kane, M. K., Yopak, R., Roman, C., and Menden-Deuer, S. (2018). Krill motion in the Southern Ocean: quantifying in situ krill movement behaviors and distributions during the late austral autumn and spring. Limnol. Oceanogr. 63, 2839–2857. doi: 10.1002/lno.11024
Kassem, H., Thompson, C. E. L., Amos, C. L., and Townend, I. H. (2015). Wave-induced coherent turbulence structures and sediment resuspension in the nearshore of a prototype-scale sandy barrier beach. Continent. Shelf Res. 109, 78–94. doi: 10.1016/j.csr.2015.09.007
Keim, B. D., Müller, R. A., and Stone, G. W. (2004). Spatial and temporal variability of coastal storms in the North Atlantic Basin. Mar. Geol. 210, 7–15. doi: 10.1016/j.margeo.2003.12.006
Kinne, O. (1970). “Temperature: animals-invertebrates,” in Marine Ecology, ed. O. Kinne (London: Wiley-Interscience), 407–514.
Kristensen, E. (1988). “Benthic fauna and biogeochemical processes in marine sediments:microbial activities and fluxes BT - Nitrogen cycling in coastal marine environments,” in Nitrogen Cycling in Coastal Marine Environments, eds T. H. Blackburn and J. Sorensen (Hoboken, NJ: Wiley), 275–300.
Kristensen, E., and Hansen, K. (1995). Decay of plant detritus in organic-poor marine sediment: Production rates and stoichiometry of dissolved C and N compounds. J. Mar. Res. 53, 675–702. doi: 10.1357/0022240953213115
Lampitt, R. S., Hillier, W. R., and Challenor, P. G. (1993). Seasonal and diel variation in the open ocean concentration of marine snow aggregates. Nature 362, 737–739. doi: 10.1038/362737a0
Lee, J. Y., Tett, P., Jones, K., Jones, S., Luyten, P., Smith, C., et al. (2002). The PROWQM physical-biological model with benthicpelagic coupling applied to the northern North Sea. J. Sea Res. 48, 287–331. doi: 10.1016/S1385-1101(02)00182-X
Leynaert, A., Ní, S., An, S., Lim, J., Claquin, P., Grall, J., et al. (2011). Tidal variability in benthic silicic acid fluxes and microphytobenthos uptake in intertidal sediment. Estuar Coast. Shelf Sci. 95, 59–66. doi: 10.1016/j.ecss.2011.08.005
Lou, J., Schwab, D., Beletsky, D., and Hawley, N. (2000). A model of sediment resuspension and transport dynamics in southern Lake Michigan. J. Geophys. Res. 105, 6591–6610. doi: 10.1029/1999jc900325
MacIntyre, S. (1998). Turbulent mixing and resource supply to phytoplankton. Phys. Process. Lakes Oceans 54, 561–590. doi: 10.1029/CE054p0561
Madsen, O. S., Wright, L. D., Boon, J. D., and Chisholm, T. A. (1993). Wind stress, bed roughness and sediment suspension on the inner shelf during an extreme storm event. Continent. Shelf Res. 13, 1303–1324. doi: 10.1016/0278-4343(93)90054-90052
Masselink, G., Scott, T., Poate, T., Russell, P., Davidson, M., and Conley, D. (2016). The extreme 2013/2014 winter storms: hydrodynamic forcing and coastal response along the southwest coast of England. Earth Surf. Process. Landforms 41, 378–391. doi: 10.1002/esp.3836
Mehmood, T., Liland, K. H., Snipen, L., and Saebø, S. (2012). A review of variable selection methods in partial least squares regression. Chemometr. Intellig. Lab. Syst. 118, 62–69. doi: 10.1016/j.chemolab.2012.07.010
Meyer-Reil, L. A. (1983). Benthic response to sedimentation events during autumn to spring at a shallow water station in the Western Kiel Bight - II. Analysis of benthic bacterial populations. Mar. Biol. 77, 247–256. doi: 10.1007/BF00395813
Middelburg, J. J. (2018). Reviews and syntheses: to the bottom of carbon processing at the seafloor. Biogeosciences 15, 413–427. doi: 10.5194/bg-15-413-2018
Middelburg, J. J., Vlug, T., Jaco, F., and van der Nat, W. A. (1993). Organic matter mineralization in marine systems. Glob. Planet. Chang. 8, 47–58. doi: 10.1016/0921-8181(93)90062-S
Milliman, J. D., and Farnsworth, K. L. (2013). River Discharge to the Coastal Ocean: A Global Synthesis. 1st Edn, New York, NY: Cambridge University Press.
Montserrat, F., van Colen, C., Provoost, P., Milla, M., Ponti, M., van den Meersche, K., et al. (2009). Sediment segregation by biodiffusing bivalves. Estuar. Coas. Shelf Sci. 83, 379–391. doi: 10.1016/j.ecss.2009.04.010
Morris, A. W., and Howarth, M. J. (1998). Bed stress induced sediment resuspension (SERE 88/89). Continent. Shelf Res. 18, 1203–1213. doi: 10.1016/S0278-4343(98)00040-45
Navarro-Barranco, C., McNeill, C. L., Widdicombe, C., Guerra-Garcia, J. M., and Widdicombe, S. (2017). Long-term dynamics in a soft-bottom amphipod community and the influence of the pelagic environment. Mar. Environ. Res. 129, 133–146. doi: 10.1016/j.marenvres.2017.04.013
Neumann, A., and Wrede, A. (2020). Simplictiy in numbers: Implications of diversity for the community Bioturbation Potential (BPc). bioRxiv [Preprint], doi: 10.1101/2020.04.21.053728
NNRCMP (2019). Channel Coastal Observatory. Plymouth: National Network of Regional Coastal Monitoring Programmes.
Oksanen, J., Blanchet, F., Friendly, M., Kindt, R., Legendre, P., Mcglinn, D., et al. (2019). Package “Vegan”.
Packard, T. T., and Gómez, M. (2013). Modeling vertical carbon flux from zooplankton respiration. Prog. Oceanogr. 110, 59–68. doi: 10.1016/J.POCEAN.2013.01.003
Pearson, K. (1895). VII. Note on regression and inheritance in the case of two parents. Proc. R. Soc. Lond. 58, 347–352.
Queirós, A. M., Birchenough, S. N. R., Bremner, J., Godbold, J. A., Parker, R. E., Romero-Ramirez, A., et al. (2013). A bioturbation classification of European marine infaunal invertebrates. Ecol. Evol. 3, 3958–3985. doi: 10.1002/ece3.769
Queirós, A. M., Fernandes José, A., Faulwetter, S., Nunes, J., Rastrick, S. P. S., Mieszkowska, N., et al. (2015a). Scaling up experimental ocean acidification and warming research: From individuals to the ecosystem. Glob. Chang. Biol. 21, 130–143. doi: 10.1111/gcb.12675
Queirós, A. M., Stephens, N., Cook, R., Ravaglioli, C., Nunes, J., Dashfield, S., et al. (2015b). Can benthic community structure be used to predict the process of bioturbation in real ecosystems? Prog. Oceanogr. 137, 559–569. doi: 10.1016/j.pocean.2015.04.027
Queirós, A. M., Stephens, N., Widdicombe, S., Tait, K., McCoy, S. J., Ingels, J., et al. (2019). Connected macroalgal-sediment systems: blue carbon and food webs in the deep coastal ocean. Ecol. Monogr. 89, 1–21.
R Core Team (2019). R: A Language and Environment for Statistical Computing. Vienna: R Foundation for Statistical Computing. Available online at: https://www.R-project.org/
Rees, A. P., Gilbert, J. A., and Kelly-Gerreyn, B. A. (2009). Nitrogen fixation in the western English Channel (NE Atlantic Ocean). Mar. Ecol. Prog. Ser. 374, 7–12. doi: 10.3354/meps07771
Renz, J. R., Powilleit, M., Gogina, M., Zettler, M. L., Morys, C., and Forster, S. (2018). Community bioirrigation potential (BIP c). an index to quantify the potential for solute exchange at the sediment-water interface. Mar. Environ. Res. 141, 214–224. doi: 10.1016/j.marenvres.2018.09.013
Revsbech, N. P., and Jorgensen, B. B. (1980). Oxygen in the sea bottom measured with a microelectrode. Science 207, 1355–1356. doi: 10.1126/science.207.4437.1355
Rudnick, D. T., Elmgren, R., and Frithsen, J. B. (1985). Meiofaunal prominence and benthic seasonality in a coastal marine ecosystem. Oecologia 67, 157–168. doi: 10.1007/BF00384279
Rühl, S., Thompson, C. E. L., Queriós, A. M., and Widdicombe, S. (2020). Missing links in the study of solute and particle exchange between the sea floor and water column. ICES J. Mar. Sci. 77, 14–27. doi: 10.1093/icesjms/fsaa060
Schafer, L., Platell, M. E., Valesini, F. J., and Potter, I. C. (2002). Comparisons between the influence of habitat type, season and body size on the dietary compositions of fish species in nearshore marine waters. J. Exper. Mar. Biol. Ecol. 278, 67–92. doi: 10.1016/S0022-0981(02)00337-334
Schiffers, K., Teal, L. R., Travis, J. M. J., and Solan, M. (2011). An open source simulation model for soil and sediment bioturbation. PLoS One 6:e28028. doi: 10.1371/journal.pone.0028028
Smyth, T., Atkinson, A., Widdicombe, S., Frost, M., Allen, I., Fishwick, J., et al. (2015a). The Western channel observatory. Prog. Oceanogr. 137, 335–341. doi: 10.1016/j.pocean.2015.05.020
Smyth, T., Fishwick, J., Bell, T., and Widdicombe, S. (2015b). The Western channel observatory - collecting rare and precious time series from photons to fish. Magaz. Challeng. Soc. Mar. Sci. 21, 32–34.
Smyth, T., Fishwick, J. R., Al-Moosawi, L., Cummings, D. G., Harris, C., Kitidis, V., et al. (2010). A broad spatio-temporal view of the Western english channel observatory. J. Plankton Res. 32, 585–601. doi: 10.1093/plankt/fbp128
Solan, M., Wigham, B. D., Hudson, I. R., Kennedy, R., Coulon, C. H., Norling, K., et al. (2004). In situ quantification of bioturbation using time-lapse fluorescent sediment profile imaging (f-SPI). luminophore tracers and model simulation. Mar. Ecol. Prog. Ser. 271, 1–12. doi: 10.3354/meps271001
Tait, K., Airs, R. L., Widdicombe, C. E., Tarran, G. A., Jones, M. R., and Widdicombe, S. (2015). Dynamic responses of the benthic bacterial community at the Western English channel observatory site L4 are driven by deposition of fresh phytodetritus. Prog. Oceanogr. 137, 546–558. doi: 10.1016/j.pocean.2015.04.020
Tengberg, A., Almroth, E., and Hall, P. (2003). ‘Resuspension and its effects on organic carbon recycling and nutrient exchange in coastal sediments: In situ measurements using new experimental technology. J. Exper. Mar. Biol. Ecol. 285–286, 119–142. doi: 10.1016/S0022-0981(02)00523-3
Thévenot, E. A., Roux, A., Xu, Y., Ezan, E., and Junot, C. (2015). Analysis of the Human adult urinary metabolome variations with age, body mass index, and gender by implementing a comprehensive workflow for Univariate and OPLS statistical analyses. J. Proteome Res. 14, 3322–3335. doi: 10.1021/acs.jproteome.5b00354
Tonkin, J. D., Bogan, M. T., Bonada, N., Rios-Touma, B., and Lytle, D. A. (2017). Seasonality and predictability shape temporal species diversity. Ecology 98, 1201–1216. doi: 10.1002/ecy.1761
Ubertini, M., Lefebvre, S., Gangnery, A., Grangeré, O., Le Gendre, R., and Orvain, F. (2012). Spatial variability of benthic-pelagic coupling in an estuary ecosystem: consequences for microphytobenthos resuspension phenomenon. PLoS One 7:e044155. doi: 10.1371/journal.pone.0044155
Uncles, R. J., Stephens, J. A., and Harris, C. (2015). Physical processes in a coupled bay-estuary coastal system: whitsand Bay and Plymouth sound. Prog. Oceanogr. 137, 360–384. doi: 10.1016/j.pocean.2015.04.019
van Duyl, F. C., Kop, A. J., Kok, A., and Sandee, A. J. J. (1992). The impact of organic matter and macrozoobenthos on bacterial and oxygen variables in marine sediment boxcosms. Netherlands J. Sea Res. 29, 343–355. doi: 10.1016/0077-7579(92)90074-O
van Hoey, G., Guilini, K., Rabaut, M., Vincx, M., and Degraer, S. (2008). Ecological implications of the presence of the tube-building polychaete Lanice conchilega on soft-bottom benthic ecosystems. Mar. Biol. 154, 1009–1019. doi: 10.1007/s00227-008-0992-991
Volkenborn, N., Polerecky, L., Hedtkamp, S. I. C., van Beusenkom, J. E. E., and de Beer, D. (2007). Bioturbation and bioirrigation extend the open exchange regions in permeable sediments. Limnol. Oceanogr. 52, 1898–1909. doi: 10.4319/lo.2007.52.5.1898
Volkenborn, N., Polerecky, L., Wethery, D. S., DeWitt, T. H., and Woodin, S. A. (2012). Hydraulic activities by ghost shrimp Neotrypaea californiensis induce oxic - anoxic oscillations in sediments. Mar. Ecol. Prog. Ser. 455, 141–156. doi: 10.3354/meps09645
Wakeham, S. G., and Lee, C. (1993). “Production, transport, and alteration of particulate organic matter in the marine water column,” in Organic Geochemistry. Topics in Geobiology, Vol. 11, eds M. H. Engel and S. A. Macko (Boston, MA: Springer), 145–169. doi: 10.1007/978-1-4615-2890-6_6
Widdicombe, C. E., Eloire, D., Harbour, D., Harris, R. P., and Somerfield, P. J. (2010). Long-term phytoplankton community dynamics in the Western English Channel. J. Plankton Res. 32, 643–655. doi: 10.1093/plankt/fbp127
Widdows, J., Brinsley, M., and Elliott, M. (1998a). Use of in situ flume to quantify particle flux (biodeposition rates and sediment erosion) for an intertidal mudflat in relation to changes in current velocity and benthic macrofauna. Geol. Soc. 139, 85–97. doi: 10.1144/GSL.SP.1998.139.01.07
Widdows, J., Brinsley, M. D., and Salkeld, N. (1998b). Use of annular flumes to determine the influence of current velocity and bivalves on material flux at the sediment-water interface. Estuaries 21, 552–559. doi: 10.2307/1353294
Keywords: benthic/pelagic-exchange, hydrodynamic, inorganic nitrogen, intra-annual, organic carbon, particle, solute
Citation: Rühl S, Thompson CEL, Queirós AM and Widdicombe S (2020) Intra-Annual Patterns in the Benthic-Pelagic Fluxes of Dissolved and Particulate Matter. Front. Mar. Sci. 7:567193. doi: 10.3389/fmars.2020.567193
Received: 29 May 2020; Accepted: 21 October 2020;
Published: 26 November 2020.
Edited by:
Paul Snelgrove, Memorial University of Newfoundland, CanadaReviewed by:
Henry Ruhl, Monterey Bay Aquarium Research Institute (MBARI), United StatesAndrew Kvassnes Sweetman, Heriot-Watt University, United Kingdom
Copyright © 2020 Rühl, Thompson, Queirós and Widdicombe. This is an open-access article distributed under the terms of the Creative Commons Attribution License (CC BY). The use, distribution or reproduction in other forums is permitted, provided the original author(s) and the copyright owner(s) are credited and that the original publication in this journal is cited, in accordance with accepted academic practice. No use, distribution or reproduction is permitted which does not comply with these terms.
*Correspondence: Saskia Rühl, sru@pml.ac.uk; sasruhl@gmail.com