Marine Litter Pollution in Baltic Sea Beaches – Application of the Sand Rake Method
 Mirco Haseler1,2*
  Arunas Balciunas2
  Rahel Hauk1
  Viktorija Sabaliauskaite1,2
  Irina Chubarenko3
  Alexandra Ershova4
  Gerald Schernewski1,2
- 1Leibniz Institute for Baltic Sea Research Warnemuende, Rostock, Germany
- 2Marine Research Institute, Klaipėda University, Klaipėda, Lithuania
- 3Atlantic Branch, Shirshov Institute of Oceanology of Russian Academy of Sciences, Kaliningrad, Russia
- 4Department of Geoecology, Environmental Management and Ecological Safety, Russian State Hydrometeorological University, Saint-Petersburg, Russia
Most marine litter monitoring methods used on beaches focus on macro-litter (>25 mm) only and show shortcomings regarding smaller litter classes (<25 mm), especially at Baltic Sea beaches. Therefore, we used a sand rake method developed for large micro- (2–5 mm), and meso- (5–25 mm) litter to quantify the overall pollution status of Baltic Sea beaches and to test if the method is useful in terms of the requirements of the Marine Strategy Framework Directive (MSFD). Between July 2017 and October 2019, 197 sand rake method surveys were carried out at 35 regions around the Baltic Sea. In total, 9345 litter pieces were found on an area of 10,271 m2 of which 69.9% were 2–25 mm in size. Artificial polymers (4921 litter pieces) were predominant (mean 52.7% ± 13.3). Abundance of litter was 0.91 pieces/m2 ± 1.50 (median 0.40 pieces/m2). The most common litter were industrial pellets (19.8%), non-identifiable plastic pieces 2–25 mm (17.3%), cigarette butts (15.3%), and paraffin (11.9%). At 15 surveys at the German North Sea island of Sylt the litter abundance ranged from 0.45 pieces/m2 (median) to 0.59 pieces/m2 ± 0.37 (mean). Here, 69.2% of the litter was 2–25 mm in size and paraffin was predominant (69.2%). Beaches show a high pollution level with large micro- and meso-litter (2–25 mm) and our data can serve as a Baltic-wide pollution baseline. In contrast to the naked eye OSPAR method for macro-litter, the sand rake method is generally applicable on all sandy beaches, both urban and remote. This method also allows for the provision of a full spatial pollution pattern and can serve for assessing the effectiveness of marine litter mitigation measures.
Introduction
Marine litter is any discarded or lost material entering the marine environment from human activities (Cheshire et al., 2009). It is found in all marine habitats (UNEP, 2005; Ivar do Sul and Costa, 2014) and it is a growing threat for the marine environment (Pham et al., 2014) all over the world. It occurs in all size ranges from commercial shipping containers to plastic bottles, cigarettes butts, industrial pellets, all the way down to particles in nanometer size. Plastic as the vast majority of anthropogenic litter (Reisser et al., 2013) is found on the surface of the open sea (Law et al., 2010; Cozar et al., 2014; Eriksen et al., 2014), in the deep sea (Peng et al., 2020), in the Arctic (Tekman et al., 2017), and on beaches worldwide (UNEP, 2015; Matsuguma et al., 2017). To protect the marine environment across Europe, the Marine Strategy Framework Directive (MSFD) was adopted, to achieve a ‘Good Environmental Status’ (GES) of European waters through the use of 11 descriptors by 2020 (MSFD, 2008/56/EC). Descriptor 10 specifies, that the GES is achieved only when “Properties and quantities of marine litter do not cause harm to the coastal and marine environment” (MSFD, 2008/56/EC). This requires the assessment of “trends in the amount of litter washed ashore and/or deposited on coastlines, including analysis of its composition, spatial distribution and, where possible, source” (MSFD TSG ML, 2013). Marine litter on coastlines and beaches is obvious and omnipresent (JRC, 2011). Therefore, the monitoring of sandy beaches is a common method to assess the pollution of marine systems (Browne et al., 2015), as beaches are considered to be a major sink for marine litter (Cauwenberghe et al., 2015).
To assess the pollution of beaches in the European Union, a standardized macro-litter (>25 mm) monitoring method (OSPAR, 2010) is largely used. This ‘naked eye’ OSPAR method is carried out on rural and unmanaged beaches of the North-East Atlantic (Schulz et al., 2017) and at Baltic Sea beaches (Balčiūnas and Blažauskas, 2014; LUNG M-V, 2015). However, this method is less suitable for many Baltic Sea beaches (Schernewski et al., 2017) because many of them are managed and cleaned and therefore do not meet the OSPAR criteria for the selection of reference beaches. Additionally, an increase in public awareness leads to more beach litter collections (by locals, non-government organizations, beach users, etc.) that could mask actual variations in litter abundance and composition (Addamo et al., 2017; Schöneich-Argent et al., 2019). Furthermore, naked eye methods neglect most of meso- (5–25 mm) and large micro-litter (1–5 mm) at the beach, as it is simply overlooked, due to its small size (JRC, 2011). Therefore, most litter (<25 mm) remains in the sediment, even if beaches are cleaned (Laglbauer et al., 2014; Lee et al., 2017). Accordingly, higher amounts of litter (<25 mm) are found at urban beaches (Okuku et al., 2020).
Meso- and large micro-litter are important size fractions that are numerically abundant and require an appropriate and harmonized monitoring approach in order to understand litter degradation at beaches (Hanke et al., 2019). Subsequent analysis of material and polymer types of meso- and large micro-litter can help to determine the origin or the initial product (Addamo et al., 2017). In general, new monitoring methods that deliver reliable data for smaller litter (<25 mm) at affordable costs are needed (MSFD TSG ML, 2013; Addamo et al., 2017). To address this issue, Haseler et al. (2017) tested a sand rake method at German and Lithuanian Baltic Sea beaches. They concluded that meso- and large micro-litter are a major problem at Baltic beaches as it was responsible for 65% of the litter found in terms of size.
The objective of this study is to test the general applicability of the sand rake method on a wide range of sandy beaches. Therefore, we (a) applied the sand rake method on a large scale, in all bordering states of the Baltic Sea and at tidal beaches at the German North Sea, (b) documented beach pollution with litter items in the size classes of large micro-, meso-, and macro-litter, (c) identified the polymer types of plastic litter using a mobile infrared spectrometer (Microphazir), and based on this information, we (d) provide cost estimations and discuss the suitability of the sand rake method for a MSFD monitoring, complementing the existing macro-litter OSPAR method.
Study Sites and Methods
With 377,000 km2, the enclosed, micro-tidal (<15 cm) (Sztobryn et al., 2005) Baltic Sea is one of the largest brackish water bodies worldwide and is surrounded by nine countries, with 85 million inhabitants living in the drainage basin (Leppäranta and Myrberg, 2009). Limited water exchange takes place with the North Sea (HELCOM, 2010). Coastal types in the Baltic Sea region are highly diverse, including (but not limited to) soft moraine cliffs, sandy beaches/dunes, rocky cliffs, meadows, and organic wetlands (Łabuz, 2015), with moraine material dominating in the south and southeast, and hard bottom and rocky shores at the northern coasts (Schiewer, 2008).
In order to investigate marine litter (>2 mm) around the beaches of the Baltic Sea, the sand rake method was applied 205 times, in 35 regions, in all of the nine bordering states of the Baltic Sea. Additionally, the island of Sylt region (North Sea, Germany) was surveyed 15 times (Figure 1). Survey areas were limited to sandy beaches. The regions were chosen to present a spatial overview of the abundance of beach litter at Baltic Sea beaches. Therefore, a first screening of possible regions was carried out online via Google Earth. Here, photos of the beaches were checked to investigate if the beach sediment in the regions is sandy and if beaches were accessible by car. This clustered monitoring approach (for the different regions) was chosen, as it was not possible to investigate the same beaches several times. At different beaches, the small-scale distribution of litter was investigated. Thus, two surveys were taken at the same beach with a distance (length of the beach) of 50–100 m in between. The abundance of litter in the 36 different regions (Table 1) was surveyed with a minimum of two and a maximum of 18 surveys (in average = six) per region. Six surveys per region were considered to be feasible within 2 days. Only two or three beach surveys could be taken in four regions (Table 1) because of circumstances outside of researcher control (thunder storm and heavy rains). In other regions close to the author’s institutes, additional surveys were conducted. All surveys were taken during daylight hours (no designated time). Tides were not considered during the surveys of the Baltic Sea. North Sea surveys were taken during outgoing tide to avoid a flooding of the survey area. Rainy weather and wet beach sediment was avoided, as the sand rakes clogs faster. Two people, each with a sand rake, conducted the surveys. All surveys were carried out by the authors in the months of June–October between 2017 and 2019.
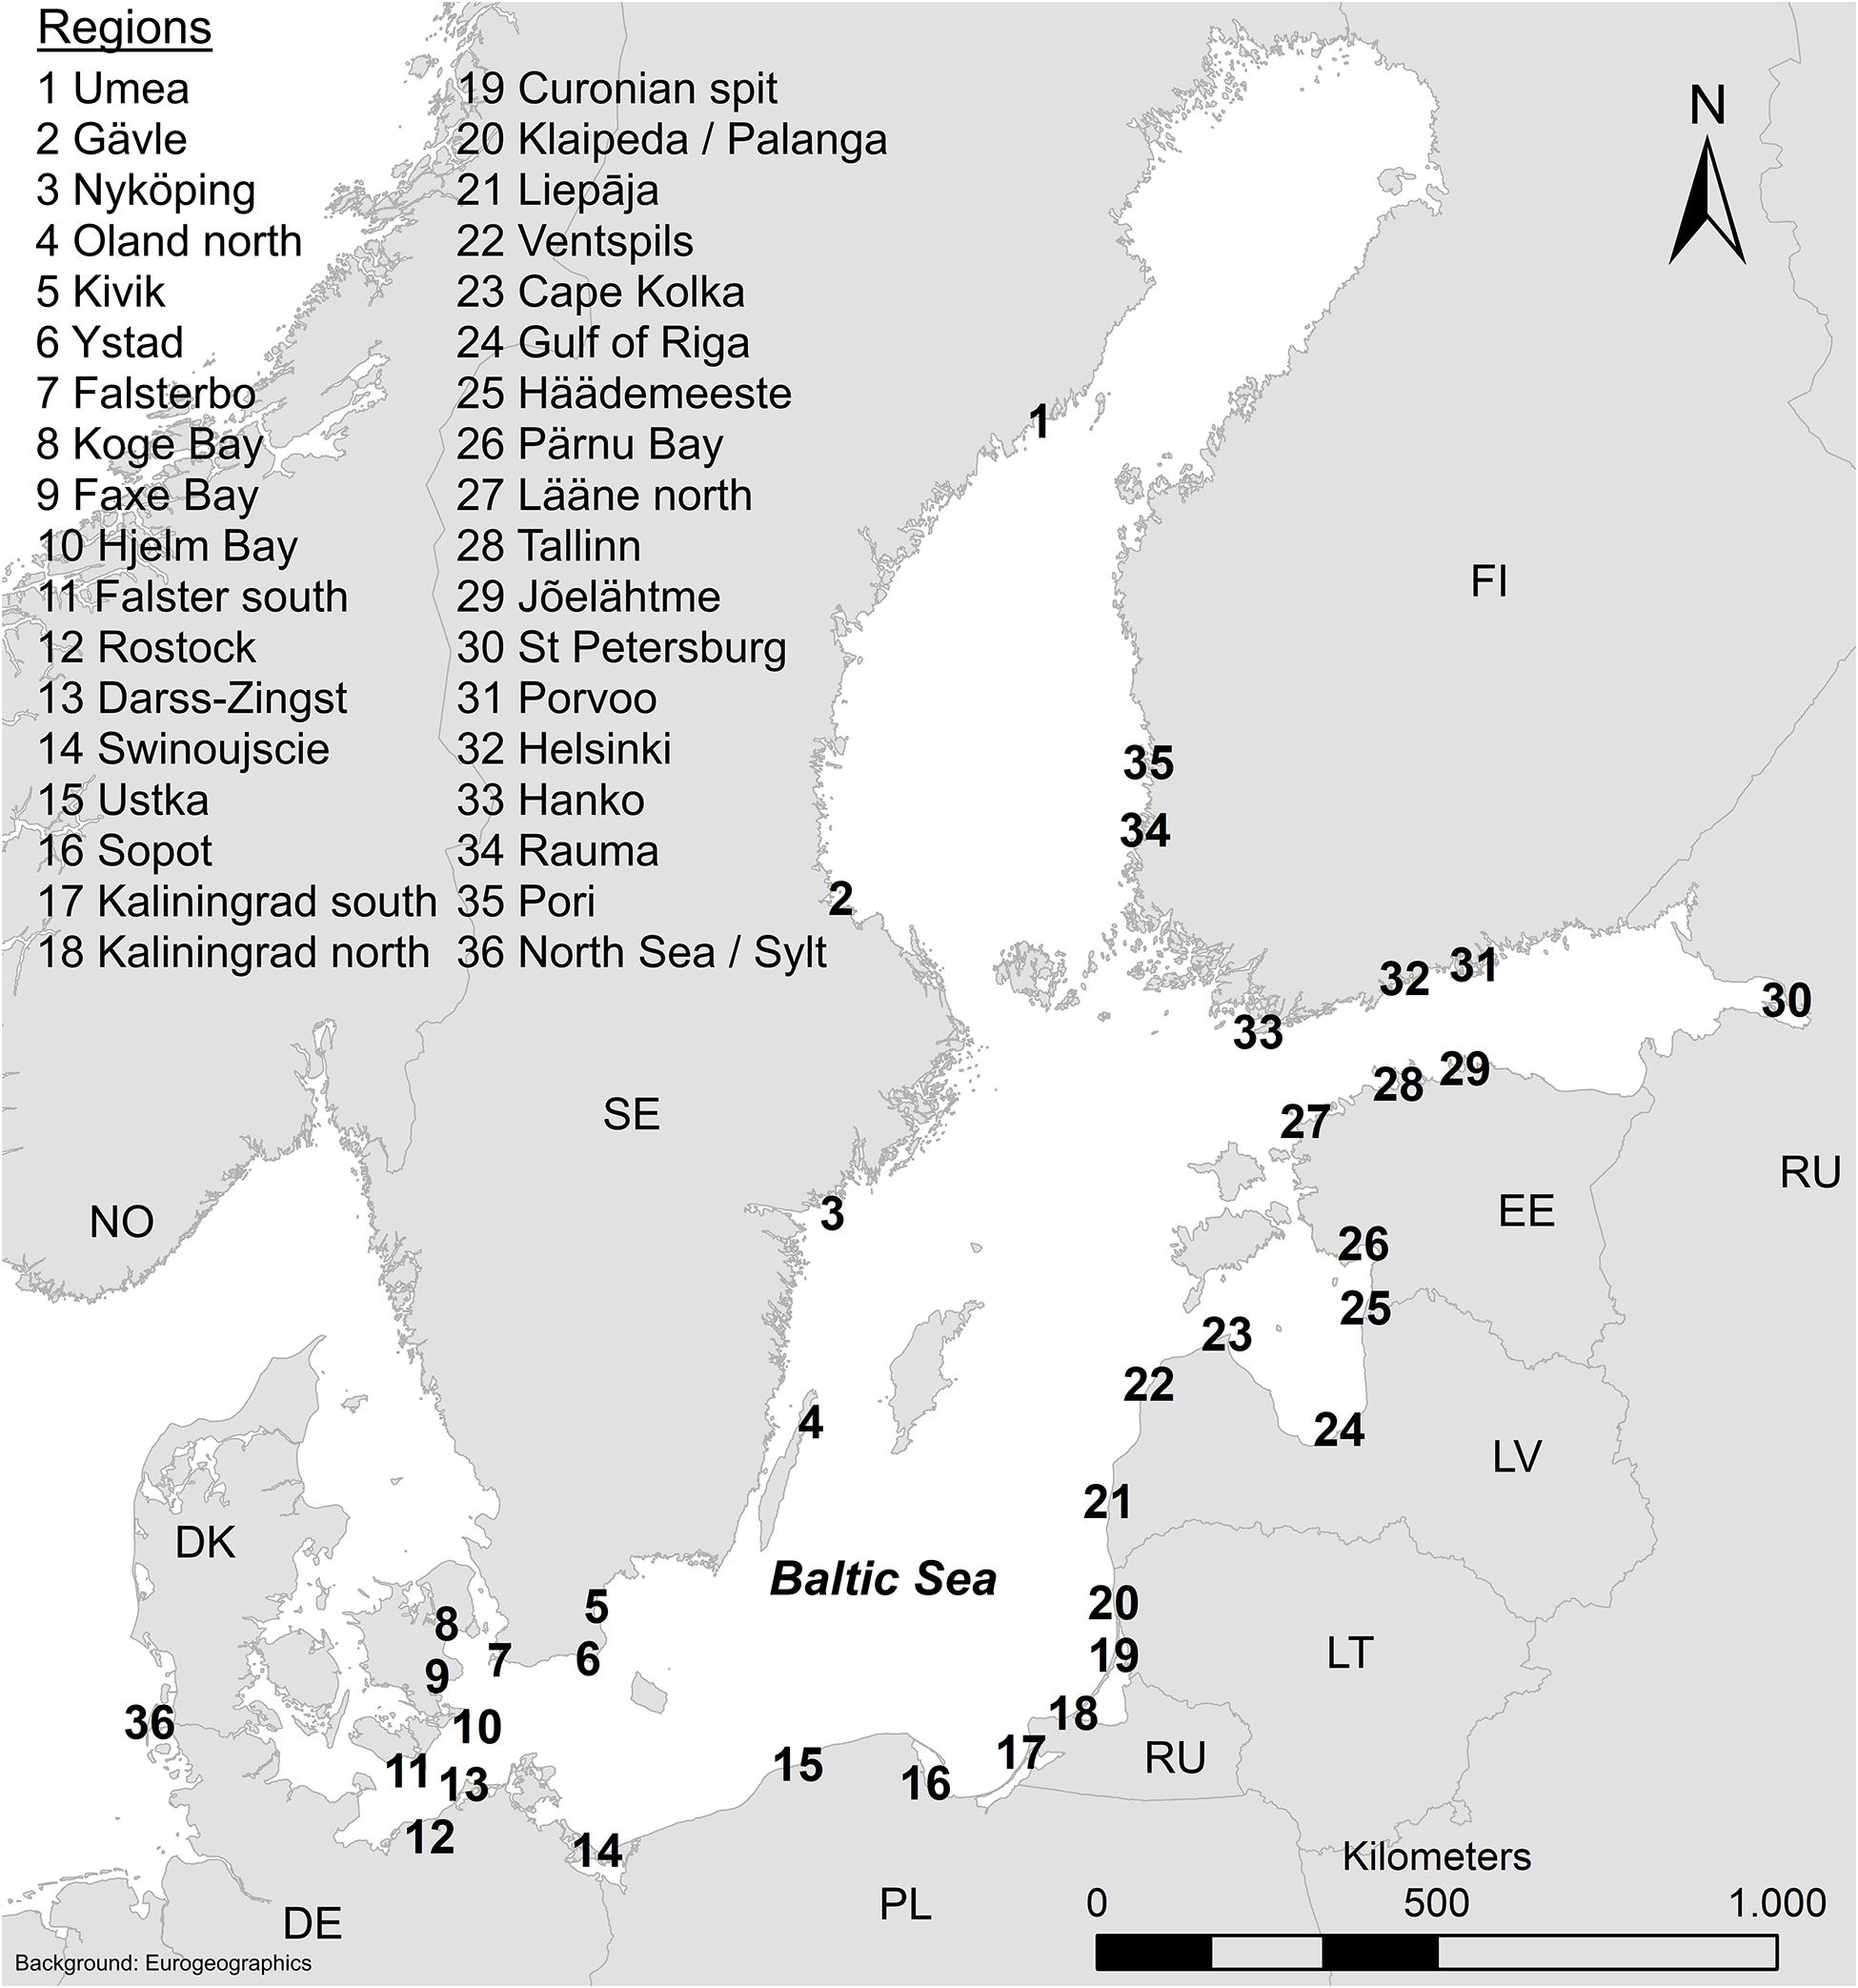
Figure 1. Overview map of the Baltic Sea and part of the North Sea with the 36 survey regions (Eurogeographics, 2019).
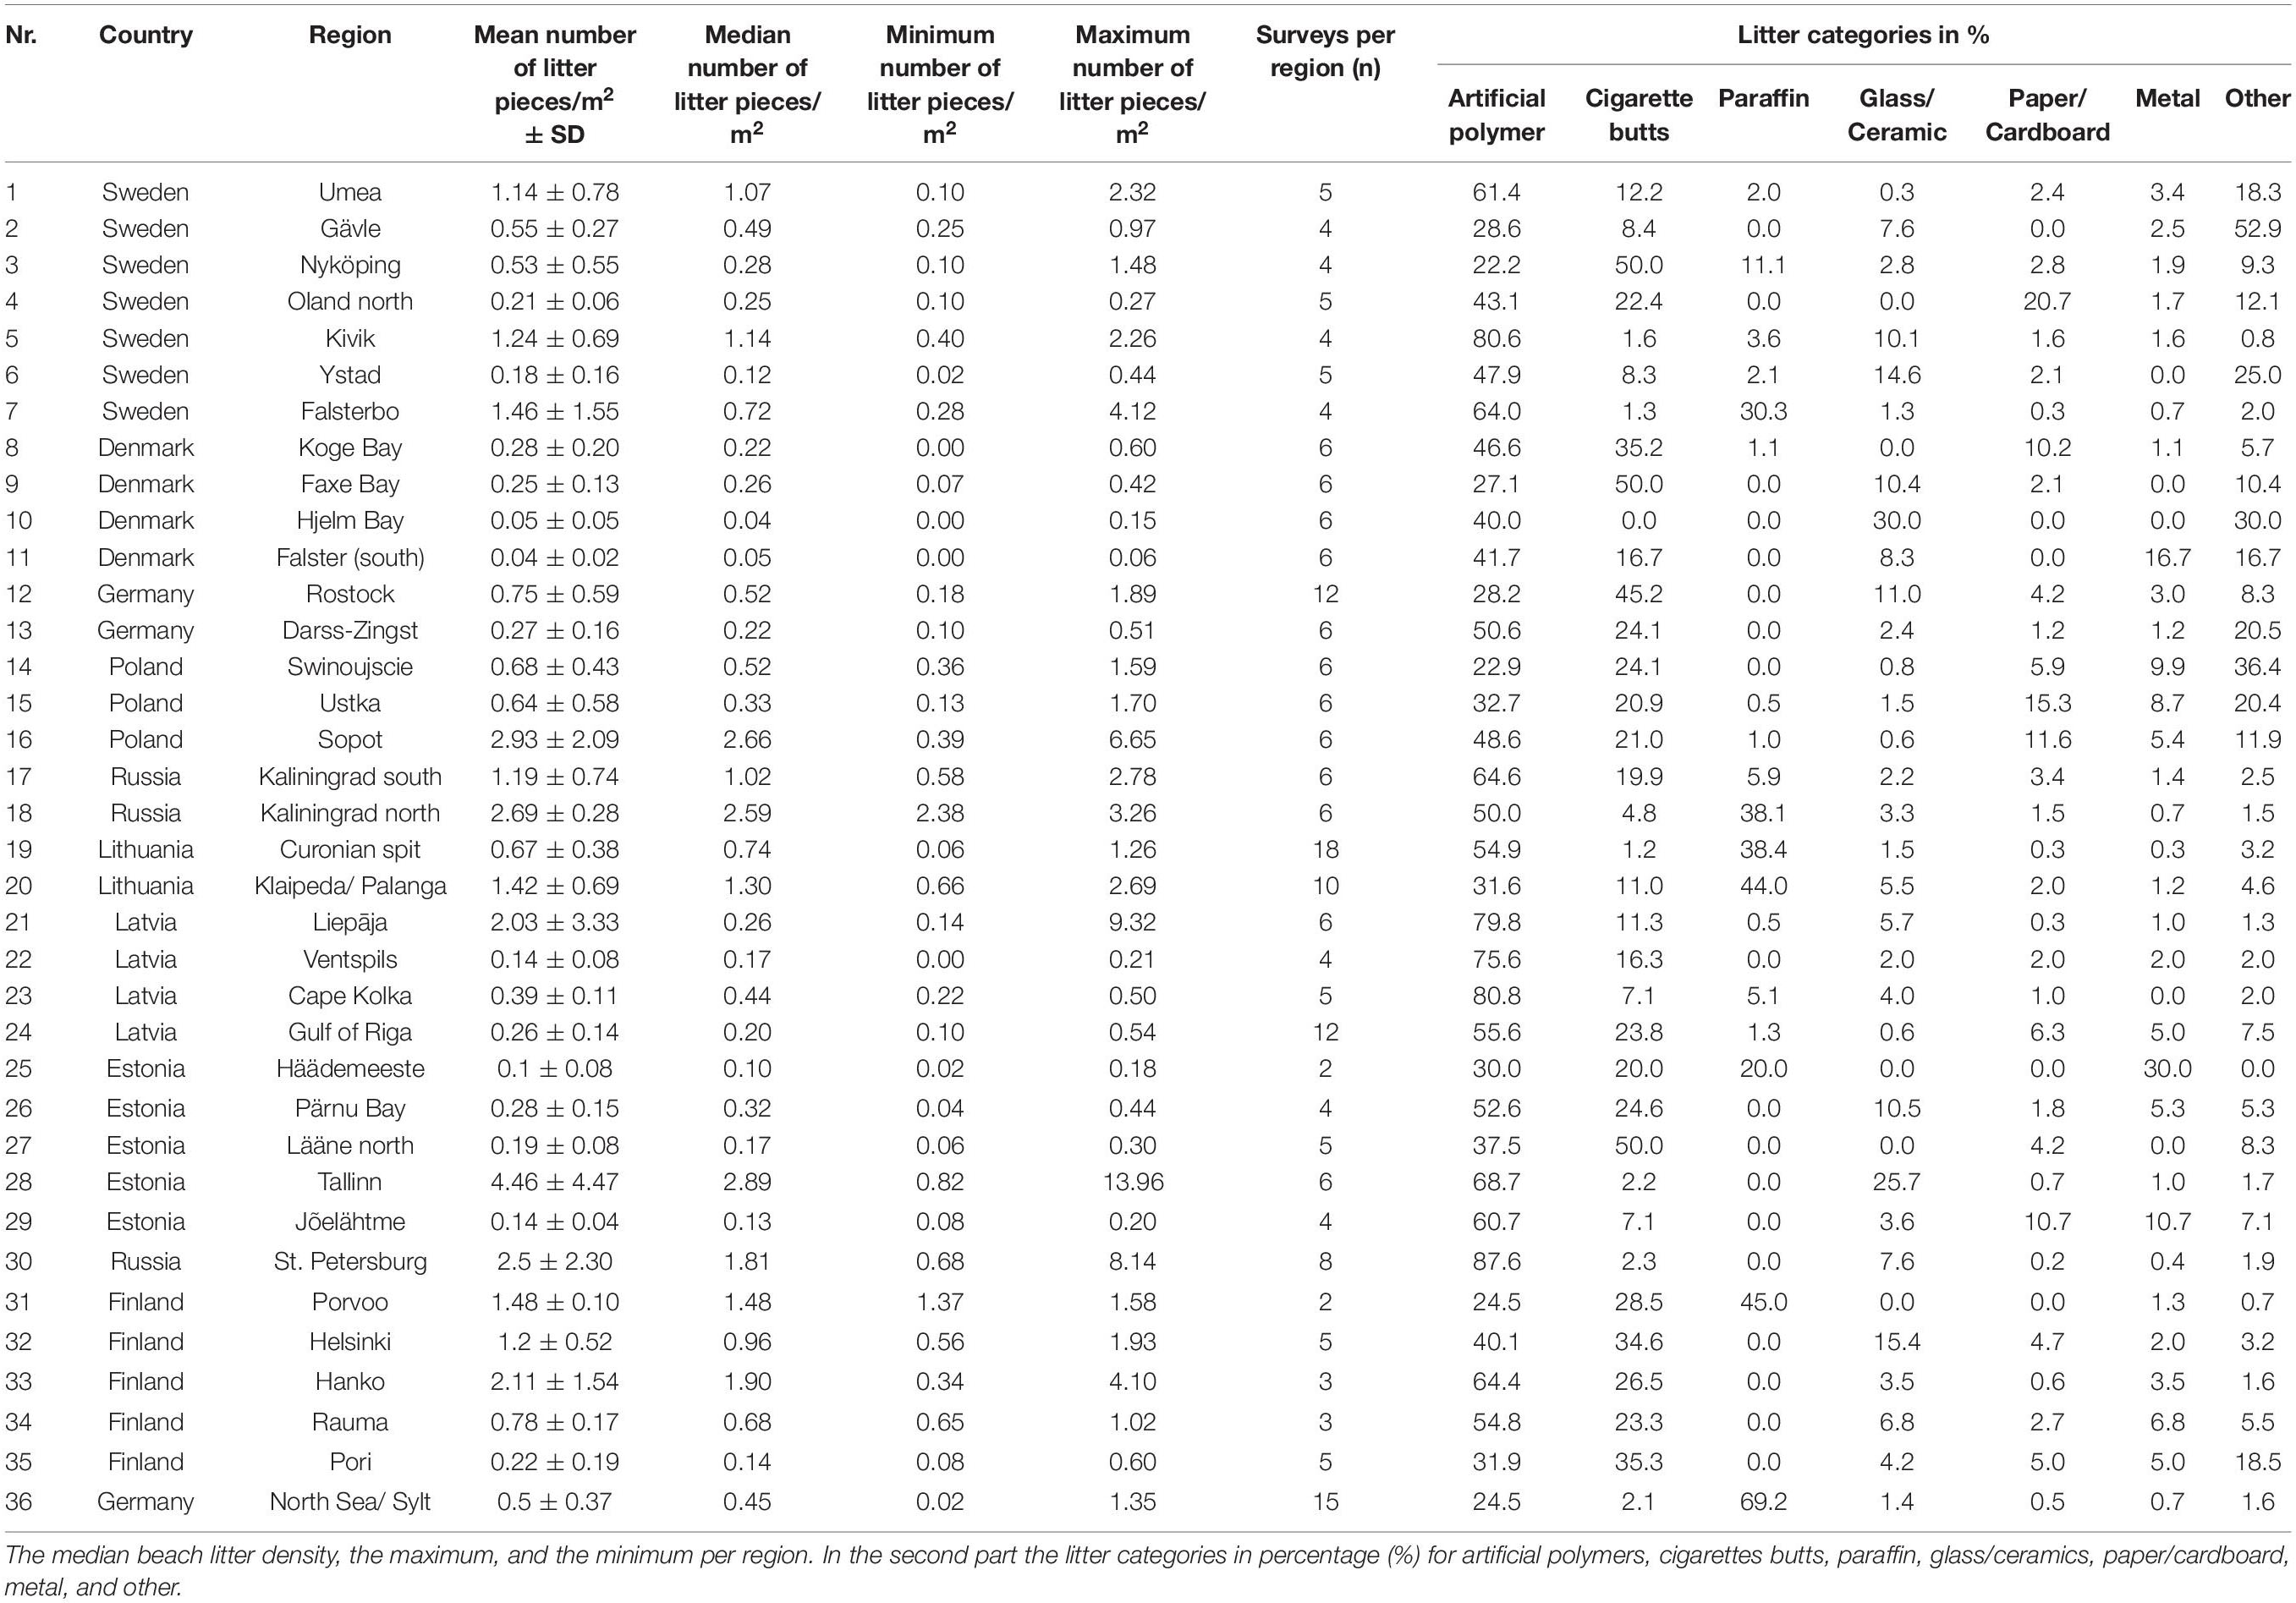
Table 1. The average beach litter density for the 36 different regions in mean numbers of litter pieces/m2 ± SD.
The length of the examined beaches differed, from around 50 m to a few kilometers. The beach width, from the waterline to the back of the beach (vegetation, cliff, etc.) varied between <5 and 220 m. The exact survey area location on each beach was randomly chosen. When two surveys were conducted at one beach, a gap of around 50–100 m was maintained between the surveys. The manual used sand rake has an operational width of 0.5 m and a mesh size (MS) of 2 mm. During sediment raking, maintenance of a 3–5 cm penetration depth was attempted, although depth wasn’t actively measured and depended on beach sediment properties.
In general, the backshore was sampled. Sand raking started at the first occurrence of dry sand by the waterline. The beach was raked in columns until the landward end of the beach (dune, vegetation, wall, etc.). Each column is further divided into subsections of 5 m length, with an area of 2.5 m2 (Figure 2). Since the entire beach width should be surveyed, this resulted in different amounts of subsections. The minimum surface area per survey was 50 m2. Therefore, if the area of one column was less than 50 m2, more columns were necessary. All columns were sampled in full, even if the minimum area of (50 m 2) was reached, meaning most surveys sampled an area >50 m2. Due to thunderstorms, heavy rain, occurrence of beach visitors or other beach characteristics, this was not always possible and led to eight surveys with just one entire row surveyed, with sampled areas between 25 and 28 m2. The average surveyed area was 52 m2 (maximum 110 m2 and minimum 25 m2; Supplementary Table S1). For more information on how the sand rake method works see Haseler et al. (2017).
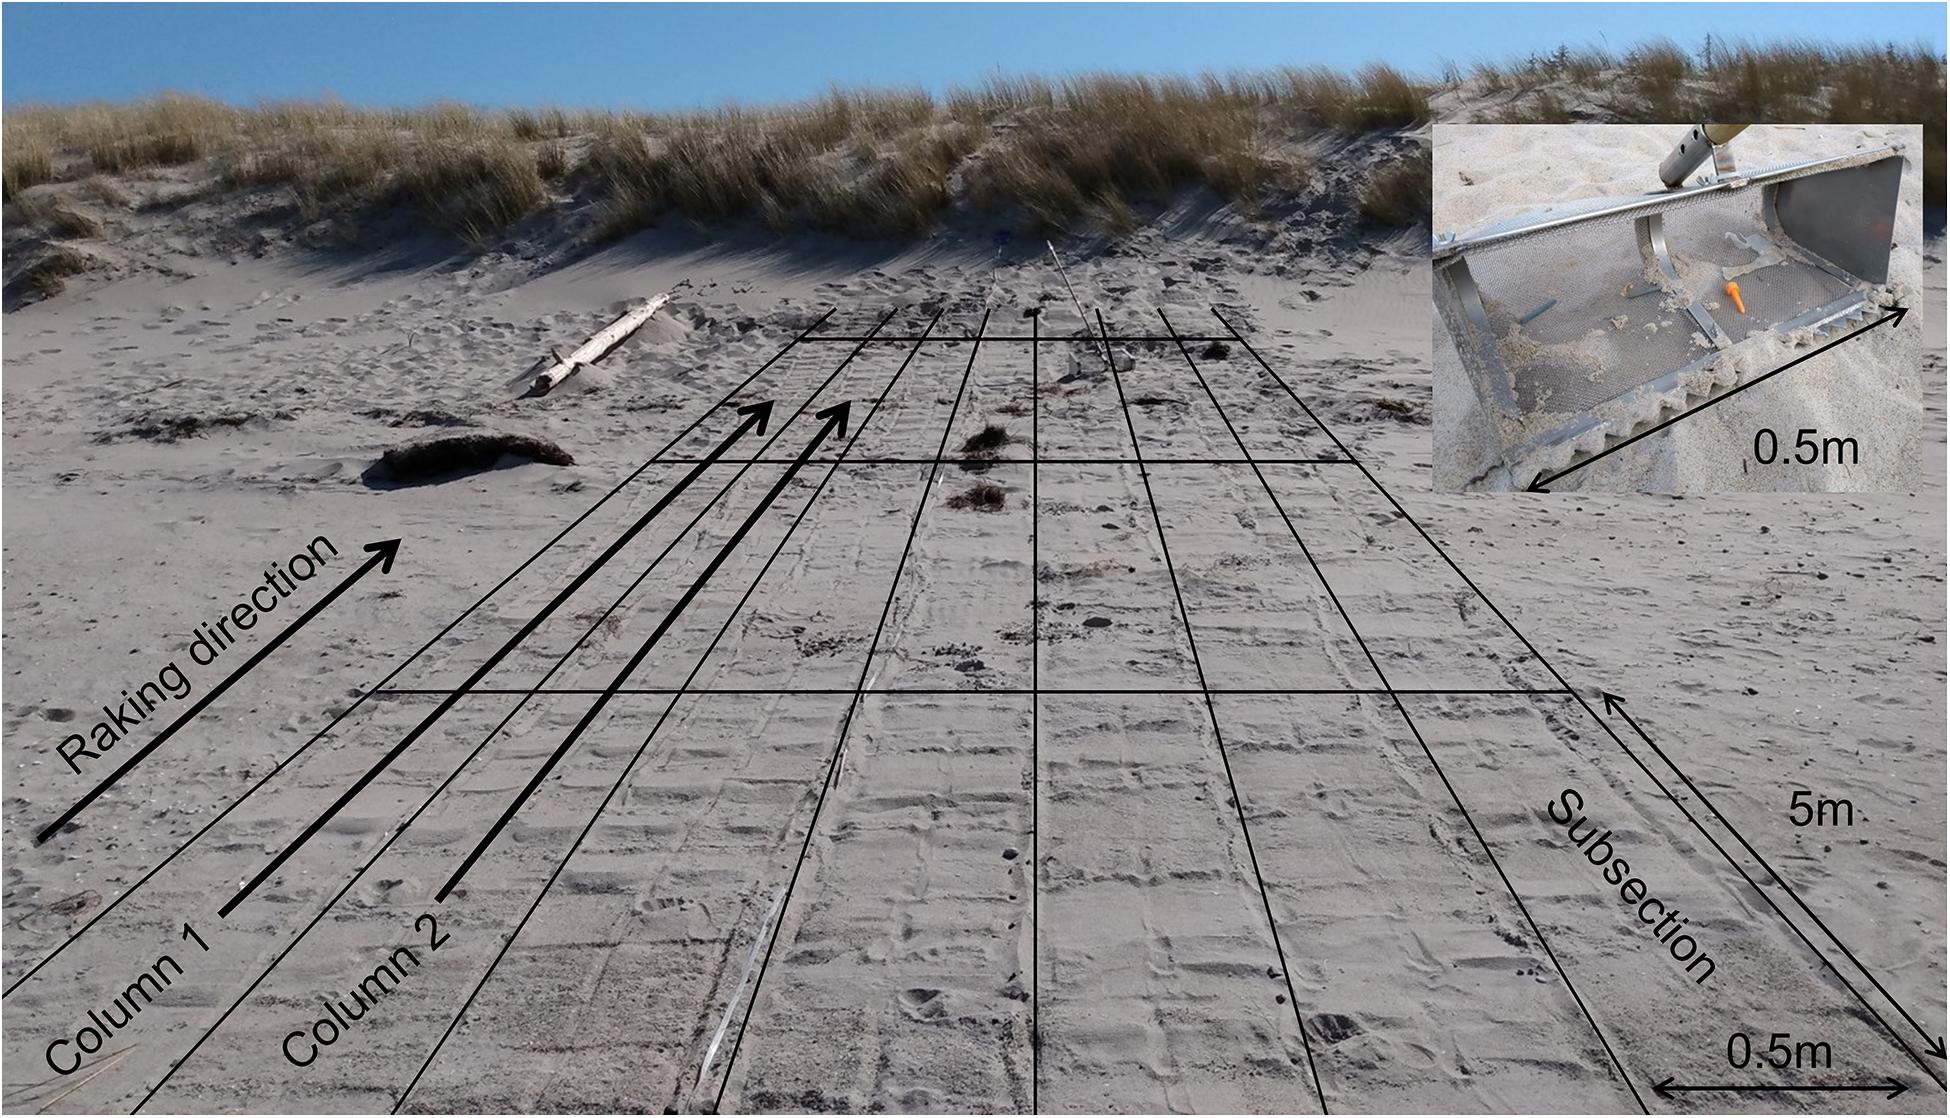
Figure 2. Sand rake method survey on a sandy beach. Raking direction is from the waterline to the back of the beach (backshore). Operation width of the sand rake is 0.5m; the mesh size used is 2 mm. Each survey is divided in subsections of 0.5 m × 5 m resulting in an area of 2.5 m2. Subsections at the back of the beach may be smaller. One survey consists of one or more columns, with different number of subsections. The minimum area per survey is 50 m2.
All litter size classes were collected with the sand rake method at the beach. Litter was later photographed, counted, measured (mm-paper), separated into the micro- (2–5 mm), meso- (>5–25 mm), and macro- (>25 mm) litter fractions and identified based on the list of litter (MSFD TSG ML, 2013). In this study, the list of litter was adapted and included 183 litter items in seven categories (Artificial polymers including rubber (referred as: artificial polymers); cigarette butts; paraffin; paper/cardboard; glass/ceramics; metal; and other). The adaption of the list was necessary to classify different litter items according to their size class. Cigarette butts were counted as an independent category due to their high occurrence (Supplementary Table S2). Non-identifiable plastic pieces were further divided by size, referred to as: micro-plastic pieces (2–5 mm), meso-plastic pieces (>5–25 mm), and macro-plastic pieces (>25 mm) (HELCOM, 2015). Their color was visually determined and the polymer type was analyzed with the Microphazir PC by Analyticon1. The Microphazir uses near-infrared spectroscopy (NIR). The analysis per particle provides two results within five seconds: firstly, the polymer type, and secondly, a percentage of accuracy. In this study, only particles with a percentage accuracy ≥95% are classified into different polymer types. All particles with an accuracy less than 95% were counted as unidentified. Exclusion of black particles from the polymer analysis was necessary, as they do not scatter visible light and absorb the wavelength of the laser in the near infrared.
The Microphazir is a battery-operated, handheld device, using near infrared spectroscopy (NIR) with a resolution of 12 nm (pixels) and 8 nm (optical). The spectral range is 1600–2400 nm. For calibration, an internal reference standard is placed on a glass plate above the light bulb and an analysis is performed. The internal library of the Microphazir covers more than 30 different synthetic polymers and it is possible to import further created libraries by the user. To increase the detection efficiency of dirty plastic particles, the particle was cleaned beforehand (fresh water or ethanol) or a fresh internal surface was exposed by breaking the particle and this surface was used for the analysis. During analysis, spectral results of the particle of interest are compared against library spectra. In this study, only particles that matched the library spectra (≥95%) were classified into corresponding polymer types. Even if the analyzed particle is not an artificial polymer, there is always a percentage result with regard to the most likely polymer type as the Microphazir compares the spectrum of the measured particle with the 30 internal spectra of the internal library.
The costs of future, long-term, sand rake monitoring on German Baltic beaches were calculated for two scenarios (Figure 5). First, the cost of sand rake monitoring on 15 beaches that are not suitable for an OSPAR method were calculated. These 15 beaches were chosen because they met one or more of the following conditions: (a) urban beaches; (b) managed beaches, partially cleaned; (c) close to river mouth; (d) touristic beaches. Furthermore, these 15 beaches should be distributed along the German Baltic coast to provide a spatial overview of the litter abundance. At the German Baltic Sea nearly all accessible sandy beaches are used for touristic purposes. To calculate the amount of tourists visiting a certain beach is difficult, as official numbers are only available for overnight stays at the community level. Here, the “touristic beaches” are located in communities where the governmental statistical services indicate between 0.14 and 2.40 million overnight stays occur per year (Statistisches Amt Mecklenburg-Vorpommern, 2018; Statistisches Amt für Hamburg und Schleswig-Holstein, 2018). For the second scenario, the costs of sand rake monitoring at 14 beaches suggested for the OSPAR method (see Schernewski et al., 2017) were calculated (Figure 5). For both scenarios, the costs of one year of monitoring with a seasonal approach with four surveys (summer, autumn, winter, spring) were calculated. Once for an expert-based approach, here all work steps (WS 1-5) are carried out by experts (German pay scale group E9 Level 1 - 37.50€/h) (Table 4) and second for a volunteer-based approach. In the second approach, trained volunteers shall carry out the beach related work (WS 1-2) only, and the following steps (WS 3-5) are carried out by experts (Table 4). The hours (h) calculated to travel to the beach and back (WS 1; 4 h) are based on the average distance between the Leibniz-Institute for Baltic Sea Research (IOW) and the suggested survey beaches in Mecklenburg-Vorpommern. The averaged hours calculated for the works steps (WS 2-5): the sand rake surveys at the beach (WS 2; 5 h), litter analysis (WS 3; 2.5 h), data processing (WS 4; 1.5 h); and reporting (WS 5; 1 h) are based on the experience of more than 200 sand rake surveys performed by the authors in this study.
Results
Each member state of the EU is responsible for the development of a strategy to reach the GES of its own waters (MSFD, 2008/56/EC). Here, voluntary national actions can be helpful (HELCOM, 2015). Therefore, we decided to present our results on a national level (Tables 2, 3). The results on the beaches of Russia (non EU member state) are divided in the two geographically separated regions named after their central cities - Kaliningrad and St. Petersburg. The results on German beaches are divided in the Baltic Sea and the North Sea surveys. Since geomorphological, social, and other differences may affect the litter abundance on the beaches, we further present our results in different regions per nation (Figure 1 and Table 1).
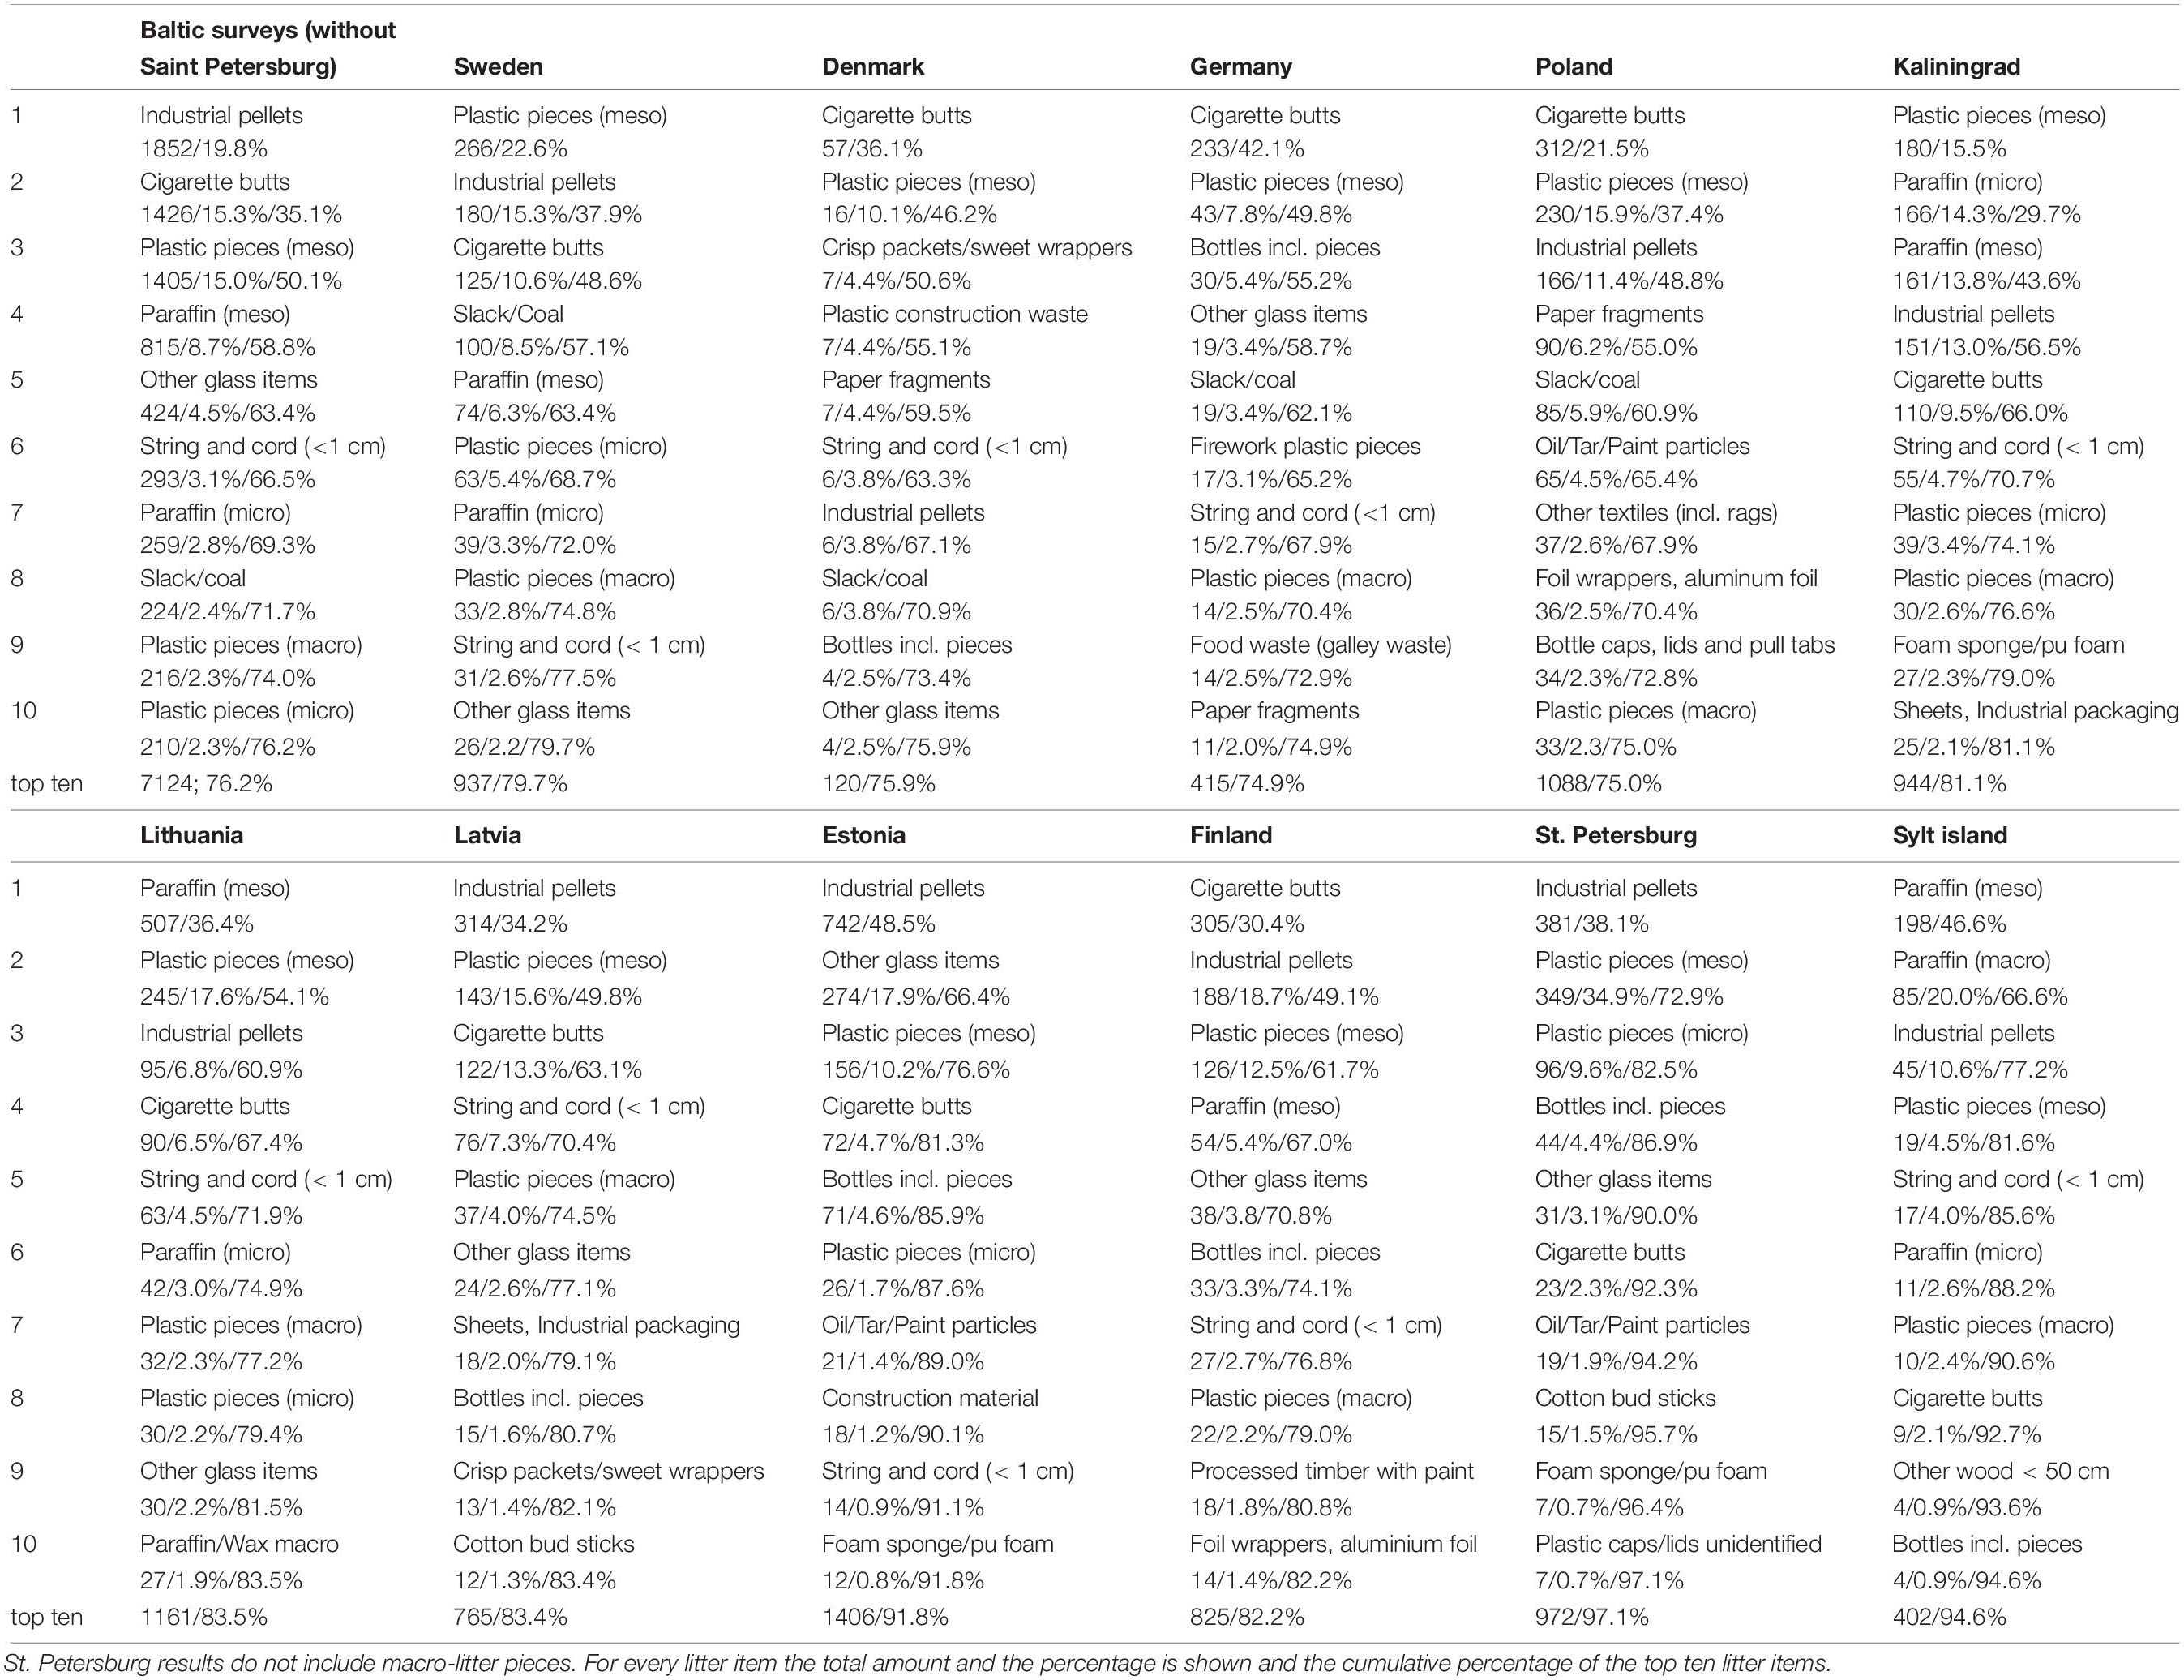
Table 2. Top ten litter items per country, for all Baltic Sea surveys (cumulative) without St. Petersburg, and for the island of Sylt, Germany in the North Sea.
Country Specific Marine Litter Densities
Sweden
In 31 surveys (1624.5 m2) a total of 1176 litter pieces were found (mean 0.72 pieces/m2 ± 0.87; median 0.40 pieces/m2), with a minimum of 0.02 pieces/m2 and a maximum of 4.12 pieces/m. The litter was distributed as follows: 297 micro-litter pieces (0.18 pieces/m2-25.2%), 603 meso-litter pieces (0.37 pieces/m2-51.3%) and 276 macro-litter pieces (0.17 pieces/m2-23.5%) (Table 3). On 14 beaches where 2 surveys were conducted, the small-scale spatial variation of litter per beach was between 0.02 and 3.84 pieces/m2 (mean 0.75/m2 ± 0.99; median 0.42 pieces/m2). The highest pollution (4.12 pieces/m2) was found in the region of Falsterbo and the lowest in the region of Ystad (0.02 pieces/m2) (Table 1).
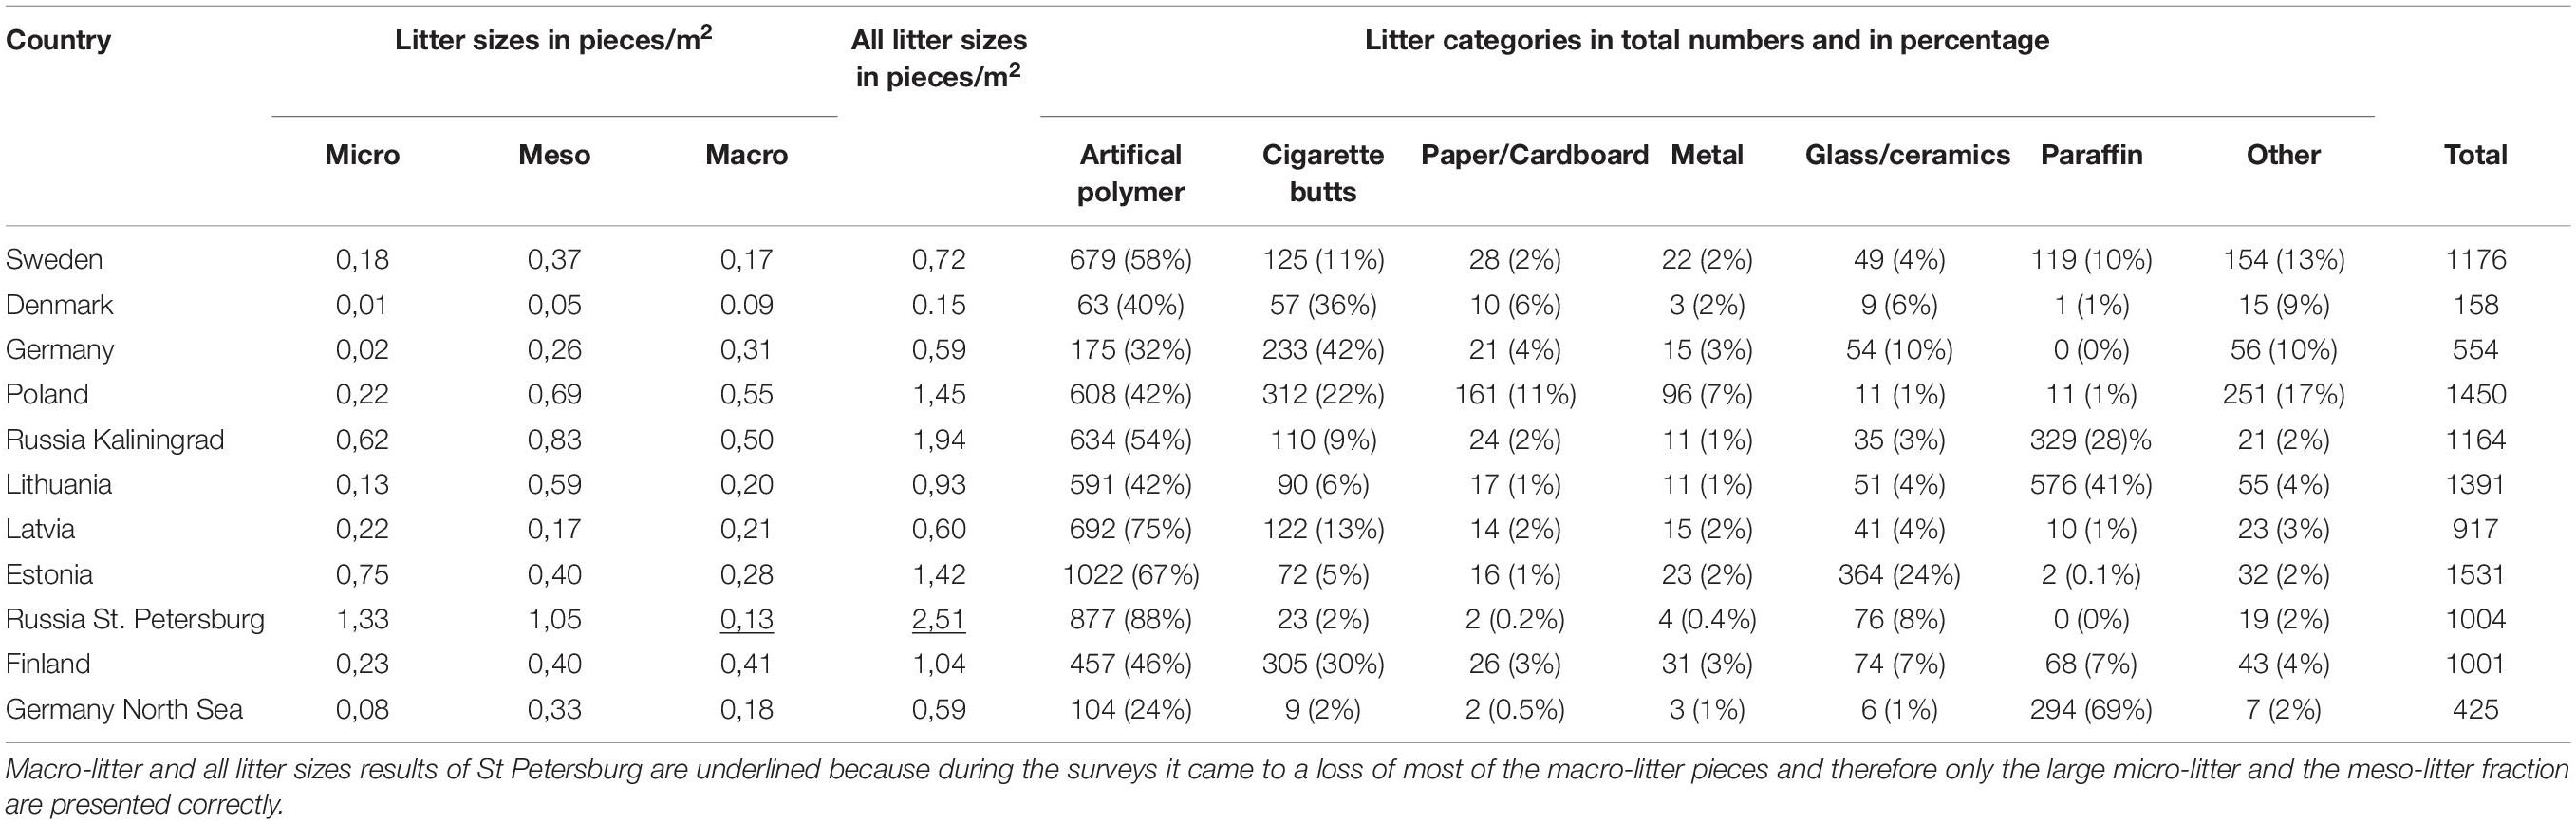
Table 3. Litter sizes in pieces/m2 and the litter categories in total numbers and in percentage for each country.
Denmark
The abundance of litter found in Denmark was the lowest in this study. In 24 surveys (1035 m2) 158 litter pieces were found (mean 0.15 pieces/m2 ± 0.17; median 0.07 pieces/m2). During three surveys no litter was found. Overall, 12 micro-litter pieces (0.01 pieces/m2-7.6%), 50 meso-litter pieces (0.05 pieces/m2-31.6%), and 96 macro-litter pieces (0.09 pieces/m2-60.8%) were collected (Table 3). The highest abundance of litter found were 0.6 litter pieces/m2 in Koge Bay (Table 1). The small-scale spatial variation of litter (12 beaches with 2 surveys) was between 0.001 and 0.35 pieces/m2 (mean 0.13/m2 ± 0.12; median 0.07 pieces/m2).
Germany
Altogether 554 litter pieces were collected in 18 surveys on an area of 944 m2 (mean 0.59 pieces/m2 ± 0.54; median 0.43 pieces/m2). The lowest amount of litter (0.10 pieces/m2) was conducted during a survey in Darss-Zingst. The highest concentration of litter found was 1.89 pieces/m2 during a survey in Rostock (Table 1). Macro-litter pieces (0.31 pieces/m2-52.5%) were predominant, followed by meso-litter (0.26 pieces/m2-43.7%) and micro-litter (0.02 pieces/m2-3.8%) (Table 3). The small-scale spatial variation of litter (9 beaches with 2 surveys) was between 0.003 and 1.71 pieces/m2 (mean 0.33 pieces/m2 ± 0.53; median 0.18 pieces/m2).
Poland
The number of litter pieces collected in 18 surveys (997.5 m2) was 1450 (mean 1.45 pieces/m2 ± 1.67; median 0.67 pieces/m2), with a minimum of 0.13 pieces/m2 (Ustka region) and a maximum of 6.65 pieces/m2 (Sopot region) (Table 1). 220 micro-litter pieces (0.22 pieces/m2-15.2%), 686 meso-litter pieces (0.69 pieces/m2-47.3%) and 544 macro-litter pieces (0.55 pieces/m2-37.5%) were collected (Table 3). On 9 beach areas where 2 surveys each were conducted, the small-scale spatial variation of litter per beach was between 0.04 and 2.38 pieces/m2 (mean 0.60 pieces/m2 ± 0.68; median 0.36 pieces/m2).
Russia – Kaliningrad
A total of 1164 litter pieces were found (12 surveys) on an area of 600 m2, with a minimum of 0.58 pieces/m2 and a maximum of 3.26 pieces/m2 (mean 1.94 pieces/m2 ± 0.94; median 2.48 pieces/m2). The litter size distribution was the following: 370 micro-litter pieces (0.62 pieces/m2-31.8%), 497 meso-litter pieces (0.83 pieces/m2-42.7%) and 297 macro-litter pieces (0.50 pieces/m2-25.5%) (Table 3). On six beach areas with two surveys each, the small-scale spatial variation of litter per beach area was between 0.18 and 1.72 pieces/m2 (mean 0.61 pieces/m2 ± 0.52; median 0.44 pieces/m2). The vast majority of litter along the northern region was paraffin (mean 1.03/m2 ± 0.81; median 0.68 pieces/m2). Lower amounts of paraffin (mean 0.07/m2 ± 0.03; median 0.08 pieces/m2) were found along the southern region (Table 1).
Lithuania
During 28 surveys (1502.5 m2) altogether 1391 litter pieces were collected (mean 0.93 pieces/m2 ± 0.63; median 0.80 pieces/m2). These were composed of 199 micro-litter pieces (0.13 pieces/m2-14.3%), 889 meso-litter pieces (0.59 pieces/m2-63.9%) and 303 macro-litter pieces (0.20 pieces/m2-21.8%) (Table 3). In Klaipeda/Palanga region, the highest pollution detected was 2.69 and 2.3 pieces/m2. The lowest pollution of litter found was at the Curonian spit with 0.06 and 0.16 pieces/m2 (Table 1). On 14 beach areas with two surveys each, the small-scale spatial variation of litter per beach area ranged between 0.04 and 0.76 pieces/m2 (mean 0.28 pieces/m2 ± 0.23; median 0.19 pieces/m2).
Latvia
The overall pollution detected during 27 surveys (1525 m2) was 917 litter pieces (mean 0.60 pieces/m2 ± 1.74; median 0.23 pieces/m2), with a minimum of 0.00 pieces/m2 and a maximum of 9.32 pieces/m2. The litter was nearly equally distributed within the size classes: 334 micro-litter pieces (0.22 pieces/m2-36.4%), 264 meso-litter pieces (0.17 pieces/m2-28.8%) and 319 macro-litter pieces (0.21 pieces/m2-34.8%) (Table 3). On 13 beach areas (with 2 surveys each) the small-scale spatial variation of litter per beach area was between 0.05 and 7.28 pieces/m2 (mean 0.71 pieces/m2 ± 1.90; median 0.18 pieces/m2). By far, region Liepaja was the most polluted one, due to the presence of 9.32 litter pieces/m2. Lowest amount of litter recorded was in Ventspilis; between 0.00 pieces/m2 and 0.21 pieces/m2 (Table 1).
Estonia
In 21 surveys (1075 m2) a total of 1531 litter pieces were found (mean 1.42 pieces/m2 ± 3.1; median 0.25 pieces/m2), with a minimum of 0.02 pieces/m2 and a maximum of 13.96 pieces/m2. The size distribution was 808 micro-litter pieces (0.75 pieces/m2-52.8%), 426 meso-litter pieces (0.40 pieces/m2-27.8%) and 297 macro-litter pieces (0.28 pieces/m2-19.4%) (Table 3). On 8 beach areas with 2 surveys each, the small-scale spatial variation of litter per beach area was between 0.00 and 8.86 pieces/m2 (mean 1.27 pieces/m2 ± 2.87; median 0.22 pieces/m2). Around Tallinn the highest quantity of litter found was13.96 pieces/m2 and 5.10 pieces/m2. Lower numbers of litter were found in the region of Häädemste (0.02 pieces/m2 and 0.18 pieces/m2) (Table 1).
Finland
During 18 surveys (967.5 m2) the amount of litter found was 1004 pieces (mean 1.04 pieces/m2 ± 0.95; median 0.78 pieces/m2). The highest pollution (4.1 pieces/m2) found was around Hanko. The lowest quantity of litter was found in the region of Pori (0.08 pieces/m2) (Table 1). The size class distribution was 227 micro-litter pieces (0.23 pieces/m2-22.6%), 383 meso-litter pieces (0.40 pieces/m2-38.1%) and 394 macro-litter pieces (0.41 pieces/m2-39.2%) (Table 3). On 4 beach areas with 2 surveys each, the small-scale spatial variation of litter per beach area was between 0.06 and 0.40 pieces/m2 (mean 0.29/m2 ± 0.14; median 0.35 pieces/m2 ± 0.14; median 0.35 pieces/m2).
Russia – St. Petersburg Region
During the surveys it came to a loss of most of the macro-litter pieces and therefore only the large micro-litter and the meso-litter fraction are presented correctly. Accordingly, the amount of 52 macro-litter pieces (0.13 macro-litter pieces/m2) is too low as many more macro-litter pieces were found but could not be quantified due to their loss. That also influences the total number of litter found (Table 3); here the numbers would be higher too.
In 8 surveys (400 m2) a total of 1001 litter pieces were found (mean 2.50 pieces/m2 ± 2.30; median 1.81 pieces/m2). The size class distribution was 530 micro-litter pieces (1.33 pieces/m2-52.9%), 419 meso-litter pieces (1.05 pieces/m2-41.9%) and 52 macro-litter pieces (0.13 pieces/m2-5.2%) (Table 3). The highest quantity of litter found was 8.14 pieces/m2. The lowest amount of litter recorded was 0.68 pieces/m2 and 0.82 pieces/m2 (Table 1). In two surveys (RU 13 and RU 14) hundreds of non-identifiable rusted metal pieces (2-10mm) were found. These were found nowhere else, and as there was no reference to the original source, the results of this outlier event were not included in the following results and figures.
Germany North Sea/Sylt Island
A total of 425 litter pieces (mean 0.51 ± 0.37 pieces/m2; median 0.45 pieces/m2) were found in 15 surveys (829 m2) on the island of Sylt composed of 56 micro-litter pieces (0.07 pieces/m2-13.2%), 238 meso-litter pieces (0.29 pieces/m2-56.0%) and 131 macro-litter pieces (0.16 pieces/m2-30.8%) (Table 3). Paraffin occurred in 13 of 15 (87%) surveys and 198 pieces (67.3%) of the paraffin belonged to the meso-litter size class (Table 2).
General Results Baltic Sea
Due to the loss of macro-litter data (disappearance/loss of the plastic bags with litter), the eight St. Petersburg surveys were not included in the following results. The litter collected in 197 surveys (10.271 m2) on the Baltic beaches (without St. Petersburg) of nine countries totaled up to 9345 pieces (mean 0.91/m2 ± 1.50; median 0.40 pieces/m2) of which there were 2489 micro-litter pieces (0.24 pieces/m2-26.6%), 4040 meso-litter pieces (0.39 pieces/m2-43.2%), and 2816 macro-litter pieces (0.27 pieces/m2-30.1%) (Figure 3 and Table 3). The artificial polymers category was the main contributor to the overall pollution (mean 52.7% ± 13.3) in nearly all countries, followed by cigarette butts (mean 15.3% ± 13.0), and paraffin (mean 11.9% ± 14.1). Glass/ceramics (mean 7.4% ± 6.4), other (mean 7.0% ± 5.2), paper/cardboard (mean 3.4% ± 3.1), and metal (mean 2.4% ± 1.7) were only found in lower amounts (Table 3). Artificial polymers in the micro-and meso-litter size class had an especially high share (41.1%) of the overall pollution. In Lithuania (41%) and Kaliningrad, Russia (28%), paraffin was found in large numbers.
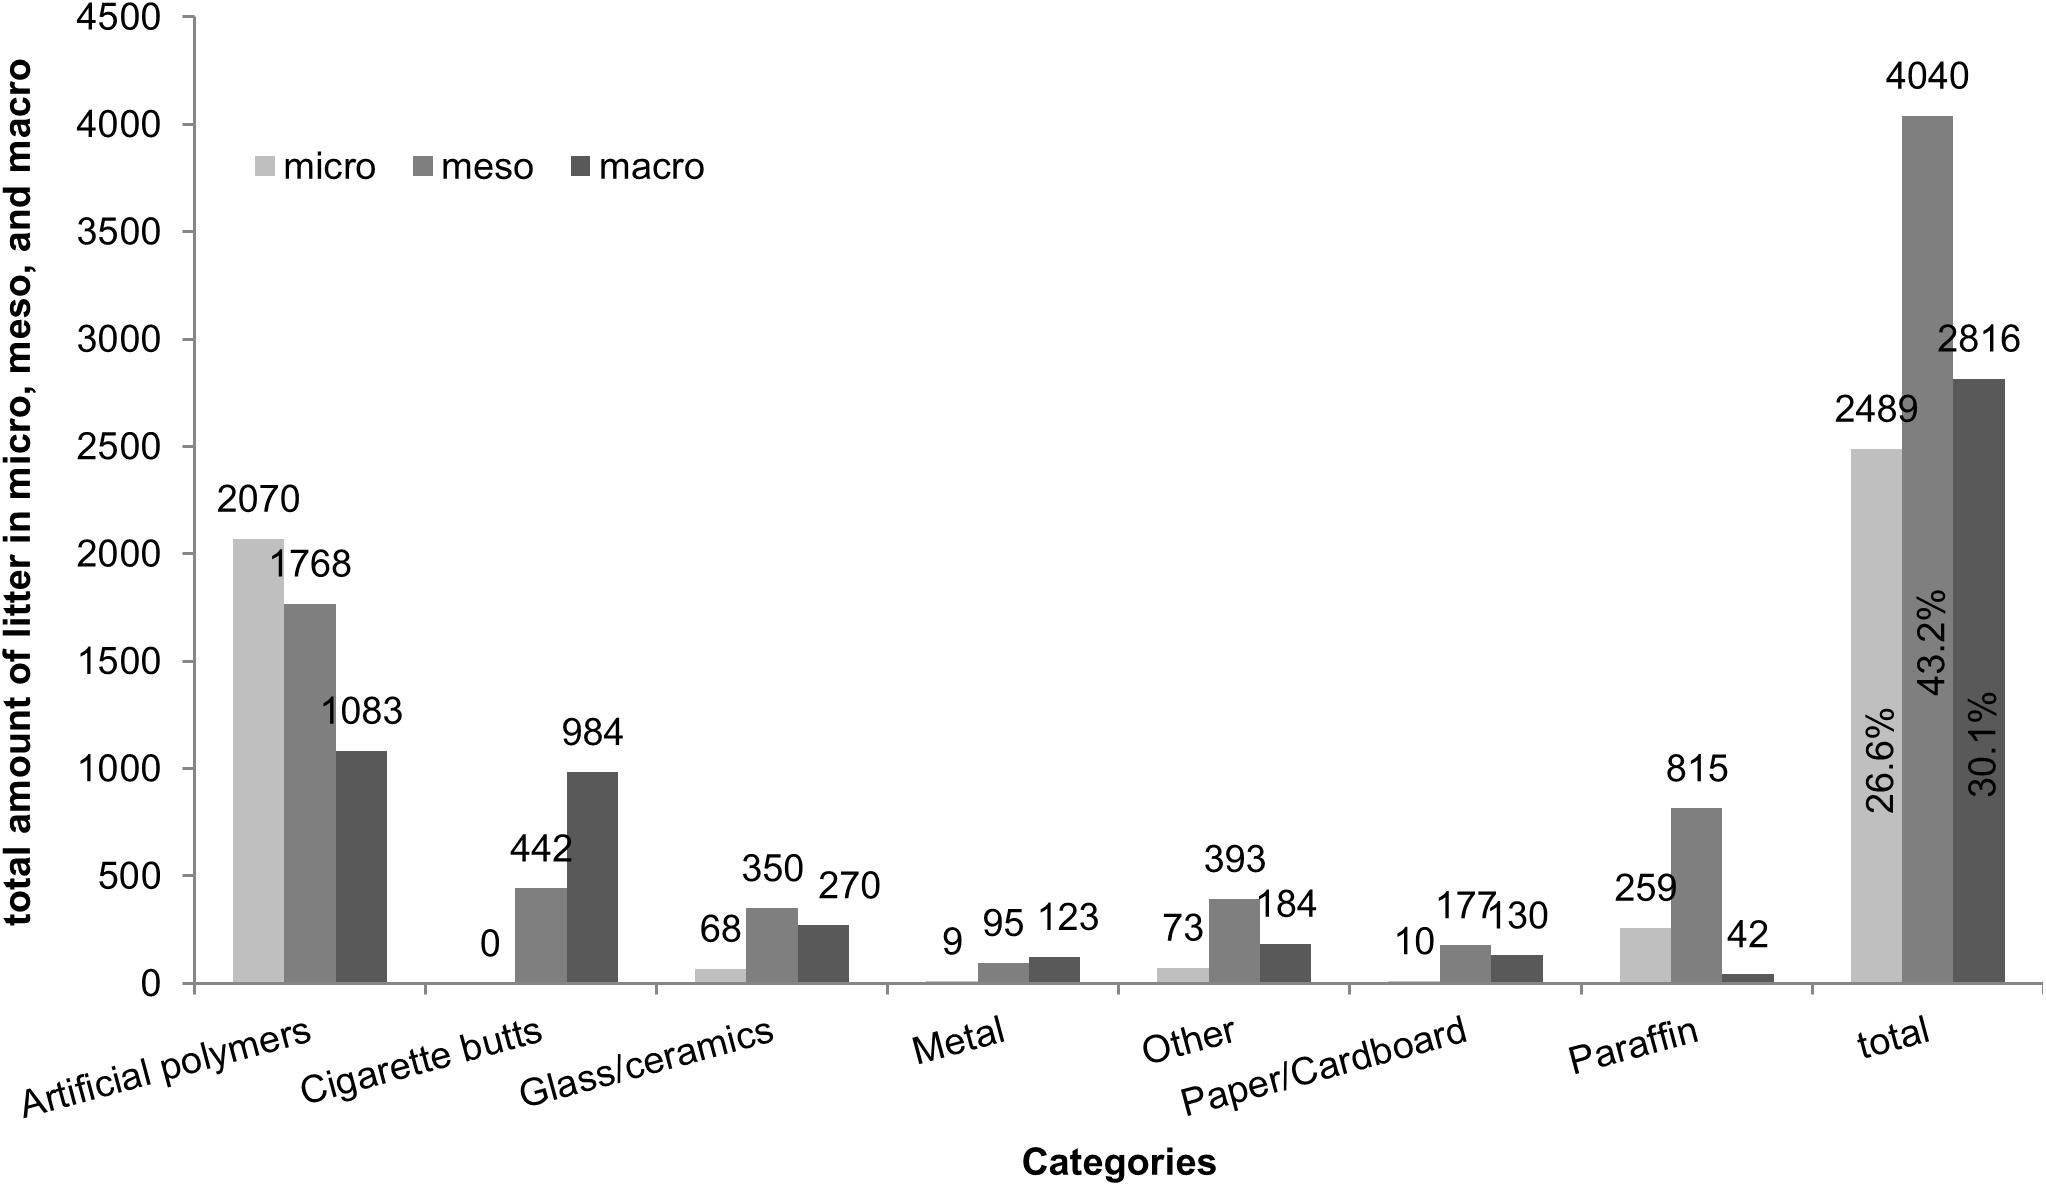
Figure 3. The amount of micro-, meso-, and macro-litter per category and the total amount of litter at the beaches of the Baltic Sea (n = 197).
Industrial Pellets, Cigarette Butts, Non-identifiable Plastic Pieces and Paraffin
In total, 1852 industrial pellets found in 102 of 197 (52%) surveys were the most common litter item in this study (19.8%), and ranged from 0 to 8.86 industrial pellets/m2 (mean 0.18/m2 ± 0.79; median 0.02 pieces/m2). With one exception (Germany), industrial pellets were found in all countries within the top ten items (Table 2). Most industrial pellets 45.6% (in three surveys) and 73.3% (in ten surveys) were found close to the urban/industrial regions.
Cigarette butts were the second most abundant litter item (15.3%), with a total of 1426 cigarette butts found in 150 out of 197 (76%) surveys and their quantity ranged from 0 to 1.51 cigarette butts/m2 (mean 0.14/m2 ± 0.22; median 0.06 pieces/m2). A total of 984 (69.0%) cigarette butts found belonged to the macro-litter size class, the other 442 (31.0%) were meso-litter.
With a quantity of 1405 pieces, meso-plastic pieces were the third most common litter, found in 145 of 197 surveys (73.6%), with a range of 0 to 2.0 meso-plastic pieces/m2 (mean 0.14/m2 ± 0.25; median 0.05 pieces/m2). 210 micro-plastic pieces were found in 76 of 197 surveys (38.6%), with a range of 0 to 0.29 pieces/m2 (mean 0.02/m2 ± 0.04; median 0.00 pieces/m2).
In total, 1116 paraffin pieces (all size classes) were found in 58 of 197 (29.4%) surveys. Most of the paraffin pieces were collected in Lithuania (62.2%), in Russia, Kaliningrad (19.8%), in Sweden (9.1%) and in Finland (6.6%). Lowest numbers of paraffin pieces were found in Poland (1.1%); Latvia (0.9%); Estonia (0.2%); and Denmark (0.1%), while no paraffin pieces were found in Germany and in Russia, St. Petersburg. Paraffin was found in all size classes. Combined results of the three size classes lead to a quantity range from 0 to 2.28 paraffin pieces/m2 (mean 0.11/m2 ± 0.33; median 0.00 pieces/m2).
Near-Infrared Polymer Analysis With the Microphazir
Including the results of St. Petersburg region, a total of 2283 non-identifiable plastic pieces were found (223 micro-pieces - 9.8%, 1754 meso-pieces - 76.8%, and 306 macro-pieces - 13.4%). For 1925 (84.3%) of these non-identifiable plastic pieces the polymer type could be identified with an accuracy of ≥95%. The majority of these plastic pieces were composed of polyethylene (PE: 890 pieces, 39.0%), polypropylene (PP: 595 pieces, 26.1%), and polystyrene (PS: 417 pieces, 18.3%). Altogether for 358 plastic pieces (15.7%) the polymer type could not be identified, for 141 particles (6.2%) it was because of their black color. The other 0.9% consisted of polyvinyl chloride (PVC), acrylonitrile butadiene styrene (ABS), polyamide (PA), polycarbonate (PC), polyethylene terephthalate (PET) and poly-methyl methacrylate (PMMA) (Figure 4). Most of the non-identifiable plastic pieces had a white color followed by transparent pieces, blue pieces and other colors (Figure 4). Most frequent were white PS (388 pieces/17.0%), white PE (180 pieces/7.9%), transparent PE (159 pieces/7.0%), unidentified black pieces (141 pieces/6.2%), and white PP (124 pieces/5.4%).
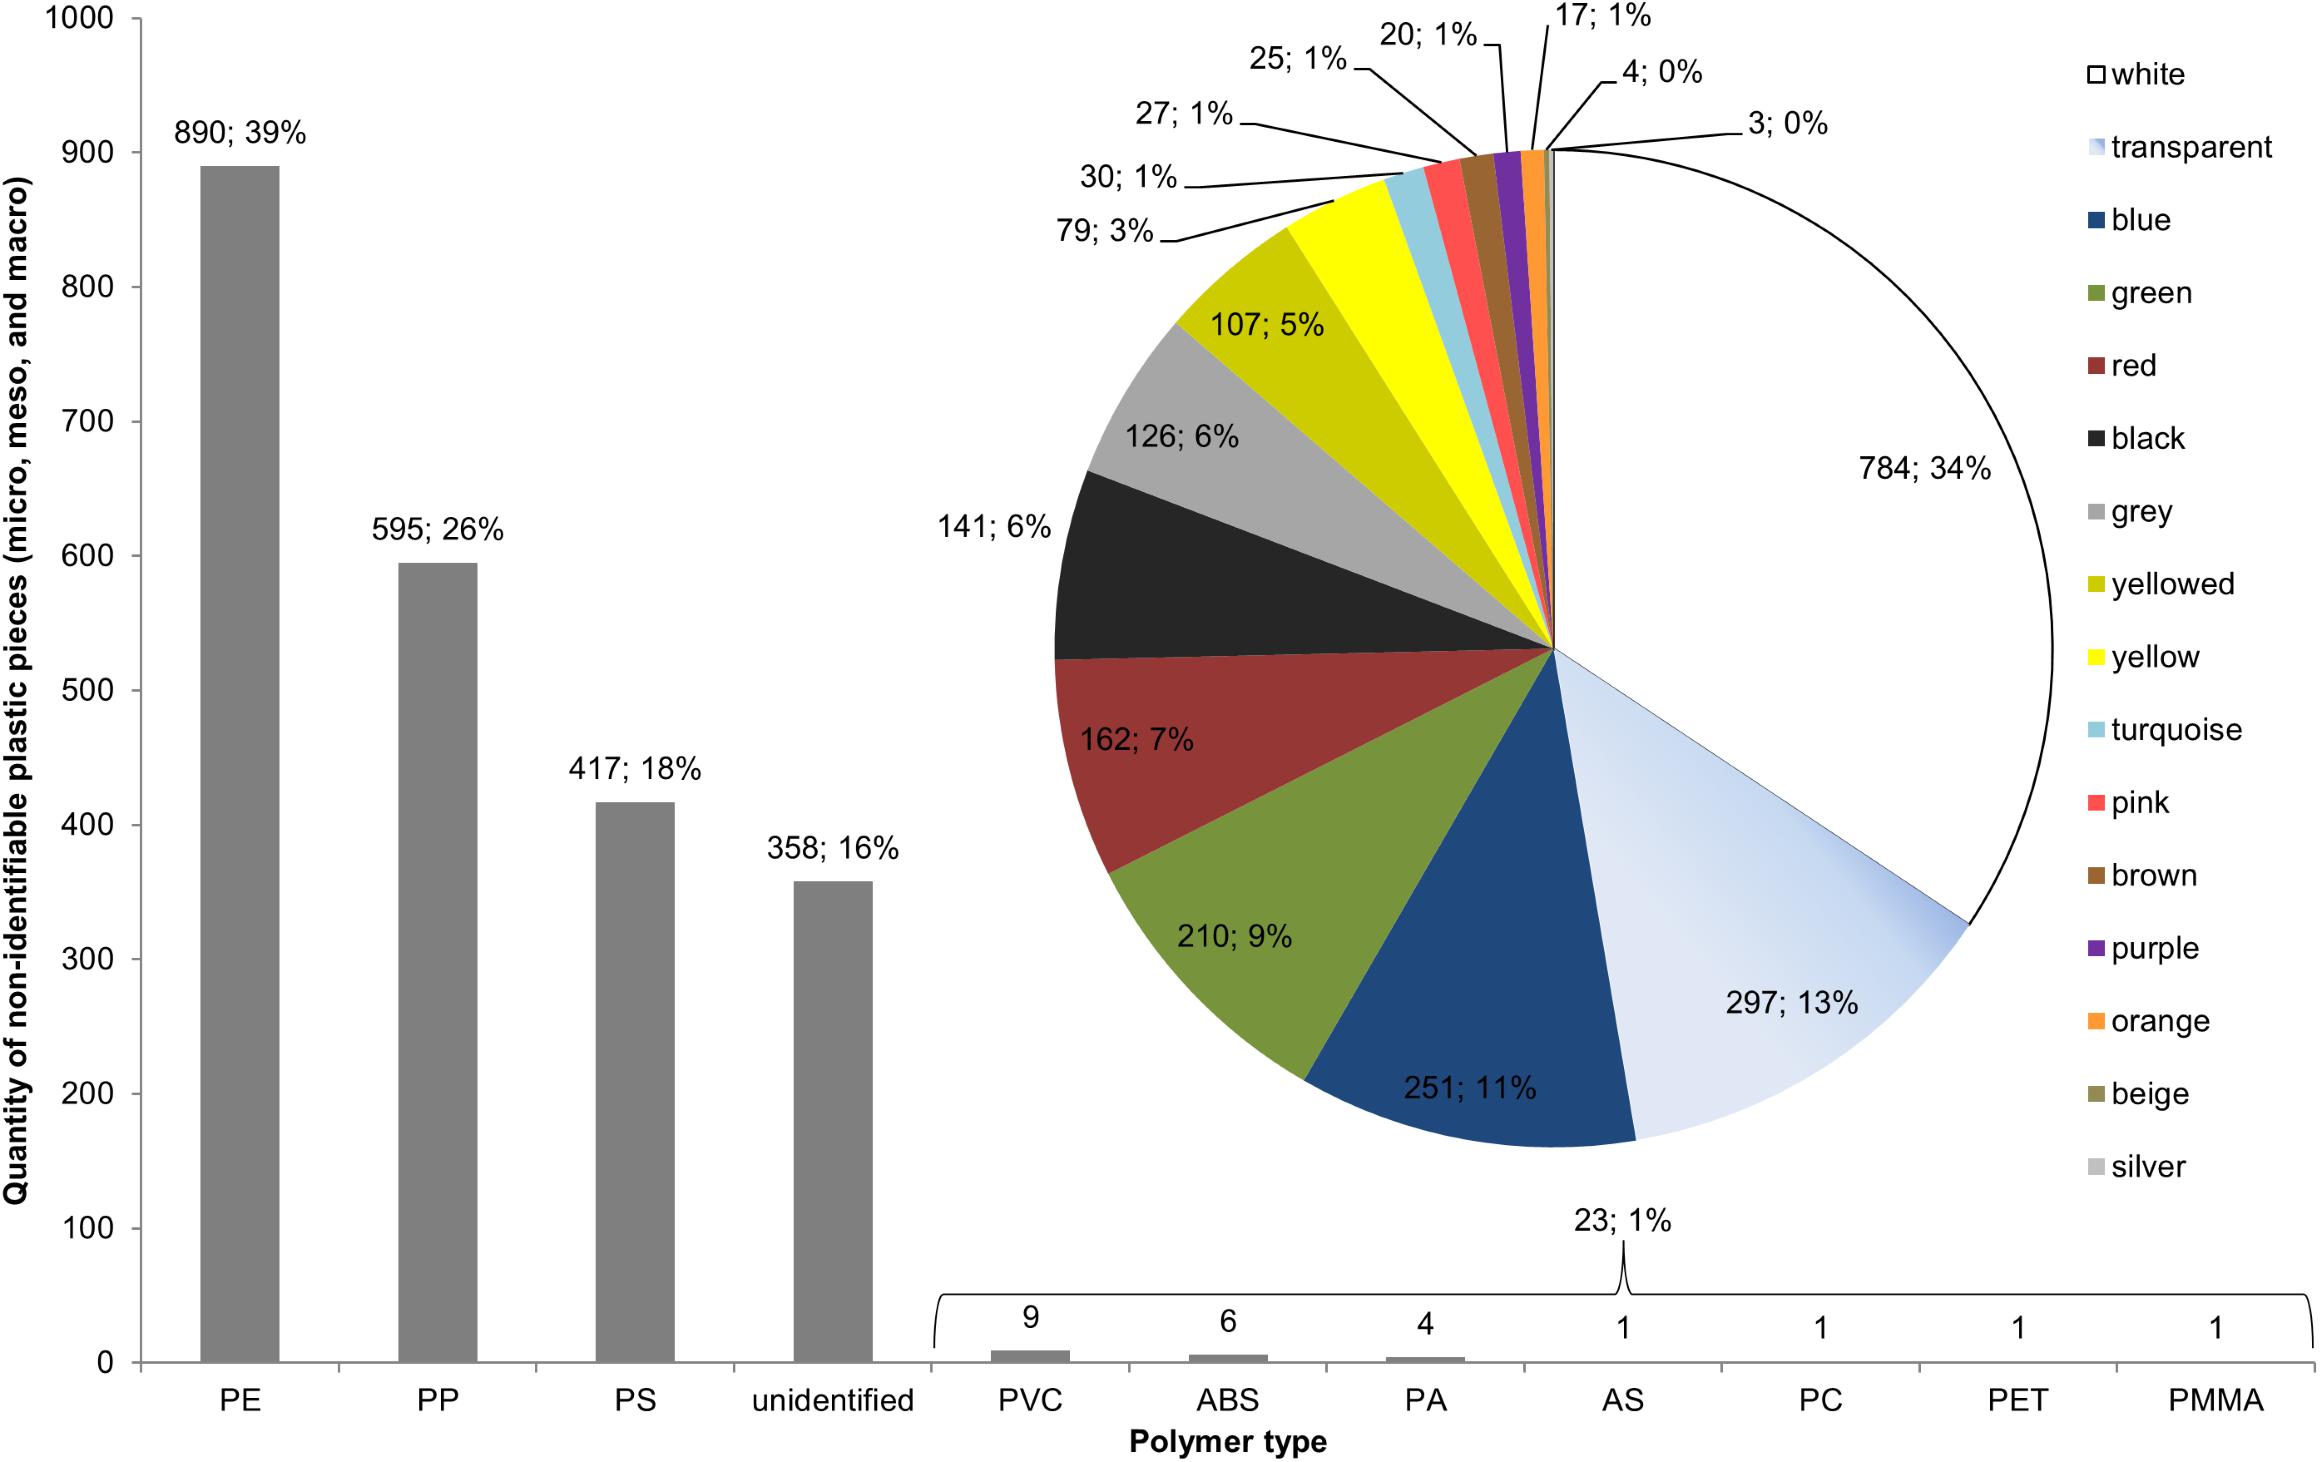
Figure 4. The quantity per polymer type (gray bars) and the color (pie chart) of 2283 non-identifiable plastic pieces (micro, meso, and macro) from the 205 surveys of the beaches around the Baltic Sea (including St. Petersburg).
Costs of a Long-Term Monitoring With the Sand Rake Method at German Baltic Beaches
Based on the experience gathered during the surveys, we calculated the costs of future long-term monitoring campaign at German Baltic beaches using the sand rake method (Table 4). The cost of one survey (WS 1-5) conducted by experts (37.50€/h) is 7,104.30€ including all material costs. The costs for one survey (WS 1-5) of the volunteer-based approach including all material costs and the one-time training workshop are 7,050.75€. After the training workshop the beach related work steps (WS 1-2) can be performed independently by the volunteers. The same material (sand rake, Microphazir, etc.) can be used during the long-term monitoring campaign. Therefore, with every further replicate at the beach the labor costs only increase by 749.70€ (experts) and 267.75€ (volunteer). Altogether, the costs of one year of monitoring campaign at 15 non-OSPAR beaches (Figure 5.) surveyed four times a year are 51,336.60€ (expert) and 27,846.00€ (volunteer). Note that the volunteer approach includes costs for 15 sand rakes, measuring tapes, etc. At the 14 German Baltic beaches, suggested for OSPAR method monitoring, the sand rake method monitoring costs would amount to 48,337.80€ (expert) or 26,418.00€ (volunteer).
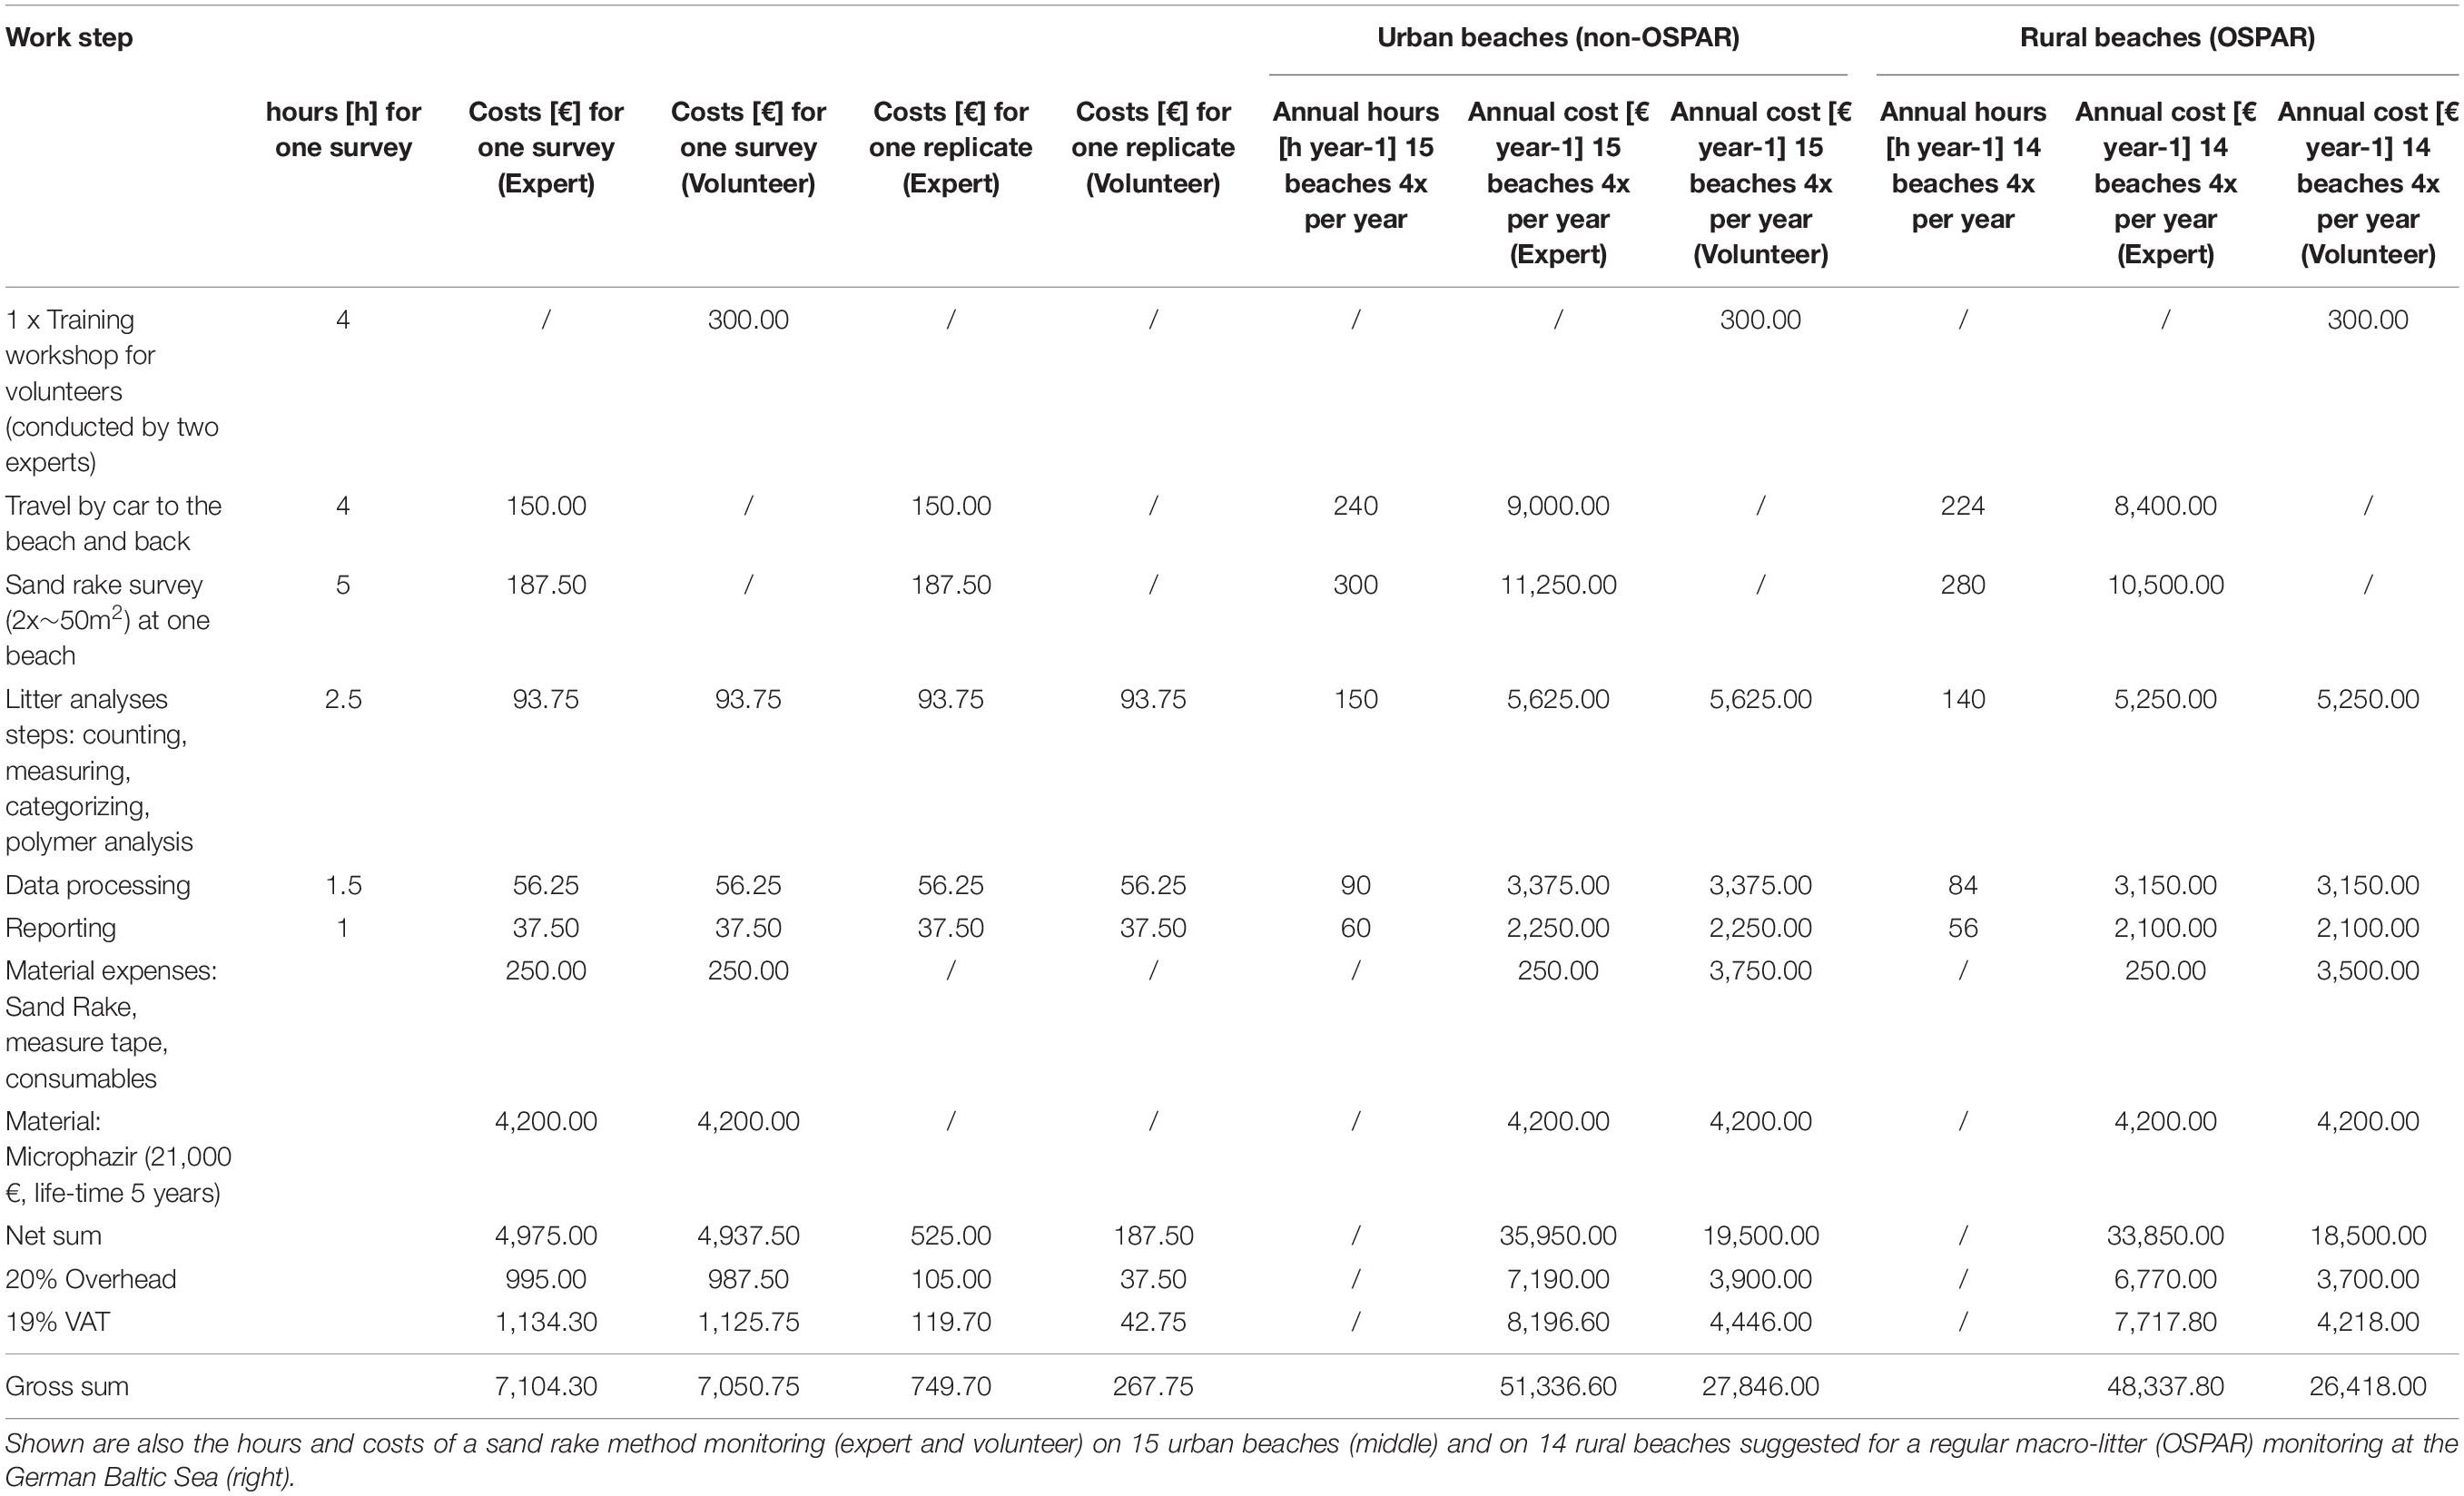
Table 4. Hours (h) and costs (€) for a single sand rake method survey for an expert- and a volunteer-based approach (left) and the costs of further replicates at the same beach.
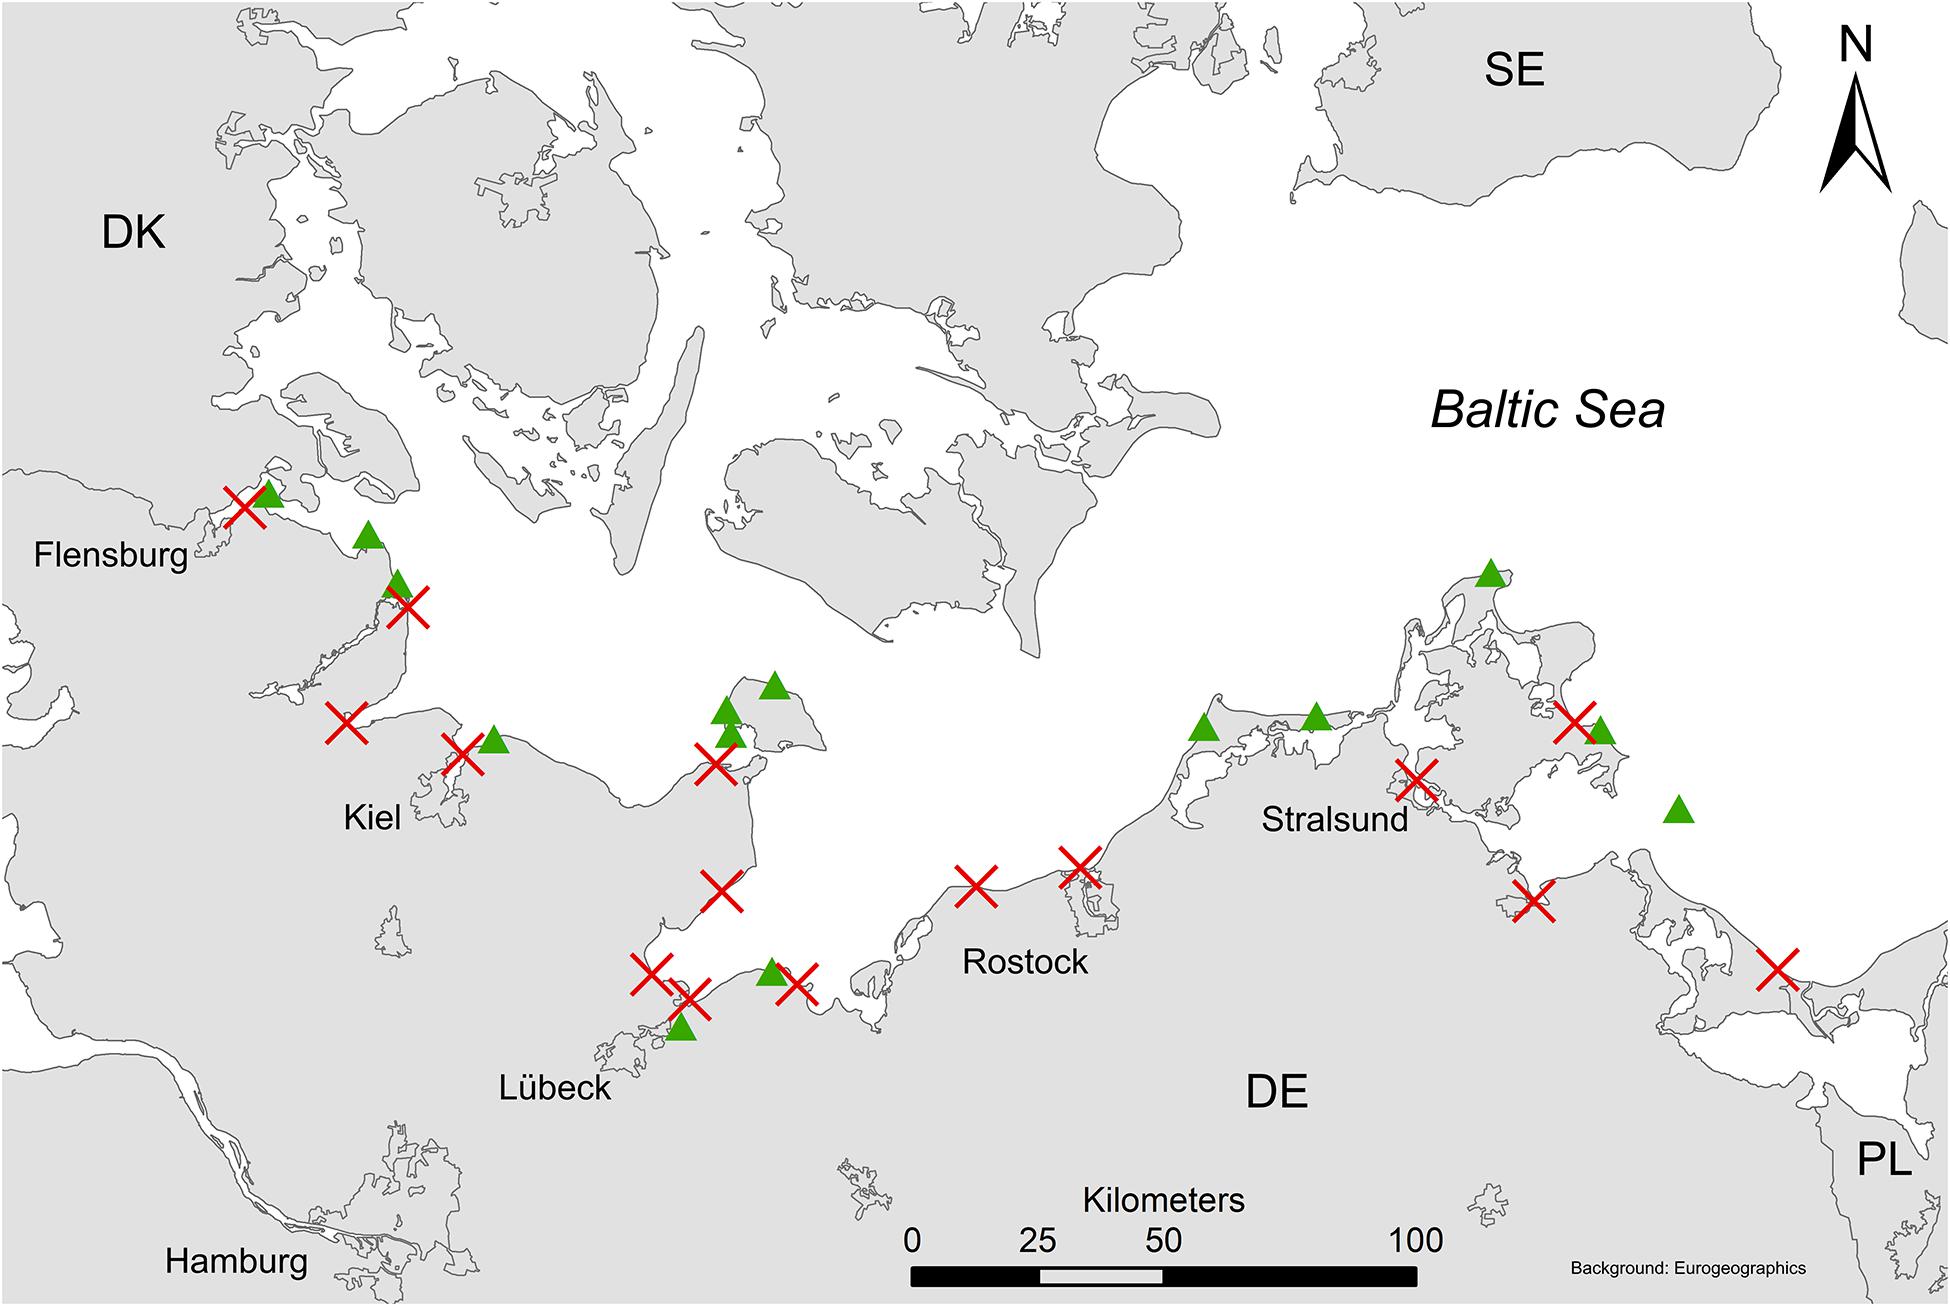
Figure 5. Map of the 15 beaches suggested for a seasonal sand rake method monitoring only (red crosses) and the 14 beaches suggested for the sand rake monitoring implemented into the naked eye OSPAR method monitoring (green triangles).
Discussion
With an average of 0.91 pieces/m2 for all the Baltic surveys (n = 197) the pollution of the Baltic Sea beaches is lower compared to other areas of the world. Comparable sieving methods often focused on plastics only and reported higher pollution levels, such as 185 plastic pieces/m2 in Portugal (MS of 2.5 × 3.5 mm) (Martins and Sobral, 2011), >430–1600 micro-litter pieces/m2 at the Canary islands (Herrera et al., 2018), >19.000 plastic pieces/m2 at beaches of South Korea (MS between 1 and 5 mm) (Lee et al., 2013). The results of former sand rake method studies at the Baltic Sea are comparable to our results. In Haseler et al. (2017), pollution of German beaches was between 0.5 and 3.0 pieces/m2, and in Lithuania at 0.56 pieces/m2. Sand rake method results along the Curonian spit are in the same order of magnitude (0.63–2.34 pieces/m2) (Esiukova et al., 2020). Artificial polymers (52.7%) have the largest share of pollution on the Baltic Sea beaches which is identical to the finding of other studies worldwide (Aniansson et al., 2007; Marlin, 2013; Oosterhuis et al., 2014; LUNG M-V, 2015; Ríos et al., 2018). The most common polymer types (PE, PP, and PS) and their percentages (39, 26.1, and 18.3% respectively) are comparable to previous studies (Hidalgo-Ruz et al., 2012; Urban-Malinga et al., 2020). The high amounts of cigarette butts (15.3%) are a known problem at the Baltic beaches (Schernewski et al., 2017; Veiga et al., 2016) and paraffin occurs regularly on beaches of the Curonian spit (Esiukova, 2016). Lower amounts of paper/cardboard, glass/ceramics, metal and other categories are in line with former results (Marlin, 2013). This shows that our method is able to detect the common litter categories. Our method can also be used on urban/managed beaches. Furthermore, recovery rates were already calculated for different litter items and categories (Haseler et al., 2017). This enables a future assessment of the number of litter pieces that were probably missed and left at the beach. To the best of our knowledge no such recovery rate experiments exist for any naked eye methods, which makes an evaluation of these visual methods difficult, as it is unknown how much and what kind of litter is missed at the beach.
One intent of this study was to assess the meso-, and large micro-litter pollution; which has a combined share of 69% at our surveyed beaches of the Baltic Sea (n = 197) and the North Sea (n = 15). This is mostly due to the high amounts of industrial pellets, cigarette butts, non-identifiable plastic pieces and paraffin. As to the best of our knowledge, no other broad scale studies using a similar sieving method (2 mm MS) at the Baltic Sea beaches exist, and therefore the best possible comparison of our results are to a Joint Research Center (JRC) Report (Addamo et al., 2017). In this report, the aggregated results of ∼30.000 litter pieces collected with visual survey methods (Marlin, 2013; OSPAR, 2010) on beaches in different countries around the Baltic Sea are presented. As described in the report, the investigated area was typically a transect of 100 m length, which was surveyed three or four times a year; all visible litter pieces on the beach surface were picked up by volunteers, later on counted and entered in the MSFD Master list of litter items (Addamo et al., 2017).
In our study, industrial pellets account for 19.8% of all litter, yet in contrast no industrial pellets were found in the JRC Report. Industrial pellets are quickly mixed with or buried in the sediment (Abu-Hilal and Al-Najjar, 2009), and, if further large amounts of litter are present at the beach, it is easy to miss them (Velander and Mocogni, 1999) with naked eye methods. This is especially so, when pellets are colorless, as in our study (∼90%), and pebbles and shells are frequent on the beach. As a consequence, the number of industrial pellets found in our study is higher compared to the JRC report. However, industrial pellets were found only in 52% of our surveys. This might already be the effect of the regulatory measures and legislative framework of the European countries. Industrial pellets leach into the environment mainly due to spills during transport or production (Karlsson et al., 2018). The first scientific reports, documenting the occurrence of plastic pellets in the marine environment, were published in the 1970’s (Carpenter et al., 1972), and therefore, half a century of public awareness might have been enough to reduce their leakage in the European region. The abundance of industrial pellets is decreasing with further distance from ports, etc. (Abu-Hilal and Al-Najjar, 2009). This aligns with our results, where the maximum contamination by pellets was found near large ports and in industrial regions close to the cities (Tallinn, Liepaja, Sopot, St.Petersburg and Hanko). Industrial pellets are washed ashore from the sea (Ivar do Sul and Costa, 2014) and in a German study they were mostly found after storm surges (Haseler et al., 2019). Therefore, their abundance is most probably low during summer times with fewer storms. Furthermore, in the micro-tidal Baltic Sea their abundance is most probably decreasing toward higher parts of the beach, leading to lower amounts of pellets found with our method.
The amount of cigarette butts in the JRC report is half (7.74%) of what we found (15.3%). Cigarette butts occur in high numbers even at manually and mechanically cleaned beaches (Laglbauer et al., 2014; Zielinski et al., 2019) and therefore they accumulate and get buried over time (Loizidou et al., 2018). Our surveys took place mostly during summer. Therefore, it might be that more beach users led to the higher amount of cigarette butts found. Similar results with more cigarette butts found during summer were already reported for the German Baltic coast (LUNG M-V, 2015). Nevertheless, 35.1% of cigarettes butts we found are meso-litter which makes it difficult to see them using naked eye methods, especially if they are partially or entirely below the surface.
The number of plastic pieces (<25 mm) found in the JRC report (1.45%) is smaller by one order of magnitude compared to our results (15.0% meso + 2.3% large micro). However, these differences are not surprising; 64% of the non-identifiable plastic pieces in our study have a colorless (white, transparent, gray, black or yellowed) appearance. Besides the litter color, the surveyor’s ability to detect plastic litter (≤20 mm) depends on the sand color and presence of shell fragments, which in an experimental study resulted in an undercounting of plastic in 72.8% of 2472 counts, with 103 observers (Angelini et al., 2019).
Paraffin (10.8% including all size classes) was lower compared to the JRC report (31.85%), which is probably due, both to single surveys with extremely high abundances of paraffin and to the categorization of ‘paraffin/wax’ in the JRC report which includes a number of additional chemical compounds (Addamo et al., 2017). Nevertheless, in our study, paraffin was observed in large quantities in Lithuania (41%) and in Russia, Kaliningrad (28%). Paraffin is discharged at sea through tank washing. This is legal under current legislation, with specific restrictions (Rijkswaterstaat, 2018) leading to an increase of paraffin mass beaching events along European coasts (Suaria et al., 2018). Lots of vessels are permanently in the ports of Klaipeda (Lithuania) and Baltiysk (Kaliningrad, Russia), wash their tanks there, and the prevailing winds transport paraffin toward the shores of the region. For the hundreds of metal pieces found around St. Petersburg no origin could be identified.
In general, it is doubtful that meso- and large micro-litter (JRC, 2011), industrial pellets (MSFD TSG ML, 2013), and cigarette butts (Kataržytė et al., 2020) can be monitored effectively if only the beach surface is visually investigated (OSPAR method) without having a closer look (sieving methods) in the upper layers of the beach sediment. This is especially so, given the greatest limitation for a precise quantification at the beach is the human eye (Vegter et al., 2014), which overlooks most of this litter without any sediment reduction step. Furthermore, plastic that is exposed long-term to UV radiation at the beach fragments faster than in seawater (Andrady, 2011). This (relatively) rapid size reduction leads to particles which can be even harder to see. Compounding this is the fact, most of the secondary micro- and meso-plastic pieces are white-to-colorless (Hidalgo-Ruz et al., 2012; Zobkov and Esiukova, 2018; Lacerda et al., 2019; Jeyasanta et al., 2020), as it was the case in our study. Many of these colorless pieces (<25 mm) are undercounted using naked eye methods (Angelini et al., 2019), even by experienced observers (Lavers et al., 2016) and professional beach cleaners. Therefore, they remain in the sediment (Laglbauer et al., 2014; Zielinski et al., 2019), which leads to an accumulation and further fragmentation over time (Loizidou et al., 2018) and to a direct threat to marine organisms through to ingestion (JRC, 2011). Ultimately, these factors compound to make naked eye (OSPAR method) surveys less likely to reliably sample challenging micro- and meso-litter demonstrate the value of methods, such as the sand rake approach, which help to aid litter determination.
Industrial pellets, cigarette butts, non-identifiable plastic pieces 2–25 mm and paraffin (all sizes) were responsible for ∼64% of all our findings. Exactly these items/size classes were neglected by the JRC to calculate the “EU marine beach litter baselines” (Hanke et al., 2019). They were not included because the naked eye methods used to gather the baseline data delivers either incomplete coverage data, not comparable results and they are not made to collect meso-litter (Hanke et al., 2019). Yet as our study shows, these are important contributors to beach litter in the Baltic and North Sea environment and need a harmonized monitoring approach to quantify their amount. Avoidance and mitigation strategies to minimize the amount of paraffin (Marine Environment Protection Committee (MEPC), 2019a,b), prevent spillage of industrial pellets (Plastics Europe, 2018); and introduce reduction measures for cigarette butts (European Commission, 2018; Kataržytė et al., 2020; Schneider et al., 2011) are important steps for a cleaner marine environment. However, such steps need to be evaluated to test if they lead to a quantifiable success. Therefore, suitable and cost effective long-term monitoring methods, usable on a broad scale of beaches, are needed that cover these litter items and size classes (2–25 mm). Here, the sand rake method can be an effective tool.
Beach Litter Baseline
Our results can be used as a starting point to calculate the average litter abundance per m2 (2–25 mm) on sandy Baltic beaches. However, the high variation of litter quantity makes it necessary to consider further environmental influences such as wind, tides and site exposure (Schöneich-Argent et al., 2019) when choosing survey areas for long-term monitoring. The small-scale distribution of litter makes the choice of location an important decision (Bergmann et al., 2015). Furthermore, an expanded survey approach over a longer period of time at different beaches (replicates) delivers in all likelihood more reliable results. Ultimately, a statistical calculation of the minimum number of surveys (based on the amount of monitoring beaches and replicates) is needed for a baseline calculation of the average litter pollution. It is important to determine if only urban/cleaned beaches that do not meet the criteria for selecting reference beaches should be surveyed or if a combined approach, including rural OSPAR method beaches, is used. We assume that a combined approach is more reliable, because urban regions are more polluted in general, as shown by our study. A baseline calculated solely on the litter abundance at urban beaches would be too high, and many rural beaches would reach this target without the implementation of mitigation measures.
Evaluation of the Sand Rake Method Regarding Monitoring Needs of the MSFD
Our results showed that the sand rake method is able to detect large micro-, and meso-litter on the top layer (3-5 cm) of sandy beaches that are usually missed during the OSPAR method (naked eye) surveys. The sand rake method works best when the sediment is dry and fine (no pebbles, gravel, etc.) having a recovery rate of ∼65% regarding meso-litter (cigarette butts, etc.) and ∼50% for larger micro-litter (Haseler et al., 2017). Therefore, the weather should be considered while planning a survey because wet sediment makes sieving complicated and requires more time. On Sylt Island the tides left half the beach wet, which made sieving very hard as the sediment got stuck in the sand rake. Therefore, the hands had to be used to rub/press it through the rake. In Russia, St. Petersburg the sediment grain size was very coarse and a lot of sediment remained in the sand rake. That made it harder for the observer who was looking for litter pieces between the stuck sediment. In such cases a larger mesh size (5 mm) might be helpful or the sediment could be rinsed out with seawater but this ideas were not further considered in this study. For further strength and weaknesses of the method see Haseler et al. (2017). Considering most beaches we surveyed, the sand rake method could be used without major problems. To gather quality data that is comparable across regions and countries, training of volunteers is essential. Further recovery rate experiments with different litter items and size classes tested by volunteers could lead to more precise recovery rates and estimations of the “true beach pollution.” With minor adjustments the list of litter and the “OSPAR Marine Litter Monitoring Survey Form” can be used for sand rake monitoring as well, guaranteeing comparable results in terms of litter items. Polymer analysis of litter with the Microphazir is fast and easy, and information about polymer types might provide knowledge about litter degradation on beaches (Hanke et al., 2019). It should be noted that the polymer type distribution shown in Figure 4 characterizes just non-identifiable plastic pieces, i.e., those plastics which were much degraded/fragmented in the marine environment. Litter items made of harder polymers, like, e.g., PET bottles or PVC packaging, are typically well identifiable on the beach, and were thus counted as the corresponding litter item. Indeed, the distribution of polymer types of plastic particles shows the predominance of PE, PP, and PS – the polymers widely used for cheap disposable products. This is one more argument in favor of legislative restrictions against single-use plastic products; their elimination should significantly reduce the amount of meso- and micro-plastic items on the beaches. Therefore, a reliable monitoring method for meso-and large micro-litter is needed to evaluate the success of such restrictions.
We think that the sand rake method is suitable as a monitoring method that fits the requirements of the MSFD. Therefore, we discuss how sand rake monitoring can be used at beaches where the OSPAR method is not suitable. Furthermore, we consider a combined approach where the sand rake method and the OSPAR method are used at the 14 OSPAR beaches. The 15 beaches selected for sand rake monitoring cover beaches where an OSPAR method monitoring is not suitable. These beaches can be used as a representative case study of the litter pollution (2–25 mm) of urban, managed, touristic and river mouth beaches at the German Baltic Sea. In order to obtain comparable results to former studies, we suggest that a seasonal monitoring approach is most suitable. The monitoring at the 15 beaches should be standardized (temporally and spatially) in communication with local authorities, as they should have the best knowledge concerning the beach management. In any case, many external factors (like voluntary cleaning activities, beach access, littering behavior, etc.) cannot be controlled for, not even by local authorities and as a result, the abundance of litter is influenced by these external circumstances.
A combined sand rake method and OSPAR method monitoring at the 14 German beaches of the Baltic Sea would sufficiently cover all size classes of litter (>2 mm). This allows for the gathering of more data about the overall litter abundance and for results comparisons between both methods. Such monitoring could be organized as follows: at both ends of a pre-defined 100 m OSPAR monitoring section (surveyed with the naked eye), a sand rake survey (each ∼ 50 m2) is made. This approach is considered for reference beaches that fit the pre-determined beach selection requirements of OSPAR monitoring.
With regard to costs, only average values can be proposed, as the survey time at the beach depends on the external circumstances and the litter analysis steps mostly on the litter quantity found, which differs from survey to survey. Nevertheless, the volunteer-based approach makes it possible to survey on a broad scale over a long time period at reasonable costs. This is necessary to detect possible changes in beach pollution over time. To guarantee a high standard of data acquisition (of the beach litter abundance), all involved actors/volunteers should be trained in how to use the sand rake method properly. Contact person need to be identified, both to help to solve possible problems on the fly and to also take responsibility for the quality assurance and quality control.
Conclusion and Recommendations
Industrial pellets, large micro and meso-plastic, paraffin, cigarettes butts, and other litter items (2–25 mm) represented more than 69% of the litter found in our study. In terms of plastics, colorless pieces (barely visible for the naked eye) predominated. Such litter are particularly likely to have been underestimated by the application of the OSPAR method along European beaches historically. Furthermore, urban pollution hot-spots are currently not taken into account with the OSPAR approach. This leads to an incomplete pollution pattern and an underestimation of the present pollution. Due to the focus of the sand rake method on the 2–25 mm size fraction, monitoring on urban and rural beaches, without impact from clean ups and/or other disturbing activities is theoretically possible. The sand rake method is a cost-effective approach that meets policy demands. It allows for the involvement of volunteers and supports awareness-rising with respect to the litter problem. Our data can serve as basis for calculating pollution baselines and for defining the Good Environmental Status for Baltic beaches, as required by the MSFD. Furthermore, integration of the sand rake method into the existing OSPAR method monitoring is possible at low costs. Mobile spectrometers for rapid polymer analysis can provide additional information on pollution sources and on items that can serve as indicators, but here more research is needed. We recommend the application of the sand rake method over several years at different beaches, including seasonal sampling. This data would help to optimize the monitoring approach and would provide insights in the temporal dynamics of large micro-, and meso-litter pollution on Baltic beaches.
Data Availability Statement
The original contributions presented in the study are included in the article/Supplementary Material, further inquiries can be directed to the corresponding author.
Author Contributions
MH: conceptualization, methodology, field work, litter analysis, data analysis, and writing – original draft. AB: conceptualization, field work, and litter analysis. RH and AE: field work, litter analysis, and review. VS: field work and litter analysis. IC: review, editing, and funding acquisition. GS: supervision, conceptualization, writing, review, editing, and funding acquisition. All authors contributed to the article and approved the submitted version.
Funding
The work was financially supported by the project BONUS MICROPOLL (FKZ 03F0775A). BONUS MICROPOLL has received funding from BONUS (Art 185) funded jointly from the European Union’s Seventh Programme for research, technological development and demonstration, and from Baltic Sea national funding institutions. Field program in Russia, Germany, and Estonia was partly supported via international ERA.Net RUS Plus project BalticLitter, supported by national institutions (German Federal Ministry for Education and Research 01DJ19001 and Russian Foundation for Basic Research 18-55-76001). Few additional surveys at the North Sea coast were conducted within UBA-project Meeresm ll (FKZ 3717252250). This work was supported by the Doctorate Study Program in Ecology and Environmental Sciences, Klaipeda University in the form of a stipend for MH.
Conflict of Interest
The authors declare that the research was conducted in the absence of any commercial or financial relationships that could be construed as a potential conflict of interest.
The reviewer CP declared a past co-authorship with one of the authors IC to the handling editor.
Acknowledgments
We would like to thank the following persons for supporting this work: Laura Lauciūtė, Jona Mathias, Tatjana Eremina, Ronja Trübger, Mike Körber, Alexander Tagg, Elena Esiukova, Liliya Khatmullina, Juliana Ivar do Sul, and Gabriela Escobar Sánchez; and all the students and volunteers for their support during the litter analysis and the field work.
Supplementary Material
The Supplementary Material for this article can be found online at: https://www.frontiersin.org/articles/10.3389/fenvs.2020.599978/full#supplementary-material
Supplementary Table 1 | List of the 220 beach surveys divided in the 36 regions with survey date, total amount of litter and litter/m2.
Supplementary Table 2 | List of litter (n = 183). Amount of litter is divided in Baltic Sea (including St. Petersburg) and North Sea surveys.
Footnotes
References
Abu-Hilal, A. H., and Al-Najjar, T. H. (2009). Plastic pellets on the beaches of the northern Gulf of Aqaba, Red Sea. Aquat. Ecosyst. Health Manage. 12, 461–470. doi: 10.1080/14634980903361200
Addamo, A. M., Perrine, L., and Hanke, G. (2017). Top Marine Beach Litter Items in Europe. A Review and Synthesis Based on Beach Litter Data. MSFD Technical Group on Marine Litter. Report No. EUR29249, 2017. Luxembourg: Publications Office of the European Union.
Andrady, A. L. (2011). Microplastics in the marine environment. Mar. Pollut. Bull. 62, 1596–1605. doi: 10.1016/j.marpolbul.2011.05.030
Angelini, Z., Kinner, N., Thibault, J., Ramsey, P., and Fuld, K. (2019). Marine debris visual identification assessment. Mar. Pollut. Bull. 142, 69–75. doi: 10.1016/j.marpolbul.2019.02.044
Aniansson, B., Bell, G., Fátima, B., Dagevos, J., Elliot, B., Fleet, D. M., et al. (2007). Ospar Pilot Project on Monitoring Marine Beach Litter. Monitoring of Marine Litter in the Ospar Region. London: OSPAR Commission.
Balčiūnas, A., and Blažauskas, N. (2014). Scale, origin and spatial distribution of marine litter pollution in the Lithuanian coastal zone of the Baltic Sea. Baltica 27, 39–44. doi: 10.5200/baltica.2014.27.14
Bergmann, M., Gutow, L., and Klages, M. (2015). Marine Anthropogenic Litter. Cham: Springer International Publishing.
Browne, M. A., Chapman, M. G., Thompson, R. C., Amaral Zettler, L. A., Jambeck, J., and Mallos, N. J. (2015). Spatial and temporal patterns of stranded intertidal marine debris: is there a picture of global change? Environ. Sci. Technol. 49, 7082–7094. doi: 10.1021/es5060572
Carpenter, E. J., Anderson, S. J., Harvey, G. R., Miklas, H. P., and Peck, B. B. (1972). Polystyrene spherules in coastal waters. Science 178, 749–750. doi: 10.1126/science.178.4062.749
Cheshire, A., Adler, E., and Barbičre, J. (2009). UNEP/IOC Guidelines on Survey and Monitoring of Marine Litter. IOC Technical Series No. 83. Nairobi: United Nations Environment Programme.
Cozar, A., Echevarria, F., Gonzalez-Gordillo, J. I., Irigoien, X., Ubeda, B., Hernandez-Leon, S., et al. (2014). Plastic debris in the open ocean. Proc. Natl. Acad. Sci. U.S.A. 111, 10239–10244.
Eriksen, M., Lebreton, L. C. M., Carson, H. S., Thiel, M., Moore, C. J., Borerro, J. C., et al. (2014). Plastic pollution in the world’s oceans: more than 5 trillion plastic pieces weighing over 250,000 tons afloat at sea. PLoS One 9:e111913. doi: 10.1371/journal.pone.0111913
Esiukova, E. (2016). Plastic pollution on the Baltic beaches of Kaliningrad region, Russia. Mar. Pollut. Bull. 114, 1072–1080. doi: 10.1016/j.marpolbul.2016.10.001
Esiukova, E., Khatmullina, L., Lobchuk, O., Grave, A., Kileso, A., Haseler, M., et al. (2020). From macro to micro: dataset on plastic contamination along and across a sandy tide-less coast (the Curonian Spit, the Baltic Sea). Data Brief 30:105635. doi: 10.1016/j.dib.2020.105635
European Commission, (2018). A European Strategy for Plastics in a Circular Economy. Single-Use Plastics: New Measures to Reduce Marine Litter. Brussels: European Commission.
Hanke, G., Waalvort, D., Van Loon, W., Addamo, A. M., Broisch, A., Chaves Montero, M., et al. (2019). EU Marine Beach Litter Baselines. Analysis of a Pan-European 2012-2016 Beach Litter Dataset Report No. EUR 30022 EN 2019. Luxembourg: Publications Office of the European Union.
Haseler, M., Schernewski, G., Balciunas, A., and Sabaliauskaite, V. (2017). Monitoring methods for large micro- and meso-litter and applications at Baltic beaches. J. Coast. Conserv. 22, 27–50. doi: 10.1007/s11852-017-0497-5
Haseler, M., Weder, C., Buschbeck, L., Wesnigk, S., and Schernewski, G. (2019). Cost-effective monitoring of large micro- and meso-litter in tidal and flood accumulation zones at south-western Baltic Sea beaches. Mar. Pollut. Bull. 149:110544. doi: 10.1016/j.marpolbul.2019.110544
HELCOM, (2010). Ecosystem Health of the Baltic Sea 2003–2007: Helcom Initial Holistic Assessment. Helcom Initial Holistic Assessment. Baltic Sea Environment Proceedings No. 122. Available online at: http://www.helcom.fi/Lists/Publications/BSEP122.pdf. (accessed December 14, 2017)
Herrera, A., Asensio, M., Martínez, I., Santana, A., Packard, T., and Gómez, M. (2018). Microplastic and tar pollution on three Canary Islands beaches: an annual study. Mar. Pollut. Bull. 129, 494–502. doi: 10.1016/j.marpolbul.2017.10.020
Hidalgo-Ruz, V., Gutow, L., Thompson, R. C., and Thiel, M. (2012). Microplastics in the marine environment: a review of the methods used for identification and quantification. Environ. Sci. Technol. 46, 3060–3075. doi: 10.1021/es2031505
Ivar do Sul, J. A., and Costa, M. F. (2014). The present and future of microplastic pollution in the marine environment. Environ. Pollut. 185, 352–364. doi: 10.1016/j.envpol.2013.10.036
Jeyasanta, K. I., Sathish, N., Patterson, J., and Edward, J. K. P. (2020). Macro- meso- and microplastic debris in the beaches of Tuticorin district, Southeast coast of India. Mar. Pollut. Bull. 154, 111055. doi: 10.1016/j.marpolbul.2020.111055
JRC, (2011). Marine Litter. Technical Recommendations for the Implementation of MSFD Requirements. MSFD GES Technical Subgroup on Marine Litter, Vol. 25009. Luxembourg: Publications Office of the European Union.
Karlsson, T. M., Arneborg, L., Broström, G., Almroth, B. C., Gipperth, L., and Hassellöv, M. (2018). The unaccountability case of plastic pellet pollution. Mar. Pollut. Bull. 129, 52–60. doi: 10.1016/j.marpolbul.2018.01.041
Kataržytė, M., Balčiūnas, A., Haseler, M., Sabaliauskaitė, V., Lauciūtė, L., Stepanova, K., et al. (2020). Cigarette butts on Baltic Sea beaches: monitoring, pollution and mitigation measures. Mar. Pollut. Bull. 156, 111248. doi: 10.1016/j.marpolbul.2020.111248
Łabuz, T. A. (2015). “Environmental impacts—coastal erosion and coastline changes,” in Regional Climate Studies: Second Assessment of Climate Change for the Baltic Sea Basin, ed. Team TBA, II, (Cham: Springer International Publishing).
Lacerda, A. L. D. F., Rodrigues, L. D. S., van Sebille, E., Rodrigues, F. L., Ribeiro, L., Secchi, E. R., et al. (2019). Plastics in sea surface waters around the Antarctic Peninsula. Sci. Rep. 9:3977.
Laglbauer, B. J. L., Franco-Santos, R. M., Andreu-Cazenave, M., Brunelli, L., Papadatou, M., Palatinus, A., et al. (2014). Macrodebris and microplastics from beaches in Slovenia. Mar. Pollut. Bull. 89, 356–366. doi: 10.1016/j.marpolbul.2014.09.036
Lavers, J. L., Oppel, S., and Bond, A. L. (2016). Factors influencing the detection of beach plastic debris. Mar. Environ. Res. 119, 245–251. doi: 10.1016/j.marenvres.2016.06.009
Law, K. L., Morét-Ferguson, S., Maximenko, N. A., Proskurowski, G., Peacock, E. E., Hafner, J., et al. (2010). Plastic accumulation in the North Atlantic subtropical gyre. Science 329, 1185–1188. doi: 10.1126/science.1192321
Lee, J., Hong, S., Song, Y. K., Hong, S. H., Jang, Y. C., Jang, M., et al. (2013). Relationships among the abundances of plastic debris in different size classes on beaches in South Korea. Mar. Pollut. Bull. 77, 349–354. doi: 10.1016/j.marpolbul.2013.08.013
Lee, J., Lee, J., Hong, S., Hong, S. H., Shim, W. J., and Eo, S. (2017). Characteristics of meso-sized plastic marine debris on 20 beaches in Korea. Mar. Pollut. Bull. 123, 92–96. doi: 10.1016/j.marpolbul.2017.09.020
Leppäranta, M., and Myrberg, K. (2009). Praxis Books: Physical Oceanography of the Baltic Sea. Berlin: Springer.
Loizidou, X. I., Loizides, M. I., and Orthodoxou, D. L. (2018). Persistent marine litter: small plastics and cigarette butts remain on beaches after organized beach cleanups. Environ. Monit. Assess. 190:414.
LUNG M-V, (2015). Flaschen, Tüten, Luftballons – Müll in der Ostsee. Landesamt für Umwelt, Naturschutz und Geologie. Schriftenreihe des Landesamtes für Umwelt, Naturschutz und Geologie Mecklenburg-Vorpommern. Güstrow: LUNG M-V.
Marine Environment Protection Committee (MEPC), (2019a). Amendments to the Annex of the International Convention for the Prevention of Pollution from Ships, 1973, as Modified by the Protocol of 1978 Relating Thereto Amendments to MARPOL Annex II (Cargo Residues and Tank Washings of Persistent Floating Products. London: Marine Environment Protection Committee.
Marine Environment Protection Committee (MEPC), (2019b). Resolution Mepc.315(74) (Adopted on 17 May 2019). Amendments to the Annex of the International Convention for the Prevention of Pollution from Ships, 1973, as Modified by the Protocol of 1978 Relating Thereto. Amendments to MARPOL Annex II. London: Marine Environment Protection Committee.
Marlin (2013). “Final report of baltic marine litter project MARLIN,” in Litter Monitoring and Raising Awareness 2011–2013. With Assistance of Central Baltic Interreg IV A A Programme 2007–2013. ed. European Regional Development Fund (ERDF).
Martins, J., and Sobral, P. (2011). Plastic marine debris on the Portuguese coastline: a matter of size? Mar. Pollut. Bull. 62, 2649–2653. doi: 10.1016/j.marpolbul.2011.09.028
Matsuguma, Y., Takada, H., Kumata, H., Kanke, H., Sakurai, S., Suzuki, T., et al. (2017). Microplastics in sediment cores from Asia and Africa as indicators of temporal trends in plastic pollution. Arch. Environ. Contam. Toxicol. 73, 230–239. doi: 10.1007/s00244-017-0414-9
MSFD TSG ML, (2013). Guidance on Monitoring of Marine Litter in European Seas. A Guidance Document within the Common Implementation Strategy for the Marine Strategy Framework Directive. Technical Subgroup on Marine Litter. Luxembourg: Publications Office of the European Union, 26113.
MSFD, (2008). Marine strategy framework directive directive 2008/56/EC of the European Parliament and of the Council of 17 June 2008 establishing a framework for community action in the field of marine environmental policy (Marine strategy framework directive), MSFD. J. Eur. Union 26, 136–157.
Okuku, E. O., Kiteresi, L. I., Owato, G., Mwalugha, C., Omire, J., Mbuche, M., et al. (2020). Baseline meso-litter pollution in selected coastal beaches of Kenya: where do we concentrate our intervention efforts? Mar. Pollut. Bull. 158, 111420. doi: 10.1016/j.marpolbul.2020.111420
Oosterhuis, F., Papyrakis, E., and Boteler, B. (2014). Economic instruments and marine litter control. Ocean Coast. Manag. 102, 47–54. doi: 10.1016/j.ocecoaman.2014.08.005
OSPAR, (2010). Ospar Guide for Monitoring Marine Litter on the Beaches in the Ospar Maritime Area. London: OSPAR Commission.
Peng, G., Bellerby, R., Zhang, F., Sun, X., and Li, D. (2020). The ocean’s ultimate trashcan: Hadal trenches as major depositories for plastic pollution. Water Res. 168:115121. doi: 10.1016/j.watres.2019.115121
Pham, C. K., Ramirez-Llodra, E., Alt, C. H. S., Amaro, T., Bergmann, M., Canals, M., et al. (2014). Marine litter distribution and density in European seas, from the shelves to deep basins. PLoS One 9:e95839. doi: 10.1371/journal.pone.0095839
Reisser, J., Shaw, J., Wilcox, C., Hardesty, B. D., Proietti, M., Thums, M., et al. (2013). Marine plastic pollution in waters around Australia: characteristics, concentrations, and pathways. PLoS One 8:e80466. doi: 10.1371/journal.pone.0080466
Rijkswaterstaat. (2018). Paraffin on the Dutch Coast. RWS Information. Hg. v. RWS Zee en Delta. Ministry of Infrastructure and Water Management. Utrecht: Rijkswaterstaat
Ríos, N., Frias, J. P. G. L., Rodríguez, Y., Carriço, R., Garcia, S. M., and Juliano, M. (2018). Spatio-temporal variability of beached macro-litter on remote islands of the North Atlantic. Mar. Pollut. Bull. 133, 304–311. doi: 10.1016/j.marpolbul.2018.05.038
Schernewski, G., Balciunas, A., Gräwe, D., Gräwe, U., Klesse, K., Schulz, M., et al. (2017). Beach macro-litter monitoring on southern Baltic beaches. Results, experiences and recommendations. J. Coast. Conserv. 27, 39.
Schiewer, U. (ed.) (2008). Ecological Studiesv. 197: Ecology of Baltic Coastal Waters. Berlin: Springer.
Schneider, J. E., Peterson, N. A., Kiss, N., Ebeid, O., and Doyle, A. S. (2011). Tobacco litter costs and public policy: a framework and methodology for considering the use of fees to offset abatement costs. Tob. Control 20(Suppl. 1) i36–i41.
Schöneich-Argent, R. I., Hillmann, F., Cordes, D., Wansing, R. A. D., Merder, J., Freund, J. A., et al. (2019). Wind, waves, tides, and human error? – Influences on litter abundance and composition on German North Sea coastlines: an exploratory analysis. Mar. Pollut. Bull. 146, 155–172. doi: 10.1016/j.marpolbul.2019.05.062
Schulz, M., van Loon, W., Fleet, D. M., Baggelaar, P., and van der Meulen, E. (2017). OSPAR standard method and software for statistical analysis of beach litter data. Mar. Pollut. Bull. 122, 166–175. doi: 10.1016/j.marpolbul.2017.06.045
Statistisches Amt für Hamburg und Schleswig-Holstein, (2018). Beherbergung im Reiseverkehr in Schleswig-Holstein 2017. Statistische Berichte Kennziffer: G IV 1 – j 17 SH. Hamburg: Statistisches Amt für Hamburg und Schleswig-Holstein
Statistisches Amt Mecklenburg-Vorpommern. (2018). Statistische Berichte. Tourismus, Gastgewerbe. Kennziffer, Vol. G413. Available online at: https://www.laiv-mv.de/Statistik/Zahlen-und-Fakten/Wirtschaftsbereiche/Gastgewerbe-und-Tourismus. (accessed 08, 2018).
Suaria, G., Aliani, S., Merlino, S., and Abbate, M. (2018). The occurrence of paraffin and other petroleum waxes in the marine environment: a review of the current legislative framework and shipping operational practices. Front. Mar. Sci. 5:171. doi: 10.3389/fmars.2018.00094
Sztobryn, M., Stigge, H. J., Wielbińska, D., Weidig, B., Stanisławczyk, I., Kańska, A., et al. (2005). “Sturmfluten in der südlichen Ostsee,” in Berichte des Bundesamtes für Seeschifffahrt und Hydrographie. ed. BSH. Bundesamt für Seeschifffahrt und Hydrographie. Neptunallee 5, 18057 Rostock (Nr. 39).
Tekman, M. B., Krumpen, T., and Bergmann, M. (2017). Marine litter on deep Arctic seafloor continues to increase and spreads to the North at the HAUSGARTEN observatory. Deep Sea Res. I Oceanogr. Res. Pap. 120, 88–99. doi: 10.1016/j.dsr.2016.12.011
UNEP, (2005). United Nations Environment Programme. Marine Litter. An Analytical Overview. Nairobi: UNEP.
Urban-Malinga, B., Zalewski, M., Jakubowska, A., Wodzinowski, T., Malinga, M., Pałys, B., et al. (2020). Microplastics on sandy beaches of the southern Baltic Sea. Mar. Pollut. Bull. 155:111170. doi: 10.1016/j.marpolbul.2020.111170
Cauwenberghe, L.V., devriese, L., Galgani, F., Robbens, J., and Janssen, C. R. (2015). Microplastics in sediments. a review of techniques, occurrence and effects. Mar. Environ. Res. 111, 5–17. doi: 10.1016/j.marenvres.2015.06.007
Vegter, A. C., Barletta, M., Beck, C., Borrero, J., Burton, H., Campbell, M. L., et al. (2014). Global research priorities to mitigate plastic pollution impacts on marine wildlife. Endanger. Species Res. 25, 225–247. doi: 10.3354/esr00623
Veiga, J. M., Fleet, D., Kinsey, S., Nilsson, P., Vlachogianni, T., Werner, S., et al. (2016). Identifying Sources of Marine Litter. MSFD GES TG Marine Litter – Thematic Report. Thematic Report; JRC Technical Report No. EUR 28309 EN. Luxembourg: Publications Office of the European Union.
Velander, K., and Mocogni, M. (1999). Beach litter sampling strategies: is there a ‘Best’Method? Mar. Pollut. Bull. 38, 1134–1140. doi: 10.1016/s0025-326x(99)00143-5
Zielinski, S., Botero, C. M., and Yanes, A. (2019). To clean or not to clean? A critical review of beach cleaning methods and impacts. Mar. Pollut. Bull. 139, 390–401. doi: 10.1016/j.marpolbul.2018.12.027
Keywords: Marine Strategy Framework Directive, top marine beach litter Items, plastic pellets, cost-effective marine litter monitoring method, Baltic Sea
Citation: Haseler M, Balciunas A, Hauk R, Sabaliauskaite V, Chubarenko I, Ershova A and Schernewski G (2020) Marine Litter Pollution in Baltic Sea Beaches – Application of the Sand Rake Method. Front. Environ. Sci. 8:599978. doi: 10.3389/fenvs.2020.599978
Received: 28 August 2020; Accepted: 04 November 2020;
Published: 26 November 2020.
Edited by:
João P. G. L. Frias, Galway-Mayo Institute of Technology, IrelandReviewed by:
Catharina Diogo Pieper, University of the Azores, PortugalAlessio Gomiero, Norwegian Research Centre (NORCE), Norway
Gil Rito Gonçalves, University of Coimbra, Portugal
Copyright © 2020 Haseler, Balciunas, Hauk, Sabaliauskaite, Chubarenko, Ershova and Schernewski. This is an open-access article distributed under the terms of the Creative Commons Attribution License (CC BY). The use, distribution or reproduction in other forums is permitted, provided the original author(s) and the copyright owner(s) are credited and that the original publication in this journal is cited, in accordance with accepted academic practice. No use, distribution or reproduction is permitted which does not comply with these terms.
*Correspondence: Mirco Haseler, mirco.haseler@io-warnemuende.de