Article

Estimation of Tree Height by Combining Low Density Airborne LiDAR Data and Images Using the 3D Tree Model: A Case Study in a Subtropical Forest in China

1
Key Laboratory of Spatial Data Mining and Information Sharing of Ministry of Education, National & Local Joint Engineering Research Center of Satellite Geospatial Information Technology, Fuzhou University, Fuzhou 350108, China
2
Center for Spatial Information Science and Systems (CSISS), George Mason University, Fairfax, VA 22030, USA
*
Author to whom correspondence should be addressed.
Forests 2020, 11(12), 1252; https://doi.org/10.3390/f11121252
Submission received: 23 October 2020 / Revised: 22 November 2020 / Accepted: 25 November 2020 / Published: 26 November 2020
(This article belongs to the Section Forest Inventory, Modeling and Remote Sensing)

Abstract

:
In general, low density airborne LiDAR (Light Detection and Ranging) data are typically used to obtain the average height of forest trees. If the data could be used to obtain the tree height at the single tree level, it would greatly extend the usage of the data. Since the tree top position is often missed by the low density LiDAR pulse point, the estimated forest tree height at the single tree level is generally lower than the actual tree height when low density LiDAR data are used for the estimation. To resolve this problem, in this paper, a modified approach based on three-dimensional (3D) parameter tree model was adopted to reconstruct the tree height at the single tree level by combining the characteristics of high resolution remote sensing images and low density airborne LiDAR data. The approach was applied to two coniferous forest plots in the subtropical forest region, Fujian Province, China. The following conclusions were reached after analyzing the results: The marker-controlled watershed segmentation method is able to effectively extract the crown profile from sub meter-level resolution images without the aid of the height information of LiDAR data. The adaptive local maximum method satisfies the need for detecting the vertex of a single tree crown. The improved following-valley approach is available for estimating the tree crown diameter. The 3D parameter tree model, which can take advantage of low-density airborne LiDAR data and high resolution images, is feasible for improving the estimation accuracy of the tree height. Compared to the tree height results from only using the low density LiDAR data, this approach can achieve higher estimation accuracy. The accuracy of the tree height estimation at the single tree level for two test areas was more than 80%, and the average estimation error of the tree height was 0.7 m. The modified approach based on the three-dimensional parameter tree model can effectively increase the estimation accuracy of individual tree height by combining the characteristics of high resolution remote sensing images and low density airborne LiDAR data.

1. Introduction

Estimating forest structure parameters using airborne LiDAR (Light Detection and Ranging) data is a hot research topic in forest remote sensing [1,2,3]. As one of the most important forest structure parameters, the forest tree height is the basis of the inversion and estimation of other forest parameters [4,5,6]. However, field surveys of the tree height are not only costly and time consuming, but also have significant error since it is difficult to locate the treetop, especially with a dense forest crown [7,8].
At present, many studies have been conducted on estimating the forest tree height using LiDAR data [9,10], but due to the influence of the point cloud sampling density and the forest habitat, most of the previous studies used high-density point cloud data (point cloud density generally >1 point/m2) [10,11,12,13] and rarely paid attention to low-density point cloud data (point cloud density generally <1 point/m2) [13]. Since high density airborne LiDAR data are costly and cover relatively small areas and historical coverage is limited, the use of this technology for extracting forest structure parameters for a large area is not very feasible [14,15].
On the other hand, the canopy polygons can be obtained by segmenting the forest canopy height model (CHM), which can be constructed from the low density of the airborne LiDAR data point cloud. However, such polygons contain position deviation errors, which will affect the subsequent extraction of single tree level structure parameters such as the tree height. The forest tree height estimated from low density airborne LiDAR point cloud data is often lower than the actual with a larger error, especially at the single tree level, which affects the effective inversion of forest resources such as the forest stock volume and biomass [16,17].
Low density airborne LiDAR data, however, have been obtained and covers a wide range of areas around the world in the last decade or so. If the low density LiDAR data are fully studied and utilized, it will have great potential for accurately investigating and evaluating forest resources [18]. For example, to produce a 1/2000 digital elevation model (DEM), the Department of Surveying and Mapping in Fujian Province, China has been collecting low-density airborne LiDAR data and high-resolution remote sensing images in Fujian Province over the past ten years. In addition, forestry administrators have gradually started using remote-sensing unmanned aerial vehicles (UAV) to obtain high-resolution UAV images of forest areas [19]. There is the potential for more accurate tree height estimation at the single tree level by combining the tree crown size information results from high resolution images and the height from the low density airborne LiDAR data [20,21]. Such potentially more accurate tree height estimation will be helpful in improving the estimation accuracy of forest structural parameters and resources and provide better services for evaluating the effectiveness of forest ecological civilization construction, thus greatly improving the application value of the above data [22].
At present, the related studies regarding airborne LIDAR data in forestry mainly include acquiring forest parameters such as a digital elevation model (DEM) of the forest area, the average stand height [23], stock volume, and biomass [4,16]. Due to its high resolution and high timeliness, aerial remote sensing has been used for identifying the forest type and tree species and stratified sampling estimation. With the development of aerial remote sensing technology in recent years, the accuracy of the acquired airborne LiDAR data and that of the synchronous aerial images have been greatly improved, and the matching degree between the data has reached an unprecedented level. Therefore, it is feasible to improve the estimation accuracy of the forest tree height at the single tree level based on low-density airborne LiDAR data and aerial photography images [24].
The three-dimensional (3D) parameter model of trees based on the characteristics of the tree crown envelope structure has great potential in the high precision estimation of forest tree height from low density airborne LIDAR data. At present, the relevant studies have successfully applied the model to the estimation of forest parameters [25]. For example, Morsdorf et al. (2004) [26] used this model to obtain parameters such as the tree height, crown diameter, and crown base height from high-density LiDAR data. The results showed that the root mean square error (RMSE) of the tree height estimation was reduced to approximately 0.6 m. Paris et al. (2015) [27], for the first time, applied this model to the inversion of the tree height at the single tree level by combining high-sampling density LiDAR data with aerial images and obtained higher estimation accuracy. However, the research of Paris (2015) still had the following problems: first, the low-density LiDAR data used in the paper were derived from the high-density LiDAR data by reducing the sampling density instead of real low-density LIDAR data. Therefore, the method estimating tree height by the three-dimensional parameter model of trees needs to be further investigated. Second, the optical remote sensing image used by Paris (2015) had a very high resolution, close to that of the unmanned aerial vehicle (UAV) image, and the tree canopy was clearly distinguishable. In fact, when flying at high altitude, the resolution of many remote sensing images acquired synchronously with low-density LIDAR data is often only 0.5 m, which will lead to blurry canopy edges and make image segmentation difficult. Third, Paris (2015) studied only one conifer species, and the research results did not provide a tree height distribution map. Fourth, the accuracy evaluation of tree height estimation results only provided the average error of tree height, and did not provide the sample error information of single tree height in the study by Paris (2015) [27]. Furthermore, the application of the model is mainly limited to forest areas where the terrain is relatively flat and the trees are relatively uniform. Few papers have been published on the application of low-density airborne LiDAR data and lower-resolution remote sensing imagery to high-density forest areas with complex topography [28]. Therefore, it is necessary to further evaluate the universality of the tree 3D parametric model.
The low density airborne LiDAR data have been commonly used to estimate the average tree height at the forest plot level [29]. However, it is difficult to use the data to accurately obtain the crown structure information. To explore the potential value of low-density airborne LiDAR data in forest modeling and parameter derivation, this paper presented a modified method for estimating the tree height at the single tree level by using the three-dimension (3D) parameter tree model based on combining low-density airborne LiDAR data with simultaneously acquired aerial images as the inputs. The modified method used in this paper extends the application of the 3D tree model to airborne LiDAR point cloud data in forest areas. To evaluate and validate the method, experiments involving extracting the individual tree heights of the coniferous forest species such as Masson pine and Chinese fir, which are dominant in the subtropical Fujian China forest, were carried out.

2. Test Area and Data

2.1. Test Area

We selected two subtropical coniferous forest plots in Changting County and Jiangle County, Fujian Province, China as test sites. The two test sites are located in the subtropical zone and consist mainly of coniferous forest (Figure 1). The two plots are located at E117°32′46″, N26°49′59″ and E116°28′23″, N25°40′3″ respectively. The areas of forest plot 1 and forest plot 2 are 1.4 ha and 0.73 ha, respectively. The tree species in the Changting county test site is mainly Masson pine and that in the Jiangle county test site is Chinese fir. There is a high canopy density for forest plot 1 and forest plot 2 of 0.8 and 0.7, respectively. Table 1 lists the main information about the two test areas.

2.2. Test Data

The airborne LiDAR and the synchronous images of the two test sites were obtained by the Leica ALS70-HP airborne 3D laser scanning system in January and December 2014, respectively. The absolute flight altitude was 3500 m, the laser wavelength was 1064 nm, the maximum laser pulse frequency was 500 kHz, the maximum scanning frequency was 200 Hz, and three echo signals of the laser pulses were recorded during the flight. The lateral overlap of the whole flight was controlled at approximately 25%. The average scanning point of LiDAR was less than 2 m and the density of the laser pulse point cloud was approximately 0.7 pt/m2, which is low density LiDAR data. The original purpose of obtaining the LiDAR data was to derive the 1:2000 DEM instead of estimating the forest parameters. The aerial images obtained synchronously had a resolution of only 0.5 m and only had red, green, and blue bands. The resolution of the aerial image was obviously coarser than that of the images used in [27]. As we can see from Figure 1, the borders of the tree crown in the two forest plots are blurry, which will be challenging to accurately segment the crown boundaries.
Field measurements were made on the two selected forest plots in November 2015. Tree species in forest plot 1 and plot 2 are Masson pine and Chinese fir, respectively. The parameters of the two forest plots were obtained such as area, number of tree, canopy density, canopy width, height of part single trees, and terrain factor. Tree height can only be measured for those trees near the road and with a large gap among trees given the high canopy density. A tape measure was used to measure the area and crown width of the sample plot. An altimeter and reference scale was used to measure the height of some single trees with a diameter at breast height (DBH) greater than 5 cm. A compass was used to measure the direction of topographic slope and aspect. Crown width was obtained by averaging the crown diameter of each tree in the north–south and east–west directions measured by a tape measure. There were 420 trees in sample plot 1 and 654 trees in sample plot 2 based on field counting. The crown diameter information of 12 trees and 15 trees were obtained in forest sample plot 1 and plot 2, respectively. The tree heights of 11 trees were obtained in each sample plot. The main measured information in situ is shown in Table 1.

3. Methods

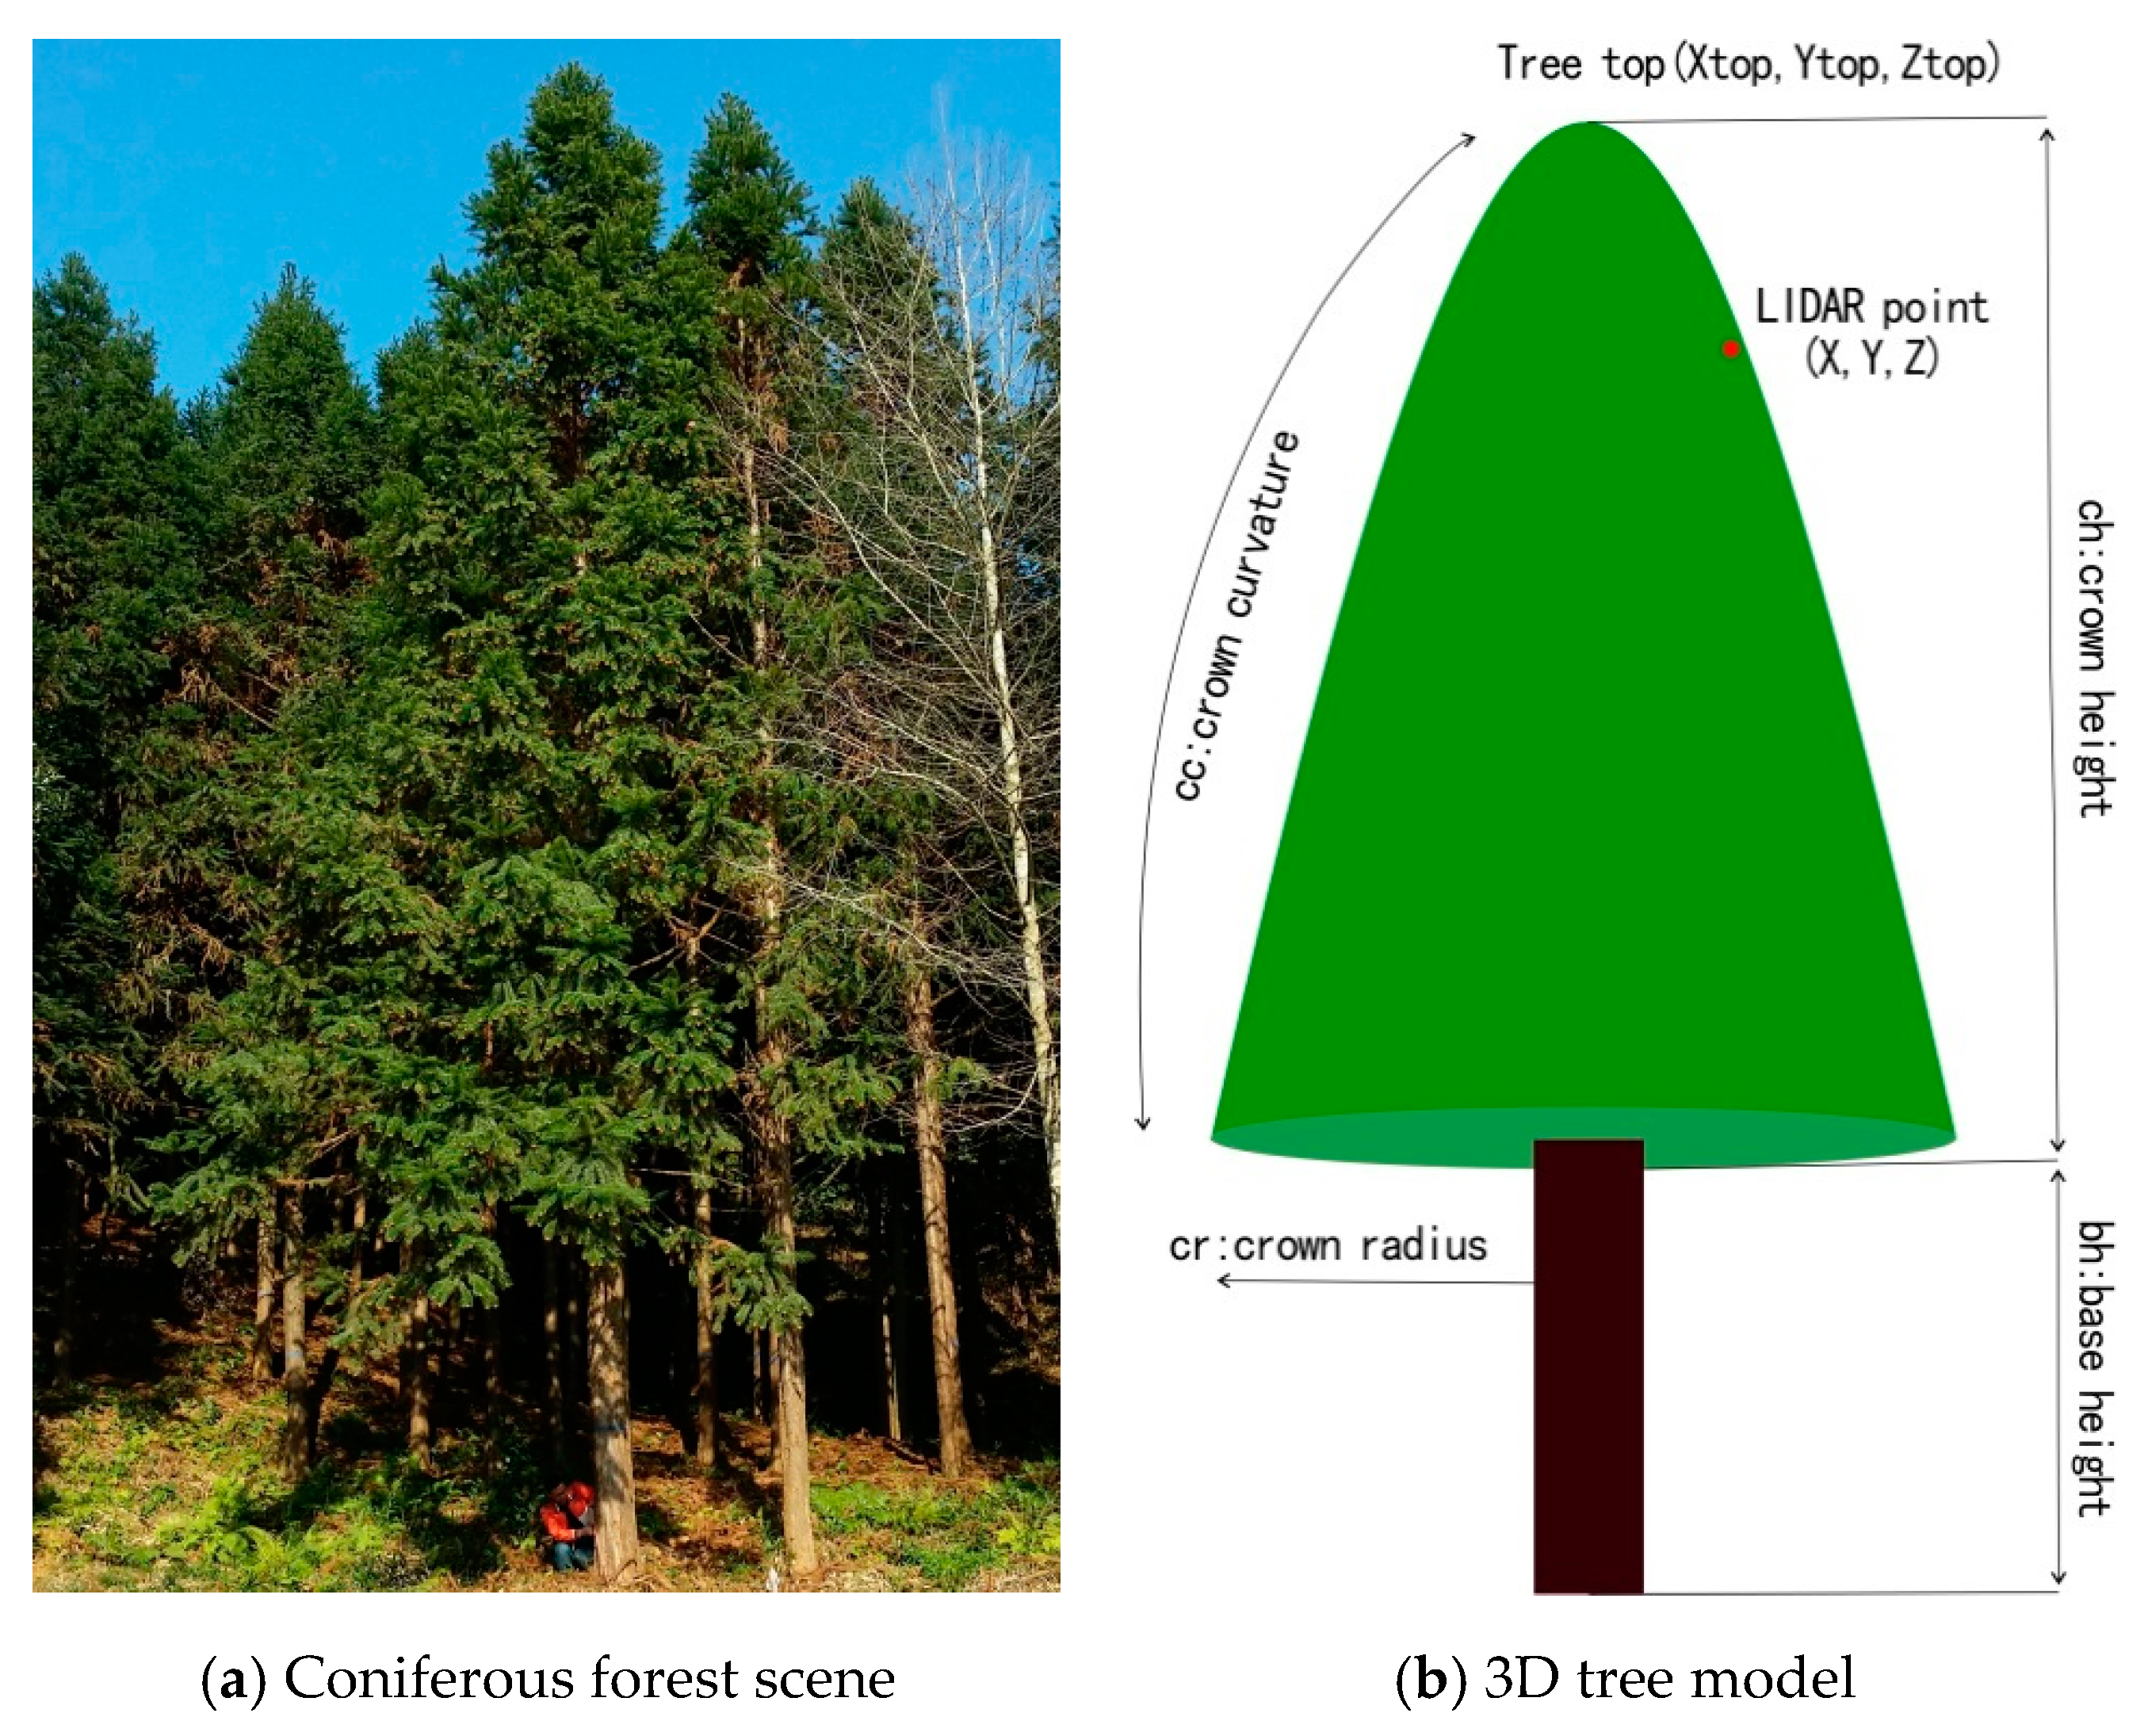
3.1. 3D Parameter Model of Trees

Different tree species have different crown shapes, for example, a coniferous forest has a conical outline, while the corresponding broad-leaved forest crown has a round umbrella shape with a relatively flat top [30]. Based on the geometric shape of the crown, Pollock et al. (1996) [31] used a generalized ellipsoid to model the crown envelope (see Equation (1)).
z c c c h c c + ( x 2 + y 2 ) c c / 2 c r c c = 1
where ( x , y , z ) represents the coordinates of the crown surface points, and a tree template is generated to identify the crown.
Gong et al. (2002) [32] further extended the model to match stereo image pairs and achieve a three-dimensional (3D) reconstruction of the coniferous forest crown surface. The proposed 3D tree model can be described by five parameters (see Figure 2).
Most of the laser pulses from the low density LiDAR will miss hitting the tree vertex, resulting in underestimation of the tree height. The low density LiDAR data, therefore, are usually not suitable for estimating the tree height at the single tree level. The 3D tree model in Figure 1 shows this problem [27]. To overcome this problem, it is necessary to use a 3D parameter tree model to reconstruct the real height of the tree apex based on the laser pulse point in the crown.
As described above, the crown often shows the geometrical characteristics of an umbrella, and because of this geometric effect, the low-density LiDAR data tend to especially underestimate coniferous forest heights. However, in the 3D tree model, a generalized ellipsoid is used to describe the geometric shape of the coniferous forest crown (see Figure 2), and (Xtop, Ytop, Ztop) represents the corresponding tree vertex coordinates. cc is the adjustment coefficient of the crown surface curvature, ch is the crown height, bh is the crown base height, and cr is the crown radius. Unlike the original model, the ellipsoid of the crown is obtained by fitting the coordinates (X, Y, Z) of the laser pulse points on the crown surface, that is, the 3D coordinates of the LiDAR data in each crown are used to uniquely determine a 3D tree model of the crown [27]. Each crown envelope, therefore, can be described by the following mathematical Equation (2).
( Z + c h Z t o p ) c c c h c c + [ ( X X t o p ) 2 + ( Y Y t o p ) 2 ] c c / 2 c r c c = 1
In Equation (2), the elevation of Z is constrained to Z t o p c h < Z < Z t o p , which can ensure that all the laser pulse points involved in the calculation are located on the crown surface. (X, Y, Z) is the coordinate value of the corresponding laser pulse point on the crown surface.
In the crown height reconstruction process, as long as we know the plane coordinate value of the crown vertex and the corresponding crown radius cr, and set a fixed set of cc and ch parameter values, the crown vertex Ztop can be calculated by using the corresponding LiDAR laser point data in the crown according to Equation (2) [27].

3.2. Parameter Estimation of the 3D Tree Model

To estimate the treetop height based on the 3D parameter tree model, the parameters for establishing the 3D tree model should first be estimated. Figure 3 shows the technique flow chart for estimating the treetop height at the single tree level from the low density aerial LiDAR data and images. The work can be divided into five parts (i.e., preprocess of LiDAR data, tree crown segmentation, detection of crown apex, estimation of the crown diameter, and estimation of treetop height).

3.2.1. Preprocessing of LiDAR Data and Images

Airborne LiDAR data were preprocessed by TerraScan software. Aerial images were preprocessed by Inpho software. First, the low-density airborne LiDAR data were co-registered with the high-resolution aerial image through image control points. Coordinate transformation equations were determined by pairs of control points on aerial images and DSM derived from LiDAR data. Second, the forest crown point cloud and ground point cloud were classified by using the adaptive triangulation (TIN) filtering algorithm [33], which can cope with a variety of forest landscapes, particularly both topographically and environmentally complex regions. Third, digital surface model (DSM) and digital elevation model (DEM) were respectively derived based on the filtering result of LiDAR data. Fourth, the normalized crown height model (CHM) was derived by the difference between DSM and DEM.
The digital orthophoto map (DOM) in the forest area was constructed based on stereo images and 1/50,000 DEM data.

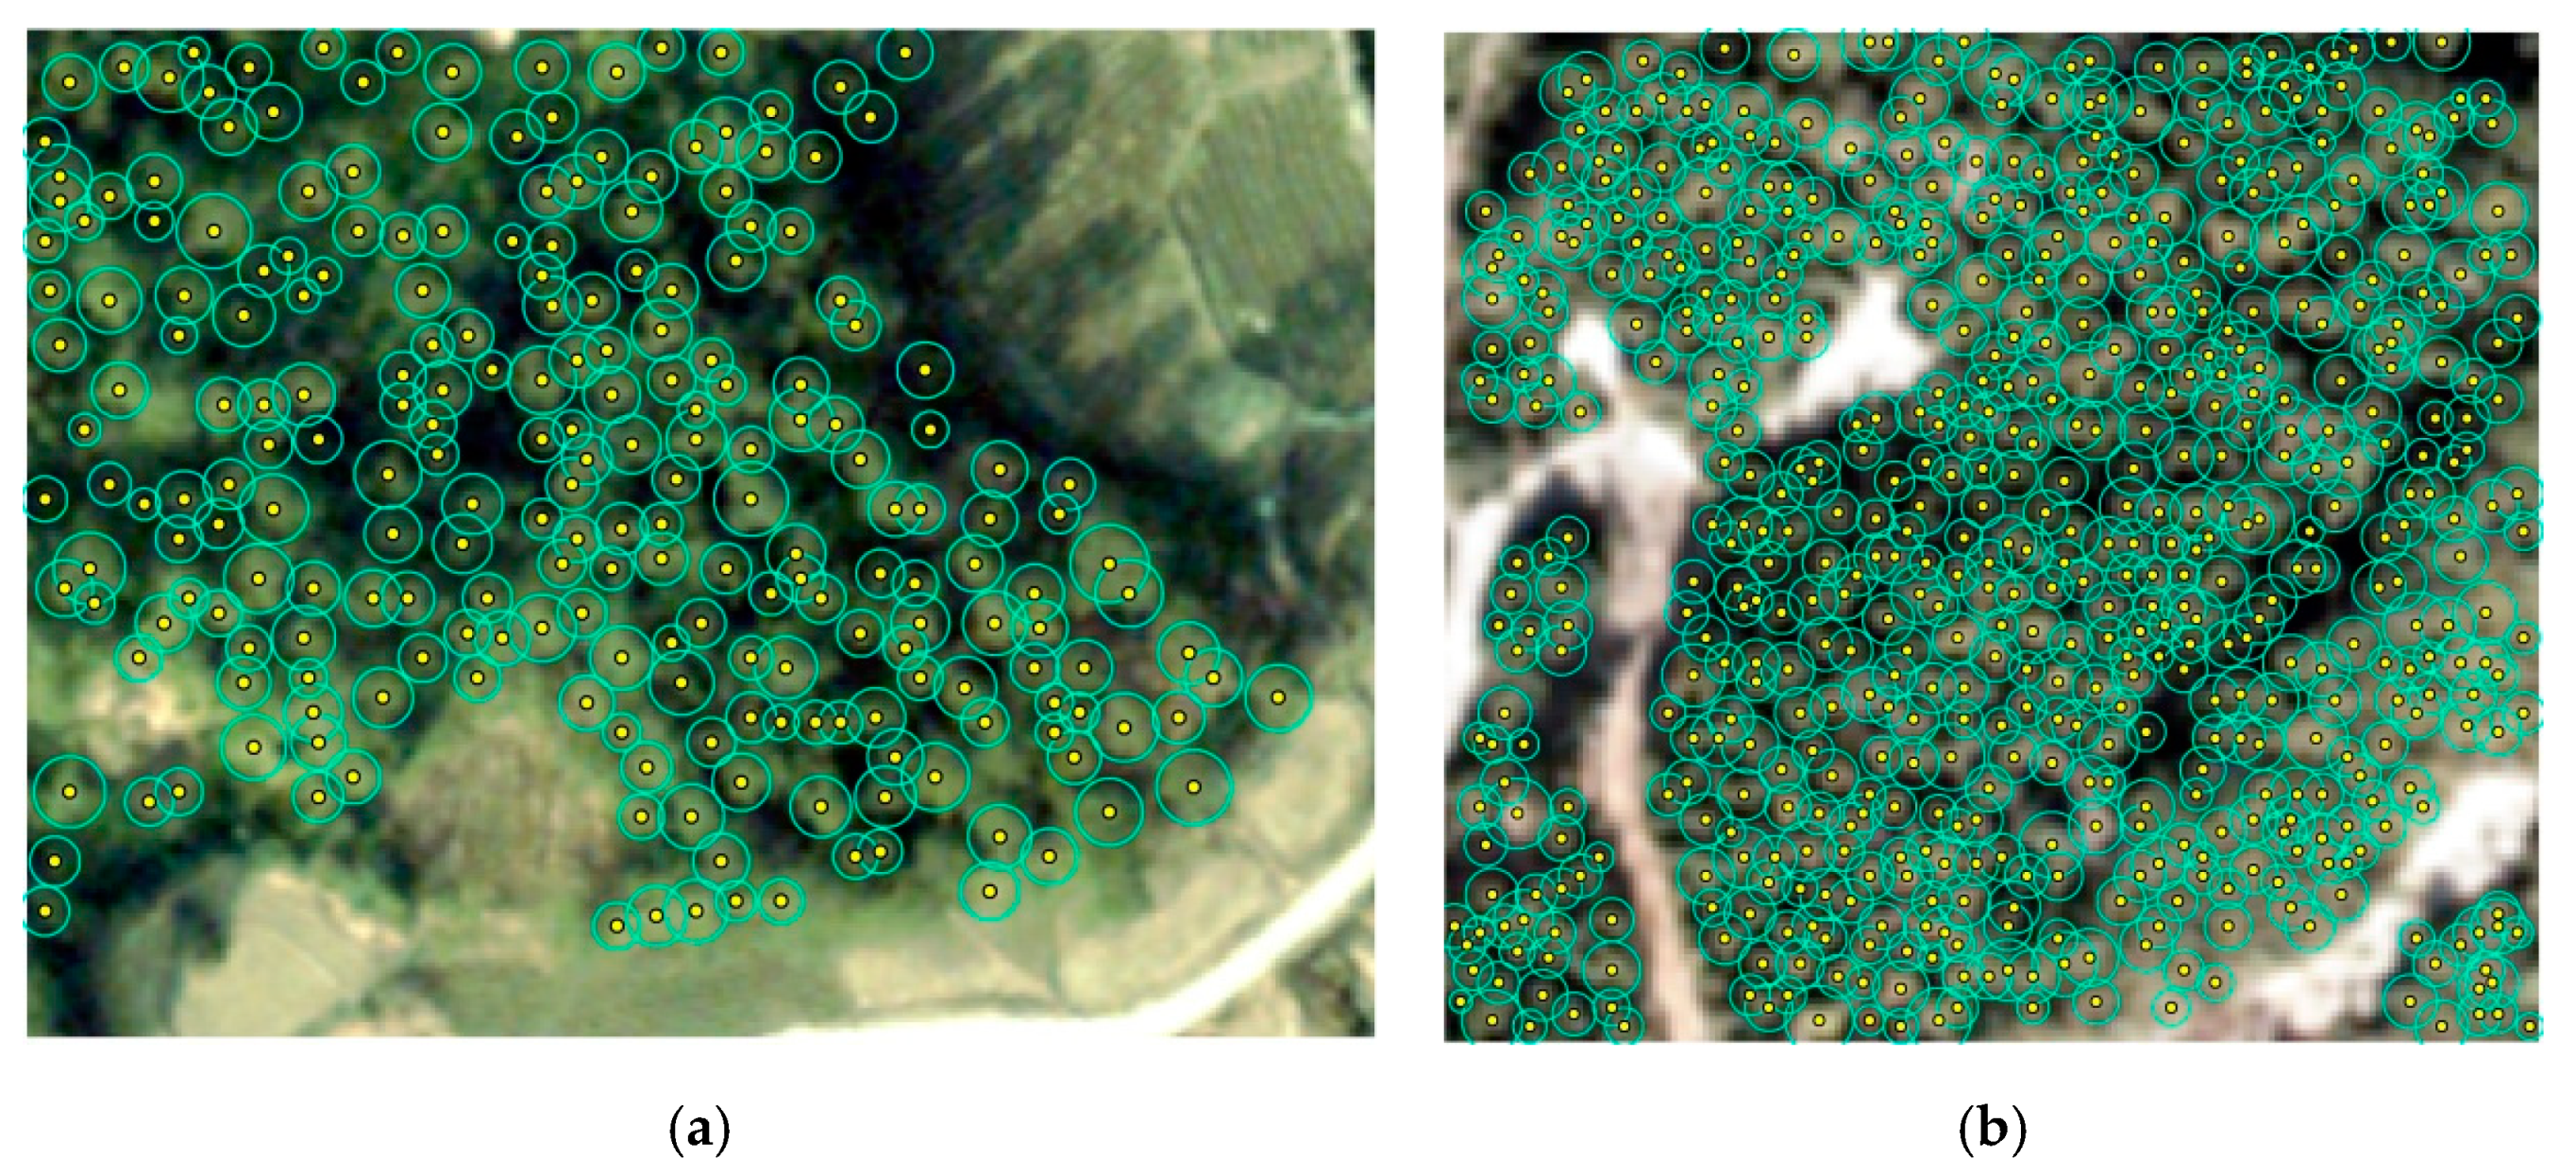
3.2.2. Tree Crown Segmentation from the Aerial Image

Tree crown features are often used to analyze the tree growth condition and predict forest biomass. However, because of the complexity and randomness of the forest structure, it is generally difficult to obtain the crown shape and boundary information. The means of measuring the tree crown with a ruler in the field can meet the requirements, but this method is time-consuming and laborious. In recent years, with improvement of the spatial resolution of satellite and aerial images, the emergence of high-resolution image, such as IKONOS, WorldView, and all types of aerial images has made it possible to extract accurate crown information at the single-tree level [34,35]. The research, at present, in this field mainly focuses on the extraction of the tree location and crown boundary information and mainly adopts the idea of image segmentation to extract crown information from remote sensing data such as the local maximum, multiscale segmentation, valley tracking method, etc. [36].
The data sources for the segmentation of a single tree crown are mainly from high resolution remote sensing images or LIDAR data. Since the green band of the optical image can be regarded as the 3D model of the actual crown [36], based on this fact, the green band of the remote sensing image is usually regarded as the crown height model of the forest area. Therefore, a marker-controlled watershed segmentation algorithm is used to obtain the crown boundary at the single-tree level.
The watershed image segmentation method was improved by Beucher et al. (1993) [37] and has been widely used in gray image segmentation. In recent years, marker controlled watershed transforms have been widely used in remote sensing image processing including the extraction of the forest crown and other parameters. For example, Wang et al. (2004) [36] used the watershed segmentation method based on crown vertex markers to separate a single tree crown from high-resolution aerial images, with an average accuracy of 75.6%. In addition, S.S. Ali et al. (2008) [38] used marker controlled watershed transform to segment the single tree crown based on fused features from multispectral images and LIDAR point cloud data and achieved satisfactory results.
When the traditional watershed segmentation algorithm is used to process the image of the high density crown area, it will easily lead to producing over segmentation of the crown because of the difficulty in determining the top of a single tree in a high crown area. At the same time, because the crown overlaps and interlaces in the area of high density crown, it will also easily produce an under-segmentation phenomenon. To solve this problem, this study adopted a watershed segmentation method combining morphological image reconstruction and marker control [37]. In addition, an improved local window maximum method was used to determine the position of each crown. As some tree crowns are not hit by the laser pulse, crowns and non-crowns cannot be sufficiently distinguished by low-density LIDAR data. To apply the segmentation only to the crown area for obtaining more accurate single tree crown information, the image was classified into a crown and non-crown area by using the iterative self-organizing data analysis algorithm (ISODATA) in this paper, instead of the method of using a height threshold from the low density LiDAR data [27].
After the external marker is obtained, it is imposed on the image that has been converted by a forced minimum for removing the non-crown area from the result of the watershed transformation. In this way, we can obtain a more accurate boundary of a single tree crown. The final marker-controlled watershed segmentation process is shown in Equation (3):
W c a n o p y = M a s k ( W a t e r S h e d ( R ( f + 1 ) f m ε ( f m ) ) B O u t m a r k )
where f m is the marker image with crown apex and R ( f + 1 )   f m ε ( f m ) is the image after the mandatory minimum conversion. WaterShed() is a Watershed function; Mask is a Mask function; and B O u t M a s k is an external marker, which is a non-crown area [37].
Segmentation of the tree crown at the single tree level was conducted on the aerial image. To eliminate the influence of non-crown areas, the forest crown and non-crown areas were distinguished by the ISODATA unsupervised classification algorithm. The classification results were used as external markers. The maximum classification number of ISODATA was set as 20, and the maximum iteration number was set to 5. The classification results were used to mask out the non-crown area of the aerial images (see Figure 4a,b).
Based on the green band of the image in the experimental area, a marker-controlled watershed segmentation method was used to automatically delineate the crown boundary. Figure 4c,d shows the crown segmentation results in two experimental forest plots. As can be observed from Figure 4c,d, the crown segmentation results by external labeling excluded most of the impact of the non-crown regions on the segmentation. By assessing the overall segmentation results, it can be found that most of the segmented tree crowns were relatively complete and accurate.
Based on the segmentation results, the number of trees was automatically counted. The result showed that the number was significantly less than that of the actual trees in the two test areas. There were 329 trees in forest plot 1 according to the segmentation, in which the actual number of trees was 420 and the segmentation error of single-tree crowns was 21%. There were 585 single trees identified in forest plot 2, in which the actual tree number was 654, so the error was 11%. While there was relatively higher extraction precision in the tree crown boundary, according to the extraction results, the segmentation results of the Chinese fir plot were better than that of the Masson pine test plot. This is because the tree species in forest plot 1 is dominated by Masson pine, in which its branches and leaves are scattered and there is some overlap among the crowns. Therefore, it easily leads to over- or under-segmentation. On the other hand, the main tree species in forest plot 2 is Chinese fir, where the tree branches and leaves grow more concentrated and the crowns overlap less. Therefore, there was a better segmentation result.

3.2.3. Detection of Crown Apex

The accurate detection of the apex position of tree crown is of great significance for the accurate estimation of tree height. The characteristic of the crown apex protuberance means that the top of the crown receives more solar radiation at different solar angles than the edge of the crown, which is particularly evident in the green band of the remote sensing images [37]. Based on the fact that the radiation value of the crown vertex is higher than that of the rest of the crown, a local maximum method is generally used to process the green band of the image for determining the location of the potential crown vertex [39]. As the crown size in the forest area is often different, the crown vertex obtained by using the fixed window maximum value usually has the problem of missing data or error detection [30,40]. To solve this problem, an improved local maximum method was used for detecting tree locations.
There are two steps in the detection of the tree crown apex. First, the maximum value of a fixed window according to the smallest crown size in the forest plot is applied to find the potential position of the crown apex. Second, the adaptive circle dynamic window is used for removing anomalous vertices. If the current vertex is the maximum value of the corresponding window, it will be saved; otherwise, it will be deleted. The dynamic window size is determined according to the variable range value of the semi-variance in the eight directions of the potential tree vertex [41]. The semi-variance value of the image pixel is calculated as follows:
γ ( h ) = 1 2 N ( h ) i = 1 N ( h ) [ Z ( x i ) Z ( x i + h ) ] 2
In Equation (4), γ ( h ) is the empirical semi-variance value; x i is the pixel position of the image; h is the interval distance of two pixels; Z ( x ) is the pixel value at position x i of the corresponding image; and N is the number of pixel pairs within a certain interval distance.
According to the calculated semi-variance value and the corresponding separation distance, we can calculate the semi-variance graph of the profile direction corresponding to the current vertex. According to the principle of spatial statistics, the variation value in the semi-variance diagram reflects the autocorrelation range of the regional spatial variables, that is, within the variation, the closer the points in the space are, the greater the correlation is, and eventually it tends to be stable. Based on such a principle, in many studies, the variable range value of the pixel is used as the basis for building dynamic windows so that an adaptive search of the local maximum value can be obtained, which greatly improves the estimation accuracy of the location of a single tree crown [42].
Figure 5 is the optimized crown vertex by judging whether each vertex belongs to the maximum value in its corresponding window, where its size is calculated vertex by vertex according to the search result of a fixed window. If there are other vertices in a window, the pixel with the highest brightness value is retained, and the current vertex will be deleted; otherwise, it will be retained. The results from removing abnormal results showed that the detected crown vertices were closer to the actual situation.
To verify the accuracy of a single tree apex position, we measured in the field and located the precise positions of 10 trees with a ruler in the forest plot 1 test site. Although the samples were limited, it still reflects the effect of extracting the tree crown vertices by this method. The result showed that the offset distance was mainly concentrated between 0.4 and 0.6 m and was generally close to the average value. The data distribution was concentrated, and there were few offset distances larger than one meter. Therefore, the results meets the precision requirement for the crown apex position in the test site.

3.2.4. Crown Diameter

As an important parameter of the tree crown, the crown diameter is one of the important variables for estimating the tree height, biomass, and tree withering loss by using the single tree growth model [43]. There are many methods to estimate the crown diameter such as the area method, which uses the diameter of a circle, which contains the crown polygon, as the crown diameter [44], and the main direction method, which uses the average value of the east–west and north–south main directions of the crown as the corresponding crown diameter [45]. This study used the main direction method to estimate the crown size of a single tree.
The valley searching method can be regarded as a combination of the valley tracking and local ray methods. The crown diameter is twice the average distance from the valley bottom to the top of the crown. If the spectral value of the current central pixel is less than that of the front and back pixels, then the current pixel is considered as the valley pixel, and the valley positions in eight directions of each vertex are found. The method performs better for planted forests with uniform growth, and is not ideal for uneven-growth natural forests and high-density forests. When the crowns overlap with each other, the discrimination of the minimum value of the spectrum between crowns is blurred. Compared with the scattered and independent single tree crown, there is no obvious boundary between the crowns, and it can be easily confused with the surrounding background pixels, which will affect the estimation accuracy of the crown. To solve the above problem, an improved valley searching method was applied in this study to accurately estimate the size of a single tree crown. The specific steps are as follows:
First, starting from each crown vertex to be detected, find the valley position from its eight directions and calculate the distance from the current pixel to the crown vertex; if the valley does not exist, calculate the half variance values in the current direction, and record its variation value. Second, calculate the average value of eight crown radius values, which is twice the crown diameter of the single tree.
The key to this method is to obtain the crown position and width in each direction. Each vertex is calculated from four sections in eight directions. During the calculation of each direction, the valley pixel of that direction is first searched. If the valley pixel does not exist, the variable range value of the semi-variance function in the direction is calculated as the crown radius of that direction. A maximum lookup pixel number is usually set at 1.5 times the maximum crown diameter in the test area.
The results using the improved valley searching method to calculate the crown diameter in the two test sites are shown in Figure 6. The field survey results showed that the estimates based on the improved method were very close to the actual crown diameters.
Figure 6 is a scatter plot of the measured and estimated tree crown diameters in the two test forest plots. It can also be observed from the figure that the correlation between the two was high, and the correlation coefficients reached 0.81 and 0.71, respectively. According to the result above in the two test sites, it can be observed that the improved approach for crown diameter estimation had higher estimation accuracy, and the average estimation error (RMSE) was basically within 0.3 m. In addition, it can be observed from the comparison of the results in the two test sites that the average estimation accuracy of the Masson pine crown diameter in forest plot 1 was higher than that in forest plot 2 since the crown in plot 1 was aged and less overlapped, and the correlation between the estimated value and the measured value was also higher.
The results also showed that some trees were not recognized well because of the errors caused from the uncertainty of the image itself such as the occurrence of image distortion and shadows. In addition, because of the overlapping and interlacing of the crowns in the dense forest area, it directly leads to the omission of some lower trees. Therefore, the algorithm needs to be further improved to adapt to different forest types and different quality images.

3.3. Estimation of Tree Top Height
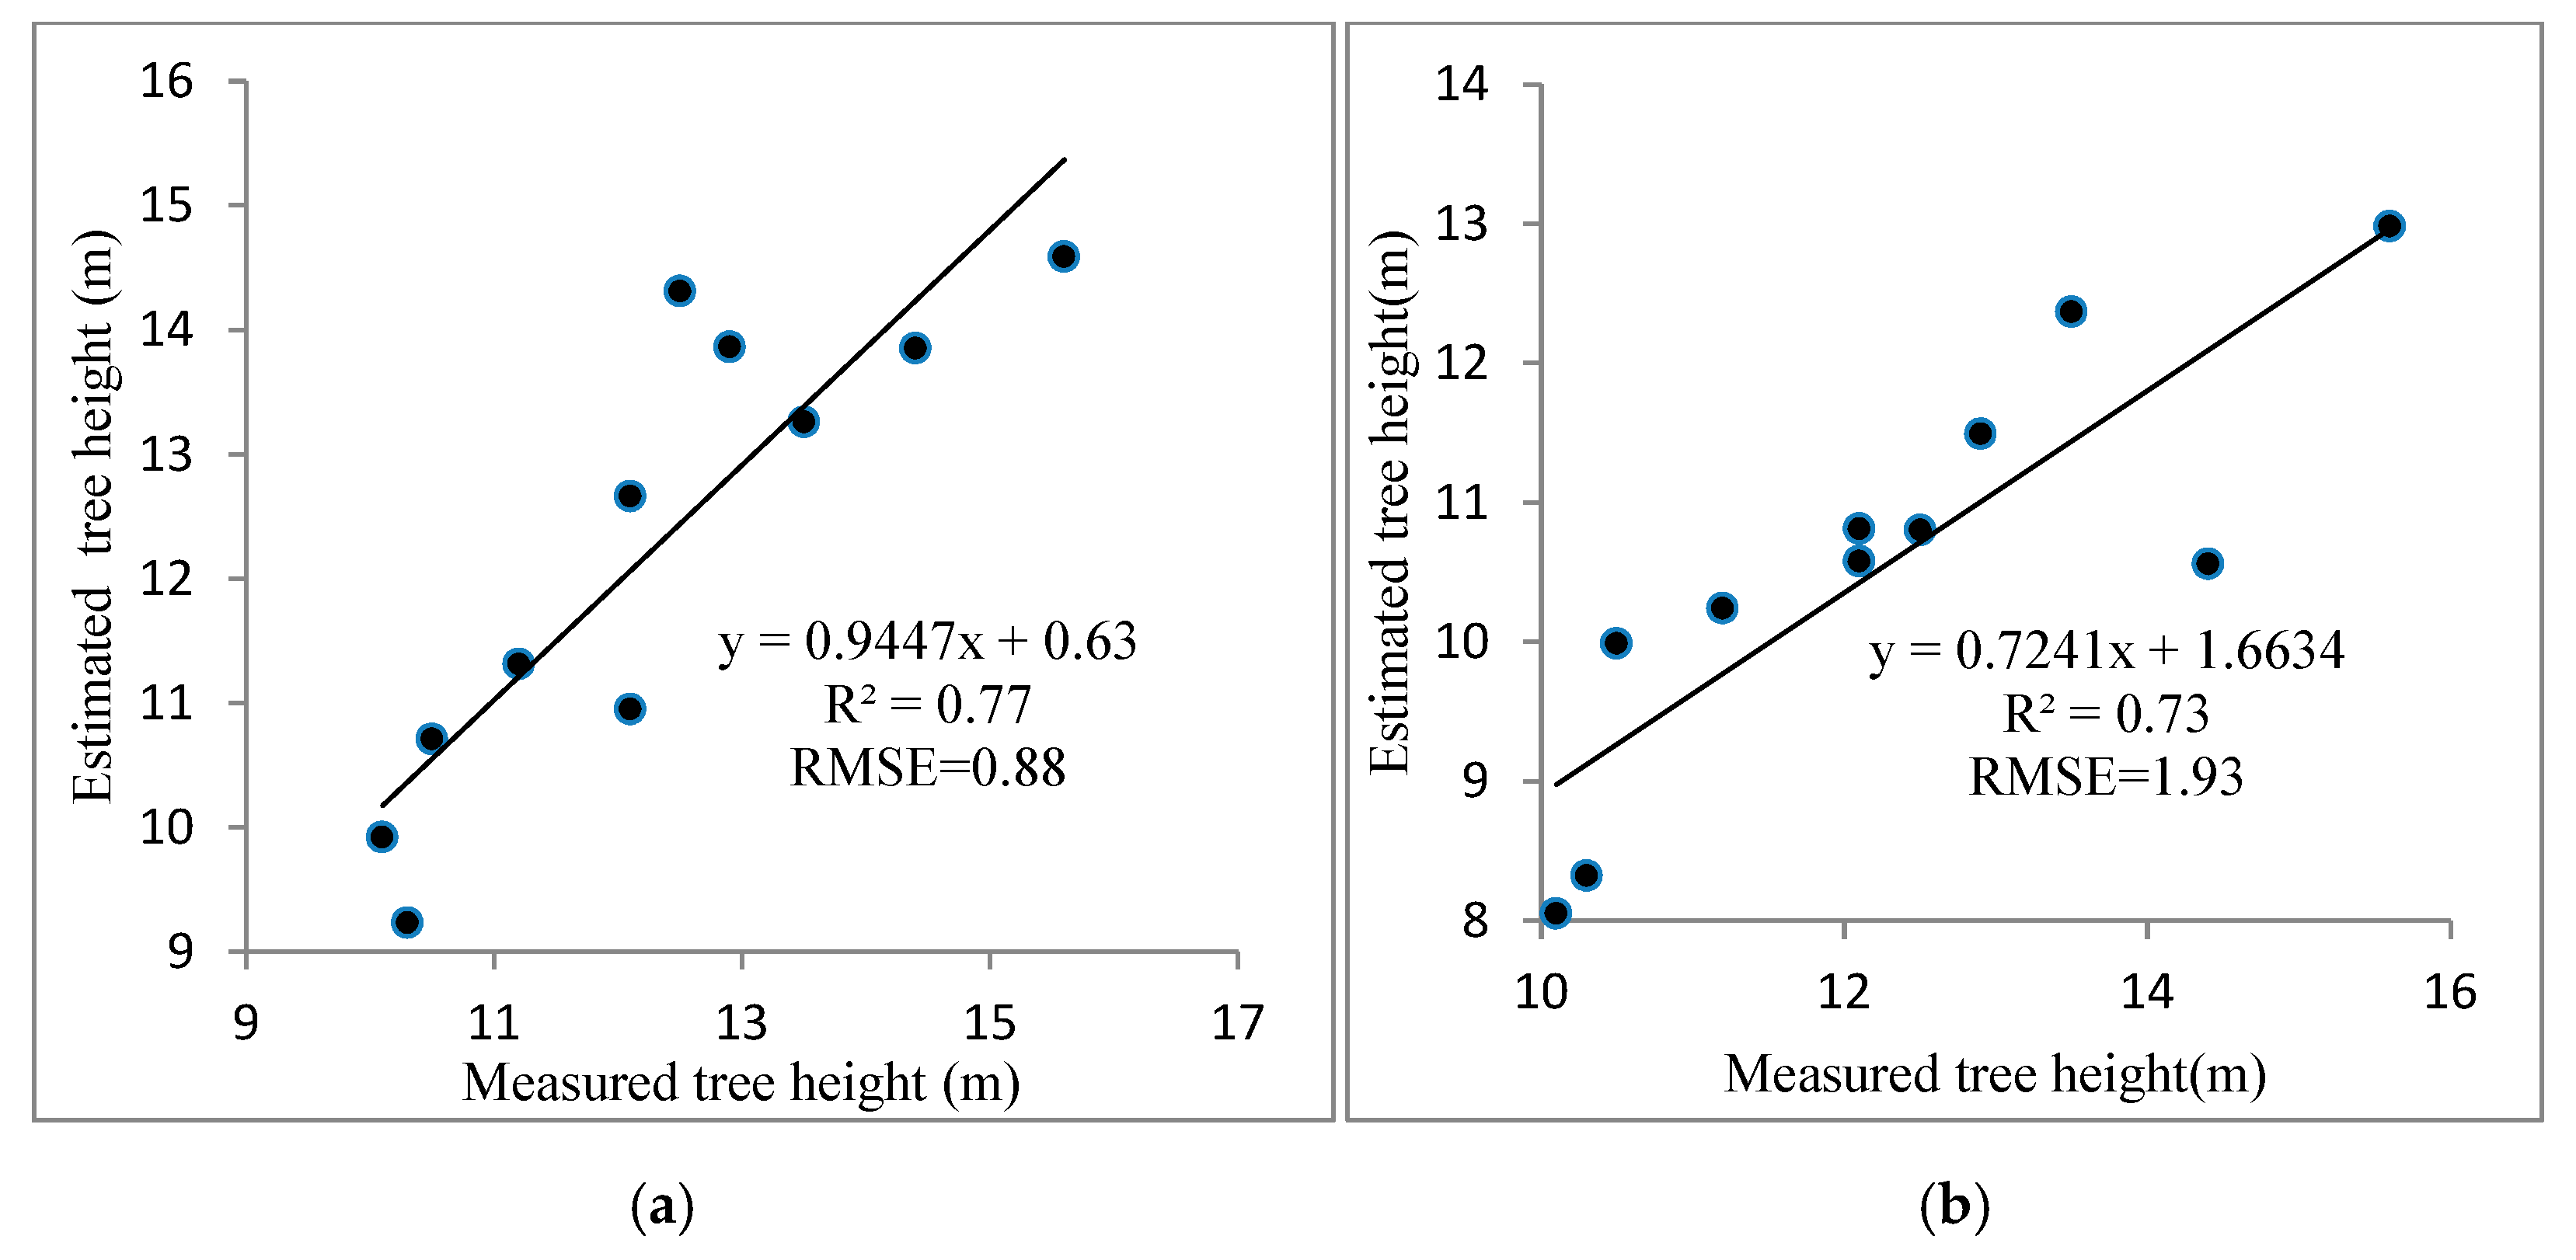
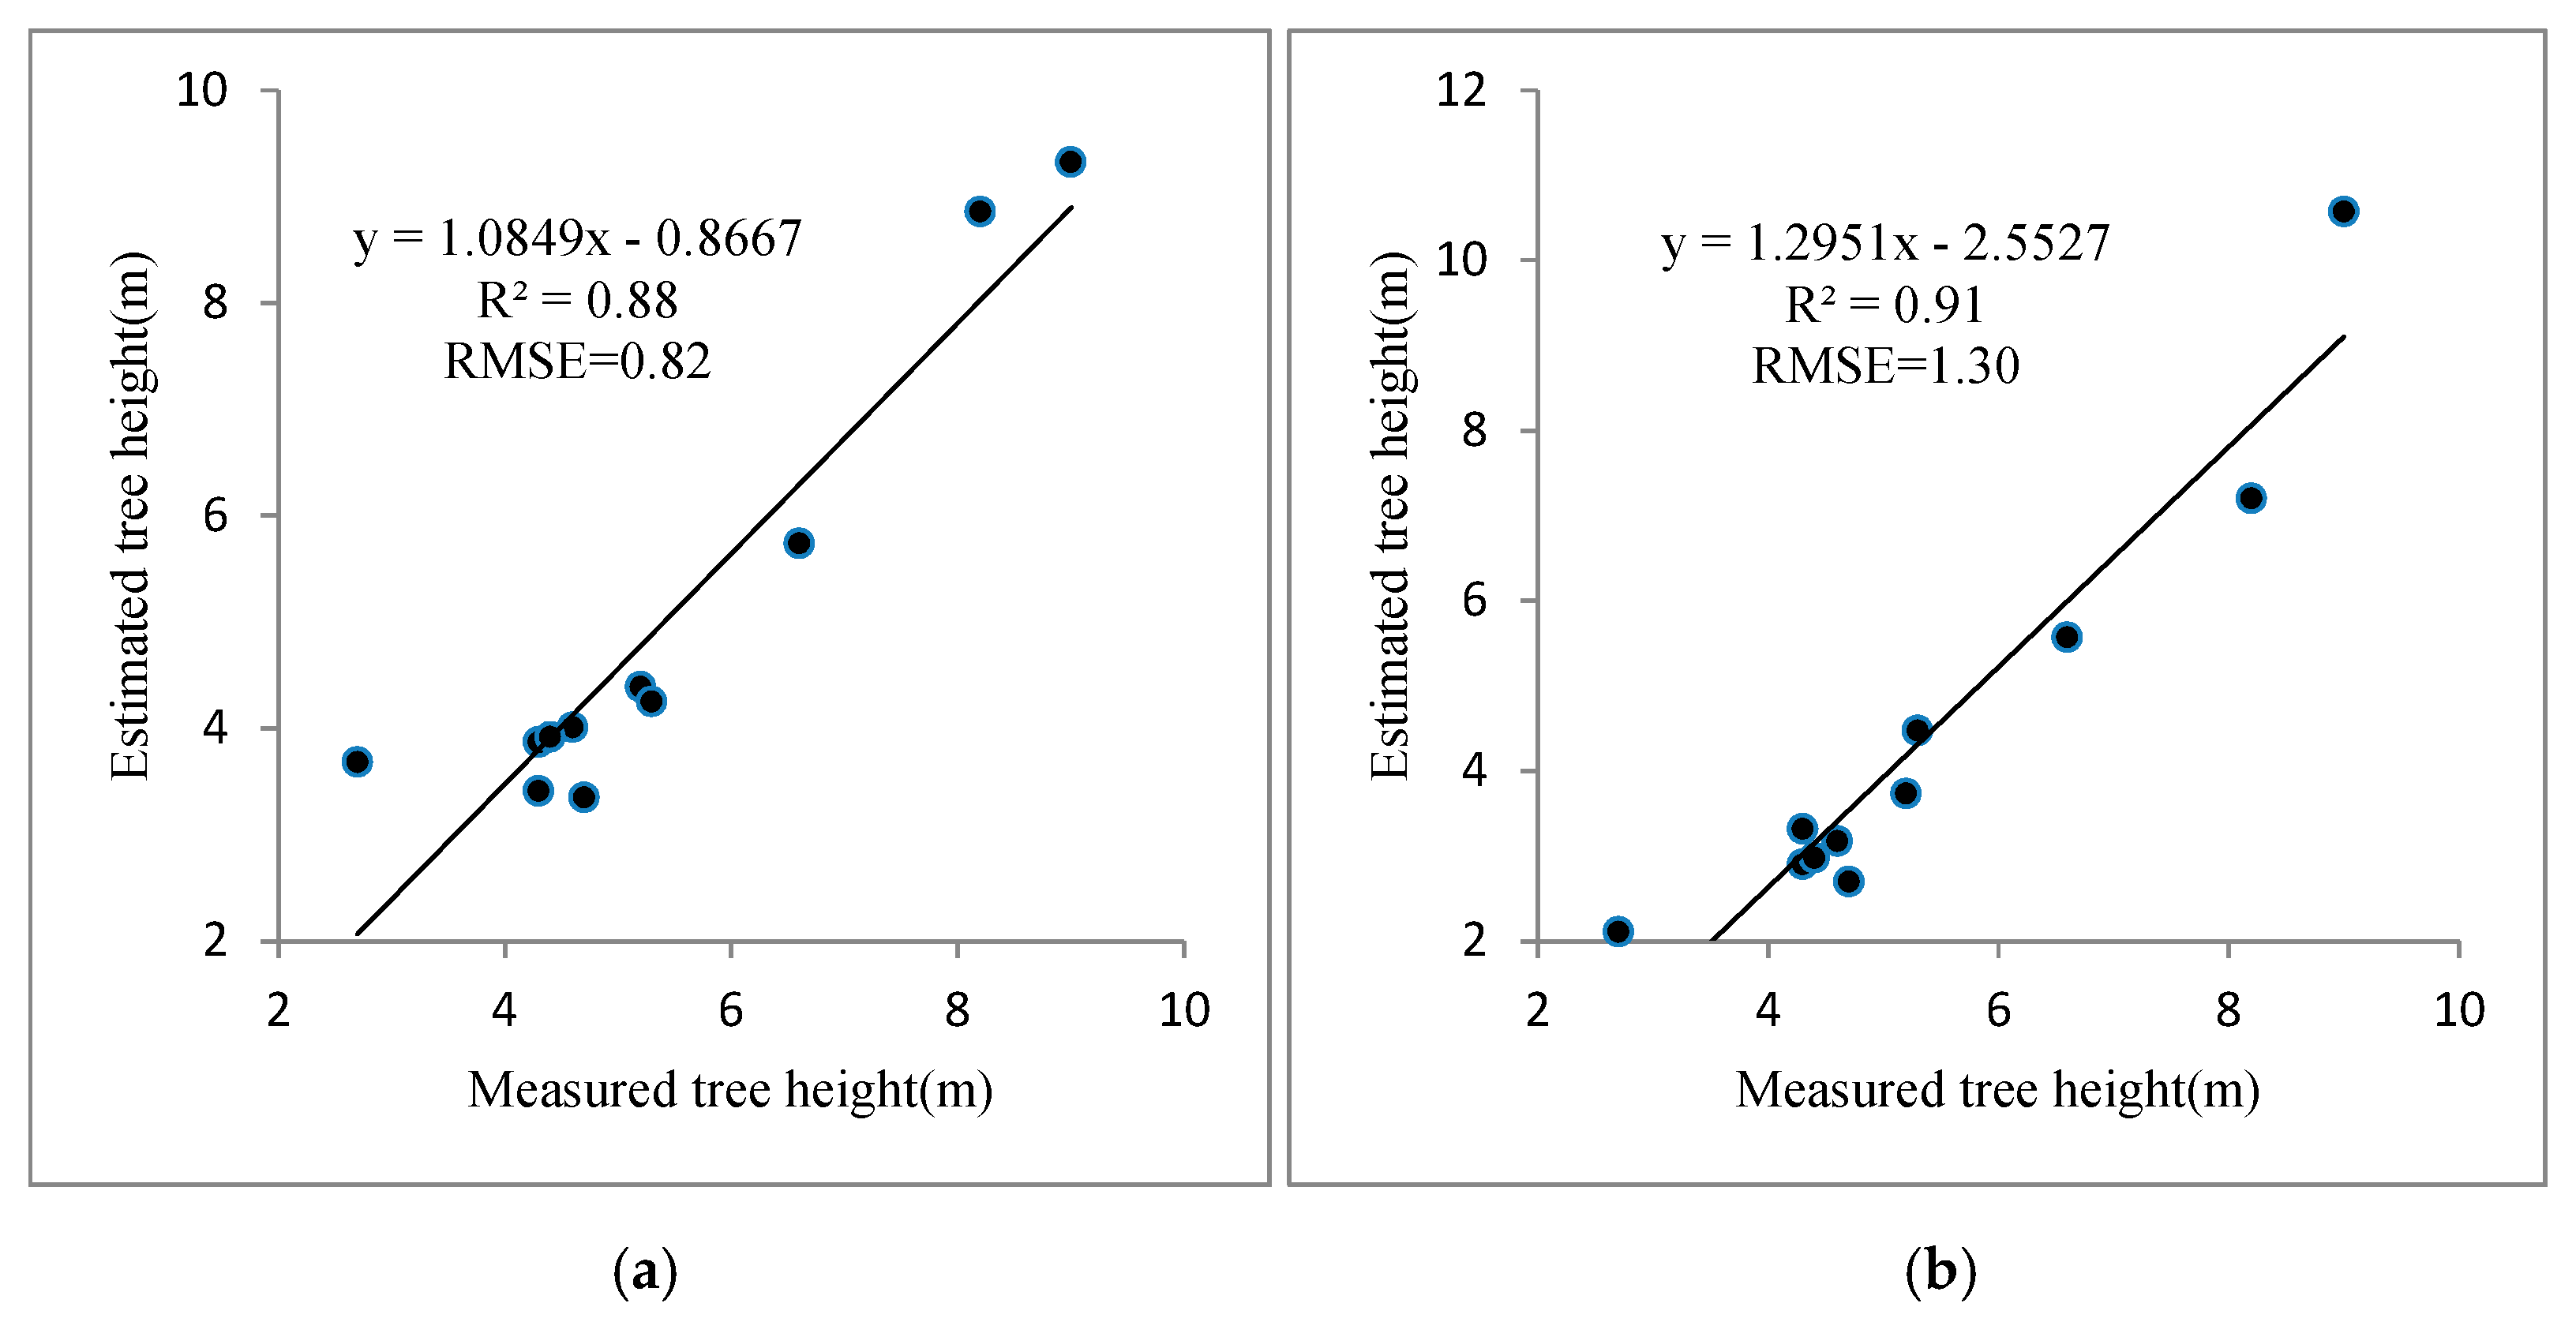
According to the number of laser pulse points in each tree crown, the tree top height can be reconstructed in the three following cases [27]: (1) more than one laser pulse point in a crown; (2) only one LiDAR pulse point in a crown, named as tree crown; and (3) missed LiDAR pulse points in a tree crown, named as the tree crown. According to the 3D tree model, the optimal parameter group for the single tree crown with more than one laser point will be calculated first. Then, a method similar to k-Nearest Neighbor (K-NN) was adopted to obtain the optimal 3D tree model for the single tree crown in the second case, which had only one laser pulse point, and the third case, which had no laser pulse point. The detailed method is similar to that in [27].
In the 3D tree height reconstruction process, different methods were used to estimate the tree height according to the number of laser pulse points in each tree crown. For the crown with more than one laser pulse point, the 3D parameter tree model was applied to reconstruct the tree height, while in the other two cases, the K-NN method was used to obtain the best 3D tree model based on the previous calculation results. It is obvious that the tree height reconstruction results in the first case affected the estimation result of the tree heights in cases two and three. To obtain the optimal 3D parameter tree model, two of important parameters of the model (i.e., cc (crown curvature) and ch (crown height)) need to be set based on the empirical knowledge of the tree species and growth status in the study area. To obtain a 3D parameter tree model as optimal as possible for each tree, multiple groups of parameters with interval combinations were calculated, and when the residual sum of squares reached the minimum, the corresponding cc and ch parameters were determined.

4. Results

The main tree species in forest plot 1 was mature Masson pine, which had less overlapped crowns. The main tree species in forest plot 2 was planted Chinese fir, whose stand age was less than ten years old and had an average height of approximately 5.4 m with a smaller crown diameter. The tree height result was estimated from the 3D tree model by combining the low-density LiDAR data with the high-resolution image. In the process of tree height verification, the tree heights estimated from the 3D tree model were compared with that from the field measurement and that obtained only based on the low-density LiDAR data with the local maximum method.
When reconstructing the single-tree height in the test sites, the crown was divided into three types according to the crown boundary obtained from the image: more than one laser pulse point in a crown, only one LiDAR pulse point in a crown, and missed LiDAR pulse points in a tree crown. Then, the single-tree height was reconstructed. Figure 7 shows the distributions of the LiDAR pulse points in the tree crowns in the two test sites. Through the processing of the synchronous aerial image, the vertex position, diameter, and boundary of the single-tree crown were obtained. Additionally, the tree height was reconstructed from the LiDAR data. Figure 7a shows the distribution of the laser points in the single crown in forest plot 1. There were 204 trees with more than one LiDAR pulse point in the crown, 32 trees with only one laser point, and 96 trees with no laser pulse point. For forest plot 2, there were 268 trees with more than one laser pulse point in the crown, 133 trees with only one laser pulse point in the crown, and 184 trees with no laser pulse points in the crown (see Figure 7b).
For the tree crown with more than one laser point, after comparing a few group parameters, it showed that when ch = 2~6 and cc = 1.1~1.9, the residual sum of squares was the smallest, and the estimation accuracy was the highest.
For the second case, the tree height was estimated by finding similar crowns in the first case. In this study, the altitude difference of the laser pulse point was set as ±0.5 m. First, both the altitude of laser pulse point in the current crown and the horizontal distance from the apex of the crown to the location of the laser pulse point were calculated and denoted as a2 and h2, respectively. Second, the crowns of the first case were searched to discover those whose altitude of laser pulse point (denoted as a1) was within ±0.5 m of a2. Third, the discovered first-case crowns were further down-selected based on the criterion that the distance from the apex of the crown to the location of the laser pulse point (denoted as h1) was within ±0.5 m of h2. Finally, the average of the tree top heights of the selected first-case crowns was regarded as the tree top height of the current second case tree crown.
For tree crowns in the third case, first, the distance from the vertex of tree crowns to that of tree crowns in the first case was calculated and sorted by distance. Second, the difference between the tree crown areas between the top 10 tree crowns in the sequence and the current tree crown was calculated and the results were sorted from small to large. Third, the first three tree crowns were selected as similar crowns and the average of the tree top heights of similar crowns was used as the tree top height of the current tree crown.
The process of tree height reconstruction in forest plot 2 was also divided into three parts. As the height of the Chinese fir in the plot was approximately 5.4 m with uniform geometry, when fitting the optimal parameters for the crowns with more than one laser pulse point, parameter ch was set to 1~3 m, and the iterative step length was 0.5 m; cc was set to 1.1~1.9, and the iterative step size was 0.1. Then, the parameters of the second and third cases were set to be the same as the experimental area in forest plot 1 and the heights of individual trees in forest plot 2 were also obtained.
The tree height reconstruction of all the individual trees in the study area was completed with the above approaches, and the final reconstruction results of the individual tree height obtained in two forest test areas are shown in Figure 8. As can be seen from Figure 8, the height difference of single trees in forest plot 1 was larger than that in forest plot 2, and the number of trees with different heights from 3 m to 17 m was evenly distributed, which is in direct proportion to the large difference of crown and abundant shadow in forest plot 1. Therefore, the estimation results of tree height in forest plot 1 were generally consistent with the actual situation. The Chinese fir had a smaller age and the tree height was mostly lower in forest plot 2. The estimated tree height ranged from 2 m to 13 m in forest plot 2, and most trees were less than 8 m and only a small number of trees (about 5%) were more than 8 m. The relatively uniform canopy hue and shorter shadow length could be seen from the image of forest plot 2. These features show that the estimated result of tree height is in line with the actual tree height.
To measure the estimation accuracy of the tree height based on the 3D tree model reconstruction, the single tree heights obtained through the 3D tree model and only through the aerial low density LiDAR data were analyzed according to tree height data measured in the field. Altimeters were used in forest plot 1 and plot 2 to obtain the measured height data of 11 trees as a reference. In addition, the estimation results from the 3D model were compared with the tree height estimation results using only the LiDAR data. As shown in Table 2 and Table 3, the accuracies of the tree height and measured tree height were evaluated by the two methods above.
As shown in Table 2, in forest plot 1, the average accuracy of the tree height estimated from the LiDAR data alone was 86.13%, and that from the 3D parameter tree model reached 94.2%, which was an increase of approximately 8%. It can be observed that the accuracy of tree height estimation using the 3D parameter tree model was significantly higher than that using only the LiDAR point cloud data, and the root mean square error (RMSE) of the tree height estimation was reduced from 1.93 m to 0.88 m (Figure 9). In addition, its correlation with the measured tree height (R2 = 0.76) was significantly higher than that of the only LiDAR data extraction results (R2 = 0.73). Through comparative analysis, it was observed that the 3D parameter tree model method is feasible to reconstruct the tree height information, which can obviously improve the accuracy of the estimation of the tree height and the utilization value of the low density LiDAR data.
It can be observed from Table 3 that the accuracies of the single tree height in forest plot 2 estimated from only the low-density LiDAR data had a minimum of 57.45%, a maximum of 87.80%, and an average of 75.25%, while accuracies of the single tree height estimated from the 3D parameter tree height reconstruction method had a minimum of 63.7%, a maximum of 96.44%, and an average of 83.68%, which increased by 8.43%. Compared to using only the low-density LiDAR data, the estimation accuracy of the single tree height from the 3D tree model, which combined LiDAR and the simultaneous high-resolution image, was significantly improved.
In addition, compared with the measured tree height, the tree heights estimated by the 3D tree model method were much more accurate although underestimation still existed. The root mean square error (RMSE) of the tree height extracted using only low-density LiDAR data was 1.30 m, while that using the 3D tree model reconstruction approach was reduced to 0.82 m in forest plot 2 (see Figure 10). Therefore, using a 3D tree model to estimate the single tree height from low-density airborne LiDAR point clouds and high-resolution images can effectively decrease the significant underestimation problem resulting from the low-density airborne LiDAR data.
Therefore, the approach of the 3D tree model is able to estimate the tree height more accurately by fully utilizing the information in both the low density LiDAR data in the crown and the high resolution image instead of information in only one of them. The 3D tree model should effectively solve the problem where the tree height at the single tree level is underestimated when the LiDAR point cloud density is lower (less than 1 p/m2).

5. Discussion

In this paper, considering the characteristics of the data sources we used, we proposed a modified technical process of tree height estimation based on [27]. The approach was applied to two coniferous forest species plots in the subtropical forest region, Fujian Province, China. At the same time, it should be noted that the estimation accuracy was higher for the tall trees with larger crown diameter forest plots than for the short trees or trees with smaller crown diameter. This is because taller trees have larger crowns that intercept more laser points in their crowns, resulting in a more optimal 3D model for higher estimation accuracy of the single tree height. Therefore, a 3D tree model can effectively improve the accuracy of the tree height estimation for mature forests with larger crowns. The advantages of the 3D tree model in tree height estimation for younger trees are not obvious for young forests with lower tree heights and smaller crowns, which tend to be missed by the laser points.
The following conclusions were reached after analyzing the results. This study proved that the marker-controlled watershed segmentation method, which is based only on airborne optical image instead of combining LiDAR data, can well identify the crown information of coniferous forests such as Masson pine and Chinese fir. According to the above results in the two test sites, it can be observed that the improved approach for crown diameter estimation had higher estimation accuracy, and the average estimation error (RMSE) was basically within 0.3 m. The accurate estimation of crown diameter provides important parameter support for the accurate estimation of tree top height using 3D parameter model of trees.
The 3D parameter tree model, which can take advantage of low-density airborne LiDAR data and high resolution images, is feasible for improving the estimation accuracy of the tree height. Compared to the tree height results from only using the low density LiDAR data, this approach can achieve higher estimation accuracy. For the point density of LiDAR data less than 1 pt/m2, like that in this paper, the accuracy of the tree height estimation at the single tree level for two test areas was more than 80%, and the average measurement error of the tree height was 0.7 m; these results are similar to the results obtained in [27]. Thus, the 3D tree model reconstruction approach can effectively increase the estimation accuracy of individual tree height.
Although the accuracy of the tree height estimation can be improved to some extent by combining low-density airborne LiDAR data and high-resolution simultaneous images, there are still some problems that need to be solved:
(1) More field data need to be collected to better verify the universality of the 3D parameter tree model. In this paper, the comparative analysis of the estimation results in the two experimental sites is still insufficient. One reason is the time difference between the field data and LiDAR data acquisition, which may lead to errors to some extent. The modified approach constructed in this study could well invert the height of the coniferous forests in the study site, but there was insufficient field data to verify the applicability of this method to forest plots with different species, tree ages, and crown densities [29,45]. Therefore, in future studies, it will be necessary to further verify and improve the universality of the model. In addition, the estimation accuracy of single tree height from airborne LiDAR data of different low sampling densities needs to be further investigated and analyzed to evaluate the applicability of the 3D parametric model of trees.
(2) The single-tree crown recognition method based on high-resolution remote sensing images needs further improvement. This study proved that the marker-controlled watershed segmentation method could well identify the crown information of coniferous forests such as Masson pine and Chinese fir. However, due to the limitation of field observation data, there is still a lack of relevant analysis and verification for the crowns of broad-leaved forests and mixed forests. In future studies, the method should be further verified and analyzed for forest plots with different tree ages, tree species, and crown densities.
(3) There are still some problems in the estimation of tree heights in forest areas with high crown densities. For example, the overlapping tree crowns make it difficult to accurately identify individual crowns. In recent years, the point cloud generated by UAV remote sensing could help in accurately extracting the point cloud information of tree tops [46]. Therefore, it will be an important research direction to combine the advantages of archived airborne low-density LiDAR data and newly acquired UAV remote sensing images in the forest region for the estimation of forest parameters such as the forest tree height.

6. Conclusions

In this study, the 3D parameter tree model was adopted to estimate the forest tree height at the single tree level from low density LiDAR data and high resolution images at two coniferous forest test plots in Fujian Province, China as the case and obtained the forest tree height at the single tree level. According to the results, we obtained the following conclusions. The tree crown profile and diameter at the single tree level are two important parameters for building the 3D parameter tree model. The marker-controlled watershed segmentation method is able to effectively extract the crown profile from sub-meter level resolution images. The adaptive local maximum method satisfies the need for detecting the vertex of a single tree crown. The improved following-valley approach is available for estimating the tree crown diameter with an accuracy of over 74%, and the average estimation error was basically controlled at approximately 0.3 m. The estimated crown diameter was highly correlated with the measured crown, and R2 could reach 0.71. The method based on the 3D parameter tree model is feasible to reconstruct the tree height at the single tree level. Compared with the tree height directly extracted from low-density point cloud data, the accuracy of the tree height estimation at the single tree level could be significantly improved. The estimation accuracy of the tree height at the single tree level in the two experimental sites was above 80%, and the RMSE of the tree height estimation results was reduced to approximately 0.8 m. The 3D tree height reconstruction method could effectively improve the estimation accuracy of the tree height for a coniferous forest at the single tree level based on the low density of airborne LiDAR, which originally could only be used for estimating the average tree height in forest plots. This greatly improves the application value and scope of low density airborne LiDAR data. For different stand types and ages, the estimation accuracy of the 3D parameter tree model varies to some extent. The more laser points hit in the crown, the more accurate the estimation of tree height obtained based on the 3D parameter model of tree. In this study, the estimation accuracy of the tree height in the mature forest plot area was significantly higher than that in the younger forest plots. The reason for this is that the absolute tree heights and crown diameters were more than those of the younger forest plots, and the crowns had more chance to be hit by the LiDAR laser points.

Author Contributions

All the authors made great contributions to the study. X.Z. proposed the methodology, analyzed the experimental results, and revised the manuscript. W.W. conducted and validated the experiments. L.L. programed the 3D tree model. L.D. contributed to writing and revising the manuscript and finalizing the manuscript. L.G. provided suggestions for the research design and revision. All authors have read and agreed to the published version of the manuscript.

Funding

This research was supported in part by the National Key Research and Development Program of China (No. 2017YFB0504203), the National Natural Science Foundation of China (No. 41201427), and the Key Laboratory of Spatial Data Mining & Information Sharing of Ministry of Education, Fuzhou University (No. 2019LSDMIS04).

Acknowledgments

The authors would like to thank the Fujian Institute of Surveying and Mapping, China for providing the test data.

Conflicts of Interest

The authors declare no conflict of interest.

References

  1. Kwong, I.H.Y.; Fung, T. Tree height mapping and crown delineation using LiDAR, large format aerial photographs, and unmanned aerial vehicle photogrammetry in subtropical urban forest. Int. J. Remote Sens. 2020, 41, 5228–5256. [Google Scholar] [CrossRef]
  2. Ferraz, A.; Saatchi, S.; Keller, M.; Longo, M.; Ometto, J.P. Lidar tree crown detection reveals new patterns of tree density, height and volume in the Brazilian Amazon. AGUFM 2019, 2019, B23E. [Google Scholar]
  3. Budei, B.C.; St-Onge, B. Variability of Multispectral Lidar 3D and Intensity Features with Individual Tree Height and Its Influence on Needleleaf Tree Species Identification. Can. J. Remote Sens. 2018, 44, 263–286. [Google Scholar] [CrossRef]
  4. Ojoatre, S.; Zhang, C.; Hussin, Y.A.; Kloosterman, H.E.; Ismail, M.H. Assessing the Uncertainty of Tree Height and Aboveground Biomass from Terrestrial Laser Scanner and Hypsometer Using Airborne LiDAR Data in Tropical Rainforests. IEEE J. Sel. Top. Appl. Earth Obs. Remote Sens. 2019, 12, 4149–4159. [Google Scholar] [CrossRef]
  5. Hernandez-Serna, A.; Hansen, M.; Potapov, P.; Zalles, V. Monitoring tree height, loss, and gain in South America using Lidar and Landsat data for 1985–2018. AGUFM 2019, 2019, B11F-2384. [Google Scholar]
  6. Bignell, G.; Mulo, S. Using LIDAR to Measure the Impact of Tree Height on Yield and Kernel Recovery in Mature Macadamia Orchards. Project Report. Queensland Government. AU; 2018. Available online: http://era.daf.qld.gov.au/id/eprint/6390/ (accessed on 1 September 2020).
  7. Andersen, H.; Reutebuch, S.E.; McGaughey, R.J. A rigorous assessment of tree height measurements obtained using airborne lidar and conventional field methods. Can. J. Remote Sens. 2006, 32, 355–366. [Google Scholar] [CrossRef]
  8. Itakura, K.; Kamakura, I.; Hosoi, F. Calculation of moving distance when measuring tree height using portable scanning lidar and tree height measurement by using registration of images obtained on the ground and high places. Eco-Engineering 2018, 30, 7–14. [Google Scholar]
  9. Mutwiri, F.K.; Odera, P.A.; Kinyanjui, M.J. Estimation of Tree Height and Forest Biomass Using Airborne LiDAR Data: A Case Study of Londiani Forest Block in the Mau Complex, Kenya. Open J. For. 2017, 7, 255–269. [Google Scholar] [CrossRef] [Green Version]
  10. Ivanovs, J.; Lazdins, A. Evaluation of tree height and number of trees using LiDAR data. Eng. Rural Dev. 2018, 153, 1390–1394. [Google Scholar]
  11. Chen, Q.; Baldocchi, D.; Gong, P.; Kelly, M. Isolating individual trees in a savanna woodland using small footprint lidar data. Photogramm. Eng. Remote Sens. 2006, 72, 923–932. [Google Scholar] [CrossRef] [Green Version]
  12. Dalla Corte, A.P.; Rex, F.E.; Almeida, D.R.A.D.; Sanquetta, C.R.; Silva, C.A.; Moura, M.M.; Wilkinson, B.; Zambrano, A.M.A.; Cunha Neto, E.M.D.; Veras, H.F. Measuring individual tree diameter and height using GatorEye High-Density UAV-Lidar in an integrated crop-livestock-forest system. Remote Sens. 2020, 12, 863. [Google Scholar] [CrossRef] [Green Version]
  13. Wanik, D.; Parent, J.; Anagnostou, E.; Hartman, B. Using vegetation management and LiDAR-derived tree height data to improve outage predictions for electric utilities. Electr. Pow. Syst. Res. 2017, 146, 236–245. [Google Scholar] [CrossRef]
  14. Silva, C.A.; Klauberg, C.; Hudak, A.T.; Vierling, L.A.; Liesenberg, V.; Bernett, L.G.; Scheraiber, C.F.; Schoeninger, E.R. Estimating Stand Height and Tree Density in Pinus taeda plantations using in-situ data, airborne LiDAR and k-Nearest Neighbor Imputation. Anais da Academia Brasileira de Ciências 2018, 90, 295–309. [Google Scholar] [CrossRef] [PubMed]
  15. Hyyppä, J.; Yu, X.; Hyyppä, H.; Vastaranta, M.; Holopainen, M.; Kukko, A.; Kaartinen, H.; Jaakkola, A.; Vaaja, M.; Koskinen, J. Advances in forest inventory using airborne laser scanning. Remote Sens. 2012, 4, 1190–1207. [Google Scholar] [CrossRef] [Green Version]
  16. Zolkos, S.; Goetz, S.; Dubayah, R. A meta-analysis of terrestrial aboveground biomass estimation using lidar remote sensing. Remote Sens. Environ. 2013, 128, 289–298. [Google Scholar] [CrossRef]
  17. Estornell, J.; Velázquez-Martí, B.; López-Cortés, I.; Salazar, D.; Fernández-Sarría, A. Estimation of wood volume and height of olive tree plantations using airborne discrete-return LiDAR data. Gisci. Remote Sens. 2014, 51, 17–29. [Google Scholar] [CrossRef]
  18. Staben, G.; Lucieer, A.; Scarth, P. Modelling LiDAR derived tree canopy height from Landsat TM, ETM+ and OLI satellite imagery—A machine learning approach. Int. J. Appl. Earth Obs. 2018, 73, 666–681. [Google Scholar] [CrossRef]
  19. Mielcarek, M.; Stereńczak, K.; Khosravipour, A. Testing and evaluating different LiDAR-derived canopy height model generation methods for tree height estimation. Int. J. Appl. Earth Obs. 2018, 71, 132–143. [Google Scholar] [CrossRef]
  20. Koukoulas, S.; Blackburn, G.A. Mapping individual tree location, height and species in broadleaved deciduous forest using airborne LIDAR and multi-spectral remotely sensed data. Int. J. Remote Sens. 2005, 26, 431–455. [Google Scholar] [CrossRef]
  21. Mora, B.; Wulder, M.A.; White, J.C.; Hobart, G. Modeling stand height, volume, and biomass from very high spatial resolution satellite imagery and samples of airborne LiDAR. Remote Sens. 2013, 5, 2308–2326. [Google Scholar] [CrossRef] [Green Version]
  22. Su, Y.; Ma, Q.; Guo, Q. Fine-resolution forest tree height estimation across the Sierra Nevada through the integration of spaceborne LiDAR, airborne LiDAR, and optical imagery. Int. J. Digit. Earth 2017, 10, 307–323. [Google Scholar] [CrossRef]
  23. Arumäe, T.; Lang, M.; Laarmann, D. Thinning-and tree-growth-caused changes in canopy cover and stand height and their estimation using low-density bitemporal airborne lidar measurements–a case study in hemi-boreal forests. Eur. J. Remote Sens. 2020, 53, 113–123. [Google Scholar] [CrossRef] [Green Version]
  24. Suárez, J.C.; Ontiveros, C.; Smith, S.; Snape, S. Use of airborne LiDAR and aerial photography in the estimation of individual tree heights in forestry. Comput. Geosci. 2005, 31, 253–262. [Google Scholar] [CrossRef]
  25. Ferraz, A.; Saatchi, S.; Mallet, C.; Meyer, V. Lidar detection of individual tree size in tropical forests. Remote Sens. Environ. 2016, 183, 318–333. [Google Scholar] [CrossRef]
  26. Morsdorf, F.; Meier, E.; Kötz, B.; Itten, K.I.; Dobbertin, M.; Allgöwer, B. LIDAR-based geometric reconstruction of boreal type forest stands at single tree level for forest and wildland fire management. Remote Sens. Environ. 2004, 92, 353–362. [Google Scholar] [CrossRef]
  27. Paris, C.; Bruzzone, L. A Three-Dimensional Model-Based Approach to the Estimation of the Tree Top Height by Fusing Low-Density LiDAR Data and Very High Resolution Optical Images. IEEE Trans. Geosci. Remote 2015, 53, 467–480. [Google Scholar] [CrossRef]
  28. Alexander, C.; Korstjens, A.H.; Hill, R.A. Influence of micro-topography and crown characteristics on tree height estimations in tropical forests based on LiDAR canopy height models. Int. J. Appl. Earth Obs. 2018, 65, 105–113. [Google Scholar] [CrossRef]
  29. Moe, K.; Owari, T.; Furuya, N.; Hiroshima, T. Comparing Individual Tree Height Information Derived from Field Surveys, LiDAR and UAV-DAP for High-Value Timber Species in Northern Japan. Forests 2020, 11, 223. [Google Scholar] [CrossRef] [Green Version]
  30. Meng, Q.; Chen, X.; Zhang, J.; Sun, Y.; Li, J.; Jancsó, T.; Sun, Z. Canopy structure attributes extraction from LiDAR data based on tree morphology and crown height proportion. J. Indian Soc. Remote 2018, 46, 1433–1444. [Google Scholar] [CrossRef]
  31. Pollock, R. The Automatic Recognition of Individual Trees in Aerial Images of Forests Based on a Synthetic Tree Crown Image Model. Ph.D. Thesis, University of British Columbia, Vancouver, BC, Canada, 1996. [Google Scholar]
  32. Gong, P.; Sheng, Y.; Biging, G.S. 3D Model-Based Tree Measurement from High-Resolution Aerial Imagery. Photogramm. Eng. Remote Sens. 2002, 68, 1203–1212. [Google Scholar]
  33. Zhao, X.; Guo, Q.; Su, Y.; Xue, B. Improved progressive TIN densification filtering algorithm for airborne LiDAR data in forested areas. ISPRS J. Photogramm. 2016, 117, 79–91. [Google Scholar] [CrossRef] [Green Version]
  34. Gillan, J.K.; Karl, J.W.; Duniway, M.; Elaksher, A. Modeling vegetation heights from high resolution stereo aerial photography: An application for broad-scale rangeland monitoring. J. Environ. Manag. 2014, 144, 226–235. [Google Scholar] [CrossRef] [PubMed]
  35. Zarco-Tejada, P.J.; Diaz-Varela, R.; Angileri, V.; Loudjani, P. Tree height quantification using very high resolution imagery acquired from an unmanned aerial vehicle (UAV) and automatic 3D photo-reconstruction methods. Eur. J. Agron. 2014, 55, 89–99. [Google Scholar] [CrossRef]
  36. Wang, L.P.G.A. Individual Tree-Crown Delineation and Treetop Detection in High-Spatial-Resolution Aerial Imagery. Photogramm. Eng. Remote Sens. 2004, 70, 351–357. [Google Scholar] [CrossRef] [Green Version]
  37. Beucher, S.; Meyer, F. Segmentation: The Watershed Transformation. Mathematical Morphology in Image Processing. Opt. Eng. 1993, 34, 433–481. [Google Scholar]
  38. Ali, S.S.; Dare, P.; Jones, S.D. Fusion of remotely sensed multispectral imagery and Lidar data for forest structure assessment at the tree level. ISPRS Proc. Beijing 2008, 37, B7. [Google Scholar]
  39. Kim, E.; Woo-Kyun, L.; Yoon, M.; Lee, J.; Lee, E.J.; Moon, J. Detecting individual tree position and height using Airborne LiDAR data in Chollipo Arboretum, South Korea. Terr. Atmos. Ocean. Sci. 2016, 27, 593. [Google Scholar] [CrossRef] [Green Version]
  40. Kim, D.; Choi, Y.; Lee, G.; Cho, G. Extracting Individual Number and Height of Tree using Airborne LiDAR Dataa. J. Cadastre Land InformatiX 2016, 46, 87–100. [Google Scholar]
  41. Wulder, M.; Niemann, K.O.; Goodenough, D.G. Local Maximum Filtering for the Extraction of Tree Locations and Basal Area from High Spatial Resolution Imagery. Remote Sens. Environ. 2000, 73, 103–114. [Google Scholar] [CrossRef]
  42. Gebreslasie, M.T.; Ahmed, F.B.; Van Aardt, J.A.N.; Blakeway, F. Individual tree detection based on variable and fixed window size local maxima filtering applied to IKONOS imagery for even-aged Eucalyptus plantation forests. Int. J. Remote Sens. 2011, 32, 4141–4154. [Google Scholar] [CrossRef]
  43. Popescu, S.C.; Wynne, R.H.; Nelson, R.F. Measuring individual tree crown diameter with lidar and assessing its influence on estimating forest volume and biomass. Can. J. Remote Sens. 2003, 29, 564–577. [Google Scholar] [CrossRef]
  44. Panagiotidis, D.; Abdollahnejad, A.; Surový, P.; Chiteculo, V. Determining tree height and crown diameter from high-resolution UAV imagery. Int. J. Remote Sens. 2017, 38, 2392–2410. [Google Scholar] [CrossRef]
  45. Ganz, S.; Käber, Y.; Adler, P. Measuring Tree Height with Remote Sensing—A Comparison of Photogrammetric and LiDAR Data with Different Field Measurements. Forests 2019, 10, 694. [Google Scholar] [CrossRef] [Green Version]
  46. Okojie, J.A.; Okojie, L.O.; Effiom, A.E.; Odia, B.E. Relative canopy height modelling precision from UAV and ALS datasets for forest tree height estimation. Remote Sens. Appl. Soc. Environ. 2020, 17, 100284. [Google Scholar] [CrossRef]
Figure 1. Aerial images of the two subtropical forest test sites in Fujian, China (Resolution: 0.5 m). (a) Forest plot 1 (Masson pine). (b) Forest plot 2 (Chinese fir).
Forests 11 01252 g001
Figure 2. Coniferous forest scene (a) and 3D parameter tree model for a single tree (b). (Xtop, Ytop, Ztop) represents the corresponding tree vertex coordinates. Cc is the adjustment coefficient of the crown surface curvature, ch is the crown height, bh is the crown base height, and cr is the crown radius, which is half of the crown diameter.
Forests 11 01252 g002
Figure 3. Flow for the estimation of the tree height at the single tree level combining low density airborne LiDAR data and images.
Forests 11 01252 g003
Figure 4. Marker-controlled Watershed segmentation result for single tree crowns in the two test areas. (a,b) Non-crown regions (red) resulting from ISODATA; (c,d) segmentation result.
Forests 11 01252 g004
Figure 5. The detection and estimation result for the tree crown apex (yellow) and diameter (blue). (a) Forest plot 1. (b) Forest plot 2.
Forests 11 01252 g005
Figure 6. Comparison of the estimated and measured tree crown diameter. (a) Forest plot 1. (b) Forest plot 2.
Forests 11 01252 g006
Figure 7. Distribution of LiDAR pulse points (green) in the tree crowns in the two test forest areas. (a) Forest plot 1. (b) Forest plot 2.
Forests 11 01252 g007
Figure 8. Estimated the treetop height at the single tree level in the two test sites. (a) Forest plot 1. (b) Forest plot 2.
Forests 11 01252 g008
Figure 9. The correlation between the estimated and measured tree height in forest plot 1: (a) tree height based on the 3D tee model and (b) tree height based only on the low density LiDAR data.
Forests 11 01252 g009
Figure 10. The correlation between the estimated and measured tree height in forest plot 2: (a) tree height based on the 3D tree model and (b) tree height based only on the low density LiDAR data.
Forests 11 01252 g010
Table 1. Information measured in situ on the two forest plots.
PlotAreaNumber of TreeAltitudeCanopy DensityCrown Diameter RangeTree Height RangeSlope
Plot 11.4 ha420322 m0.82.1–4.33 m~17 m13°
Plot 20.73 ha654374 m0.71.1–2.73 m~13 m31°
Table 2. Accuracy of tree height estimation based on the 3D parameter tree model in forest plot 1.
Tree CodeHFH3D3DEAC_H3DHLLEAC_HL
115.614.59−1.0193.52%12.98−2.6283.20%
212.913.860.9692.55%11.49−1.4189.07%
314.413.85−0.5596.18%10.56−3.8473.33%
413.513.26−0.2498.22%12.37−1.1391.63%
512.514.311.8185.52%10.80−1.786.40%
611.211.310.1199.02%10.24−0.9691.43%
712.112.660.5695.37%10.81−1.2989.34%
810.510.710.2198.00%9.99−0.5195.14%
910.19.92−0.1898.22%8.05−2.0579.70%
1010.39.23−1.0789.61%8.32−1.9880.77%
1112.110.95−1.1590.49%10.58−1.5287.44%
Average12.2912.240.7194.25%10.561.7286.13%
Note: HF: Field measured tree height (m); H3D: Tree height from the 3D tree model (m); 3DE: The difference between the estimated value and the measured value (m), that is, H3D-HF; AC_H3D: accuracy of the estimation for the 3D tree model, (1 − |3DE|/HF) × 100%; HL: Tree height from only the LiDAR data (m); LE: The difference between the estimated value and the measured value, HE-H; AC_HL: accuracy of the estimation from only the LiDAR data, (1 − |LE|/HF) × 100%.
Table 3. Accuracy of tree height estimation based on the 3D tree model in forest plot 2.
Tree CodeHFH3D3DEAC_H3DHLLEAC_HL
19.09.320.3296.44%10.571.5782.55%
24.33.41−0.8979.30%3.32−0.9877.21%
38.28.860.6691.95%7.2−1.087.80%
44.64.01−0.5987.17%3.17−1.4368.91%
55.24.39−0.8184.42%3.73−1.4771.73%
64.33.87−0.4390.00%2.9−1.467.44%
74.73.35−1.3571.28%2.7−2.057.45%
86.65.74−0.8686.97%5.57−1.0384.39%
95.34.25−1.0580.19%4.47−0.8384.34%
102.73.680.9863.70%2.11−0.5978.15%
114.43.92−0.4889.09%2.98−1.4267.73%
Average5.394.980.7683.68%4.431.2575.25%
Publisher’s Note: MDPI stays neutral with regard to jurisdictional claims in published maps and institutional affiliations.

