The Influence of Urban Conditions on the Phenology of Aesculus hippocastanum L. Using the Example of Wroclaw (Poland)

 ,
,
Abstract
:1. Introduction
2. Materials and Methods
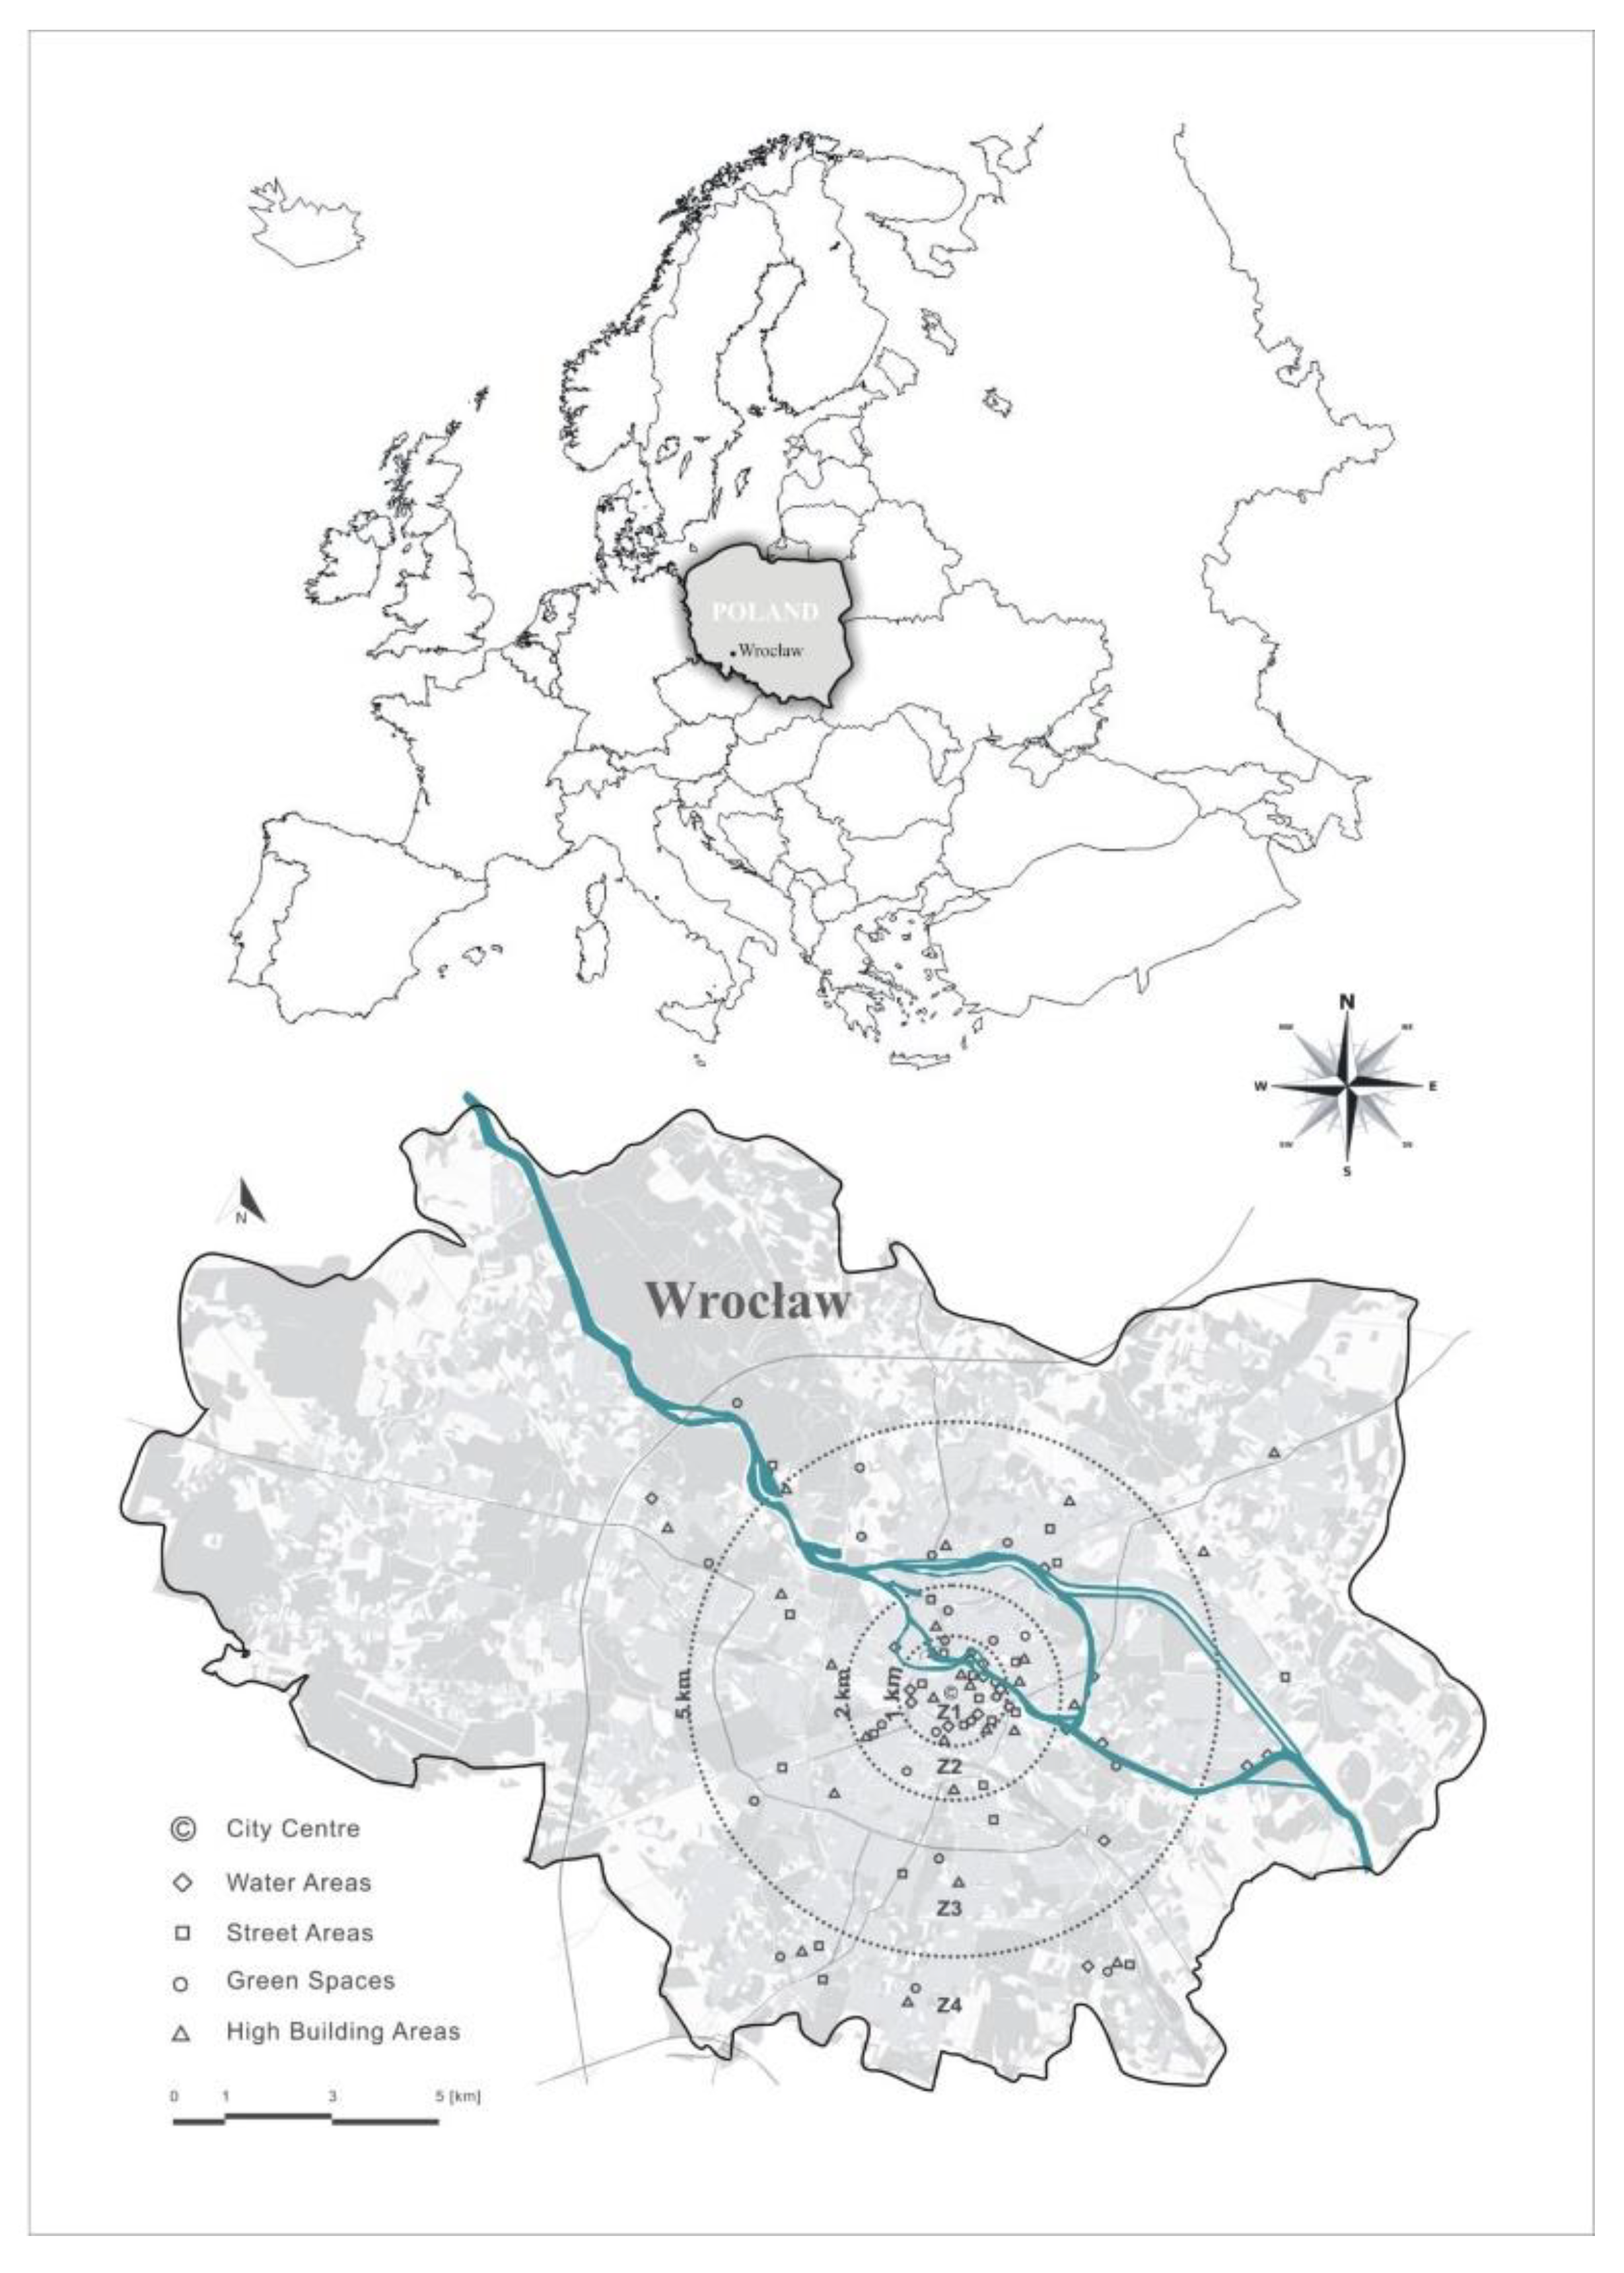
2.1. The Range of Research
2.2. Research Objects
2.3. Field Observations
2.4. Data Analysis
3. Results
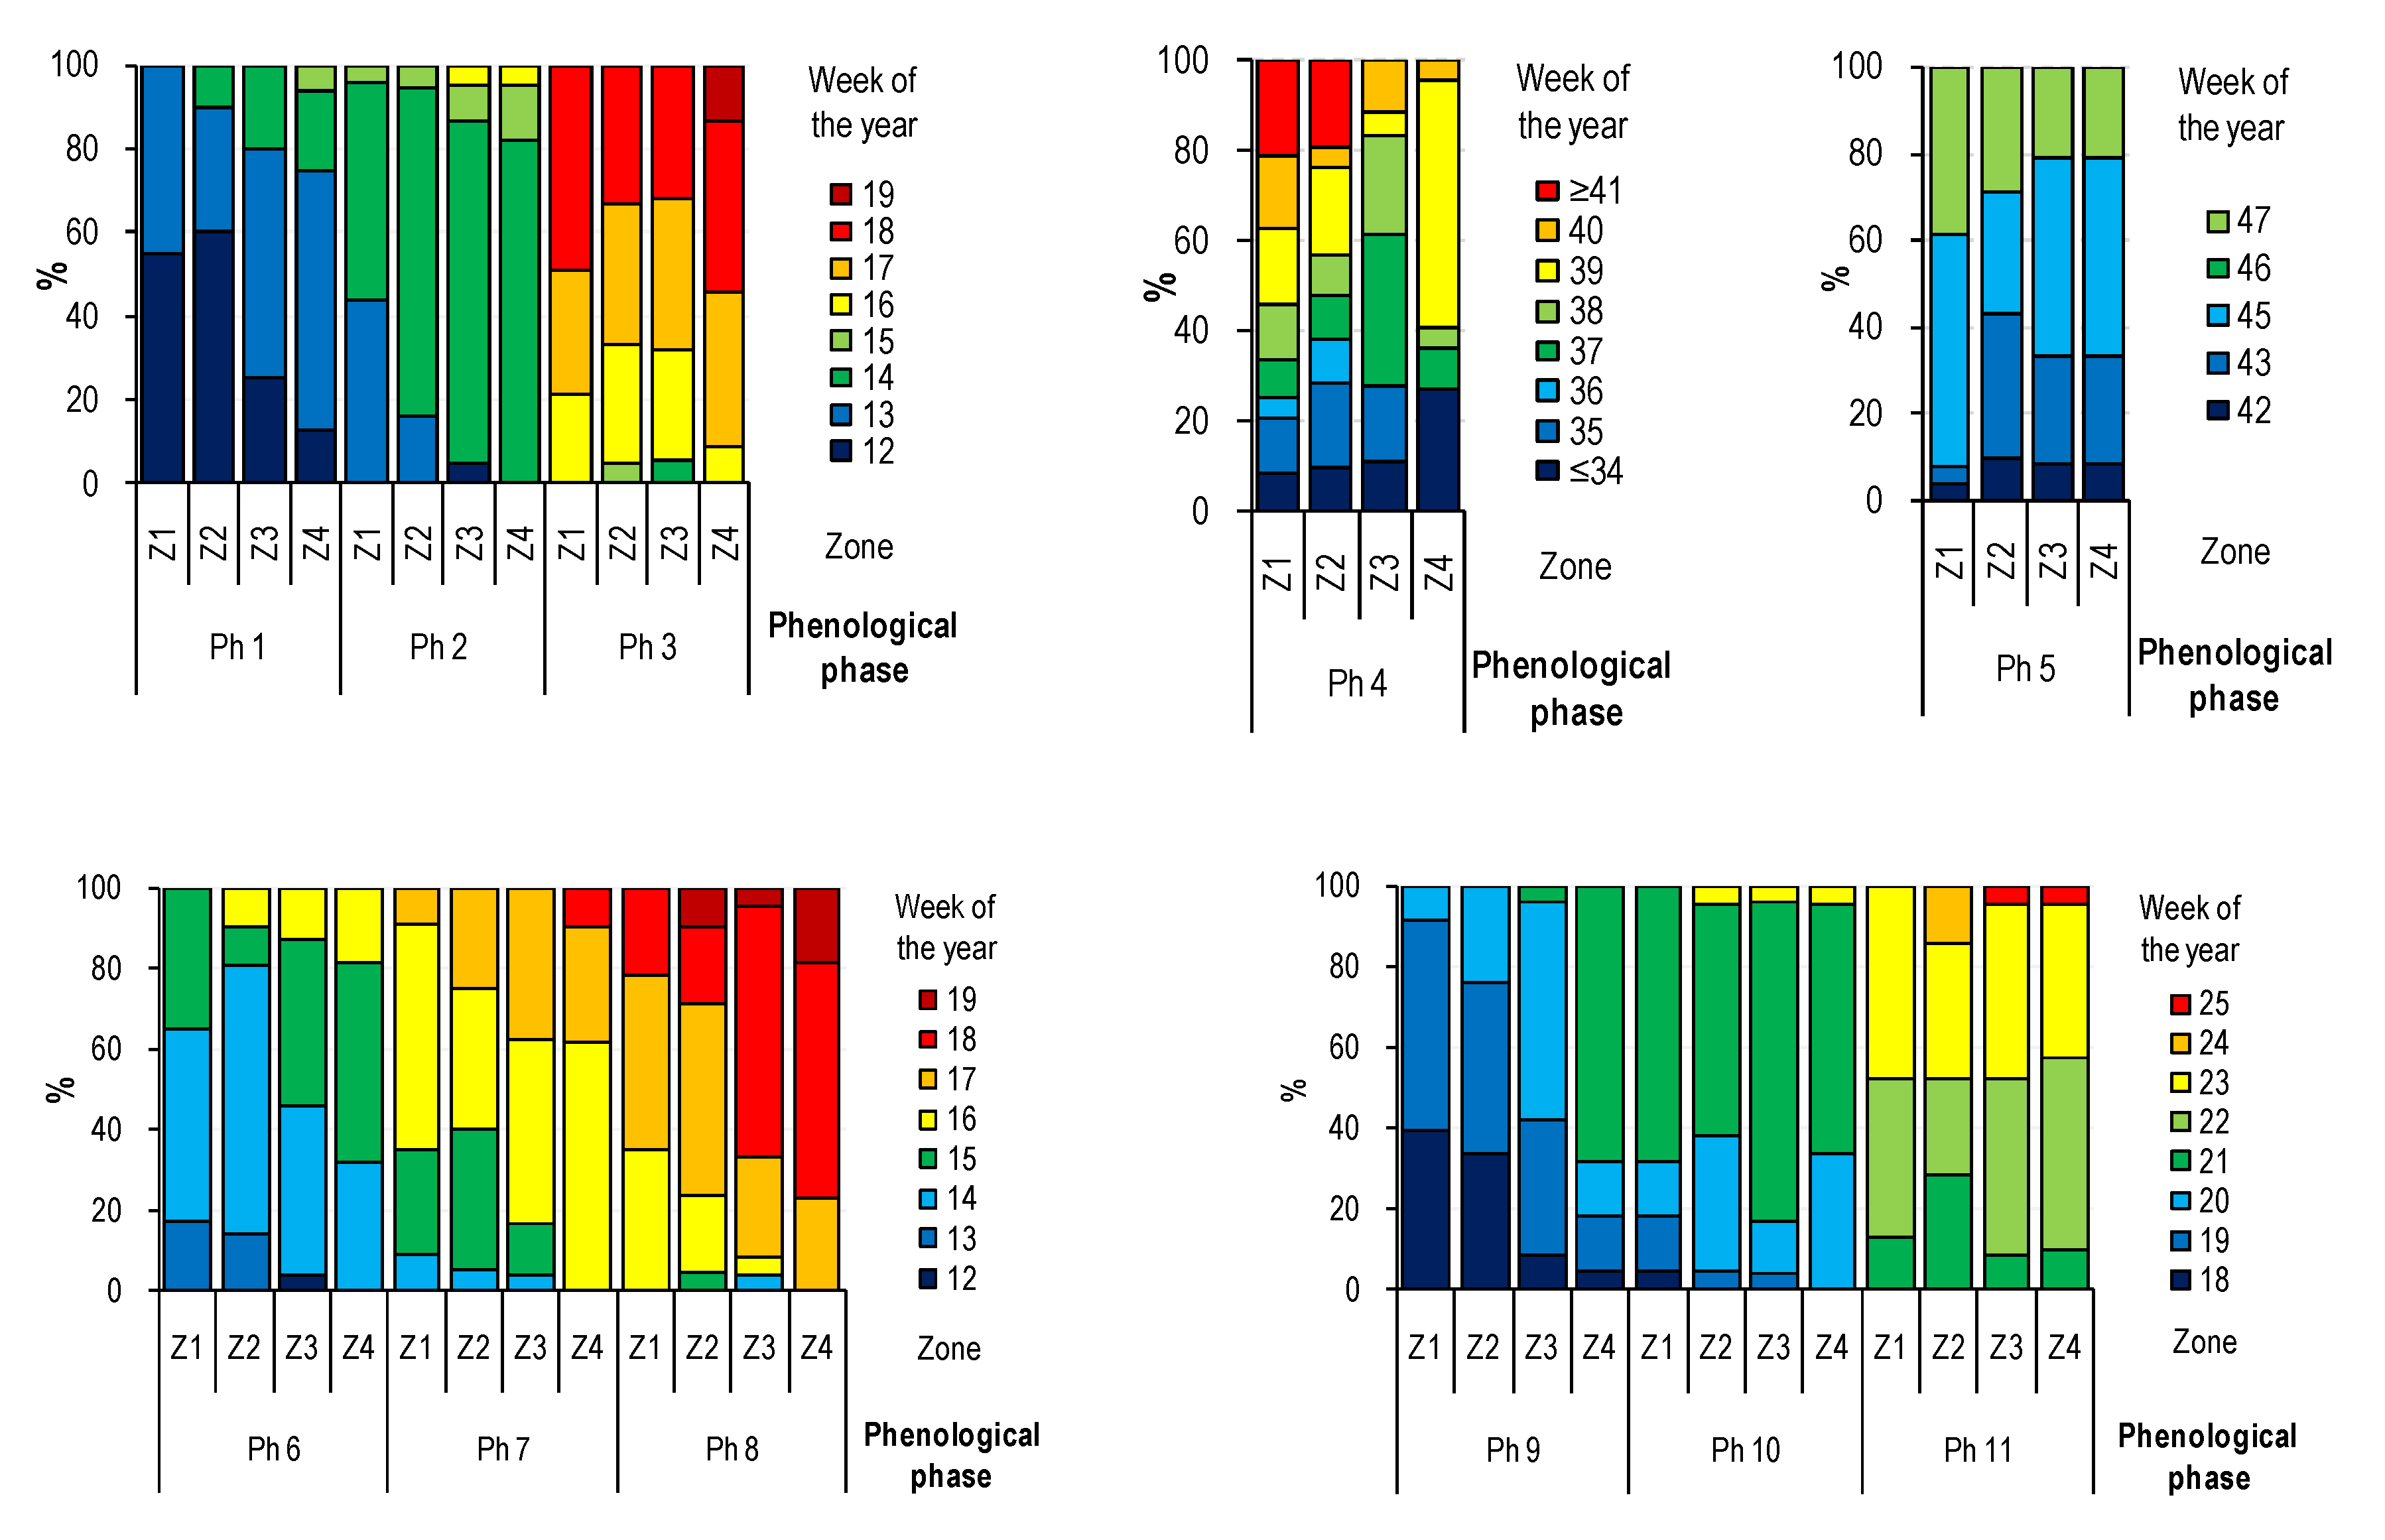
3.1. Influence of Distance from the Centre on Phenological Development
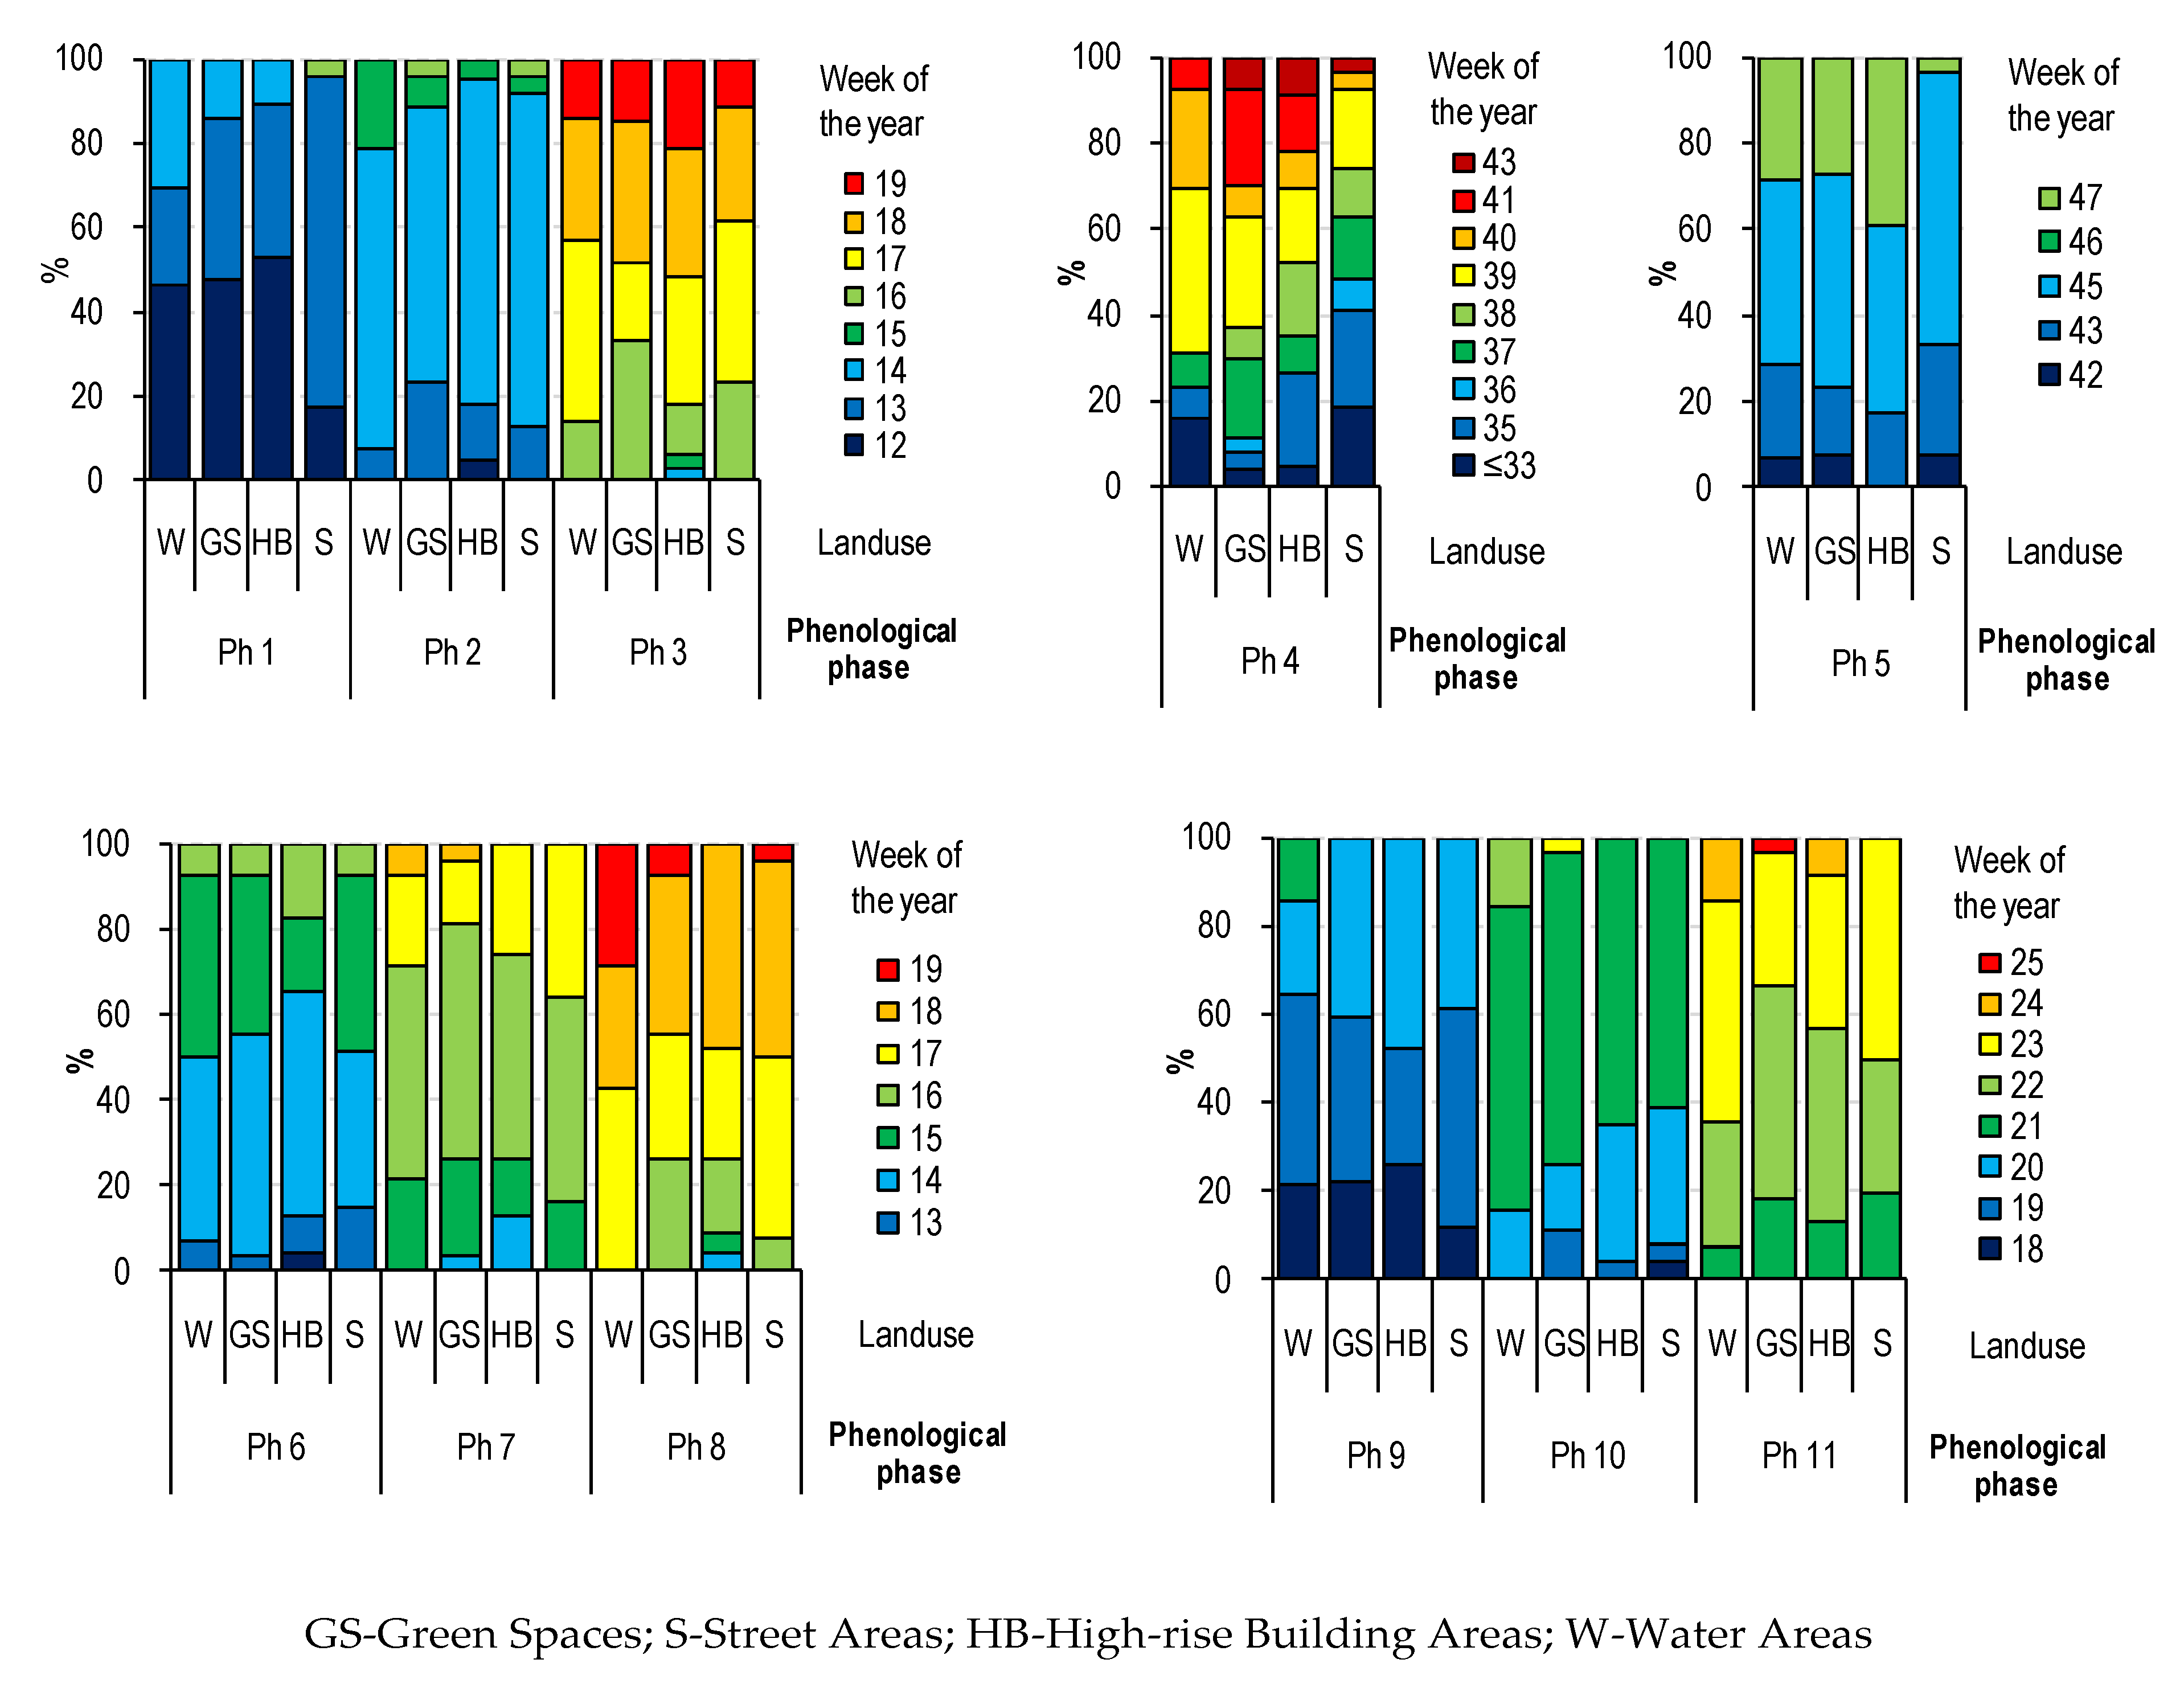
3.2. The Impact of Land Use on the Pace of Phenological Development
3.3. Form of Land Cover and Distance and Their Influence on Phenology
4. Discussion
5. Conclusions
- Patterns of the effects of distance and surroundings on the phenology of the horse chestnut have been documented mainly for the initial and final stages of foliage and initial stages of flowering.
- The surroundings and the distance from the city center affect the phenology of trees of the studied species in urbanized areas, which results in the delay and acceleration of individual phenological phases, however, due to the heterogeneous structure of urban areas and its geometry, research in this area is difficult and laborious.
- The results obtained on the basis of phenological observations carried out in 2017 in Wrocław confirmed the extension of the period of vegetation in the city center in relation to its peripheries.
- Trees growing in road lanes entered the vegetation period later and defoliated faster, which confirms the negative impact of street conditions on the development of trees in urban space. Thus, the growing season in road lanes is shorter and due to the 1-year observation period, it is justified to conduct further observations.
- The article may become the next step in improving the methodology of carrying out phenological observations in urban areas, taking into account its characteristic heterogeneous spatial structure.
- Research in this area should be continued, the results of several years of observation may enrich knowledge on the impact of local climate and urbanization on urban trees.
Supplementary Materials
Author Contributions
Funding
Conflicts of Interest
References
- Baker, L.A.; Brazel, A.J.; Selover, N.; Martin, C.; McIntyre, N.; Steiner, F.R.; Nelson, A.; Musacchio, L. Urbanization and warming of Phoenix (Arizona, USA): Impacts, feedbacks and mitigation. Urban Ecosyst. 2002, 6, 183–203. [Google Scholar] [CrossRef]
- Miles, L.; Grainger, A.; Phillips, O. The impact of global climate change on tropical forest biodiversity in Amazonia. Glob. Ecol. Biogeogr. 2004, 13, 553–565. [Google Scholar] [CrossRef]
- Visser, M.E.; Both, C. Shifts in phenology due to global climate change: The need for a yardstick. Proc. R. Soc. B 2005, 272, 2561–2569. [Google Scholar] [CrossRef] [PubMed]
- Luo, Z.; Sun, O.J.; Ge, Q.; Xu, W.; Zheng, J. Phenological responses of plants to climate change in an urban environment. Ecol. Res. 2007, 22, 507–514. [Google Scholar] [CrossRef]
- Körner, C.; Basler, D. Phenology under global warming. Science 2010, 327, 1461–1462. [Google Scholar] [CrossRef] [PubMed]
- Fu, Y.H.; Zhao, H.; Piao, S.; Peaucelle, M.; Peng, S.; Zhou, G.; Ciais, P.; Huang, M.; Menzel, A.; Penuelas, J.; et al. Declinig global Warming effects on the phenology on the phenology of spring leaf unfolding. Nature 2015, 526, 104–119. [Google Scholar] [CrossRef] [Green Version]
- Wang, J.; Yan, Z.W. Urbanization-related warming in local temperature records: A review. Atmos. Ocean. Sci. Lett. 2016, 9. [Google Scholar] [CrossRef] [Green Version]
- Zhou, D.; Zhao, S.; Zhang, L.; Liu, S. Remotely sensed assessment of urbanization effects on vegetation phenology in China’s 32 major cities. Remote Sens. Environ. 2016, 176, 272–281. [Google Scholar] [CrossRef] [Green Version]
- Li, X.; Zhou, Y.; Asrar, G.R.; Mao, J.; Li, X. Response of vegetation phenology to urbanization in the conterminous United States. Glob. Chang. Biol. 2017, 23, 2818–2830. [Google Scholar] [CrossRef]
- Villalobos-Jiménez, G.; Hassall, C. Effects of the urban heat island on the phenology of Odonata in London, UK. Int. J. Biometeorol. 2017, 61, 1337–1346. [Google Scholar] [CrossRef] [Green Version]
- Qiu, J.; Yang, X.; Cao, B.; Chen, Z.; Li, Y. Effects of Urbanization on Regional Extreme-Temperature Changes in China, 1960–2016. Sustainability 2020, 12, 6560. [Google Scholar] [CrossRef]
- Buyantuyev, A.; Wu, J. Urbanization diversifies land surface phenology in arid environments: Interactions among vegetation, climatic variation, and land use pattern in the Phoenix metropolitan region, USA. Landsc. Urban Plan. 2012, 105, 149–159. [Google Scholar] [CrossRef]
- Škvareninová, J.; Tuhárska, M.; Škvarenina, J.; Babálová, D.; Slobodníková, L.; Slobodník, B.; Středová, H.; Minďaš, J. Effects of light pollution on tree phenology in the urban environment. Morav. Geogr. Rep. 2017, 25, 282–290. [Google Scholar] [CrossRef] [Green Version]
- Ffrench-Constant, R.H.; Somers-Yeates, R.; Bennie, J.; Economou, T.; Hodgso, D.; Spalding, A.; McGregor, P.K. Light pollution is associated with earlier tree budburst across the United Kingdom. Proc. R. Soc. B Biol. Sci. 2016, 283, 20160813. [Google Scholar] [CrossRef] [PubMed]
- Ballester, J.; Rodó, X.; Giorgi, F. Future changes in Central Europe heat waves expected to mostly follow summer mean warming. Clim. Dynam. 2010, 35, 1191–1205. [Google Scholar] [CrossRef]
- Seto, K.C.; Fragkias, M.; Güneralp, B.; Reilly, M.K. A meta-analysis of global urban land expansion. PLoS ONE 2011, 6, e23777. [Google Scholar] [CrossRef]
- Klemm, W.; Heusinkveld, B.G.; Lenzholzer, S.; van Hove, B. Street greenery and its physical and psychological impact on thermal comfort. Landsc. Urban Plan. 2015, 138, 87–98. [Google Scholar] [CrossRef]
- McCarthy, M.P.; Best, M.J.; Betts, R.A. Climate change in cities due to global warming and urban effects. Geophys. Res. Lett. 2010, 37, L09705. [Google Scholar] [CrossRef] [Green Version]
- Oleson, K.W.; Bonan, G.B.; Feddema, J.; Jackson, T. An examination of urban heat island characteristics in a global climate model. Int. J. Climatol. 2010, 31, 1848–1865. [Google Scholar] [CrossRef] [Green Version]
- Santamouris, M. Cooling the cities—A review of reflective and green roof mitigation technologies to fight heat island and improve comfort in urban environments. Sol. Energy 2014, 103, 682–703. [Google Scholar] [CrossRef]
- Mimet, A.; Pellissier, V.; Quenol, H.; Aguejdad, R.; Dubreuil, V.; Roze, F. Urbanisation induces early flowering: Evidence from Platanusacerifolia and Prunuscerasus. Int. J. Biometeorol. 2009, 53, 287–298. [Google Scholar] [CrossRef] [PubMed]
- Richardson, A.D.; Keenan, T.F.; Migliavacca, M.; Ryu, Y.; Sonnentag, O.; Toomey, M. Climate change, phenology, and phenological control of vegetation feedbacks to the climate system. Agric. For. Meteorol. 2013, 169, 156–173. [Google Scholar] [CrossRef]
- Akbari, H.; Pomerantz, M.; Taha, H. Cool surfaces and shade trees to reduce energy use and improve air quality in urban areas. Sol. Energy 2001, 70, 295–310. [Google Scholar] [CrossRef]
- Cardelino, C.A.; Chameides, W.L. Natural hydrocarbons, urbanization, and urban ozone. J. Geophys. Res. Atmos. 1990, 95, 13971–13979. [Google Scholar] [CrossRef]
- Founda, D.; Pierros, F.; Petrakis, M.; Zerefos, C. Interdecadal variations and trends of the Urban Heat Island in Athens (Greece) and its response to heatwaves. Atmos. Res. 2015, 161, 1–13. [Google Scholar] [CrossRef]
- Wilby, R.L. Past and projected trends in London’s urban heat island. Weather 2003, 58, 251–260. [Google Scholar] [CrossRef]
- Zipper, S.C.; Schatz, J.; Singh, A.; Kucharik, C.J.; Townsend, P.A.; Loheide, S.P. Urban heat island impacts on plant phenology: Intra-urban variability and response to land cover. Environ. Res. Lett. 2016, 11, 054023. [Google Scholar] [CrossRef]
- Zhang, X.; Friedl, M.A.; Schaaf, C.B.; Strahler, A.; Hand Schneider, A. The footprint of urban climates on vegetation phenology. Geophys. Res. Lett. 2004, 31, L12209. [Google Scholar] [CrossRef]
- Jochner, S.C.; Sparks, T.H.; Estrella, N.; Menzel, A. The influence of altitude and urbanisation on trends and mean dates in phenology (1980–2009). Int. J. Biometeorol. 2012, 56, 387–394. [Google Scholar] [CrossRef]
- Jochner, S.; Alves-Eigenheer, M.; Menzela, A.; Morellato, L.P.C. Using phenology to assess urban heat islands in tropical and temperate regions. Int. J. Climatol. 2013, 33, 3141–3151. [Google Scholar] [CrossRef]
- Jochner, S.; Menzel, A. Urban phenological studies—Past, present, future. Environ. Pollut. 2015, 203, 250–261. [Google Scholar] [CrossRef] [PubMed]
- Cohen, B. Urbanization in developing countries: Current trends, future projections, and key challenges for sustainability. Technol. Soc. 2006, 28, 63–80. [Google Scholar] [CrossRef]
- Gazal, R.; White, M.A.; Gillies, R.; Rodemaker, E.; Sparrow, E.; Gordon, L. GLOBE students, teachers, and scientists demonstrate variable differences between urban and rural leaf phenology. Glob. Chang. Biol. 2008, 14, 1568–1580. [Google Scholar] [CrossRef]
- Li, D.; Stucky, B.J.; Deck, J.; Baiser, B.; Guralnick, R.P. The effect of urbanization on plant phenology depends on regional temperature. Nat. Ecol. Evol. 2019, 3, 1661–1667. [Google Scholar] [CrossRef]
- White, M.A.; Nemani, R.R.; Thornton, P.E.; Running, S.W. Satellite Evidence of Phenological Differences Between Urbanized and Rural Areas of the Eastern United States Deciduous Broadleaf Forest. Ecosystems 2002, 5, 260–273. [Google Scholar] [CrossRef]
- Neil, K.L.; Landrum, L.; Wu, J. Effects of urbanization on flowering phenology in the metropolitan Phoenix region of USA: Findings from herbarium records. J. Arid Environ. 2010, 74, 440–444. [Google Scholar] [CrossRef]
- Jeong, J.H.; Ho, C.H.; Linderholm, H.W.; Jeong, S.J.; Chen Dand Choi, Y.S. Impact of urban warming on earlier spring flowering in Korea. Int. J. Climatol. 2011, 31, 1488–1497. [Google Scholar] [CrossRef]
- Ding, H.; Xu, L.; Elmore, A.J.; Shi, Y. Vegetation Phenology Influenced by Rapid Urbanization of The Yangtze Delta Region. Remote Sens. 2020, 12, 1783. [Google Scholar] [CrossRef]
- Moser-Reischl, A.; Uhl, E.; Rötzer, T.; Biber, P.; van Con, T.; Thanh Tan, N.; Pretzsch, H. Effects of the urban heat island and climate change on the growth of Khaya senegalensis in Hanoi, Vietnam. For. Ecosyst. 2018, 5, 37. [Google Scholar] [CrossRef] [Green Version]
- Fotiou, C.; Damialis, A.; Krigas, N.; Halley, J.M.; Vokou, D. Parietaria judaica flowering phenology, pollen production, viability and atmospheric circulation, and expansive ability in the urban environment: Impacts of environmental factors. Int. Soc. Biometeorol. 2011, 55, 35–50. [Google Scholar] [CrossRef]
- Smoliak, B.V.; Snyder, P.K.; Twine, T.E.; Mykleby, P.M.; Hertel, W.F. Dense network observations of the Twin Cities canopylayer urban heat island. J. Appl. Meteorol. Climatol. 2015, 54, 1899–1917. [Google Scholar] [CrossRef]
- Elmore, A.J.; Guinn, S.M.; Minsley, B.J.; Richardson, A.D. Landscape controls on the timing of spring, autumn, and growing season length in mid-Atlantic forests. Glob. Chang. Biol. 2012, 18, 656–674. [Google Scholar] [CrossRef] [Green Version]
- Walker, J.J.; de Beurs, K.M.; Henebry, G.M. Land surface phenology along urban to rural gradients in the US Great Plains. Remote Sens. Environ. 2015, 165, 42–52. [Google Scholar] [CrossRef]
- Fisher, J.I.; Mustard, J.F.; Vadeboncoeur, M.A. Green leaf phenology at Landsat resolution: Scaling from the field to the satellite. Remote Sens. Environ. 2006, 100, 265–279. [Google Scholar] [CrossRef]
- Yang, L.; Niyogi, D.; Tewari, M.; Aliaga, D.; Chen, F.; Tian, F.; Ni, G. Contrasting impacts of urban forms on the future thermal environment: Example of Beijing metropolitan area. Environ. Res. Lett. 2016, 11, 034018. [Google Scholar] [CrossRef] [Green Version]
- Masiero, E.; Souza, L. Improving urban thermal profile with trees and water features. Urban Des. Plan. 2015, 169, 66–77. [Google Scholar] [CrossRef]
- Dubicki, A.; Dubicka, M.; Szymanowski, M. Klimat Wrocławia [In:] Środowisko Wrocławia. Informator o stanie środowiska Wrocławia. 2002, pp. 9–25. Available online: http://eko.org.pl/wroclaw/pdf/klimat.pdf (accessed on 26 April 2018).
- Kalbarczyk, R.; Kalbarczyk, E.; Ziemiańska, M.; Raszka, B. Assessment of air thermal conditions in the lowland part of South-Western Poland for agriculture development purposes. Atmosphere 2018, 9, 215. [Google Scholar] [CrossRef] [Green Version]
- Instytutu Meteorologii i Gospodarki Wodnej—Państwowego Instytutu Badawczego. Available online: https://danepubliczne.imgw.pl/apiinfo (accessed on 16 April 2019).
- Szymanowski, M.; Kryza, M. Local regression models for spatial interpolation of urban heat island—An example from Wrocław, SW Poland. Theor. Appl. Climatol. 2012, 108, 53–71. [Google Scholar] [CrossRef] [Green Version]
- Oleksyn, J.; Kloeppel, B.D.; Łukasiewicz, S.; Karolewski, P.; Reich, P.B. Ecophysiology of horse chestnut (Aesculus hippocastanum L.) in degraded and restored urban sites. Pol. J. Ecol. 2007, 55, 245–260. [Google Scholar]
- Czernecki, B.; Jabłońska, K. Reconstruction of late spring phenophases in Poland and their response to climate change, 1951–2014. Acta Agrobot. 2016, 65, 1671–1686. [Google Scholar] [CrossRef] [Green Version]
- Jochner, S.; Markevych, J.; Beck, I.; Traidl-Hoffmann, C.; Heinrich, J.; Menzel, A. The effects of short- and long-term air pollutants on plant phenology and leaf characteristics. Environ. Pollut. 2015, 206, 382–389. [Google Scholar] [CrossRef] [PubMed]
- Roberts, A.M.I.; Tansey, C.; Smithers, R.J.; Phillimore, A.B. Predicting a change in the order of spring phenology in temperate forests. Glob. Chang. Biol. 2015, 21, 2603–2611. [Google Scholar] [CrossRef] [PubMed]
- Wittich, K.P.; Liedtke, M. Shifts in plant phenology: A look at the sensitivity of seasonal phenophases to temperature in Germany. Int. J. Climatol. 2015, 35, 3991–4000. [Google Scholar] [CrossRef]
- Sparks, T.H.; Górska-Zajączkowska, M.; Wójtowicz, W.; Tryjanowski, P. Phenological changes and reduced seasonal synchrony in Western Poland. Int. J. Biometeorol. 2011, 55, 447–453. [Google Scholar] [CrossRef] [PubMed] [Green Version]
- Jochner, S.C.; Beck, I.; Behrendt, H.; Traidl-Hoffmann, C.; Menzel, A. Effects of extreme spring temperatures on urban phenology and pollen production: A case study in Munich and Ingolstadt. Inter Res. Sci. Publ. 2011, 49, 101–112. [Google Scholar] [CrossRef]
- Menzel, A.; Sparks, T.T.; Estrella, N.; Koch, E.; Aasa, A.; Ahas, R.; Alm-Kubler, K.; Bissolli, P.; Bratislavska, O.; Briede, A.; et al. European phenological response to climate change matches the Warming pattern. Glob. Chang. Biol. 2006, 12, 1969–1976. [Google Scholar] [CrossRef]
- Schleip, C.; Menzel, A.; Estrella, N.; Dose, V. The use of Bayesian analysis to detect recent changes in phenological events throughout the year. Agric. For. Meteorol. 2006, 141, 179–191. [Google Scholar] [CrossRef]
- Salleo, S.; Nardini, A.; Raimondo, F.; Lo Gullo, M.A.; Pace, F.; Giacomich, P. Effect of defoliation caused by the leaf miner Cameraria ohridella on wood production and efficiency in Aesculus hippocastanum growing in north-eastern Italy. Trees 2003, 17, 367–375. [Google Scholar] [CrossRef]
- Urban Atlas—Copernicus Land Monitoring Service. Available online: https://land.copernicus.eu/local/urban-atlas/urban-atlas-2006 (accessed on 12 April 2017).
- Finn, G.A.; Straszewski, A.E.; Peterson, V. A general growth stage key for describing trees and woody plants. Ann. App. Biol. 2007, 151, 127–131. [Google Scholar] [CrossRef]
- Babálová, D.; Škvareninová, J.; Fazekaš, J.; Vyskot, I. The dynamics of the phenological development of four woody species in south-west and central Slovakia. Sustainability 2018, 10, 1497. [Google Scholar] [CrossRef] [Green Version]
- Lukasová, V.; Bucha, T.; Škvareninová, J.; Škvarenina, J. Validation and Application of European Beech Phenological Metrics Derived from MODIS Data along an Altitudinal Gradient. Forests 2019, 10, 60. [Google Scholar] [CrossRef] [Green Version]
- Stratópoulos, L.M.F.; Zhang, C.; Duthweiler, S.; Häberle, K.H.; Rötzer, T.; Xu, C.; Pauleit, S. Tree species from two contrasting habitats for use in harsh urban environments respond differently to extreme drought. Int. J. Biometeorol. 2019, 63, 197–208. [Google Scholar] [CrossRef] [PubMed]
- Delgado, P.H.; Aranguren, M.; Reig, C.; Galvan, D.F.; Mesejo, C.; Fuentes, A.M.; Agusti, M. Phenological growth stages of mango (Mangifera indica L.) according to the BBCH scale. Sci. Hortic. 2011, 130, 536–540. [Google Scholar] [CrossRef]
- Cosmulescu, S.; Scrieciu, F. Development of vegetation stages in medlar genotypes (Mespilus germanica L.) coded and described according to the BBCH scale. Biharean Biol. 2019, 14, 116–119. [Google Scholar]
- Schmidlin, T. The Urban Heat-Island at Toledo. Ohio J. Sci. 1989, 89, 38–41. [Google Scholar]
- Wohlfahrt, G.; Tomelleri, E.; Hammerle, A. The urban imprint on plant phenology. Nat. Ecol. Evol. 2019, 3, 1668–1674. [Google Scholar] [CrossRef] [PubMed]
- Schatz, J.; Kucharik, C.J. Seasonality of the urban heat Island effect in Madison, Wisconsin. J. App. Meteorol. Climatol. 2014, 53, 2371–2386. [Google Scholar] [CrossRef]
- Yu, C.; Hien, W.N. Thermal benefits of city parks. Energy Build. 2006, 38, 105–120. [Google Scholar] [CrossRef]
- Feyisa, G.L.; Dons, K.; Meilby, H. Efficiency of parks in mitigating urban heat island effect: An example from Addis Ababa. Landsc. Urban Plan. 2014, 123, 87–95. [Google Scholar] [CrossRef]
- Yoon, T.K.; Park, C.W.; Lee, S.J.; Ko, S.; Kim, K.N.; Son, Y.; Lee, K.H.; Oh, S.; Lee, W.K.; Son, Y. Allometric equations for estimating the aboveground volume of five common urban street tree species in Daegu, Korea. Urban For. Urban Green. 2013, 12, 344–349. [Google Scholar] [CrossRef]
- Konarska, J.; Uddling, J.; Holmer, B.; Lutz, M.; Lindberg, F.; Pleijel, H.; Thorsson, S. Transpiration of urban trees and its cooling effect in a high latitude city. Int. J. Biometeorol. 2016, 60, 159–172. [Google Scholar] [CrossRef] [PubMed]
- Moser, A.; Rötzer, T.; Pauleit, S.; Pretzsch, H. Structure and ecosystem services of small-leaved lime (Tilia cordata mill.) and black locust (Robinia pseudoacacia L.) in urban environments. Urban For. Urban Green. 2015, 14, 1110–1121. [Google Scholar] [CrossRef]
- Rahman, M.A.; Moser, A.; Rötzer, T.; Pauleit, S. Microclimatic differences and their influence on transpirational cooling of Tilia cordata in two contrasting street canyons in Munich, Germany. Agric. For. Meteorol. 2017, 232, 443–456. [Google Scholar] [CrossRef]
- Bartens, J.; Day, S.D.; Harris, J.R.; Dove, J.E.; Wynn, T.M. Can urban tree roots improve infiltration through compacted subsoils for storm water management? J. Environ. 2008, 37, 2048–2057. [Google Scholar] [CrossRef] [Green Version]
- Rahman, M.A.; Stringer, P.; Ennos, A.R. Effect of pit design and soil composition on performance of Pyrus calleryana street trees in the establishment period. Arboric. Urban For. 2013, 39, 256–266. [Google Scholar]
- Sobolewski, R.; Chohura, P. Właściwości chemiczne gleb jako czynnik decydujący o stanie odżywienia drzew. Zeszyty Naukowe Uniwersytetu Przyrodniczego we Wrocławiu 2015, 614, 61–73. [Google Scholar]
- Łukasiewicz, S.; Oleksyn, J. Rekompensujący wpływ wolnej, nieutwardzonej powierzchni gleby wokół drzew, na ich rozwój w warunkach środowiska miejskiego, na przykładzie kasztanowca białego Aesculus hippocastanum L. Badania Fizjograficzne B 2008, 3, 155–165. [Google Scholar]
- Borowski, J.; Pstrągowska, M. Effect of street conditions, including saline aerosol, on growth of the Small-leaved limes. Rocznik Polskiego Towarzystwa Dendrologicznego 2010, 58, 15–24. [Google Scholar]
- Chen, Y.; Wang, X.; Jiang, B.; Yang, N.; Li, L. Pavement induced soil warming accelerates leaf budburst of ash trees. Urban For. Urban Green. 2016, 16, 36–42. [Google Scholar] [CrossRef]
- Shashua-Bar, L.; Tsiros, I.X.; Hoffman, M. Passive cooling design options to ameliorate thermal comfort in urban streets of a Mediterranean climate (Athens) under hot summer conditions. Build. Environ. 2012, 57, 110–119. [Google Scholar] [CrossRef]
- Taylor, G.; Tallis, M.J.; Giardina, C.P.; Percy, K.E.; Miglietta, F.; Gupta, P.S.; Scarascia-Mugnozza, G.E. Future atmospheric CO2 leads to delayed autumnal senescence. Glob. Chang. Biol. 2008, 14, 264–275. [Google Scholar] [CrossRef]


| Land Cover | Urban Atlas 2006 for Wrocław | Abbrev | (Zones) | Number of Objects | |||
|---|---|---|---|---|---|---|---|
| Distance from the City Centre (km) | |||||||
| Z1 | Z2 | Z3 | Z4 | ||||
| 0–1 | 1–2 | 2–5 | >5 | ||||
| Green Spaces | Green urban areas | GS | 8 | 6 | 6 | 7 | 27 |
| Street Areas | Other roads and associated land | S | 6 | 6 | 8 | 7 | 27 |
| High-rise Building Areas | Continuous Urban fabric (S.L. > 80%) Discontinuous Dense Urban Fabric (S.L.: 50–80%) | HB | 7 | 6 | 5 | 5 | 24 |
| Water Areas | Water | W | 3 | 3 | 5 | 3 | 14 |
| Total: | 24 | 21 | 24 | 22 | 92 | ||
| No. of Phenological Phase | BBCH Code | Phenological Phase | BBCH Code Description |
|---|---|---|---|
| Ph0 | BBCH 00 | Leaf buds closed | Buds closed and covered by scales |
| Ph1 | BBCH 07 | The beginning of the opening of leaf buds | Beginning of sprouting or bud breaking |
| Ph2 | BBCH 11 | The beginning of spreading the leaf blades | First leaves unfolded |
| Ph3 | BBCH 19 | Full foliation | Leaf expansion complete |
| Ph4 | BBCH 93 | The beginning of leaf fall | Beginning of leaf fall |
| Ph5 | BBCH 97 | The end of leaf fall | End of leaf fall |
| Ph6 | BBCH 511 * | The appearance of the inflorescence | Undeveloped inflorescences are noticeable |
| Ph7 | BBCH 512 * | The full appearance of the inflorescence | Fully developed inflorescences are noticeable |
| Ph8 | BBCH 62 | The beginning of flowering | 20% flowers open |
| Ph9 | BBCH 652 * | Full flowering | above 70% of flowers open |
| Ph10 | BBCH 671 * | The flowering finishing | 50% of petalas fallen or dry |
| Ph11 | BBCH 69 | The end of flowering | Fruit are visible |
| Ph12 | BBCH 79 | Full ripening of fruit | 80% of fruits have reached final size |
| Ph14/13 | BBCH 89 | The end of fruit ripening | fruits fully ripe |
| No. of Phenological Phase | BBCH Code | Zone | ||||
|---|---|---|---|---|---|---|
| Z1 | Z2 | Z3 | Z4 | |||
| Leaves ( ± SD) | ||||||
| Ph1 | BBCH 07 | J. days | 86 ± 3 | 87 ± 5 | 89 ± 5 | 91 ± 7 |
| week | 12.5 ± 0.5 | 12.5 ± 0.7 | 13.0 ± 0.7 | 13.5 ± 0.9 | ||
| Ph2 | BBCH 11 | j. days | 94 ± 5 | 95 ± 5 | 99 ± 6 | 100 ± 4 |
| week | 13.6 ± 0.6 | 13.9 ± 0.5 | 14.1 ± 0.7 | 14.2 ± 0.5 | ||
| Ph3 | BBCH 19 | J. days | 119 ± 5 | 119 ± 7 | 122 ± 9 | 124 ± 6 |
| week | 16.8 ± 0.7 | 16.6 ± 0.9 | 17.5 ± 1.3 | 17.6 ± 0.9 | ||
| Ph4 | BBCH 93 | J. days | 264 ± 24 | 261 ± 20 | 263 ± 28 | 262 ± 17 |
| week | 38.0 ± 3.4 | 37.7 ± 2.8 | 37.8 ± 3.8 | 38.0 ± 2.3 | ||
| Ph5 | BBCH 97 | J. days | 317 ± 9.8 | 311 ± 13 | 312 ± 12 | 311 ± 8 |
| week | 45.5 ± 1.4 | 44.6 ± 1.8 | 44.7 ± 1.8 | 44.6 ± 1.1 | ||
| Flowers and Fruits ( ± SD) | ||||||
| Ph6 | BBCH 511 | j. days | 99 ± 5 | 99 ± 6 | 102 ± 6 | 104 ± 5 |
| week | 14.2 ± 0.7 | 14.1 ± 0.8 | 14.6 ± 0.9 | 14.0 ± 0.7 | ||
| Ph7 | BBCH 512 | J. days | 109 ± 6 | 111 ± 7 | 113 ± 6 | 116 ± 5 |
| week | 15.7 ± 0.8 | 15.8 ± 0.9 | 16.2 ± 0.8 | 16.0 ± 0.7 | ||
| Ph8 | BBCH 62 | J. days | 119 ± 6 | 120 ± 7 | 124 ± 7 | 126 ± 4 |
| week | 16.9 ± 0.8 | 17.1 ± 1.0 | 17.5 ± 1.0 | 18.0±0.7 | ||
| Ph9 | BBCH 652 | J. days | 131 ± 4 | 133 ± 5 | 137 ± 5 | 138 ± 4 |
| week | 18.7 ± 0.6 | 18.9 ± 0.8 | 19.5 ± 0.7 | 19.0 ± 0.5 | ||
| Ph10 | BBCH 671 | J. days | 143 ± 4 | 144 ± 5 | 146 ± 5 | 145 ± 5 |
| week | 20.4 ± 0.9 | 20.7 ± 0.8 | 20.9 ± 0.7 | 20.0 ± 0.7 | ||
| Ph 11 | BBCH 69 | J. days | 157 ± 6 | 158 ± 10 | 157 ± 7 | 157 ± 7 |
| week | 22.3 ± 0.7 | 22.5±1.3 | 22.4 ± 0.9 | 22.0 ± 0.9 | ||
| Ph 12 | BBCH 79 | J. days | 193 ± 9 | 200±13 | 206 ± 17 | 205 ± 16 |
| week | 27.8 ± 1.3 | 28.7±1.8 | 29.7 ± 2.5 | 29.6 ± 2.5 | ||
| Ph 13 | BBCH 89 | J. days | 240 ± 22 | 241±18 | 244 ± 15 | 245 ± 9 |
| week | 35.0 ± 3.1 | 34.6±2.6 | 35.1 ± 2.4 | 35.4 ± 1.5 | ||
| Z1 | Ph1 | Ph2 | Ph3 | Ph4 | Ph5 | Z3 | Ph1 | Ph2 | Ph3 | Ph4 | Ph5 | ||
| Ph1 | - | - | - | - | Ph1 | - | - | - | - | ||||
| Ph2 | 1.1 | - | - | - | Ph2 | 1.1 | - | - | - | ||||
| Ph3 | 4.3 | 3.2 | - | - | Ph3 | 4.5 | 3.4 | - | - | ||||
| Ph4 | 25.5 | 24.4 | 21.2 | - | Ph4 | 24.8 | 23.7 | 20.3 | - | ||||
| Ph5 | 33.0 | 31.9 | 28.7 | 7.5 | Ph5 | 31.7 | 30.6 | 27.2 | 6.9 | ||||
| Z2 | Ph1 | Ph2 | Ph3 | Ph4 | Ph5 | Z4 | Ph1 | Ph2 | Ph3 | Ph4 | Ph5 | ||
| Ph1 | - | - | - | - | Ph1 | - | - | - | - | ||||
| Ph2 | 1.4 | - | - | - | Ph2 | 0.7 | - | - | - | ||||
| Ph3 | 4.1 | 2.7 | - | - | Ph3 | 4.1 | 3.4 | - | - | ||||
| Ph4 | 25.2 | 23.8 | 21.1 | - | Ph4 | 24.5 | 23.8 | 20.4 | - | ||||
| Ph5 | 32.1 | 30.7 | 28.0 | 8.9 | Ph5 | 31.1 | 30.4 | 27.0 | 6.6 |
| Leaves | |||||||||||
| Ph0 (BBCH 00) | Ph1 (BBCH 07) | Ph2 (BBCH 11) | Ph3 (BBCH 19) | Ph4 (BBCH 93) | Ph5 (BBCH 97) | ||||||
| Zone | t | Zone | t | Zone | t | Zone | t | Zone | t | Zone | t |
| Z1:Z2 | - | Z1:Z2 | - | Z1:Z2 | - | Z1:Z2 | - | Z1:Z2 | - | Z1:Z2 | - |
| Z2:Z3 | - | Z2:Z3 | −2.07 ** | Z2:Z3 | - | Z2:Z3 | - | Z2:Z3 | - | Z2:Z3 | - |
| Z3:Z4 | - | Z3:Z4 | - | Z3:Z4 | - | Z3:Z4 | - | Z3:Z4 | - | Z3:Z4 | - |
| Z1:Z3 | - | Z1:Z3 | −2.6 * | Z1:Z3 | −2.55 * | Z1:Z3 | −2.03 ** | Z1:Z3 | - | Z1:Z3 | 2.04 ** |
| Z1:Z4 | - | Z1:Z4 | −3.28 * | Z1:Z4 | −3.72 * | Z1:Z4 | −3.26 * | Z1:Z4 | - | Z1:Z4 | 2.6 *** |
| Z2:Z4 | - | Z2:Z4 | −2.78 * | Z2:Z4 | −2.13 ** | Z2:Z4 | −2.35 ** | Z2:Z4 | - | Z2:Z4 | - |
| Flowers | |||||||||||
| Ph6 (BBCH 511) | Ph7 (BBCH 512) | Ph8 (BBCH 62) | Ph9 (BBCH 652) | Ph10 (BBCH 671) | Ph11 (BCCH 69) | ||||||
| Zone | t | Zone | t | Zone | t | Zone | t | Zone | t | Zone | t |
| Z1:Z2 | - | Z1:Z2 | - | Z1:Z2 | - | Z1:Z2 | - | Z1:Z2 | - | Z1:Z2 | - |
| Z2:Z3 | - | Z2:Z3 | - | Z2:Z3 | - | Z2:Z3 | −2.87 * | Z2:Z3 | - | Z2:Z3 | - |
| Z3:Z4 | - | Z3:Z4 | - | Z3:Z4 | - | Z3:Z4 | - | Z3:Z4 | - | Z3:Z4 | - |
| Z1:Z3 | - | Z1:Z3 | −2.21 ** | Z1:Z3 | −2.62 * | Z1:Z3 | −4.26 * | Z1:Z3 | - | Z1:Z3 | - |
| Z1:Z4 | −3.24 * | Z1:Z4 | −3.73 * | Z1:Z4 | −5.14 * | Z1:Z4 | −6.17 * | Z1:Z4 | - | Z1:Z4 | - |
| Z2:Z4 | −3.14 * | Z2:Z4 | −2.76 *** | Z2:Z4 | −3.36 * | Z2:Z4 | −4.33 * | Z2:Z4 | - | Z2:Z4 | - |
| No. of Phenological Phase | BBCH Code | Zone | ||||
|---|---|---|---|---|---|---|
| Green Spaces | Street Areas | High-Rise Building Areas | Water Areas | |||
| Leaves ( ± SD) | ||||||
| Ph1 | BBCH 07 | j. days | 86 ± 5 | 89 ± 6 | 87 ± 5 | 89 ± 7 |
| week | 12.7 ± 0.7 | 13.0 ± 0.8 | 12.6 ± 0.7 | 12.8 ± 0.9 | ||
| Ph2 | BBCH 11 | J. days | 97 ± 5 | 97 ± 5 | 97 ± 5 | 100 ± 4 |
| week | 13.9 ± 0.7 | 14.0 ± 0.6 | 13.8 ± 0.6 | 14.1 ± 0.5 | ||
| Ph3 | BBCH 19 | J. days | 121 ± 8 | 121 ± 6 | 119 ± 8 | 122 ± 6 |
| week | 17.3 ± 1.1 | 17.3 ± 1.0 | 16.9 ± 1.4 | 17.4 ± 0.9 | ||
| Ph4 | BBCH 93 | J. days | 271 ± 17 | 251 ± 25 | 265 ± 22 | 265 ± 19 |
| week | 38.9 ± 2.3 | 36.1 ± 3.6 | 38.0 ± 3.1 | 38.0 ± 2.6 | ||
| Ph5 | BBCH 97 | J. days | 314 ± 11 | 309 ± 9 | 317 ± 10 | 312 ± 11 |
| week | 44.9 ± 1.6 | 44.3 ± 1.2 | 45.4 ± 1.5 | 44.9 ± 1.6 | ||
| Flowers and fruits ( ± SD) | ||||||
| Ph6 | BBCH 511 | j. days | 101 ± 4,5 | 101 ± 6 | 100 ± 7 | 101 ± 5 |
| week | 14.5 ± 0.7 | 14.5 ± 0.8 | 14.3 ± 1.0 | 14.5 ± 0.8 | ||
| Ph7 | BBCH 512 | J. days | 111 ± 6 | 114 ± 6 | 111 ± 7 | 113 ± 7 |
| week | 15.9 ± 0.7 | 16.2 ± 0123.7 | 15.9 ± 0.9 | 16.1 ± 0.9 | ||
| Ph8 | BBCH 62 | J. days | 121 ± 7 | 123 ± 5 | 120 ± 8 | 126 ± 6 |
| week | 17.3 ± 0.9 | 17.5 ± 0.7 | 17.1 ± 1.1 | 17.8 ± 0.9 | ||
| Ph9 | BBCH 652 | J. days | 135 ± 5 | 135 ± 5 | 135 ± 6 | 135 ± 7 |
| week | 19.2 ± 0.8 | 19.3 ± 0.7 | 19.2 ± 0.9 | 19.3 ± 0.9 | ||
| Ph10 | BBCH 671 | J. days | 145 ± 6 | 147 ± 5 | 144 ± 4 | 147 ± 7 |
| week | 20.7 ± 0.8 | 20.5 ± 0.8 | 20.6 ± 0.6 | 21.1 ± 0.9 | ||
| Ph 11 | BBCH 69 | j. days | 156 ± 7 | 157 ± 6 | 158 ± 8 | 161 ± 8 |
| week | 22.2 ± 0.9 | 22.3 ± 0.8 | 22.4 ± 1.0 | 22.8 ± 1.1 | ||
| Ph 12 | BBCH 79 | J. days | 198 ± 10 | 202 ± 15 | 200 ± 17 | 209 ± 17 |
| week | 28.4 ± 1.4 | 29.1 ± 2.2 | 28.8 ± 2.6 | 30.1 ± 2.5 | ||
| Ph 13 | BBCH 89 | j. days | 238 ± 19 | 245 ± 12 | 235 ± 18 | 257 ± 10 |
| week | 34.6 ± 2.6 | 35.4 ± 2.0 | 33.8 ± 2.7 | 37.1 ± 1.3 | ||
| Green Spaces | Ph1 | Ph2 | Ph3 | Ph4 | Ph5 | Street Areas | Ph1 | Ph2 | Ph3 | Ph4 | Ph5 | ||
| Ph1 | - | - | - | - | Ph1 | - | - | - | - | ||||
| Ph2 | 1.2 | - | - | - | Ph2 | 1.0 | - | - | - | ||||
| Ph3 | 4.6 | 3.4 | - | - | Ph3 | 4.3 | 3.3 | - | - | ||||
| Ph4 | 26.2 | 25.0 | 21.6 | - | Ph4 | 23.1 | 22.1 | 18.8 | - | ||||
| Ph5 | 32.2 | 31.0 | 27.6 | 6.0 | Ph5 | 31.1 | 30.3 | 27.0 | 8.2 | ||||
| High-rise Building Areas | Ph1 | Ph2 | Ph3 | Ph4 | Ph5 | Water Areas | Ph1 | Ph2 | Ph3 | Ph4 | Ph5 | ||
| Ph1 | - | - | - | - | Ph1 | - | - | - | - | ||||
| Ph2 | 1.2 | - | - | - | Ph2 | 1.3 | - | - | - | ||||
| Ph3 | 4.3 | 3.1 | - | - | Ph3 | 4.6 | 3.3 | - | - | ||||
| Ph4 | 25.4 | 24.2 | 21.1 | - | Ph4 | 25.2 | 23.9 | 20.6 | - | ||||
| Ph5 | 32.8 | 31.6 | 28.5 | 7.4 | Ph5 | 32.1 | 30.8 | 27.5 | 6.9 |
| No. of Phenological Phase | BBCH Code | Street Areas | Green Spaces | |||||||
| Z1 | Z2 | Z3 | Z4 | Z1 | Z2 | Z3 | Z4 | |||
| Ph1 | BBCH 07 | j. days | 89 ± 3 | 87 ± 4 | 89 ± 1 | 94 ± 10 | 85 ± 3 | 86 ± 4 | 90 ± 7 | 90 ± 5 |
| week | 12.8 ± 0.4 | 12.5 ± 0.6 | 13.0 ± 0.0 | 13.6 ± 1.3 | 12.3 ± 0.5 | 12.4 ± 0.5 | 13.0 ± 1.0 | 13.0 ± 0.7 | ||
| Ph2 | BBCH 11 | j. days | 95 ± 7 | 93 ± 5 | 98 ± 1 | 101 ± 6 | 93 ± 4 | 96 ± 4 | 100 ± 6 | 99 ± 3 |
| week | 13.8 ± 0.8 | 13.8 ± 0.5 | 14.0 ± 0.0 | 14.3 ± 0.8 | 13.4 ± 0.5 | 13.8 ± 0.4 | 14.5 ± 0.8 | 14.1 ± 0.4 | ||
| Ph3 | BBCH 19 | j. days | 120 ± 5 | 119 ± 6 | 123 ± 8 | 123 ± 6 | 117 ± 7 | 122 ± 8 | 124 ± 8 | 124 ± 7 |
| week | 17.0 ± 0.7 | 16.8 ± 0.8 | 17.5 ± 1.2 | 17.6 ± 1.0 | 16.6 ± 0.9 | 17.3 ± 1.0 | 17.8 ± 1.2 | 17.7 ± 1.1 | ||
| Ph4 | BBCH 93 | j. days | 250 ± 29 | 243 ± 12 | 251 ± 37 | 259 ± 16 | 273 ± 15 | 271 ± 21 | 275 ± 20 | 265 ± 17 |
| week | 36.0 ± 3.9 | 35.0 ± 1.9 | 36.1 ± 5.2 | 37.1 ± 2.3 | 39.1 ± 2.0 | 39.0 ± 2.8 | 39.5 ± 2.6 | 38.0 ± 2.4 | ||
| Ph5 | BBCH 97 | j. days | 310 ± 10 | 303 ± 13 | 311 ± 11 | 312 ± 6 | 323 ± 8 | 313 ± 16 | 309 ± 11 | 308 ± 11 |
| week | 44.5 ± 1.2 | 43.5 ± 1.9 | 44.5 ± 1.4 | 44.7 ± 0.8 | 46.3 ± 1.0 | 44.8 ± 2.0 | 44.2 ± 1.3 | 44.0 ± 1.2 | ||
| Ph6 | BBCH 511 | j. days | 97 ± 6 | 96 ± 6 | 104 ± 4 | 104 ± 5 | 100 ± 5 | 98 ± 1 | 103 ± 6 | 104 ± 4 |
| week | 14.0 ± 0.7 | 13.8 ± 0.8 | 14.9 ± 0.6 | 14.9 ± 0.7 | 14.4 ± 0.7 | 14.0 ± 0.0 | 14.7 ± 0.8 | 14.9 ± 0.7 | ||
| Ph7 | BBCH 512 | j. days | 110 ± 6 | 111 ± 3 | 116 ± 6 | 116 ± 4 | 108 ± 5 | 111 ± 8 | 113 ± 3 | 114 ± 6 |
| week | 15.8 ± 0.8 | 15.8 ± 0.4 | 16.5 ± 0.8 | 16.5 ± 0.5 | 15.5 ± 0.8 | 15.8 ± 1.0 | 16.2 ± 0.5 | 16.2 ± 0.7 | ||
| Ph8 | BBCH 62 | j. days | 121 ± 6 | 120 ± 5 | 124 ± 4 | 126 ± 4 | 115 ± 4 | 119 ± 7 | 126 ± 4 | 127±4 |
| week | 17.2 ± 0.8 | 17.0 ± 0.6 | 17.6 ± 0.5 | 17.9 ± 0.7 | 16.4 ± 0.5 | 17.0 ± 1.0 | 17.8 ± 0.5 | 18.0 ± 0.5 | ||
| Ph9 | BBCH 652 | j. days | 130 ± 3 | 132 ± 3 | 137 ± 4 | 138 ± 4 | 129 ± 3 | 133 ± 4 | 138 ± 4 | 139 ± 3 |
| week | 18.6 ± 0.6 | 18.8 ± 0.4 | 19.6 ± 0.5 | 19.7 ± 0.5 | 18.4 ± 0.5 | 19.0 ± 0.6 | 19.7 ± 0.5 | 19.9 ± 0.4 | ||
| Ph10 | BBCH 671 | j. days | 141 ± 9 | 140 ± 4 | 145 ± 3 | 145 ± 3 | 141 ± 6 | 144 ± 3 | 147 ± 1 | 148 ± 7 |
| week | 20.2 ± 1.3 | 20.2 ± 0.8 | 20.8 ± 0.5 | 20.7 ± 0.5 | 20.1 ± 1.0 | 20.7 ± 0.5 | 21.0 ± 0.0 | 21.1 ± 0.9 | ||
| Ph11 | BBCH 69 | j. days | 158 ± 6 | 156 ± 7 | 157 ± 5 | 157 ± 6 | 154 ± 6 | 154 ± 8 | 157 ± 4 | 159 ± 8 |
| week | 22.4 ± 0.9 | 22.2 ± 1.0 | 22.4 ± 0.7 | 22.3 ± 0.8 | 22 ± 0.8 | 21.8 ± 1.0 | 22.3 ± 0.5 | 22.7 ± 1.1 | ||
| No. of Phenological Phase | BBCH code | High-rise Building Areas | Water Areas | |||||||
| Z1 | Z2 | Z3 | Z4 | Z1 | Z2 | Z3 | Z4 | |||
| Ph1 | BBCH 07 | j. days | 86 ± 4 | 87 ± 6 | 86 ± 4 | 89 ± 6 | 83 ± 0 | 88 ± 9 | 92 ± 6 | 94 ± 5 |
| week | 12.4 ± 0.5 | 12.5 ± 0.8 | 12.5 ± 0.6 | 13.0 ± 0.8 | 12.0 ± 0 | 12.7 ± 1.2 | 13.2 ± 0.8 | 13.5 ± 0.7 | ||
| Ph2 | BBCH 11 | j. days | 95 ± 4 | 94 ± 5 | 95 ± 8 | 100 ± 3 | 96 ± 6 | 101 ± 4 | 101 ± 4 | 101 ± 4 |
| week | 13.7 ± 0.5 | 13.8 ± 0.6 | 13.5 ± 1.0 | 14.2 ± 0.4 | 13.7 ± 0.6 | 14.3 ± 0.6 | 14.2 ± 0.4 | 14.3 ± 0.6 | ||
| Ph3 | BBCH 19 | j. days | 118 ± 4 | 117 ± 8 | 118 ± 13 | 124 ± 4 | 122 ± 4 | 119 ± 8 | 124 ± 8 | 122 ± 4 |
| week | 16.7 ± 0.5 | 16.7 ± 1.0 | 16.8 ± 1.8 | 17.6 ± 0.5 | 17.3 ± 0.6 | 17.0 ± 1.0 | 17.8 ± 1.3 | 17.3 ± 0.6 | ||
| Ph4 | BBCH 93 | j. days | 260 ± 30 | 266 ± 20 | 276 ± 18 | 261 ± 17 | 280 ± 0 | 272 ± 0 | 255 ± 22 | 266 ± 24 |
| week | 37.4 ± 4.2 | 38.2 ± 2.7 | 39 ± 2.3 | 37.4 ± 2.2 | 40.0 ± 0.0 | 39.0 ± 0.0 | 36.8 ± 3.0 | 37.0 ± 3.5 | ||
| Ph5 | BBCH 97 | j. days | 316 ± 10 | 318 ± 11 | 319 ± 12 | 313 ± 9 | 319 ± 8 | 308 ± 14 | 309 ± 14 | 315 ± 3 |
| week | 45.3 ± 1.4 | 45.7 ± 1.6 | 45.8 ± 1.8 | 45.0 ± 1.4 | 46.3 ± 1.2 | 44.3 ± 2.3 | 44.4 ± 1.9 | 45.0 ± 0.0 | ||
| Ph6 | BBCH 511 | j. days | 99 ± 6 | 101 ± 9 | 95 ± 7 | 104 ± 8 | 96 ± 6 | 101 ± 3,5 | 105 ± 5 | 105 ± 5 |
| week | 14.3 ± 0.8 | 14.5 ± 1.2 | 13.6 ± 0.9 | 15.0 ± 1.0 | 13.7 ± 0.6 | 14.3 ± 0.6 | 15.0 ± 0.7 | 14.7 ± 0.6 | ||
| Ph7 | BBCH 512 | j. days | 111 ± 6 | 109 ± 9 | 106 ± 6 | 117 ± 5 | 107 ± 4 | 112 ± 8,0 | 115 ± 5 | 118 ± 7 |
| week | 15.9 ± 0.9 | 15.7 ± 1.2 | 15.4 ± 0.9 | 16.6 ± 0.5 | 15.3 ± 0.6 | 16.0 ± 1.0 | 16.4 ± 0.5 | 16.7 ± 1.2 | ||
| Ph8 | BBCH 62 | j. days | 120 ± 6 | 120 ± 9 | 117 ± 13 | 126 ± 3 | 122 ± 4 | 124 ± 6 | 127 ± 5 | 130 ± 7 |
| week | 17.0 ± 0.8 | 17.0 ± 1.2 | 16.6 ± 1.8 | 17.8 ± 0.4 | 17.3 ± 0.6 | 17.7 ± 1.2 | 18.0 ± 0.7 | 18.3 ± 1.2 | ||
| Ph9 | BBCH 652 | j. days | 134 ± 6 | 134 ± 8 | 137 ± 6 | 137 ± 5 | 131 ± 0 | 131 ± 7 | 136 ± 9 | 142 ± 7 |
| week | 19.0 ± 0.8 | 19.0 ± 1.1 | 19.4 ± 0.9 | 19.6 ± 0.5 | 19.0 ± 0.0 | 18.7 ± 1.2 | 19.4 ± 1.1 | 20.0 ± 1.0 | ||
| Ph10 | BBCH 671 | j. days | 145 ± 4 | 145 ± 3 | 142 ± 6 | 142 ± 4 | 145 ± 0 | 149 ± 12 | 150 ± 7 | 145 ± 4 |
| week | 20.7 ± 0.5 | 20.8 ± 0.4 | 20.4 ± 0.9 | 20.4 ± 0.5 | 21.0 ± 0.0 | 21.3 ± 1.5 | 21.4 ± 0.9 | 20.5 ± 0.7 | ||
| Ph11 | BBCH 69 | j. days | 157 ± 4 | 163 ± 11 | 154 ± 8 | 155 ± 7 | 162 ± 0 | 161 ± 16 | 162 ± 9 | 156 ± 4 |
| week | 22.4 ± 0.5 | 23.2 ± 1.4 | 22.0 ± 1.0 | 22.2 ± 0.9 | 23.0 ± 0.0 | 23.0 ± 2.0 | 23.0 ± 1.2 | 22.3 ± 0.6 | ||
Publisher’s Note: MDPI stays neutral with regard to jurisdictional claims in published maps and institutional affiliations. |
© 2020 by the authors. Licensee MDPI, Basel, Switzerland. This article is an open access article distributed under the terms and conditions of the Creative Commons Attribution (CC BY) license (http://creativecommons.org/licenses/by/4.0/).
Share and Cite
Orzechowska-Szajda, I.D.; Sobolewski, R.K.; Lewandowska, J.; Kowalska, P.; Kalbarczyk, R. The Influence of Urban Conditions on the Phenology of Aesculus hippocastanum L. Using the Example of Wroclaw (Poland). Forests 2020, 11, 1261. https://doi.org/10.3390/f11121261
Orzechowska-Szajda ID, Sobolewski RK, Lewandowska J, Kowalska P, Kalbarczyk R. The Influence of Urban Conditions on the Phenology of Aesculus hippocastanum L. Using the Example of Wroclaw (Poland). Forests. 2020; 11(12):1261. https://doi.org/10.3390/f11121261
Chicago/Turabian StyleOrzechowska-Szajda, Iwona Dominika, Robert Krzysztof Sobolewski, Joanna Lewandowska, Paulina Kowalska, and Robert Kalbarczyk. 2020. "The Influence of Urban Conditions on the Phenology of Aesculus hippocastanum L. Using the Example of Wroclaw (Poland)" Forests 11, no. 12: 1261. https://doi.org/10.3390/f11121261