Optimization of the Nutrient Management of Silage Maize Cropping Systems in The Netherlands: A Review


1
Wageningen Environmental Research, Droevendaalsesteeg 3, 6780 PB Wageningen, The Netherlands
2
Wageningen Livestock Research, De Elst 1, 6708 WD Wageningen, The Netherlands
3
Wageningen Plant Research, Droevendaalsesteeg 1, 6708 PB Wageningen, The Netherlands
*
Author to whom correspondence should be addressed.
Agronomy 2020, 10(12), 1861; https://doi.org/10.3390/agronomy10121861
Submission received: 11 September 2020
/
Revised: 17 November 2020
/
Accepted: 20 November 2020
/
Published: 26 November 2020
(This article belongs to the Special Issue Organic Fertilization in Maize Cropping Systems: Measures to Reduce N Losses)
Abstract
:Silage maize is, after grassland, the second largest crop in the Netherlands. The amounts of nutrients applied to silage maize have greatly decreased since the 1980s because of the implementation of a series of environmental policies. The aim of this review paper was to provide an overview of the nutrient management of and losses from silage maize cropping systems in the Netherlands during recent decades based on a literature review and a time series of nitrogen (N) and phosphorus (P) uses, yields, surpluses, and losses. The total N input as slurry to silage maize on sandy soils decreased from up to 500 kg N/ha in 1985 to approximately 180 kg N/ha in recent years. This decrease was due to the implementation of legislation with maximum permissible P application rates in the 1980s and 1990s, maximum permissible N and P losses in the 1997–2005 period, and of maximum permissible N and P application rates from 2006 onwards. Implementation of low ammonia (NH3) emission application techniques of manure in the early 1990s greatly reduced NH3 emission. The relative decrease of N losses from silage maize on sandy soils in the 1995–2018 period was 70% for nitrate (NO3) leaching, 97% for NH3 emissions, 65% for nitrogen oxide (NO) emissions, and 32% for nitrous oxide (N2O) emissions. The P surplus on the soil balance of silage maize decreased from approximately 150 kg P2O5/ha in the 1980s to less than 10 kg P2O5/ha in recent years, showing that P inputs and outputs are currently coming close to a zero balance in silage maize cropping systems. Although the emissions from silage maize cultivation have greatly decreased, further improvements in nutrient management are needed. The water quality standards have still not been met and there are new challenges related to the mitigation of emissions of ammonia and greenhouse gases.
Keywords:
ammonia; nitrate; nitrogen; nitrous oxide; nutrient management; phosphorus; statutory regulations1. Introduction
Silage maize is, after grassland, the second largest crop in the Netherlands. Between 1989 and 2019, the area of silage maize in the Netherlands was relatively stable (approximately 220,000 ha or 10% of the agricultural used area; source: Statistics Netherlands; www.cbs.nl). Silage maize is used as roughage for dairy cattle, and a large proportion of silage maize in the Netherlands is grown on dairy farming systems, both in rotations with grassland and as continuous cropping.
Maize was introduced in the Netherlands in the 1950s and was harvested as grain maize, but the cultivated area remained very small, and in 1960, there was almost no cultivation of maize in the Netherlands anymore [1,2]. The silage of maize was introduced in the 1950s in the USA and was considered an attractive method to conserve roughage for cattle [3]. The growing of silage maize in the Netherlands started in the early 1960s, and this coincided with an increase in livestock number. The number of cattle increased with a factor of 1.4 and that of pigs with a factor of 3.4 between 1960 and 1980, resulting in large-scale manure production (source: Statistics Netherlands; www.cbs.nl). Silage maize is a crop to which very large amounts of manure can be applied without negative effects on crop yield and quality [4]. Together with the good feed quality supplementary to grass, this is a main reason that the area of silage maize greatly increased in the 1970s and 1980s.
Up to 100 tons of cattle slurry per hectare per year was applied to silage maize in the 1980s [4], resulting in a huge input of nitrogen (N) and phosphorous (P) (approximately 500 kg N/ha and 180 kg P2O5/ha). The large nutrient surplus resulted in deterioration of the groundwater and surface water quality because of N and P leaching, and contributed to soil acidification and eutrophication of non-agricultural ecosystems because of the ammonia (NH3) emissions followed by N deposition. A series of governmental and environmental policies were implemented in the European Union (EU) from the early 1990s onwards, to decrease agricultural related nutrient emissions into the environment, including the EU National Emission Ceiling Directive, the EU Water Framework Directive, the EU Nitrates Directive, and the United Nations Economic Commission for Europe (UNECE) Convention on Long-Range Transboundary Air Pollution [5]. These environmental policies obliged EU member states to implement measures to decrease nutrient losses from agriculture. The measures that were taken in silage maize cropping systems in the Netherlands included maximum N and P application rates, low NH3 emission application of manure, growth of catch crops in autumn and winter, and closed periods in which it is forbidden to apply manure. All of these measures have greatly reduced the nutrient losses from agriculture and have improved environmental quality [6].
The aim of this review paper was to provide an overview of the nutrient management of silage maize cropping systems in the Netherlands over the last four decades based on a literature review and a time series of N and P uses, yields, surpluses, and losses. The effectivity of the different measures to decrease nutrient losses were analyzed and the future challenges of maize cultivation discussed.
2. Materials and Methods
A literature study was carried out on nutrient management policies and nutrient flows in silage maize cropping systems in the Netherlands. Papers published in scientific journals as well as reports of Dutch research institutes were used for the literature review. To analyze the nutrient use and losses in silage maize cropping systems and the effects of policies to mitigate these losses, time series of N and P uses, surpluses, and losses were constructed for silage maize cropping systems on sandy soils vulnerable to nitrate (NO3) leaching in the 1985–2018 period (Tables S1–S3). These sandy soils are found in the southern part of the Netherlands, a region with a high livestock density.
The slurry application rates were derived on the basis of expert judgement for the 1985–1998 period. It was assumed that, on average, 500 kg N/ha was applied as slurry in 1985 and that the N application rate decreased by approximately 20 kg N/ha/year to 280 kg N/ha in 1998. The application rates for the 1998–2018 period were derived from the Farm Accountancy Data Network (FADN) and a special monitoring network with farms having a derogation of using more manure than the manure application standard of 170 kg N/ha as part of the Nitrates Directive [7,8]. The P application rate of slurry was calculated from the N application rate and the N/P ratio of slurry [9,10]. It was assumed in these calculations that only cattle slurry was applied to the silage maize. In practice, pig slurry is also applied to silage maize. The P application rate was always below the legal maximum P application standard in the 1985–2018 period [11].
Additionally, N and P application rates as mineral fertilizers were derived from expert judgement for the 1985–1998 period. It was assumed that, on average, 55 kg N/ha and 50 kg P2O5/ha were applied as fertilizer in the 1985–1997 period. The application rates for the 1998–2018 period were derived from FADN and derogation monitoring in the Netherlands [7,8]. Atmospheric N deposition rates of the 1989–2018 period were derived from the results of network monitoring in which N deposition was measured [12].
In the 1980s and 1990s, most maize was grown as permanent crop in a continuous cropping system. Thereafter, part of the maize land in the Netherlands was grown in rotation with grassland. Based on expert judgement, it was estimated that, in 1985, no maize was grown in rotation with grassland and that, since 2000, on average, maize has been grown after the ploughing of grassland every five years (Table S1). The mineralization in the first year after ploughing the grass is dependent on the age and management of the grassland and ranges from less than 100 kg N/ha/year to more than 200 kg N/ha/year [13]. It is assumed that, on average, 150 kg N/ha is mineralized after the ploughing of grassland, which means that, on average, 30 kg N/ha/year is released from ploughed grassland if maize is grown every five years after grassland. It is assumed in the calculations that P mineralization from ploughed grassland is negligible.
The N and P surpluses were calculated using the N and P inputs as slurry, fertilizer, mineralization of ploughed grassland, and atmospheric deposition minus the N and P removed by the harvested crop. The N and P removed by the harvested crop in kilograms per hectare were calculated from the yields and the N and P contents of maize. The dry matter (DM) yields and N and P contents of maize were derived from Statistics Netherlands for the whole 1985–2018 period [14,15].
The nitrogen use efficiency (NUE) of silage maize (in %) was calculated as the N output by the harvested crop divided by the N input as slurry, mineral fertilizer, atmospheric deposition, and N mineralization of ploughed grassland. The phosphorus use efficiency (PUE) of silage maize (in %) was calculated as the P output by the harvested crop divided by the P input as slurry and mineral P fertilizer. Additionally, the apparent N recovery (ANR) of the applied fertilizer or manure N was calculated as the difference of the N uptake of a fertilized and an unfertilized control crop, expressed as a fraction of the N applied. Thus, the following calculations were carried out:
The N surplus was calculated as
where N surplus, N input and N output are expressed in kilograms of N per hectare.
N input (slurry + fertilizer + mineralization of ploughed grassland + atmospheric deposition) − N output (harvested crop),
The P surplus was calculated as
where P surplus, P input, and P output are expressed in kilograms of P2O5 per hectare.
P input (slurry + fertilizer) − P output (harvested crop),
The NUE was calculated as
where NUE is expressed as a percentage.
N output (harvested crop)/N input (slurry + fertilizer + mineralization of ploughed grassland + atmospheric deposition) × 100,
The PUE was calculated as
where PUE is expressed as a percentage.
P output (harvested crop)/P input (slurry + fertilizer) × 100,
The ANR was calculated as
where ANR is expressed as a percentage and N uptake and N fertilizer application are expressed in kilograms of N per hectare.
[(N uptake fertilized crop) − (N uptake unfertilized crop)]/(N fertilizer application) × 100,
The NH3 emissions were calculated from the slurry and fertilizer application rates, expressed in total ammoniacal N (TAN) for slurry and total N for mineral fertilizer, and NH3 emission factors. The TAN contents of slurry were derived from data presented in the fertilizer recommendations for grassland and forage crops [9,10]. The emission factors for NH3 were obtained from the National Emission Model Agriculture (NEMA), the model used to calculate the NH3 emissions from agriculture in the Netherlands [16,17]. The direct nitrous oxide emissions (N2O) were calculated from the slurry and fertilizer application rates expressed in N and N2O emission factors based on total N. The N contents of slurry were derived from the fertilizer recommendations for grassland [9,10], and the emission factors of N2O were obtained from the methodology that the Netherlands uses to calculate N2O emissions from agriculture [16,18]. The nitrogen oxide (NO) emissions were calculated from the slurry and fertilizer applications expressed in N and NO emission factors based on total N. The emission factor of NO was obtained from the EMEP/EEA air pollutant emission inventory guidebook [19] and is used to calculate NO emissions from agriculture in the Netherlands [16].
Nitrate leaching was calculated from the N surplus and leaching fractions, defined as the fraction of N surplus in the soil balance that leaches as NO3 from the root zone to groundwater [20]. The nitrate leaching fractions were derived from the data from farms at which water quality was monitored from 1991 to 2009 and was 0.83 for arable land on a sandy soil vulnerable for nitrate leaching, i.e., sandy soil with a groundwater level of well-drained sandy soils with an average highest groundwater level deeper than 0.80 m [20].
The N unaccounted for was calculated as the balance of the difference between the N surplus and the N losses as NH3, N2O, NO, and NO3. The gaseous N losses from the crop residues of silage maize were neglected in the calculations, because the amount of N in silage maize residues is very small (ca. 5 kg N/ha [21,22]). The N unaccounted for in the balance calculation consists of gaseous N loss as N2 (by denitrification) and N stored in soil organic matter, as there has been a slight increase in soil organic matter content in maize fields since 1985 [23,24].
3. Results
3.1. Nutrient Management Policies
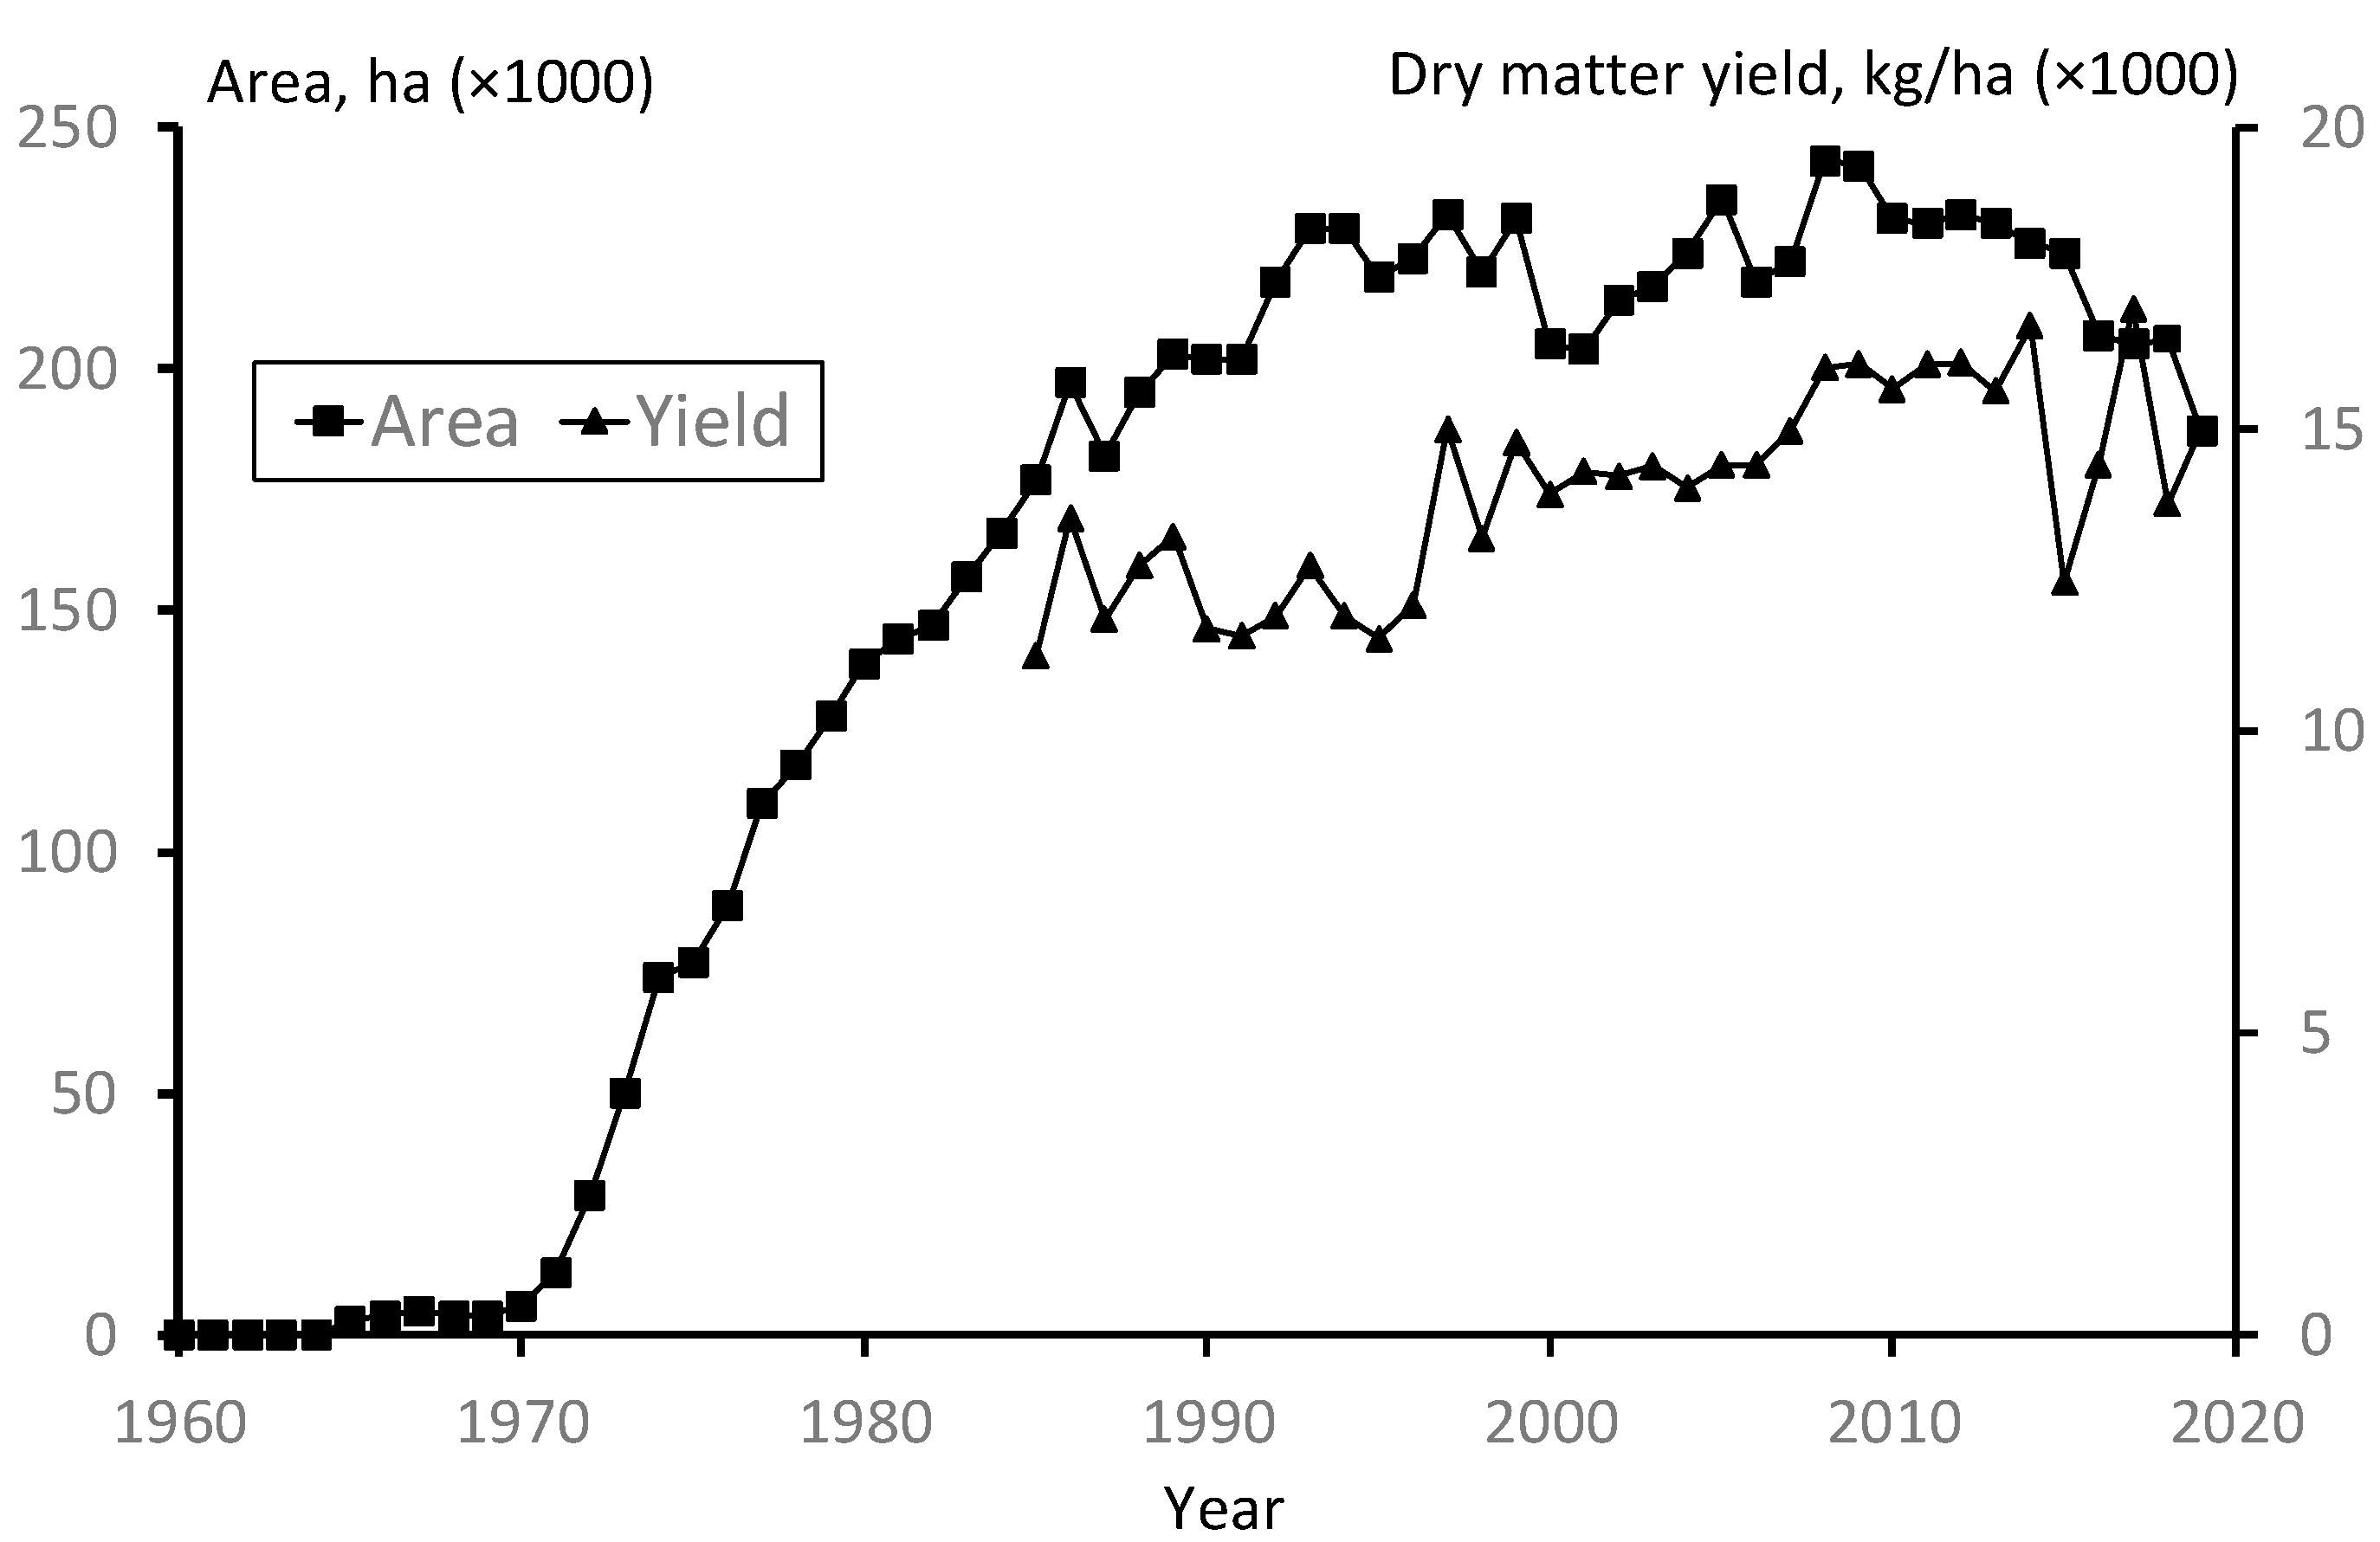
The growing of silage maize in the Netherlands started in the early 1960s, and the area increased greatly in the 1970s and 1980s (Figure 1). Silage maize replaced cereals in the crop rotation, mainly rye and oats, especially on sandy soils. Since 1989, the area of silage maize in the Netherlands has been relatively stable, approximately 220,000 ha or 10% of the agricultural area used. Table 1 summarizes the major nutrient management policies and measures to reduce N and P losses for silage maize in the Netherlands.
In the 1980s, it became clear that the overfertilization of agricultural land had a negative effect on the environmental quality. Maximum allowed P application rates (P application standards) were introduced in 1987 to decrease the excess of manure application to agricultural land. The P application standards for silage maize decreased gradually from 350 kg P2O5/ha/year in 1987 to 85 kg P2O5/ha/year in 2000. P mineral fertilizer was not included in these allowed P application rates.
A system based on the acceptable N and P surpluses of the input/output balance of a farm (the mineral accounting system (MINAS)) was in place during the 1998–2006 period [25]. This system was based on maximum allowable (levy-free) N and P loss standards (maximum allowed surpluses on N and P input–output balances, depending on the crop grown on a field) for crops. However, the European court of justice judged in 2003 that an action program for the Nitrates Directive should include N application standards that are based on a balance between the N demand of the crop and the N supply from mineral and organic fertilizers, as well as the mineralization of soil organic matter. A system based solely on N loss standards does not meet the criteria of the measures required for the EU Nitrates Directive.
Therefore, a new system was introduced in 2006 and replaced the MINAS system. Three standards for maximum application rates were introduced, i.e., a manure application standard (in kilograms of total N per hectare per year), a N application standard (in kilograms of plant-available N per hectare per year), and a P application standard (in kilograms of total P2O5 per hectare per year). The maximum allowable application rate of manure was set at 170 kg N/ha, which is the standard of the Nitrates Directive. Countries can apply more manure to agricultural soils if they can show that higher application rates than 170 kg N/ha do not lead to NO3 concentrations in groundwater higher than 50 mg/L (11.3 mg NO3–N/L). The Netherlands obtained a derogation for the application of 250 kg of cattle manure N per hectare for dairy farms with more than 70% grassland (from 2014: 80%) in 2006. This derogation was based on the results of a study showing that nitrate leaching from grassland is relatively low and water quality standards can be met at more than 70% grassland [26]. As silage maize is grown to a large extent, on dairy farms the maximum manure application rate to silage maize is 250 kg N/ha (the application rate was lowered to 230 kg N/ha in the sandy region in the south of the Netherlands from 2014).
The N application standards vary between types of crop and are based on plant-available N. The N in mineral fertilizer is defined as 100% plant-available. For organic fertilizers so-called N fertilizer replacement values are used to calculate plant-available N. The N fertilizer replacement value is the fraction of manure N that has the same effect on yield as mineral N fertilizer [27]. The N fertilizer replacement values that have to be used for silage maize on arable farms are 60% for cattle slurry and 60% (clay and peat soil) and 80% (sand and loess soil) for pig slurry. For dairy farms, where most silage maize is grown, a legal farm-level N fertilizer replacement value of 45% can be used for farms with grazing livestock and 60% for farms without grazing.
The P application standard for arable land is dependent on the P status of the soil. The P status of arable soil is currently determined by water extraction (Pw value) and, from 2021, will include an indicator based on the combination of 0.01 M CaCl2 extractable P and ammonium lactate extractable P [28,29,30,31]. The P application standard for arable land ranges from 40 kg P2O5/ha for a high soil P status (Pw > 55 mg P2O5/L soil) to 80 kg P2O5/ha for a low P status (Pw < 36 mg P2O5/L soil). Dairy farms with a derogation have not been allowed to use mineral P fertilizers since 2014, so dairy cattle slurry is generally the only P source for silage maize on these farms.
In the early 1990s, a policy was introduced to decrease NH3 emissions from agriculture. Livestock manure had to be applied with a method that reduces NH3 emissions, and the application of slurry to arable land changed from surface application (100% of applied slurry in 1990) to injection to a 5–10 cm depth into the soil (39% of the applied slurry in 1995) or surface application followed by direct incorporation into the soil (61% of the applied slurry in 1995) [16]. Since 2008, all slurry has been applied to arable land by deep injection to about 10 cm depth (about 80%) or shallow injection to a 5 cm depth with an open slot (approximately 20%) [16].
Other rules to decrease nutrient emissions from silage maize include a closed period for slurry application and the growth of catch crops after harvest (Table 1). Both measures are part of the action program in the Netherlands to comply with the Nitrates Directive.
As part of the legislation on nutrients, livestock farms have to keep a record of the manure production and export from the farm. All manure transports in the Netherlands are followed by Global Positioning System, and are sampled and analyzed for N and P. The data of 201,087 sampled cattle slurry transports in 2011–2013 showed an average N content of 4.0 ± 0.7 g N/kg; the average P content was 1.5 ± 0.4 g P2O5/kg [32]. Meanwhile, the data of 118,616 sampled pig slurry transports in 2011–2013 showed an average N content of 7.0 ± 1.9 g N/kg; the average P content was 3.9 ± 1.5 g P2O5/kg [32].
3.2. Literature Review on the Nutrient Flows in Silage Maize Cropping Systems
3.2.1. Yields and Nutrient Uptake
The DM yields of silage maize have increased over time (Figure 1). Experiments with different silage maize cultivars in the 1950s showed DM yields ranging from 12.4 to 14.3 ton/ha [1]. In the 1980s, an annual increase in DM yields of 1% occurred, which was attributed both to more productive cultivars and to more efficient crop cultivation methods [2]. The average DM yield of silage maize increased from approximately 11–12 ton/ha in the 1980s and early 1990s to more than 15 ton/ha since approximately 2005 (Figure 1). The silage maize yield increased annually by 0.9% on sandy soils and 0.6% on clay soil in the 2000–2015 period [24]. During recent years, wet (2016) and dry (2018) periods in the growing period resulted in relatively low maize yields. The agronomic traits of silage maize, such as whole plant yield, earliness, and stalk standability, were greatly improved by breeding [33]. The increase in silage maize yield during the last 25 years can be primarily attributed to genetic trends [34].
The N content of silage maize decreased significantly from more than 13 g N/kg DM in the 1980s and 1990s to 12–13 g N/kg DM in the 2000–2012 period and 10–11 g/kg DM in the post-2012 period [14,15]. The P content decreased from approximately 2.5 g P/kg DM at the end of the 1980s to approximately 2.0 g P/kg DM in recent years [14,15]. This decrease in N and P contents is probably related to the smaller manure and fertilizer application rates because of the nutrient management policies, as well as to the increase in crop yield, by which N and P in the crop are diluted [22].
There is no clear trend in the calculated N and P uptake by silage maize in the 1985–2018 period, based on the data of Statistics Netherlands (Table S3). The N uptake was, on average, 173 kg N/ha in this period, ranging from 140 to 198 kg N/ha. The P uptake was, on average, 67 kg P2O5/ha, ranging from 46 to 78 kg P2O5/ha. Lastly, the amount of crop residues of silage maize was small, 650 kg DM/ha or 5 kg N/ha [21].
3.2.2. Recovery of Applied N
Silage maize grown in the Netherlands has a short N uptake period, from approximately early June to late August, and the ANR of applied fertilizer or manure N is relatively low. Experiments in the 1970s and 1980s showed ANR values of 30–65% for mineral fertilizers applied at 100–150 kg N/ha, with lower ANR at higher application rates [35]. The ANR was 61–71% for calcium ammonium nitrate (CAN) and 53–65% for cattle slurry at 110–150 kg N/ha in experiments in early 2000 [36]. In another study, the ANR at 150 kg N/ha was 44% for CAN, 42% for pig slurry, 48% for cattle slurry, 31% for the solid fraction of separated slurry, and 18% for farmyard manure; [37]. The ANR increased when the N uptake of a cover crop that was grown after maize was included in the ANR calculation: 54% for CAN, 52% for pig slurry, 51% for cattle slurry, 26% for the solid fraction of separated slurry, and 21% for farmyard manure [37].
The average ANR of 14 experiments with silage maize at an application rate of approximately 120 kg of slurry N/ha was 36% for the injection of slurry in rows close to the anticipated position of the maize roots (row injection of slurry) and 24% for even injection of slurry N without consideration of the position of the roots [38]. In 1991–1994, nine experiments were carried out on the effect of banding mineral N fertilizer at N rates ranging from 30 to 200 kg N/ha on N utilization. Banding increased ANR at all rates, but the effects were largest at the lower N rates. For a fertilizer N rate of 120 kg N/ha, the average ANR increased from 53% for broadcast-applied N to 74% for banded N. From these results, it could be concluded that the N rate can be decreased by 20–30% to achieve the same yield as with broadcast-applied N [39].
Results of a two-year field experiment with silage maize on sandy soil showed that the N fertilizer replacement values of manures are related to the ratio of ammonium-to-total N of manure [37]. The N fertilizer replacement values deduced from the N yield response were 78% for the concentrated liquid fraction of separated pig slurry, 82% for pig slurry, 79% for cattle slurry, 56% for the solid fraction of separated pig slurry, and 34% for the farmyard manure of cattle.
The results of experiments in the 1970s showed that the addition of the nitrification inhibitor dicyandiamide (DCD) to autumn-applied slurry reduced NO3 leaching and increased the N yield of maize in all years [40]. Averaged over the 1984–1989 period, the ANR of autumn-applied slurry without DCD, autumn-applied slurry with DCD, spring-applied slurry without DCD, and spring-applied slurry with DCD were 20%, 27%, 29%, and 33%, respectively. Autumn application of slurry is not allowed anymore in the Netherlands since 1995 (Table 1).
The ANR values presented above are based on experiments across one year. However, the ANR of applied cattle slurry increases when it is calculated over several years, accounting for the long-term mineralization of applied organic N [41]. The recovery of slurry N was shown to increase from less than 20% in the first year of application to more than 60% after four years, at a slurry application rate of approximately 100 kg N/ha/year [41].
To sum up, the results of experiments in the Netherlands show an ANR of slurry applied to silage maize ranging from 24–65% and that of mineral fertilizer from 44–74% at application rates of 100–150 kg N/ha.
3.2.3. Nitrate Leaching
Calculations have shown that the extremely high N inputs in the 1980s (up to 500 kg N/ha) caused large NO3 leaching losses from silage maize on sandy soils up of several hundreds of kilograms per hectare per year [4]. However, the current nitrate leaching losses from silage maize are much smaller, mainly because of the N application standards of both organic and mineral fertilizers [42]. Despite this, NO3 concentrations in the groundwater in sandy soils cropped with silage maize still frequently exceed the standard of 50 mg NO3/L of the Nitrates Directive. The results of the national monitoring program of water quality in agricultural regions showed an average nitrate concentration in the upper part of the groundwater of 37 mg NO3/L for grassland (n = 10,354) and 95 mg NO3/L for maize land (n = 3219) in the 2009–2015 period [43].
The mineral N that is present in the soil in autumn after harvesting the crop contributes to NO3 leaching in the subsequent winter. A statistical analysis of the results of 20 grassland and 78 maize experiments showed that the N application rate, above which the crop does not take up all N that that is available in the soil, is 39 kg N/ha for maize and 243 kg N/ha for grassland [44]. This indicates that the risk of NO3 leaching from maize land increases already at low N application rates (<50 kg N/ha). In addition, these results show that late-season N mineralization, e.g., because of the use of manure or the mineralization of ploughed grassland, also increases the risk of NO3 leaching from silage maize [44].
Denitrification, i.e., the microbial degradation of nitrate to gaseous N2 and N2O under anaerobic conditions, is an important process that affects the amount of NO3 prone to leaching The denitrification potential in agricultural soils is an indicator of the availability of organic matter as an energy source for denitrifying bacteria. The denitrification potential in the upper 40 cm of the soil is higher in grassland than in the arable land used for silage maize (Table 2). The difference in denitrification potential between grassland and arable land cropped with silage maize is due to the difference in available C content. In grasslands, organic matter accumulates during aging and easily available C in root exudates are present in the rooting zone.
Fraters et al. established an empirical model to calculate NO3 leaching from agricultural soils [20]. The NO3 leaching fraction, defined as the fraction of the N surplus in the soil balance that leaches from the root zone to groundwater, is a key parameter in this model. Nitrate leaching fractions were derived from data from farms that were monitored in the 1991–2009 period, and the results showed that the calculated N surplus leached almost completely from the root zone of arable land (including silage maize) on well-drained sandy soils (the 95% confidence interval of nitrate leaching fraction was 0.80–0.99). For grassland, only a maximum of half of the N surplus leached from the root zone in these soils (0.39–0.49). These results point to higher NO3 leaching and lower denitrification losses from arable land than from grassland.
In the experiments of the 1980s, the addition of the nitrification inhibitor DCD to autumn-applied slurry reduced NO3 leaching and increased the N yield of maize in all years [40]. Nitrate leaching was lower for spring application than for autumn application of slurry, although the nitrate concentration in the groundwater after spring application still exceeded 50 mg N/L.
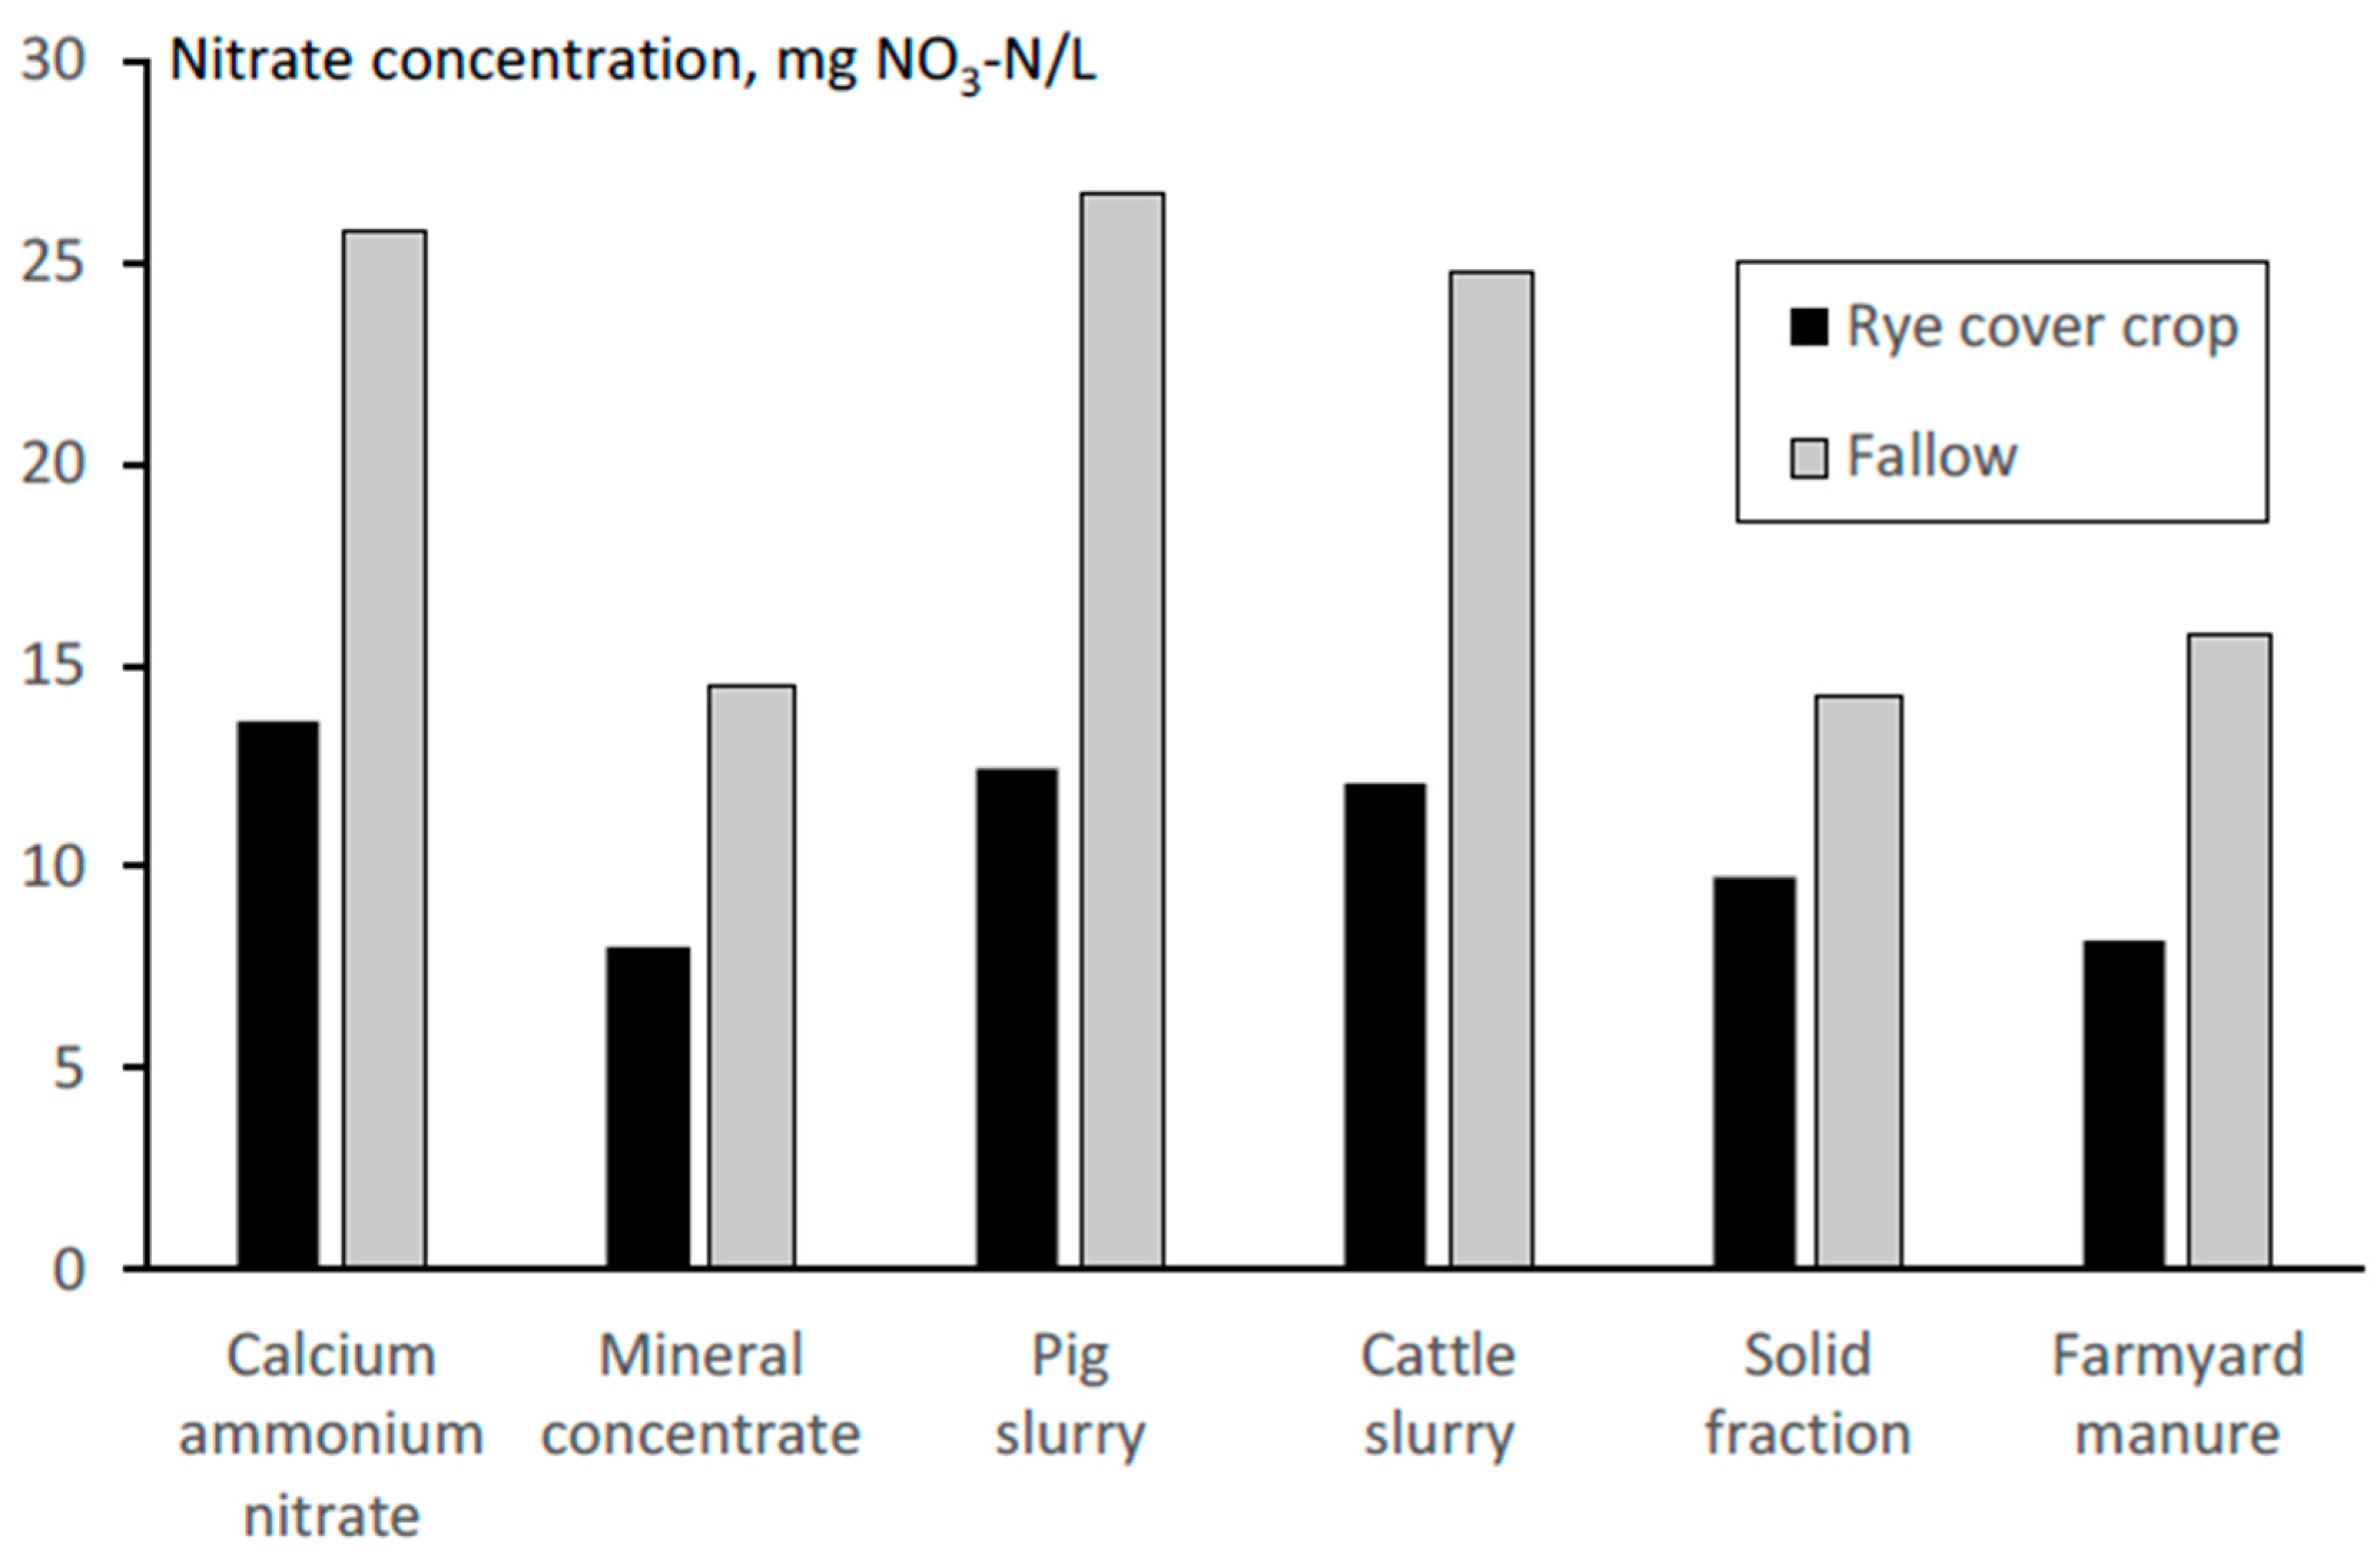
A rye cover crop greatly reduced the NO3 concentrations in the upper groundwater of a sandy soil cropped with silage maize (Figure 2). Nitrate leaching was higher after the application of untreated pig and cattle slurries than after the application of the concentrated liquid fraction of separated pig slurry (=mineral concentrate), the solid fraction of separated pig slurry, and farmyard manure from cattle (Figure 2).
After the ploughing of grassland, N mineralization greatly increases and the supply of mineral N for the preceding crop is high [45]. Because of the short N uptake period (June–August), the capacity of silage maize is often too low to take up all of the N that is released from ploughed grassland [46]. Therefore, the growth of silage maize after the ploughing of grassland increases the risk of nitrate leaching [46].

Table 2.
Potential denitrification 1 (mg N/kg dry soil/day) in grassland and arable land cropped with silage maize in different soil layers of sandy and loess soils in the Netherlands [47]. The denitrification potential is the denitrification measured under anoxic conditions at 20 °C with an excess of nitrate.
| Soil Layer | Grassland | Silage Maize | ||
|---|---|---|---|---|
| Loess (n = 2) | Sand (n = 3) | Loess (n = 2) | Sand (n = 3) | |
| 0–20 cm | 65 | 26 | 20 | 11 |
| 20–40 cm | 30 | 4.0 | 9.0 | 4.0 |
| 40–60 cm | 1.0 | 0.1 | 1.0 | 0.1 |
| 60–80 cm | 0.3 | 0.5 | 0.3 | 0 |
| 80–100 cm | 0.2 | 0.2 | 0.1 | 0 |
3.2.4. Ammonia Emissions
The ammonia emission factors for slurry and fertilizer applied to silage maize used in the Netherlands were derived from measurements on arable land [48]. The average emission factor of the applied TAN is 69% for surface spreading, 46% for incorporation within a few hours, 24% for shallow injection, 22% for direct incorporation after slurry application, and 2% for deep injection [16,49]. For mineral N fertilizers, the average emission factor for both grassland and arable land is 2.9–4.1%, depending on the type of N fertilizers that are used in a specific year. These emission factors are used in the methodology for estimating gaseous emissions from agriculture in the Netherlands, which is reported to the EU and UNECE [16,17]. The application of slurries with low ammonia emissions greatly reduces N losses, by which the crop N uptake and ANR of the applied slurry increase [50].
3.2.5. Nitrous Oxide Emissions
Nitrous oxide (N2O) is produced during nitrification and denitrification processes [51]. The denitrification capacity of the top soil of maize land is smaller than that of grassland because the content of available C is smaller (Table 2). Therefore, the risk on N2O emissions is smaller for arable land than for grassland.
Emissions of N2O have been shown to be low for silage maize grown on a sandy soil. Less than 0.2% of the N applied for CAN and 0.3–0.7% for cattle slurry applied in rows and directly incorporated into the soil, while for clay soil 0.5–2.1% for CAN and 0.9%–2.0% for cattle slurry were emitted as N2O [36].
N2O emissions from a sandy soil grown with maize were higher for deep injection of slurry than for surface-applied slurry [52]. The average emission factor for CAN was 0.1% of the N applied, for injected cattle slurry it was 0.9%, and for surface-applied cattle slurry it was 0.4% [51]. Moreover, the average emission factors for injected (3.6%) and surface-applied (0.9%) pig slurry have been shown to be much higher than for cattle slurry [52].
Country-specific N2O emission factors for arable land are used in the methodology for estimating gaseous emissions from agriculture in the Netherlands (0.6% for surface-applied slurry and 1.3% for slurry applied with low ammonia emission techniques [16]). Meanwhile, a N2O emission factor of 0.7% is used for mineral N fertilizers applied to arable land [16].
3.2.6. Phosphorus Status of Soils
Phosphorus is less mobile than N and most of the excess of applied P remains in the soil. The risk of P leaching to surface water increases as the P status of the soil increases [53]. The P status of agricultural soils in the Netherlands increased in the 1970s and 1980s because of the high manure application rates. The P status of sandy soils and marine clay soils grown with maize was high (Pw value higher than 60 mg P2O5/L) and did not change over the 1988–2004 period [54]. In the 2005–2015 period, the P status of maize land remained stable for most soil types (Table 3), although there was a slight decrease in the most labile P fractions (Pw value and P–CaCl2) on riverine clay, sea clay, and peat soil. The policy with P application standards aims to decrease the P status of agricultural soils so that P leaching to surface waters also decreases. However, the soil P status changes slow (Table 3). It is expected that the P status of the agricultural soils in the Netherlands will decrease in the near future because the P application standards are currently relatively low (Table 1).
3.2.7. Soil Organic Matter Content
The mean soil organic matter (SOM) content of mineral soils (soils with less than 25% SOM) tended to increase by 0.097 and 0.081 g C/kg soil/year for grassland and maize land, respectively, during the 1984–2004 period [24]. In the 2005–2015 period, the SOM content of maize land increased for sandy soil, riverine soil, and sea clay, and remained stable for peat, reclaimed peat soil, and loess soil (Table 3). The increasing SOM content is probably due to a combination of the high manure application rates and the fact that maize land is often grown in rotation with grassland. The increasing SOM contents indicate that part of the N surplus is not lost to the environment, but remains in the soil. However, there are no results of long-term trends of total N contents in soils. SOM also affects soil biodiversity; the soil biodiversity is low in permanent maize land compared to permanent grassland and rotations of grassland and maize land [56].
3.3. Trends in the 1985–2018 Period
3.3.1. Nitrogen
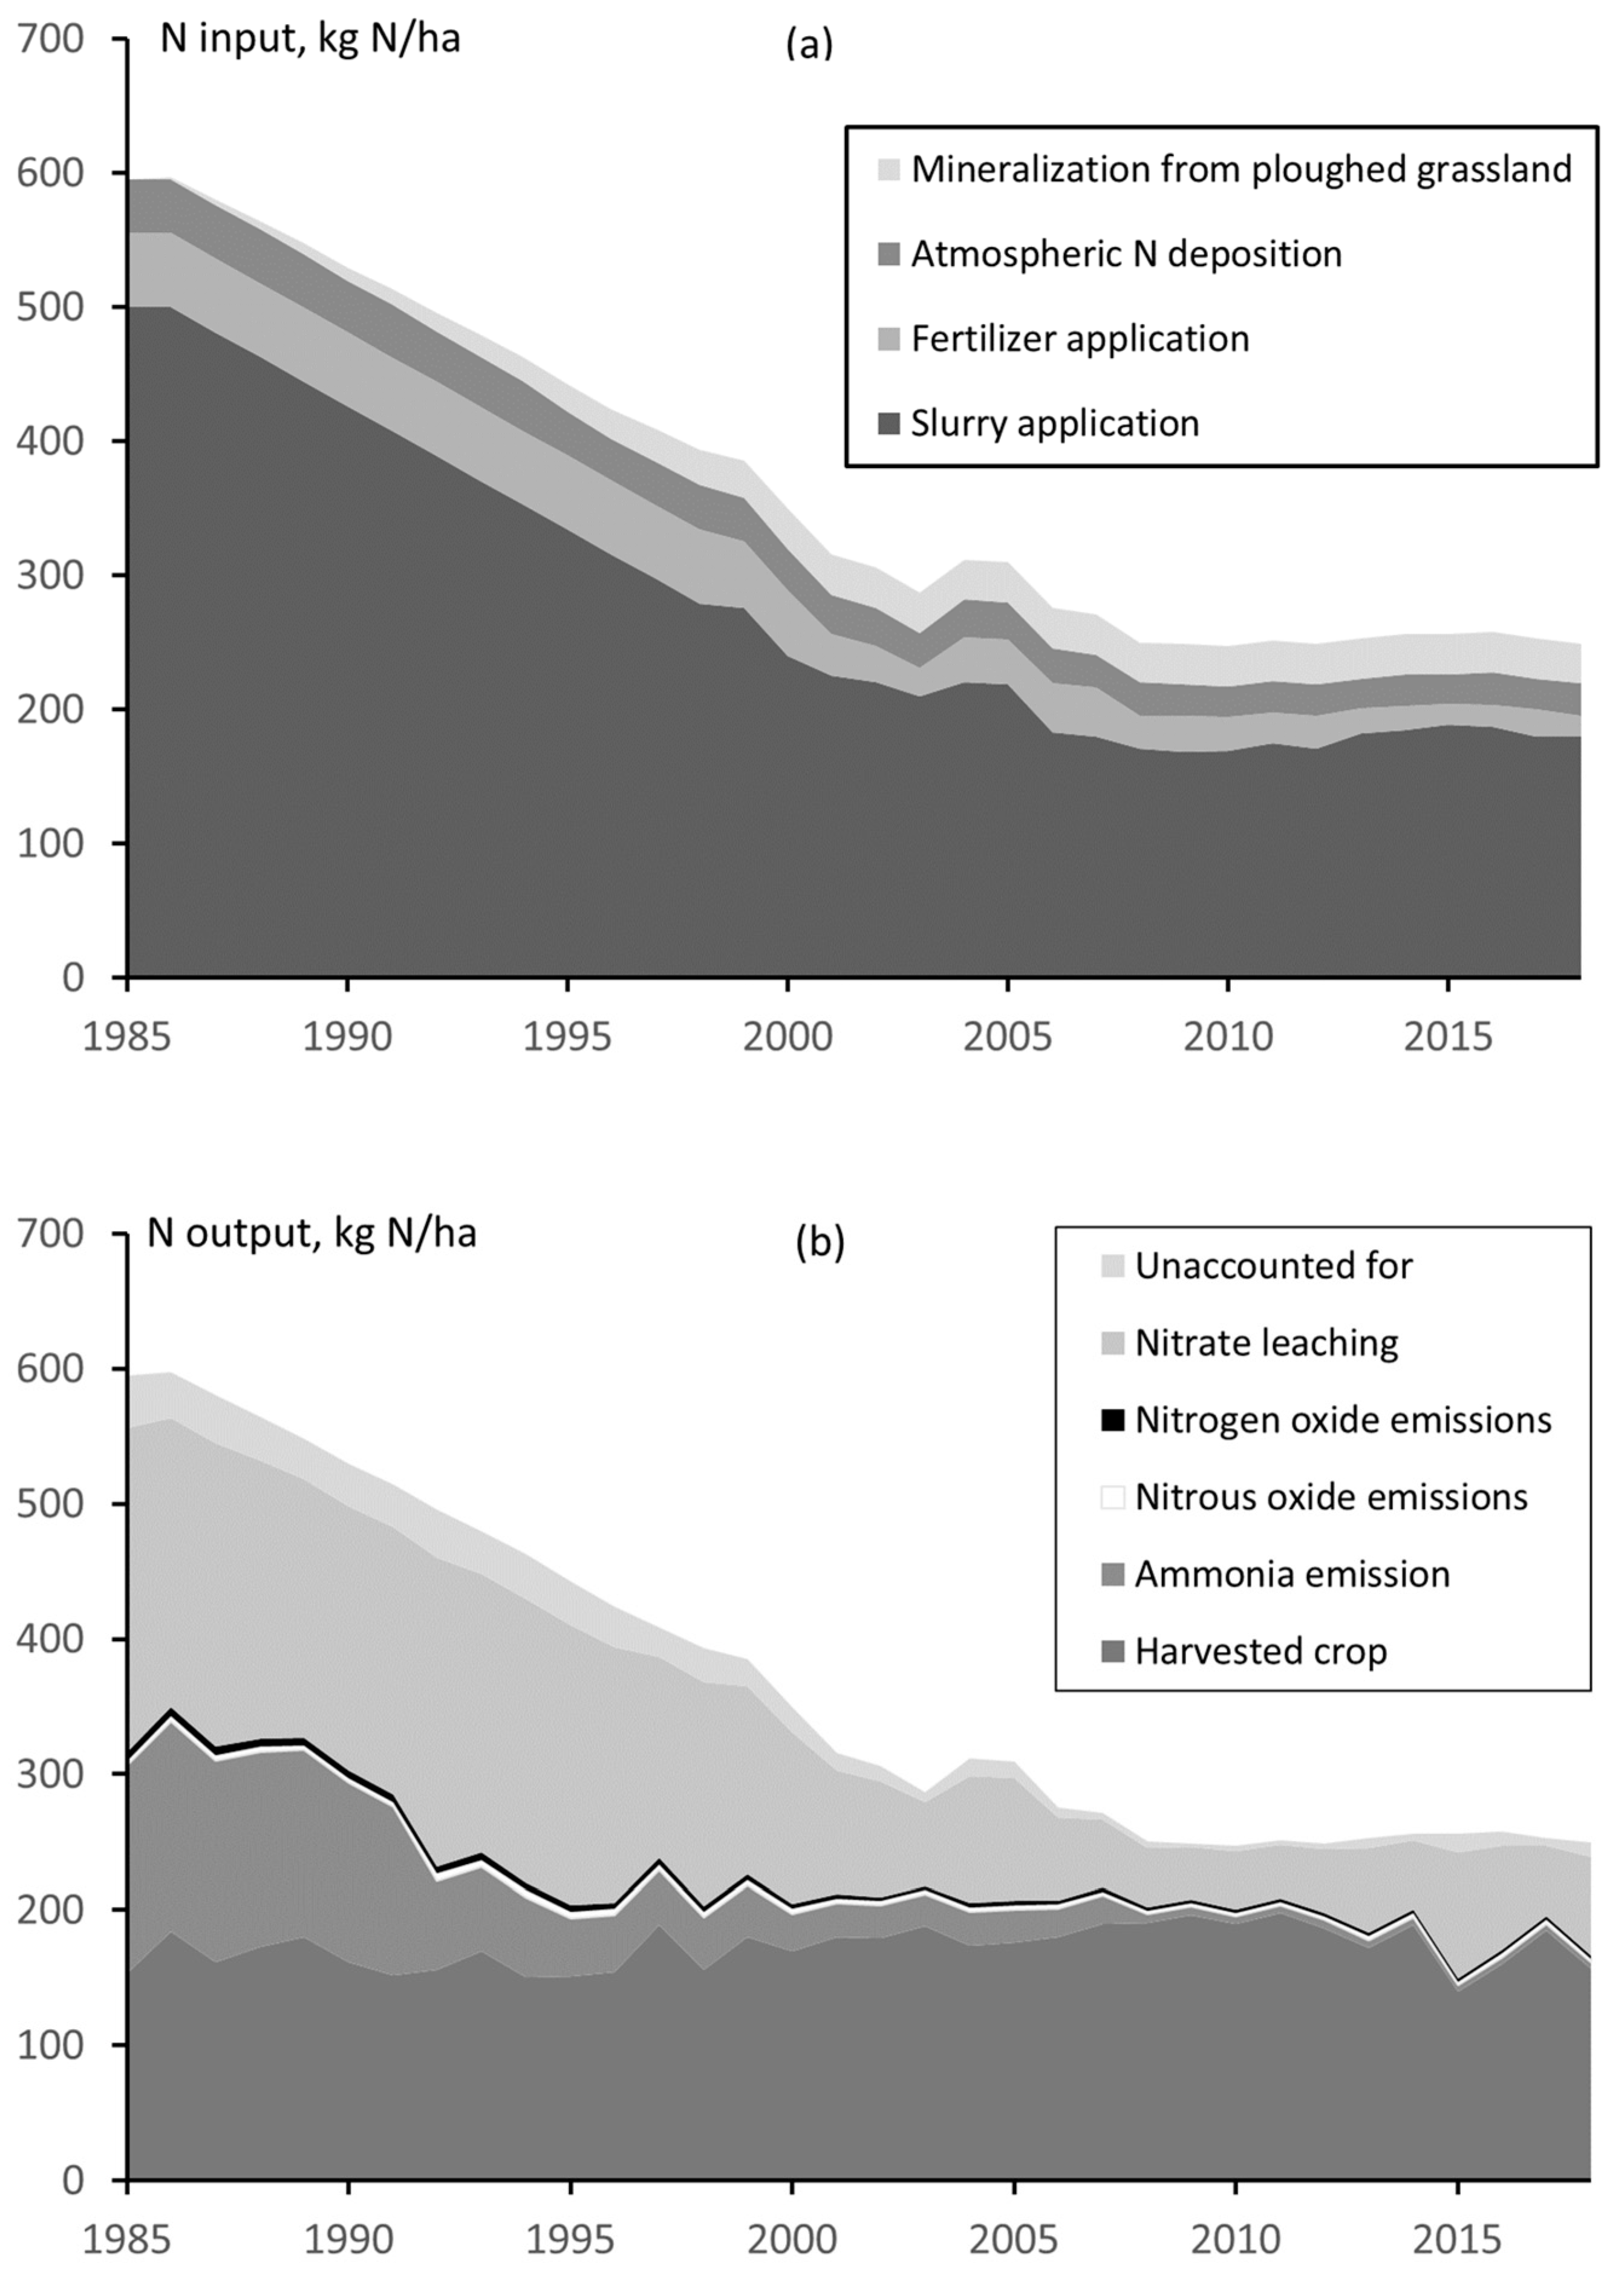
The total N input to silage maize as manure and fertilizer on sandy soils decreased from more than 500 kg N/ha in 1985 to approximately 250–300 kg N/ha in recent years (Figure 3). This decrease was due to the implementation of P application standards in the 1980s and 1990s, N loss standards in 1997, and N and P application standards from 2006. The total N input has not changed much since 2006.
The N in the harvested crop fluctuated between years and ranged from approximately 140 to 200 kg N/ha/year. There was no clear trend in N uptake, although the relatively stable N uptake was caused by increasing DM yields (Figure 1) and decreasing N content over time. The low application standards did not result in a decrease in yield, which is probably due to a combination of factors, i.e., (i) the N application rates largely exceeded the N requirement of silage maize (especially in the 1980s and early 1990s; currently, the N application standards are below the recommended levels on sandy soils), (ii) measures to decrease NH3 (low emission application techniques) and NO3 losses (catch crops and closed periods of manure application) increased the N available for crop uptake, and (iii) the improvement of maize varieties with a higher N use efficiency.
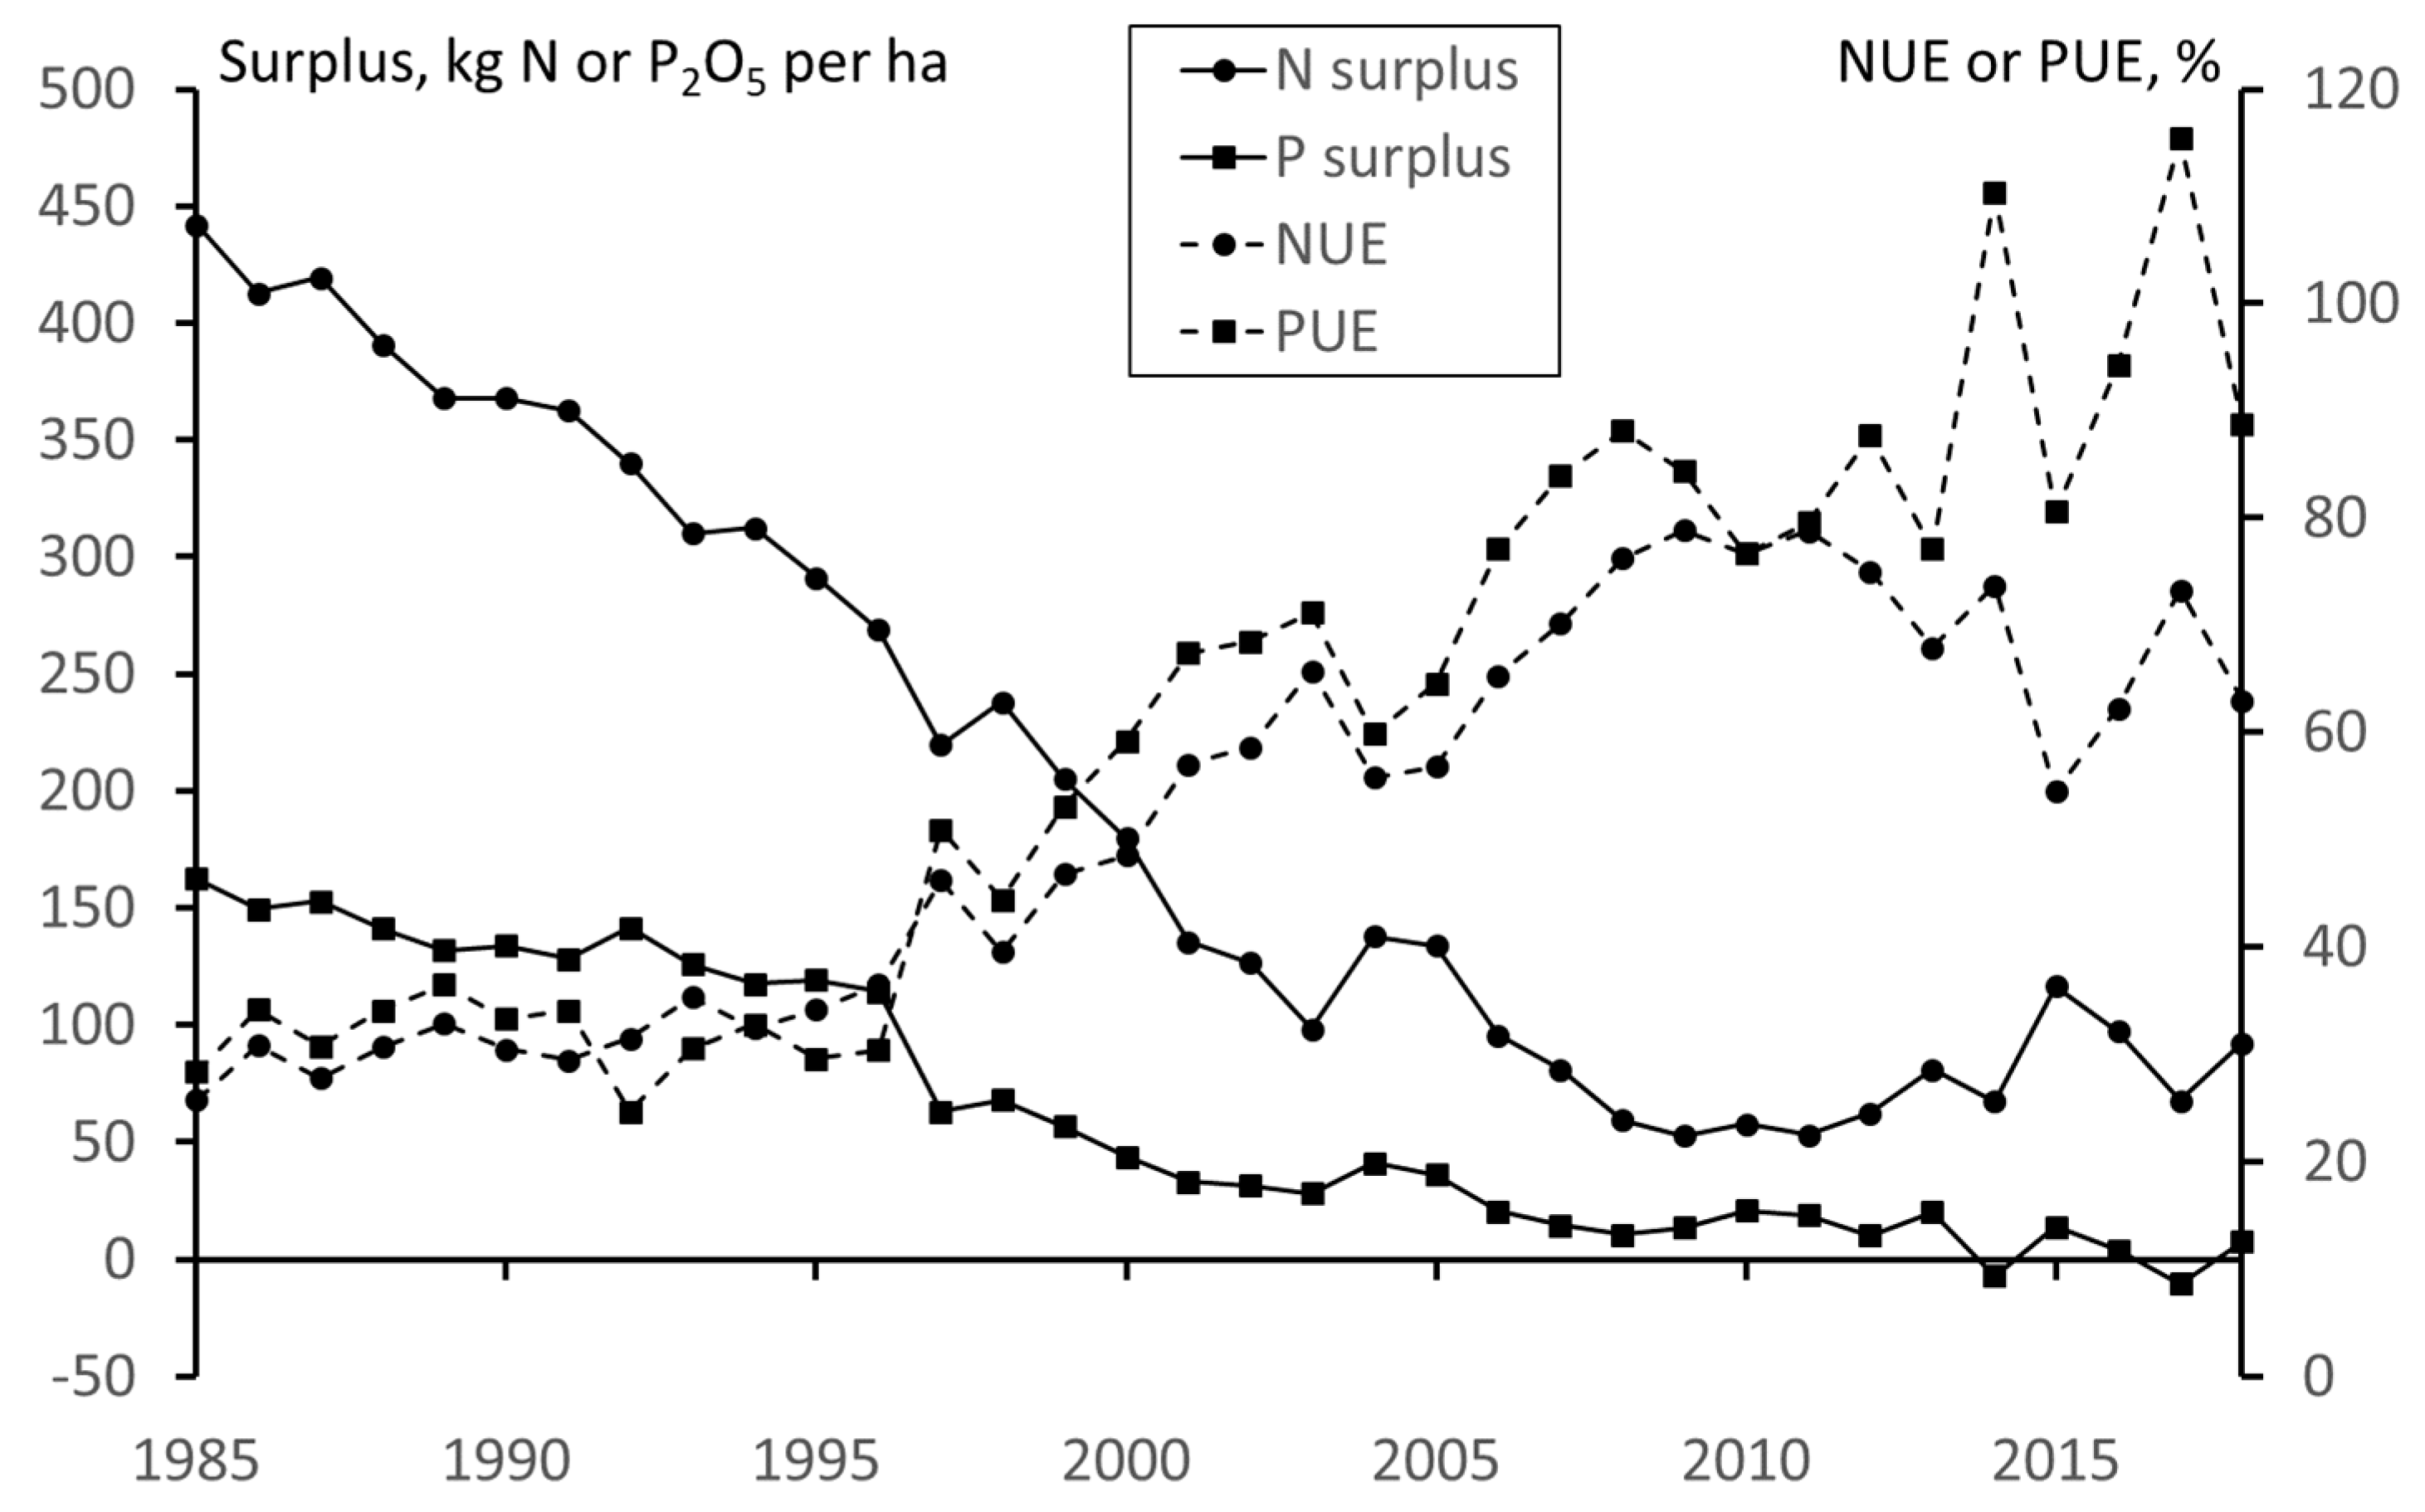
The N surplus, calculated as the difference between the total N input and the output by harvested crop, decreased from 442 kg N/ha in 1985 to 60 kg N/ha in the period after 2009, but with variations between years due to a variation in N uptake (Figure 4). The NUE increased from less than 30% at the end of the 1980s to 80% around 2010 (Figure 4). In recent years, maize yield was relatively low because of drought (Figure 1), as a result of which NUE also decreased (Figure 4).
The calculated NO3 leaching decreased from more than 200 kg N/ha in the 1980s to less than approximately 50 kg N/ha in the 2007–2012 period. The decrease in NO3 leaching was mainly due to the low N application standards, as a result of which, less N was applied. In recent years, the calculated leaching increased again because of lower yields due to drought.
Ammonia emissions decreased from more than 150 kg N/ha in the 1980s to 6 kg N/ha in recent years. The lower NH3 emissions were mainly due to the implementation of low NH3 emission techniques in the early 1990s. Since 2008, the incorporation of slurry has to be done in one pass, which resulted in a further decrease in NH3 emissions. The decrease in the application rate of slurry from 1985 to approximately 2006, because of the implementation of application standards, also decreased NH3 emissions.
The relative decrease in N2O emissions in the 1995–2018 period was 32%, which was much smaller than the decrease in NO3 leaching (70%) and NH3 emissions (97%) in the same period. This small decrease in N2O emissions was caused by the implementation of low NH3 emission application techniques in the early 1990s, as a result of which, the N2O emissions increased (from 3.7 kg N/ha in 1991 to 5.8 kg N/ha in 1992). Thereafter, N2O emissions decreased because of the decrease in N inputs as organic and mineral fertilizers. Nitrogen oxide emissions have decreased to a greater extent over time than N2O emissions (by 65% since 1985), mainly because of the lower N application rates. It must be noted that the N2O emissions are calculated using country-specific emission factors, which are higher for the injection rather than for the surface application of slurry [18]. By contrast, the NO emission factors are default values from the EMEP/EEA guidebook and do not differ between slurry application techniques [19]. As N2O and NO are both produced during the same denitrification process, it is likely that NO emissions are also higher for the injection rather than the surface application of slurry.
The unaccounted N includes both N2 losses by denitrification and N storage in soil organic matter. The unaccounted N ranged from approximately 40 kg N/ha in the 1980s to less than 15 kg N/ha since 2001. The increase in soil organic matter content in maize land (Table 3) indicates that the N stored in organic matter has also increased, but data are not available to quantify the N storage in soils. Moreover, there are no data available on N2 losses from sandy soils grown with maize in the Netherlands.
3.3.2. Phosphorus
The P input as slurry and fertilizer decreased from more than 200 kg P2O5/ha in the 1980s to approximately 70 kg P2O5/ha in recent years (Table S1). This strong decrease was mainly due to the P application standards and the ban on the use of mineral P fertilizers on farms with a derogation. The P surplus decreased from more than 120 kg P2O5/ha in the 1980s to less than 10 kg P2O5/ha in recent years, showing that currently, the P input and output are nearly in balance in silage maize cropping systems (Figure 4). Moreover, the PUE increased from approximately 40% at the end of the 1980s and early 1990s to more than 90% and occasionally more than 100% in recent years. Most of the excess P remained in the soil, as is shown in the high P status of the agricultural soils in the Netherlands [52,53].
The P concentration in surface water decreased between 1992 and 2008, but thereafter, no clear trend in P concentration can be observed [11]. However, the P concentrations in many surface waters are too high to meet the ecological targets of the Water Framework Directive.
4. Discussion
N and P use for silage maize cultivation has greatly decreased over time, while the N and P uptake by maize crop has remained more or less stable. This has resulted in a steady increase in the N and P use efficiencies in silage maize cultivation. The introduction of application standards was very effective in decreasing the nutrient input and the emissions of NH3 greatly decreased. However, the N2O emissions increased after the implementation of low NH3 emission application techniques in the early 1990s. In contrast, the N use efficiency increased after the application of low NH3 emission techniques, while nitrate leaching decreased because of the tightened N application standards (especially on sandy soils), closed periods, and the obligation to grow catch crops.
Despite all measures taken to reduce NO3 leaching, NO3 concentrations in groundwater under maize fields on sandy soils still frequently exceed the 50 mg/L norm of the Nitrates Directive [43]. Therefore, further measures are needed to decrease NO3 leaching. The N application rates of silage maize have already decreased to a great extent and are, on sandy soils, lower than the agronomic optimal N application rates (allowed application rate of 112–140 kg N/ha versus average recommended rate of 160 kg N/ha) [10]. This does not necessarily mean that N supply is too low for good production, as row application (slurry and mineral fertilizers) and well-established catch crops can fill this gap. Row application of slurry close to the roots of maize is considered a promising measure to reduce nitrate leaching because it increases NUE [38]. However, recent studies have shown a slightly lower N efficiency of the row application of slurry compared to the common slurry injection without placement of slurry close to the roots [57]. In earlier experiments [38], for broadcast and row application, the soil was first ploughed prior to the slurry injection. However, in recent studies, common agricultural practice was followed, in which injection was administered before and row application after ploughing. The row application of slurry after ploughing may have led to some soil compaction and slightly lower yields and N uptake in comparison to slurry injection before ploughing. Additional mineral fertilizer N is mostly banded at sowing in current practice.
A well-established catch crop can reduce nitrate leaching from silage maize by up to 50% [37,58]. A study in Germany also showed that the use of a grass undersown in silage maize as a winter cover crop can reduce nitrate leaching losses by 50% [59]. Therefore, farmers on sandy soils are obliged to sow a catch crop after the harvest of the maize. In the first years after the introduction of this measure, there was no ultimate sowing date and, on many fields, the establishment of the catch crop was relatively poor. Therefore, since 2019, farmers are obliged to sow the catch crop before 1 October (Table 1) because the N uptake of a catch crop greatly decreases in October as a result of short days and low temperatures. In practice, there is reluctance against this date of 1 October, as this may affect the maize yields because earlier varieties must be sown for a timely harvest. For this reason, catch crops are now increasingly undersown (e.g., grasses sown at the time the crop closes), so that the silage maize can be harvested in early October and the catch crop can rapidly establish after harvest. Sowing earlier maize varieties in order to create better conditions for a better catch crop may result in a lower N uptake of the maize crop, as yields are generally lower than for late maize varieties. This may counteract the higher N uptake of the catch crop. Harvesting maize around mid-September is the most optimal for reducing leaching losses.
The continuous cropping of maize on the same land may increase weed resistance and pathogen levels, such as that of root rot, and may decrease soil quality. These problems can be partly solved by growing maize in rotation with grassland. Crop rotation experiments have shown that maize yields can be 5–7% higher in rotation with grass than grown continuously. However, the risk of NO3 leaching greatly increases when silage maize is grown after grassland [60], although this can likely be controlled by proper management. Studies have indicated that there is the potential to save N fertilizer in maize–grassland rotations [61,62] and well-established catch crops can further decrease the risk. Moreover, the length of the grassland period plays a significant role. In a review, it was concluded that both ley and arable intervals in a maize–grassland rotation should not exceed three years in countries in northwest Europe to minimize the risk of NO3 leaching [63]. Ley–arable rotation also increases the risks of N2O emissions because of the increased N mineralization of ploughed grassland [64].
Recently, it was shown that an increasing number of dairy farmers in the southern part of the Netherlands with sandy soils do not request a derogation [65]. Therefore, these farmers can use more than 20% (the limit for receiving derogation) of the farm area for silage maize, which may be attractive as, especially on drought-sensitive soils, maize may be more productive than grass. The replacement of grassland by maize may, however, lead to an increase in the NO3 concentration of groundwater because NO3 leaching is higher in maize land than in grassland [43].
Besides decreasing NO3 leaching, there will be more environmental challenges in the near future, in which the cultivation of silage maize plays an important role. The Dutch government aims to greatly reduce NH3 emission from agriculture, because the deposition of atmospheric N into nature frequently exceeds the maximum (critical) loads for certain habitat types [66]. Thus, biodiversity targets have not yet been achieved [67]. Changes to the diet of cows is one of the measures that can be taken to reduce NH3 emission. The replacement of grass by silage maize decreases the N excretion of cows [68], which, in turn, also decreases the risk of NH3 emissions from stored and applied cattle slurry. In addition, NH3 application losses in the field are lower for maize than for grassland.
The Dutch government published their future climate policy in 2019 with targets to reduce methane (CH4) emissions from cattle, to sequester carbon (C) in agricultural soils, and to decrease N2O emissions [69]. Enteric fermentation is an important source of CH4 and the replacement of grass roughage by silage maize decreases CH4 emissions by the enteric fermentation of cows [70]. The organic matter content and potential for C storage of grasslands are higher than that of arable land [23]. Changes in the area of silage maize and grassland on dairy farms have an impact on the C storage in agricultural soils in the Netherlands and the CO2 emissions related to land use and land use change [71].
The phosphorus balance of silage maize is often negative because of the low P application standards and the prohibition of the use of mineral P fertilizer on farms with derogation. The P content of the most mobile P fractions are decreasing in some soils (Table 3), and it is expected that P leaching will decrease when the P status of maize land decreases. Balanced P fertilization and mining of soil P are important measures to decrease P leaching and eutrophication of surface waters as part of the Water Framework Directive. The P status of maize land is still very high, and therefore, the negative balance does not result in lower maize yields up to now. In the long term, a negative P balance may result in yield decreases and low P content in ensiled maize. However, in the Dutch legislation, the P application standard increases at decreasing P soil status, so the risk of a reduction in yield as a result of a decreasing P status is limited.
In conclusion, the implementation of a series of environmental policies in the 1980s has greatly decreased N and P emissions to the environment from silage maize cultivation in the Netherlands. However, further improvements in nutrient management are needed because of the challenges related to the mitigation of emissions of NH3, CH4, and N2O, the sequestration of C in agricultural soils, and further reductions of N and P leaching into the water, all while maintaining silage maize yield and quality.
Supplementary Materials
The following are available online at https://www.mdpi.com/2073-4395/10/12/1861/s1: Table S1. Data used for the calculations of inputs and outputs of silage maize cultivation on sandy soils vulnerable for NO3 leaching; Table S2. Emission factors used for the calculations of inputs and outputs of silage maize cultivation on dry sandy soils; Table S3. Results of the calculations of N and P yields, surpluses, use efficiencies, and NH3, N2O, and NO emissions for silage maize cultivation on dry sandy soils for a farm with derogation (from 2006) and use of cattle slurry.
Author Contributions
Conceptualization, G.V.; methodology, G.V.; formal analysis, G.V.; investigation, G.V.; data curation, G.V., H.v.S., and W.v.D.; writing—original draft preparation, G.V.; writing—review and editing, H.v.S. and W.v.D.; visualization, G.V. All authors read and agreed to the published version of the manuscript.
Funding
This research received no external funding.
Conflicts of Interest
The authors declare no conflict of interest.
References
- Becker, W.R. De Maisteelt in Nederland; Publikatie Nr. 19.; Proefstation voor de Akker-en Weidebouw: Wageningen, The Netherlands, 1962. [Google Scholar]
- Sibma, L. Ontwikkeling en Groei van Maïs (Zea mays L.) Onder Nederlandse Omstandigheden; Pudoc: Wageningen, The Netherlands, 1987. [Google Scholar]
- de Boer, F. Use of maize for livestock feeding in the Netherlands. Anim. Feed Sci. Technol. 1976, 1, 177–181. [Google Scholar] [CrossRef]
- Schröder, J.; Dilz, K. Cattle slurry and farmyard manure as fertilizers for forage. In Animal manure on grassland and fodder crop: Fertilizer or waste? In Proceedings of the an International Symposium of the European Grassland Federation, Wageningen, The Netherlands, 31 August–3 September 1987; van der Meer, H.G., Unwin, R.J., van Dijk, T.A., Eds.; Nijhoff: Leiden, The Netherlands, 1987; pp. 137–156. [Google Scholar]
- Oenema, O.; Bleeker, A.; Braathen, N.A.; Velthof, G.L. Nitrogen in current European policies. In The European Nitrogen Assessment. Sources, Effects and Policy Perspectives; Sutton, M.A., Howard, C.M., Erisman, J.W., Billen, G., Bleeker, A., Grennfelt, P., van Grinsven, H., Grizzetti, B., Eds.; Cambridge University Press: Cambridge, UK, 2011; Chapter 4; pp. 62–81. [Google Scholar]
- Van Grinsven, H.J.M.; Tiktak, A.; Rougoor, C.W. Evaluation of the Dutch implementation of the nitrates directive, the water framework directive and the national emission ceilings directive. NJAS Wagening J. Life Sci. 2016, 78, 69–84. [Google Scholar] [CrossRef] [Green Version]
- Aarts, H.F.M.; Daatselaar, C.H.G.; Holshof, G. Bemesting, Meststofbenutting en Opbrengst van Productiegrasland en Snijmais op Melkveebedrijven; PRI Rapport 208; Plant Research International: Wageningen, The Netherlands, 2008. [Google Scholar]
- Lukács, S.; Blokland, P.W.; Prins, H.; Vrijhoef, A.; Fraters, D.; Daatselaar, C.H.G. Agricultural Practices and Water Quality on Farms Registered for Derogation in 2017; RIVM Report 2019-0026; National Institute for Public Health and the Environment: Bilthoven, The Netherlands, 2019. [Google Scholar] [CrossRef]
- den Boer, D.J.; Reijneveld, J.A.; Schroder, J.J.; van Middelkoop, J.C. Mestsamenstelling in Adviesbasis Bemesting Grasland en Voedergewassen; Wageningen UR Livestock Research, Commissie Bemesting Grasland en Voedergewassen: Lelystad, The Netherlands, 2012. [Google Scholar]
- CBGV. Bemestingsadvies; Commissie Bemesting Grasland en Voedergewassen: Wageningen, The Netherlands, 2019. [Google Scholar]
- Fraters, B.; Hooijboer, A.E.J.; Vrijhoef, A.; Claessens, J.; Kotte, M.C.; Rijs, G.B.J.; Denneman, A.I.M.; Bruggen, C.; Daatselaar, C.; Begeman, H.A.L.; et al. Agricultural Practices and Water Quality in the Netherlands; Status (2012–2014) and Trend (1992–2014). Monitoring Results for Nitrates Directive Reporting; RIVM: Bilthoven, The Netherlands, 2016. [Google Scholar]
- CBS, P.; RIVM, WUR. Stikstofdepositie, 1990–2018 (Indicator 0189, Versie 18, 21 November 2019). Available online: www.clo.nl (accessed on 26 May 2020).
- Conijn, J.G.; Velthof, G.L.; Taube, F. Grassland Resowing and Grass-Arable Crop Rotations; International Workshop on Agricultural and Environmental Issues, 18 & 19 April 2002 in Wageningen, The Netherlands; PRI Report 47; Plant Research International: Wageningen, The Netherlands, 2002. [Google Scholar]
- van Bruggen, C.; Gosselink, M. Dierlijke Mest en Mineralen 1990–2018; CBS: Den Haag, The Netherlands, 2018. [Google Scholar]
- CBS. Mineralen in de Landbouw, 1970–1990. Fosfor, Stikstof, Kalium; Netherlands Central Bureau of Statistics CBS: ‘s-Gravenhage, The Netherlands, 1992. [Google Scholar]
- Lagerwerf, L.A.; Bannink, A.; Bruggen, V.C.; Groenestein, C.M.; Huijsmans, J.F.M.; Kolk, V.D.J.W.H.; Luesink, H.H.; Sluis, V.D.S.M.; Velthof, G.L.; Vonk, J. Methodology for Estimating Emissions from Agriculture in the Netherlands: Calculations of CH4, NH3, N2O, NOx, NMVOC, PM10, PM2.5 and CO2 with the National Emission Model for Agriculture (NEMA), Update 2019; WOt Technical Report 148; Statutory Research Tasks Unit for Nature & the Environment: Wageningen, The Netherlands, 2019. [Google Scholar]
- Velthof, G.L.; Bruggen, v.C.; Groenestein, C.M.; Haan, d.B.J.; Hoogeveen, M.W.; Huijsmans, J.F.M. A model for inventory of ammonia emissions from agriculture in the Netherlands. Atmos. Environ. 2012, 46, 248–255. [Google Scholar] [CrossRef]
- Velthof, G.L.; Mosquera, J. Calculation of Nitrous Oxide Emission from Agriculture in the Netherlands: Update of Emission Factors and Leaching Fraction; Alterra-Report 2151; Alterra: Wageningen, The Netherlands, 2011. [Google Scholar]
- EEA. EMEP/EEA Air Pollutant Emission Inventory Guidebook 2019; Technical Guidance to Prepare National Emission Inventories; EEA: Copenhagen, Denmark, 2019. [Google Scholar]
- Fraters, D.; van Leeuwen, T.; Boumans, L.; Reijs, J. Use of long-term monitoring data to derive a relationship between nitrogen surplus and nitrate leaching for grassland and arable land on well-drained sandy soils in the Netherlands. Acta Agric. Scand. Sect. B Soil Plant Sci. 2015, 65, 144–154. [Google Scholar] [CrossRef]
- de Ruijter, F.J.; Huijsmans, J.F.M. A methodology for estimating the ammonia emission from crop residues at a national scale. Atmos. Environ. 2019, 2, 100028. [Google Scholar] [CrossRef]
- de Ruijter, F.J.; van Dijk, W.; van Geel, W.C.A.; Holshof, G.; Postma, R.; Wilting, P. Actualisatie Van Stikstof-En Fosfaatgehalten Van Akkerbouwgewassen Met Een Groot Areaal; Report WPR No. WPR-957; Wageningen Plant Research: Wageningen, The Netherlands, 2020. [Google Scholar] [CrossRef]
- Reijneveld, A.; van Wensem, J.; Oenema, O. Soil organic carbon contents of agricultural land in the Netherlands between 1984 and 2004. Geoderma 2009, 152, 231–238. [Google Scholar] [CrossRef]
- Velthof, G.L.; Koeijer, T.; Schröder, J.J.; Timmerman, M.; Hooijboer, A.; Rozemeijer, J.; Bruggen, C.V.; Groenendijk, P. Effecten Van Het Mestbeleid Op Landbouw En Milieu: Beantwoording Van De Ex-Postvragen in Het Kader Van De Evaluatie Van De Meststoffenwet; Report 2782; Wageningen Environmental Research: Wageningen, The Netherlands, 2017. [Google Scholar]
- Schröder, J.J.; Neeteson, J.J. Nutrient management regulations in The Netherlands. Geoderma 2008, 144, 418–425. [Google Scholar] [CrossRef]
- Schroder, J.J.; Aarts, H.F.M.; van Middelkoop, J.C.; Schils, R.L.M.; Velthof, G.L.; Fraters, B.; Willems, W.J. Permissible manure and fertilizer use in dairy farming systems on sandy soils in The Netherlands to comply with the Nitrates Directive target. Eur. J. Agron. 2007, 27, 102–114. [Google Scholar] [CrossRef]
- Schils, R.; Schröder, J.; Velthof, G. Fertilizer Replacement Value. In Biorefinery of Inorganics; Meers, E., Velthof, G., Michels, E., Rietra, R., Eds.; John Wiley and Sons: Hoboken, NJ, USA, 2020; pp. 189–214. [Google Scholar] [CrossRef]
- Sissingh, H.A. Analytical technique of the Pw method, used for the assessment of the phosphate status of arable soils in the Netherlands. Plant Soil 1971, 34, 483–486. [Google Scholar] [CrossRef]
- Houba, V.J.G.; Novozamsky, I.; Huybregts, A.W.M.; van der Lee, J.J. Comparison of soil extractions by 0.01M CaCl2, by EUF and by some conventional extraction procedures. Plant Soil 1986, 96, 433–437. [Google Scholar] [CrossRef]
- Jordan-Meille, L.; Rubæk, G.H.; Ehlert, P.A.I.; Genot, V.; Hofman, G.; Goulding, K.; Recknagel, J.; Provolo, G.; Barraclough, P. An overview of fertilizer-P recommendations in Europe: Soil testing, calibration and fertilizer recommendations. Soil Use Manag. 2012, 28, 419–435. [Google Scholar] [CrossRef]
- van der Paauw, F. An effective water extraction method for the determination of plant-available soil phosphorus. Plant Soil 1971, 34, 467–481. [Google Scholar] [CrossRef]
- Velthof, G.L.; Hou, Y.; Oenema, O. Nitrogen excretion factors of livestock in the European Union: A review. J. Sci. Food Agric. 2015, 95, 3004–3014. [Google Scholar] [CrossRef] [PubMed]
- Barriere, Y.; Alber, D.; Dolstra, O.; Lapierre, C.; Motto, M.; Ordas, A.; Waes, J.V.; Vlasminkel, L.; Welcker, C.; Monod, J.P. Past and prospects of forage maize breeding in Europe. II. History, germplasm evolution and correlative agronomic changes. Maydica 2006, 51, 435–449. [Google Scholar]
- Schils, R.L.M.; Van den Berg, W.; Van der Schoot, J.R.; Groten, J.A.M.; Rijk, B.; Van de Ven, G.W.J.; Van Middelkoop, J.C.; Holshof, G.; Van Ittersum, M.K. Disentangling genetic and non-genetic components of yield trends of Dutch forage crops in the Netherlands. Field Crop. Res. 2020, 249, 107755. [Google Scholar] [CrossRef]
- Meer, H.G.V.D. Stikstofbenutting En-Verliezen Van Gras-En MaiSland: Stand Van Zaken In Het Onderzoek Naar De Stikstofproblematiek Van Gras-En Mai;Sland; Ministerie Van Landbouw, Natuurbeheer En Visserij; Dienst Landbouwkundig Onderzoek: Wageningen, The Netherlands, 1991. [Google Scholar]
- Groenigen, V.J.W.; Kasper, G.J.; Velthof, G.L.; Pol-van Dasselaar, V.D.A.; Kuikman, P.J. Nitrous oxide emissions from silage maize fields under different mineral nitrogen fertilizer and slurry applications. Plant Soil 2004, 263, 101–111. [Google Scholar] [CrossRef]
- Schröder, J.J.; Visser, D.W.; Assinck, F.B.T.; Velthof, G.L. Effects of short-term nitrogen supply from livestock manures and cover crops on silage maize production and nitrate leaching. Soil Use Manag. 2013, 29, 151–160. [Google Scholar] [CrossRef]
- Schröder, J.J.; Vermeulen, G.D.; Schoot, J.R.V.D.; Dijk, W.V.; Huijsmans, J.F.M.; Meuffels, G.J.H.M.; Schans, D.A.V.D. Maize yields benefit from injected manure positioned in bands. Eur. J. Agron. 2015, 64, 29–36. [Google Scholar] [CrossRef]
- Van Dijk, W.; Brouwer, G. Nitrogen recovery and dry matter production of silage maize (Zea mays L.) as affected by subsurface band application of mineral nitrogen fertilizer. Neth. J. Agric. Sci. 1998, 46, 139–155. [Google Scholar]
- Schröder, J.J.; ten Holte, L.; van Keulen, H.; Steenvoorden, J.H.A.M. Effects of nitrification inhibitors and time and rate of slurry and fertilizer N application on silage maize yield and losses to the environment. Fertil. Res. 1993, 34, 267–277. [Google Scholar] [CrossRef]
- Schröder, J.J.; Jansen, A.G.; Hilhorst, G.J. Long-term nitrogen supply from cattle slurry. Soil Use Manag. 2005, 21, 196–204. [Google Scholar] [CrossRef]
- Schröder, J.J.; Aarts, H.F.M.; Middelkoop, V.J.C.; Velthof, G.L.; Reijs, J.W.; Fraters, B. Nitrates Directive Requires Limited Inputs of Manure and Mineral Fertilizer in Dairy Farming Systems; Report 222; Plant Research International: Wageningen, The Netherlands, 2009. [Google Scholar]
- Hooijboer, A.; Fraters, D.; Verloop, K. Het Effect Van Rotatie Van Maïs En Gras Op De Nitraatuitspoeling; Water Matters: Kenniskatern voor Waterprofessionals-Dutch edition; KNW: The Hague, The Netherlands, 2017; pp. 20–23. [Google Scholar]
- Ten Berge, H.F.M.; Burgers, S.L.G.E.; Van der Meer, H.G.; Schröder, J.J.; Van der Schoot, J.R.; Van Dijk, W. Residual inorganic soil nitrogen in grass and maize on sandy soil. Environ. Pollut. 2007, 145, 22–30. [Google Scholar] [CrossRef] [PubMed]
- Vertès, F.; Hatch, D.J.; Velthof, G.L.; Taube, F.; Laurent, F.; Loiseau, P.; Recous, S. Short-term and cumulative effects of grassland cultivation on nitrogen and carbon cycling in ley-arable rotations. In Proceedings of the 14th symposium of the European Grassland Federation, Permanent and temporary grassland: Plant, Environment and Economy, Ghent, Belgium, 3–5 September 2007; pp. 227–246. [Google Scholar]
- Dijk, V.W. Gescheurd grasland levert veel stikstof voor snijmais. Praktijkonderzoek Rundvee Schapen en Paarden. Praktijkonderzoek 1999, 12, 45–47. [Google Scholar]
- Munch, J.C.; Velthof, G.L. Denitrification and agriculture. In Biology of the Nitrogen Cycle; Elsevier: Amsterdam, The Netherlands, 2007. [Google Scholar]
- Huijsmans, J.F.M.; Hol, J.M.G.; Vermeulen, G.D. Effect of application method, manure characteristics, weather and field conditions on ammonia volatilization from manure applied to arable land. Atmos. Environ. 2003, 37, 3669–3680. [Google Scholar] [CrossRef]
- Huijsmans, J.F.M.; Schils, R.L.M. Ammonia and Nitrous Oxide Emissions Following Field-Application of Manure: State of the Art Measurements in The Netherlands; Proceedings 655, International Fertiliser Society: York, UK, 2009. [Google Scholar]
- Huijsmans, J.F.M.; Schröder, J.J.; Mosquera, J.; Vermeulen, G.D.; Ten Berge, H.F.M.; Neeteson, J.J. Ammonia emissions from cattle slurries applied to grassland: Should application techniques be reconsidered? Soil Use Manag. 2016, 32, 109–116. [Google Scholar] [CrossRef]
- Wrage, N.; Velthof, G.L.; Van Beusichem, M.L.; Oenema, O. Role of nitrifier denitrification in the production of nitrous oxide. Soil Biol. Biochem. 2001, 33, 1723–1732. [Google Scholar] [CrossRef]
- Velthof, G.; Mosquera, J. The impact of slurry application technique on nitrous oxide emission from agricultural soils. Agric. Ecosyst. Environ. 2011, 140, 298–308. [Google Scholar] [CrossRef]
- Schoumans, O.F.; Chardon, W.J. Phosphate saturation degree and accumulation of phosphate in various soil types in The Netherlands. Geoderma 2014, 237, 325–335. [Google Scholar] [CrossRef]
- Reijneveld, J.A.; Ehlert, P.A.I.; Termorshuizen, A.J.; Oenema, O. Changes in the soil phosphorus status of agricultural land in the Netherlands during the 20th century. Soil Use Manag. 2010, 26, 399–411. [Google Scholar] [CrossRef]
- Brolsma, K.; Ton, E.; Reijneveld, A. Bodemvruchtbaarheid in Nederland Over De Periode 2005–2015. Trends in De Chemische, De Fysische En De Biologische Bodemvruchtbaarheid Per Lei Gebied Voor Elke Grondsoort En Per Sector Bodemvruchtbaarheid In Nederland Over De Periode 2005–2015; Eurofins Agro: Wageningen, The Netheland, 2017. [Google Scholar]
- van Eekeren, N.; Bommelé, L.; Bloem, J.; Schouten, T.; Rutgers, M.; de Goede, R.; Reheul, D.; Brussaard, L. Soil biological quality after 36 years of ley-arable cropping, permanent grassland and permanent arable cropping. Appl. Soil Ecol. 2008, 40, 432–446. [Google Scholar] [CrossRef] [Green Version]
- Klootwijk, C.W.; Schooten, H.A.V. Effect van Ruitzaai en Drijfmestrijenbemesting op de Stikstofbenutting van Snijmaisteelt; Report 1256; Wageningen Livestock Research: Wageningen, The Netherlands, 2020. [Google Scholar]
- Schröder, J.J.; Dijk, V.W.; Groot, D.W.J.M. Effects of cover crops on the nitrogen fluxes in a silage maize production system. Neth. J. Agric. Sci. 1996, 44, 293–315. [Google Scholar]
- Wachendorf, M.; Büchter, M.; Volkers, K.C.; Bobe, J.; Rave, G.; Loges, R.; Taube, F. Performance and environmental effects of forage production on sandy soils. V. Impact of grass understorey, slurry application and mineral N fertilizer on nitrate leaching under maize for silage. Grass Forage Sci. 2006, 61, 243–252. [Google Scholar] [CrossRef]
- Hansen, E.M.; Eriksen, J. Nitrate leaching in maize after cultivation of differently managed grass-clover leys on coarse sand in Denmark. Agric. Ecosyst. Environ. 2016, 216, 309–313. [Google Scholar] [CrossRef]
- Cougnon, M.; Van den Berge, K.; D’Hose, T.; Clement, L.; Reheul, D. Effect of management and age of ploughed out grass-clover on forage maize yield and residual soil nitrogen. J. Agric. Sci. 2018, 156, 748–757. [Google Scholar] [CrossRef]
- Verloop, J.; Boumans, L.J.M.; van Keulen, H.; Oenema, J.; Hilhorst, G.J.; Aarts, H.F.M.; Sebek, L.B.J. Reducing Nitrate Leaching to Groundwater in an Intensive Dairy Farming System. Nutr. Cycl. Agroecosyst. 2006, 74, 59–74. [Google Scholar] [CrossRef] [Green Version]
- Reheul, D.; Cougnon, M.; Kayser, M.; Pannecoucque, J.; Swanckaert, J.; De Cauwer, B.; van den Pol-van Dasselaar, A.; De Vliegher, A. Sustainable intensification in the production of grass and forage crops in the Low Countries of north-west Europe. Grass Forage Sci. 2017, 72, 369–381. [Google Scholar] [CrossRef]
- Velthof, G.L.; Hoving, I.E.; Dolfing, J.; Smit, A.; Kuikman, P.J.; Oenema, O. Method and timing of grassland renovation affects herbage yield, nitrate leaching, and nitrous oxide emission in intensively managed grasslands. Nutr. Cycl. Agroecosyst. 2010, 86, 401–412. [Google Scholar] [CrossRef] [Green Version]
- Hoogeveen, M.W.; Daatselaar, C.H.G.; Prins, H. Afname Derogatie: Verkenning Omvang En Beweegredenen Ondernemers; Wageningen Economic Research: Wageningen, The Netherlands, 2019. [Google Scholar]
- van Dobben, H.F.; van Hinsberg, A.; Bal, D.; Mol-Dijkstra, J.P.; Wieggers, H.J.J.; Kros, J.; de Vries, W. Derivation of Critical Loads of Nitrogen for Habitat Types and Their Exceedances in the Netherlands. In Critical Loads and Dynamic Risk Assessments: Nitrogen, Acidity and Metals in Terrestrial and Aquatic Ecosystems; de Vries, W., Hettelingh, J.-P., Posch, M., Eds.; Springer: Dordrecht, The Netherlands, 2015; pp. 547–572. [Google Scholar] [CrossRef]
- Sanders, M.E.; Henkens, R.J.H.G.; Slijkerman, D.M.E. Convention on Biological Diversity: Sixth National Report of the Kingdom of the Netherlands; Statutory Research Tasks Unit for Nature & the Environment: Wageningen, The Netherlands, 2019; pp. 2352–2739. [Google Scholar]
- Dijkstra, J.; Bannink, A.; Bosma, P.M.; Lantinga, E.A.; Reijs, J.W. Modeling the effect of nutritional strategies for dairy cows on the composition of excreta nitrogen. Front. Sustain. Food Syst. 2018, 2. [Google Scholar] [CrossRef]
- Directorate-General for Climate and Energy Draft Climate Agreement; Letter to the President of the House of Representatives of the States General; The States General: The Hague, The Netherlands, 28 June 2019.
- Van Gastelen, S.; Dijkstra, J.; Bannink, A. Are dietary strategies to mitigate enteric methane emission equally effective across dairy cattle, beef cattle, and sheep? J. Dairy Sci. 2019, 102, 6109–6130. [Google Scholar] [CrossRef] [Green Version]
- Arets, E.J.M.M.; van der Kolk, J.W.H.; Hengeveld, G.M.; Lesschen, J.P.; Kramer, H.; Kuikman, P.J.; Schelhaas, N.J. Greenhouse Gas Reporting for the LULUCF sector in the Netherlands; WOt-Technical Report 146; Statutory Research Tasks Unit for Nature & the Environment: Wageningen, The Netherlands, 2020. [Google Scholar] [CrossRef] [Green Version]
Figure 1.
Trends of the area and DM yields of silage maize in the Netherlands (source: Statistics Netherlands; www.cbs.nl).
Figure 1.
Trends of the area and DM yields of silage maize in the Netherlands (source: Statistics Netherlands; www.cbs.nl).

Figure 2.
Nitrate concentration (mg NO3-N/L) of the upper groundwater (average of two years) in a sandy soil cropped with maize as related to the N source and winter cover crop. N was applied at 150 kg N/ha [37].
Figure 2.
Nitrate concentration (mg NO3-N/L) of the upper groundwater (average of two years) in a sandy soil cropped with maize as related to the N source and winter cover crop. N was applied at 150 kg N/ha [37].

Figure 3.
Trends in the N input (a) and output (b) of silage maize cropping systems on sandy soils in the Netherlands in the 1985–2018 period.
Figure 3.
Trends in the N input (a) and output (b) of silage maize cropping systems on sandy soils in the Netherlands in the 1985–2018 period.

Figure 4.
N and P surpluses and N and P use efficiencies of silage maize cropping systems on sandy soils in the Netherlands in the 1985–2018.
Figure 4.
N and P surpluses and N and P use efficiencies of silage maize cropping systems on sandy soils in the Netherlands in the 1985–2018.

Table 1.
Nutrient management policy of silage maize cultivation in the Netherlands.
| Policy | Rules for Silage Maize |
|---|---|
| Phosphorus (P) manure application standards for manure from 1987 to 2006 | Maximum P application rates for manure from 350 kg P2O5/ha in 1987 to 85 kg P2O5/ha in 2000 |
| Low ammonia emission application techniques from 1990 | Obligation to apply livestock slurry with a low ammonia emission technique, such as deep or shallow injection |
| Period in which manure application is permitted | From 1 February to 31 August for slurry (since 1995) |
| Mineral accounting system (MINAS) from 1998 to 2005 | Nitrogen (N) loss standards (based on N balance): 175 kg N/ha in 1990 to 80 kg N/ha in 2005 for arable crops on dry sandy soils; P loss standards (based on P balance): 40 kg P2O5/ha in 1998 to 20 kg P2O5/ha in 2005 for arable crops on dry sandy soils |
| Manure policy from 2006 | Standards for maximum total N application rate of total N: Currently 112–185 kg N/ha for silage maize (available N in organic fertilizers, and total N in mineral fertilizers), depending on soil type, region, and manure application standard |
| Standards for maximum P application rate (total P in organic and mineral fertilizers): 40–80 kg P2O5/ha/year, depending on the P status of the soil | |
| Standards for maximum manure application rate: 170 kg N/ha (standard of the Nitrates Directive); 250 or 230 kg N/ha (depending on soil type) for farms with a derogation to apply more manure than the standard of the Nitrates Directive | |
| Use of mineral P fertilizers is forbidden on farms with a derogation (since 2014) | |
| Obligation to grow catch crops after silage maize grown on sandy and loess soils; a catch crop has to be sown before 1 October or sown as understory (since 2019) |
Table 3.
Trends of the contents of organic matter and P status (expressed as P–Al, Pw value, and P–CaCl2) in maize land on different soil types in the 2005–2015 period * [24].
Table 3.
Trends of the contents of organic matter and P status (expressed as P–Al, Pw value, and P–CaCl2) in maize land on different soil types in the 2005–2015 period * [24].
| Soil Type | Organic Matter Content, %/year | P–Al, mg P2O5 /100 g Soil/year | Pw, mg P2O5/L Soil/year | P–CaCl2, mg P/kg Soil/year |
|---|---|---|---|---|
| Sand | 0.07 (0.03, 0.12) | n.s. | n.s. | n.s. |
| Riverine clay | 0.08 (0.00, 0.15) | n.s. | −1.13 (–2.15, −0.10) | −0.11 (–0.20, −0.02) |
| Sea clay | 0.20 (0.02, 0.39) | n.s. | n.s. | −0.12 (−0.22, −0.01) |
| Reclaimed peat | n.s. | n.s. | n.s. | n.s. |
| Loess | n.s. | n.s. | n.s. | n.s. |
| Peat | n.s. | n.s. | −2.24 (–3.99, −0.48) | −0.15 (−0.25, −0.05) |
* Based on a statistical assessment of Eurofins Agro laboratories’ (Wageningen, The Netherlands [55]) database of soil samples from agricultural soils in the Netherlands in the 2005–2015 period. The number of soil samples per soil type and per year ranged from 75 to approximately 3000. The 95% confidence interval is presented in parentheses. n.s., not significant at p < 0.05.
Publisher’s Note: MDPI stays neutral with regard to jurisdictional claims in published maps and institutional affiliations. |
© 2020 by the authors. Licensee MDPI, Basel, Switzerland. This article is an open access article distributed under the terms and conditions of the Creative Commons Attribution (CC BY) license (http://creativecommons.org/licenses/by/4.0/).
Share and Cite
MDPI and ACS Style
Velthof, G.; Schooten, H.v.; Dijk, W.v. Optimization of the Nutrient Management of Silage Maize Cropping Systems in The Netherlands: A Review. Agronomy 2020, 10, 1861. https://doi.org/10.3390/agronomy10121861
AMA Style
Velthof G, Schooten Hv, Dijk Wv. Optimization of the Nutrient Management of Silage Maize Cropping Systems in The Netherlands: A Review. Agronomy. 2020; 10(12):1861. https://doi.org/10.3390/agronomy10121861
Chicago/Turabian StyleVelthof, Gerard, Herman van Schooten, and Wim van Dijk. 2020. "Optimization of the Nutrient Management of Silage Maize Cropping Systems in The Netherlands: A Review" Agronomy 10, no. 12: 1861. https://doi.org/10.3390/agronomy10121861
Note that from the first issue of 2016, this journal uses article numbers instead of page numbers. See further details here.