Article

Complete Mitochondrial Genome and a Set of 10 Novel Kompetitive Allele-Specific PCR Markers in Ginseng (Panax ginseng C. A. Mey.)

1
Department of Herbal Crop Research, National Institute of Horticultural and Herbal Science (NIHHS), Rural Development Administration (RDA), Eumseong 27709, Korea
2
Phyzen Genomics Institute, Seongnam 13558, Korea
3
Department of Industrial Plant Science and Technology, Chungbuk National University, Cheongju 28644, Korea
*
Authors to whom correspondence should be addressed.
Agronomy 2020, 10(12), 1868; https://doi.org/10.3390/agronomy10121868
Submission received: 28 October 2020 / Revised: 19 November 2020 / Accepted: 25 November 2020 / Published: 26 November 2020
(This article belongs to the Section Crop Breeding and Genetics)

Abstract

:
Panax ginseng C. A. Mey., a perennial herb belonging to the family Araliaceae, is a valuable medicinal plant with distinctive biological characteristics. However, comprehensive analyses of the mitochondrial genome (mitogenome) are lacking. In this study, we sequenced the complete mitogenome of ginseng based on long-read data from the Nanopore sequencing platform. The mitogenome was assembled into a “master circle” form of 464,705 bp and contained 72 unique genes. The genome had three large repeat regions, and 10.42% of the sequences were mitogenome sequences of plastid origin (MTPTs). In total, 278 variants (213 SNPs and 65 InDels) were discovered, most of which were identified in intergenic regions. The MTPT regions were mutational hotspots, harboring 74.5% of the variants. The ginseng mitogenome showed a higher mutation rate than that of the chloroplast genome, and this pattern is uncommon in plants. In addition, 10 Kompetitive allele-specific PCR (KASP) markers were developed from 10 SNPs, excluding those in MTPT regions. These markers accurately identified the genotypes of 59 Korean ginseng accessions and elucidated mitogenome diversity. These results provide insight into organellar genomes and genetic diversity in ginseng. Moreover, the complete mitogenome sequence and 10 KASP markers will be useful for ginseng research and breeding.

1. Introduction

Panax ginseng C. A. Mey., a perennial herb belonging to the family Araliaceae, is a valuable medicinal crop [1]. Ginseng is one of the most well-known plants in the world [2], and its components have various pharmacological effects, such as immunity intensification, antioxidant activity, and antiaging effects [3,4,5]. Owing to these beneficial effects, its use is expanding to other fields, including the development of functional beverages and cosmetics [6,7]. However, ginseng grows very slowly, with a long life cycle of at least 4 years [8]. The seed production per plant is significantly lower than that of other major crops; therefore, a lot of effort is required to construct breeding populations. To effectively utilize ginseng, it is necessary to develop efficient genetic tools for crop improvement.
Mitochondria are essential organelles in most eukaryotic organisms, with vital roles in cellular energy production [9]. They contain an independent mitochondrial genome (mitogenome), which usually shows maternal inheritance [10]. The plant mitogenome varies substantially across species [11,12] and can show multipartite architectures within a species due to scattered repetitive sequences [13,14,15]. Mitogenomes in plants exhibit far lower mutation rates than those of their nuclear or chloroplast counterparts; accordingly, the structure and gene organization are highly conserved within a species [16]. This characteristic provides useful information for evolutionary and phylogenetic studies [17,18].
Recently, there has been significant progress in genomic research on ginseng. Reference nuclear and chloroplast genome sequences of various ginseng resources have been reported, providing essential information for genetic studies [19,20,21,22,23]. However, the ginseng mitogenome is poorly understood, and only unverified sequence data are available in GenBank (accession no. KF735063). Mitogenome sequencing is a challenging task owing to its structural complexity. However, technological advances, including the development of long-read sequencing platforms and assembly programs, have made mitogenome sequencing feasible. To gain a deeper understanding of the ginseng genome, the completion of the mitogenome sequence from official cultivars and comprehensive studies is required.
DNA molecular markers are useful tools for crop improvement [24] and for studies of genetic diversity and species authentication [25,26]. DNA molecular marker techniques have recently been developed for rapid and accurate genotype identification. Kompetitive allele-specific PCR (KASP) is an efficient molecular marker system that can be used to simultaneously analyze the genotype of many specimens using fluorescence signals [27]. The combination of efficient KASP markers and the conserved mitogenome can facilitate molecular breeding.
In this study, we sequenced and characterized the complete ginseng mitogenome using an official cultivar. We discovered various polymorphisms by a comparative analysis and developed KASP markers from single-nucleotide polymorphisms (SNPs) at a specific locus. The markers were used to elucidate the mitogenome diversity among ginseng accessions. We performed the first analysis of diversity in ginseng mitogenome and observed an unusually high mutation rate. These results broaden our understanding of organellar genomes and genetic diversity in ginseng. The newly developed KASP markers are expected to be used as essential genetic tools for efficient ginseng breeding and further research, including pedigree and population structure analyses.

2. Materials and Methods

2.1. Sampling, DNA Extraction, and Sequencing

Three Panax species were used (Table S1). Fresh leaves from 59 P. ginseng C. A. Mey., including 12 cultivars and 47 breeding lines, 10 P. quinquefolius L., and 10 P. notoginseng (Burk.) F. H. Chen were collected from the National Institute of Horticultural and Herbal Science (Table S1; Eumseong, Korea). Genomic DNA from 79 individual plants was extracted from ~100 mg of frozen leaves using the DNeasy Plant Mini Kit (Qiagen, Hilden, Germany) following the manufacturer’s instructions. The DNA quantity and quality were checked using a QIAxpert system (Qiagen). P. ginseng cv. “Gumpoong” was selected as a representative cultivar and 2 μg of DNA was provided to PHYZEN (Seongnam, Korea) for library construction and sequencing. Oxford Nanopore and Illumina MiSeq libraries were prepared using a Rapid Sequencing Kit (SQK-RAD004, Oxford Nanopore Technologies (ONT), Oxford, UK) and the TruSeq Nano DNA Kit (Illumina, San Diego, CA, USA), respectively, in accordance with the manufacturers’ instructions. The two genomic libraries were sequenced using the Oxford Nanopore MinION and Illumina MiSeq sequencing platforms.

2.2. Mitogenome Assembly and Annotation

Raw ONT sequencing data were trimmed using Porechop v. 0.2.3 (https://github.com/rrwick/Porechop), and an in-house script was used to remove adaptor sequences and chimeric sequences. The trimmed ONT sequencing data were self-corrected using Canu assembler v. 1.71 (https://github.com/marbl/canu) with default parameters, and corrected ONT reads were assembled de novo using SMARTdenovo (https://github.com/ruanjue/smartdenovo). Assembled contigs were used as inputs for BLASTN [28] searches against the National Center for Biotechnology Information (NCBI) mitochondrion database (https://ftp.ncbi.nlm.nih.gov/refseq/release/mitochondrion/) with an E-value threshold of 1E-6, after which only mitochondrial contigs longer than 10,000 bp showing 95% identity were selected. Overlapping contigs were used to assemble, and one side of the overlapped sequences was removed to join the mitochondrial contigs. The Illumina MiSeq reads were trimmed using the CLC quality trim tool with default parameters and mapped on the assembled mitogenome using the clc_ref_assemble tool in the CLC Assembly Cell package (v. 4.21, CLC Inc., Aarhus, Denmark). Error correction was conducted by manual curation. The completed mitogenome sequence was annotated using the GeSeq tool with default parameters [29]. Five mitogenome data from Bupleurum falcatum L. (GenBank accession no. KX887330), Cynanchum auriculatum Ait. (GenBank accession no. MH410146-MH410148), Cynanchum wilfordii (Max.) Hemsl. (GenBank accession no. MF611847-MF611849), Panax ginseng C. A. Mey. (GenBank accession no. KF735063), and Utricularia reniformis A. St. -Hil. (GenBank accession no. NC_034982) were used as references for primary annotation. The precise gene regions were determined by manual curation using BLAST searches [28]. A circular map of the annotated genome was visualized using OrganellarGenomeDRAW [30]. Large repeat structures were identified using BLASTZ [31], and tandem repeat (TR) sequences were discovered using the MISA-web program with custom parameters [32]. The completed mitogenome sequence and annotation data were deposited in the NCBI database.

2.3. Comparative Analysis

Assembled mitogenome sequences of cv. “Gumpoong” (GenBank accession no. MW029460) were compared with the registered mitogenome sequence of P. ginseng C. A. Mey. (GenBank accession no. KF735063) in the NCBI database as the reference sequence. A multiple sequence alignment of mitogenome sequences was generated using MAFFT [33]. To identify variants, including SNPs and InDels, in the mitogenome, a modified version of msaTovcf (using an in-house script) was used [34]. The variant positions were determined based on the reference ginseng mitogenome sequence. In addition, the chloroplast sequence of ginseng (GenBank accession no. KM067388) was used to explore regions showing a high homology with the plastid genome in the assembled mitogenomes. Sequences longer than 500 bp showing over 95% identity were selected using BLASTN with an E-value threshold of 1E-6 [28].

2.4. KASP Marker Development

From the SNPs identified in the mitogenome, 10 SNP sites lacking homology with the ginseng chloroplast genome were used to develop candidate KASP markers. The SNP information was sent to LGC (Teddington, UK), including 100-bp flanking sequences on both sides, to design two allele-specific forward primers and a common reverse primer. KASP amplification and allelic discrimination were performed using the Nexar system (LGC Douglas Scientific, Alexandria, VA, USA) in the Seed Industry Promotion Center (Gimje, Korea). An aliquot (0.8 μL) of 2× Master Mix (LGC Genomics), 0.02 μL of 72× KASP assay mix (LGC Genomics), and 5 ng of genomic DNA template were mixed in a 1.6 μL KASP reaction mixture in a 384-well Array Tape. The reactions were run in duplicate, including non-template controls as negative controls. KASP amplification was performed using the following thermal cycling profile: 15 min at 94 °C, a touchdown phase of 10 cycles of 94 °C for 20 s and 61 °C to 55 °C (dropping 0.6 °C per cycle) or 68 °C to 62 °C (dropping 0.6 °C per cycle) for 60 s, followed by 26 cycles of 94 °C for 20 s and 55 °C or 62 °C for 60 s (first PCR stage). Next, recycling was performed using three cycles of 94 °C for 20 s and 57 °C for 60 s (second PCR stage). Fluorescence was read for KASP genotyping after PCR.

2.5. KASP Marker Application

The 10 KASP primer set was applied to 79 ginseng accessions, including 59 P. ginseng C. A. Mey., 10 P. quinquefolius L., and 10 P. notoginseng (Burk.) F. H. Chen accessions, for validation. The genotypes of each polymorphic locus were used for a genetic diversity analysis. The number of alleles (NA), major allele frequency (MAF), gene diversity (GD), polymorphism information content (PIC), and Nei’s genetic distance [35] for each SNP locus were calculated using PowerMarker v. 3.25 [36]. A clustering analysis of Panax species was performed based on Nei’s genetic distances and the unweighted pair group method with arithmetic mean (UPGMA) [37] using PowerMarker.

3. Results

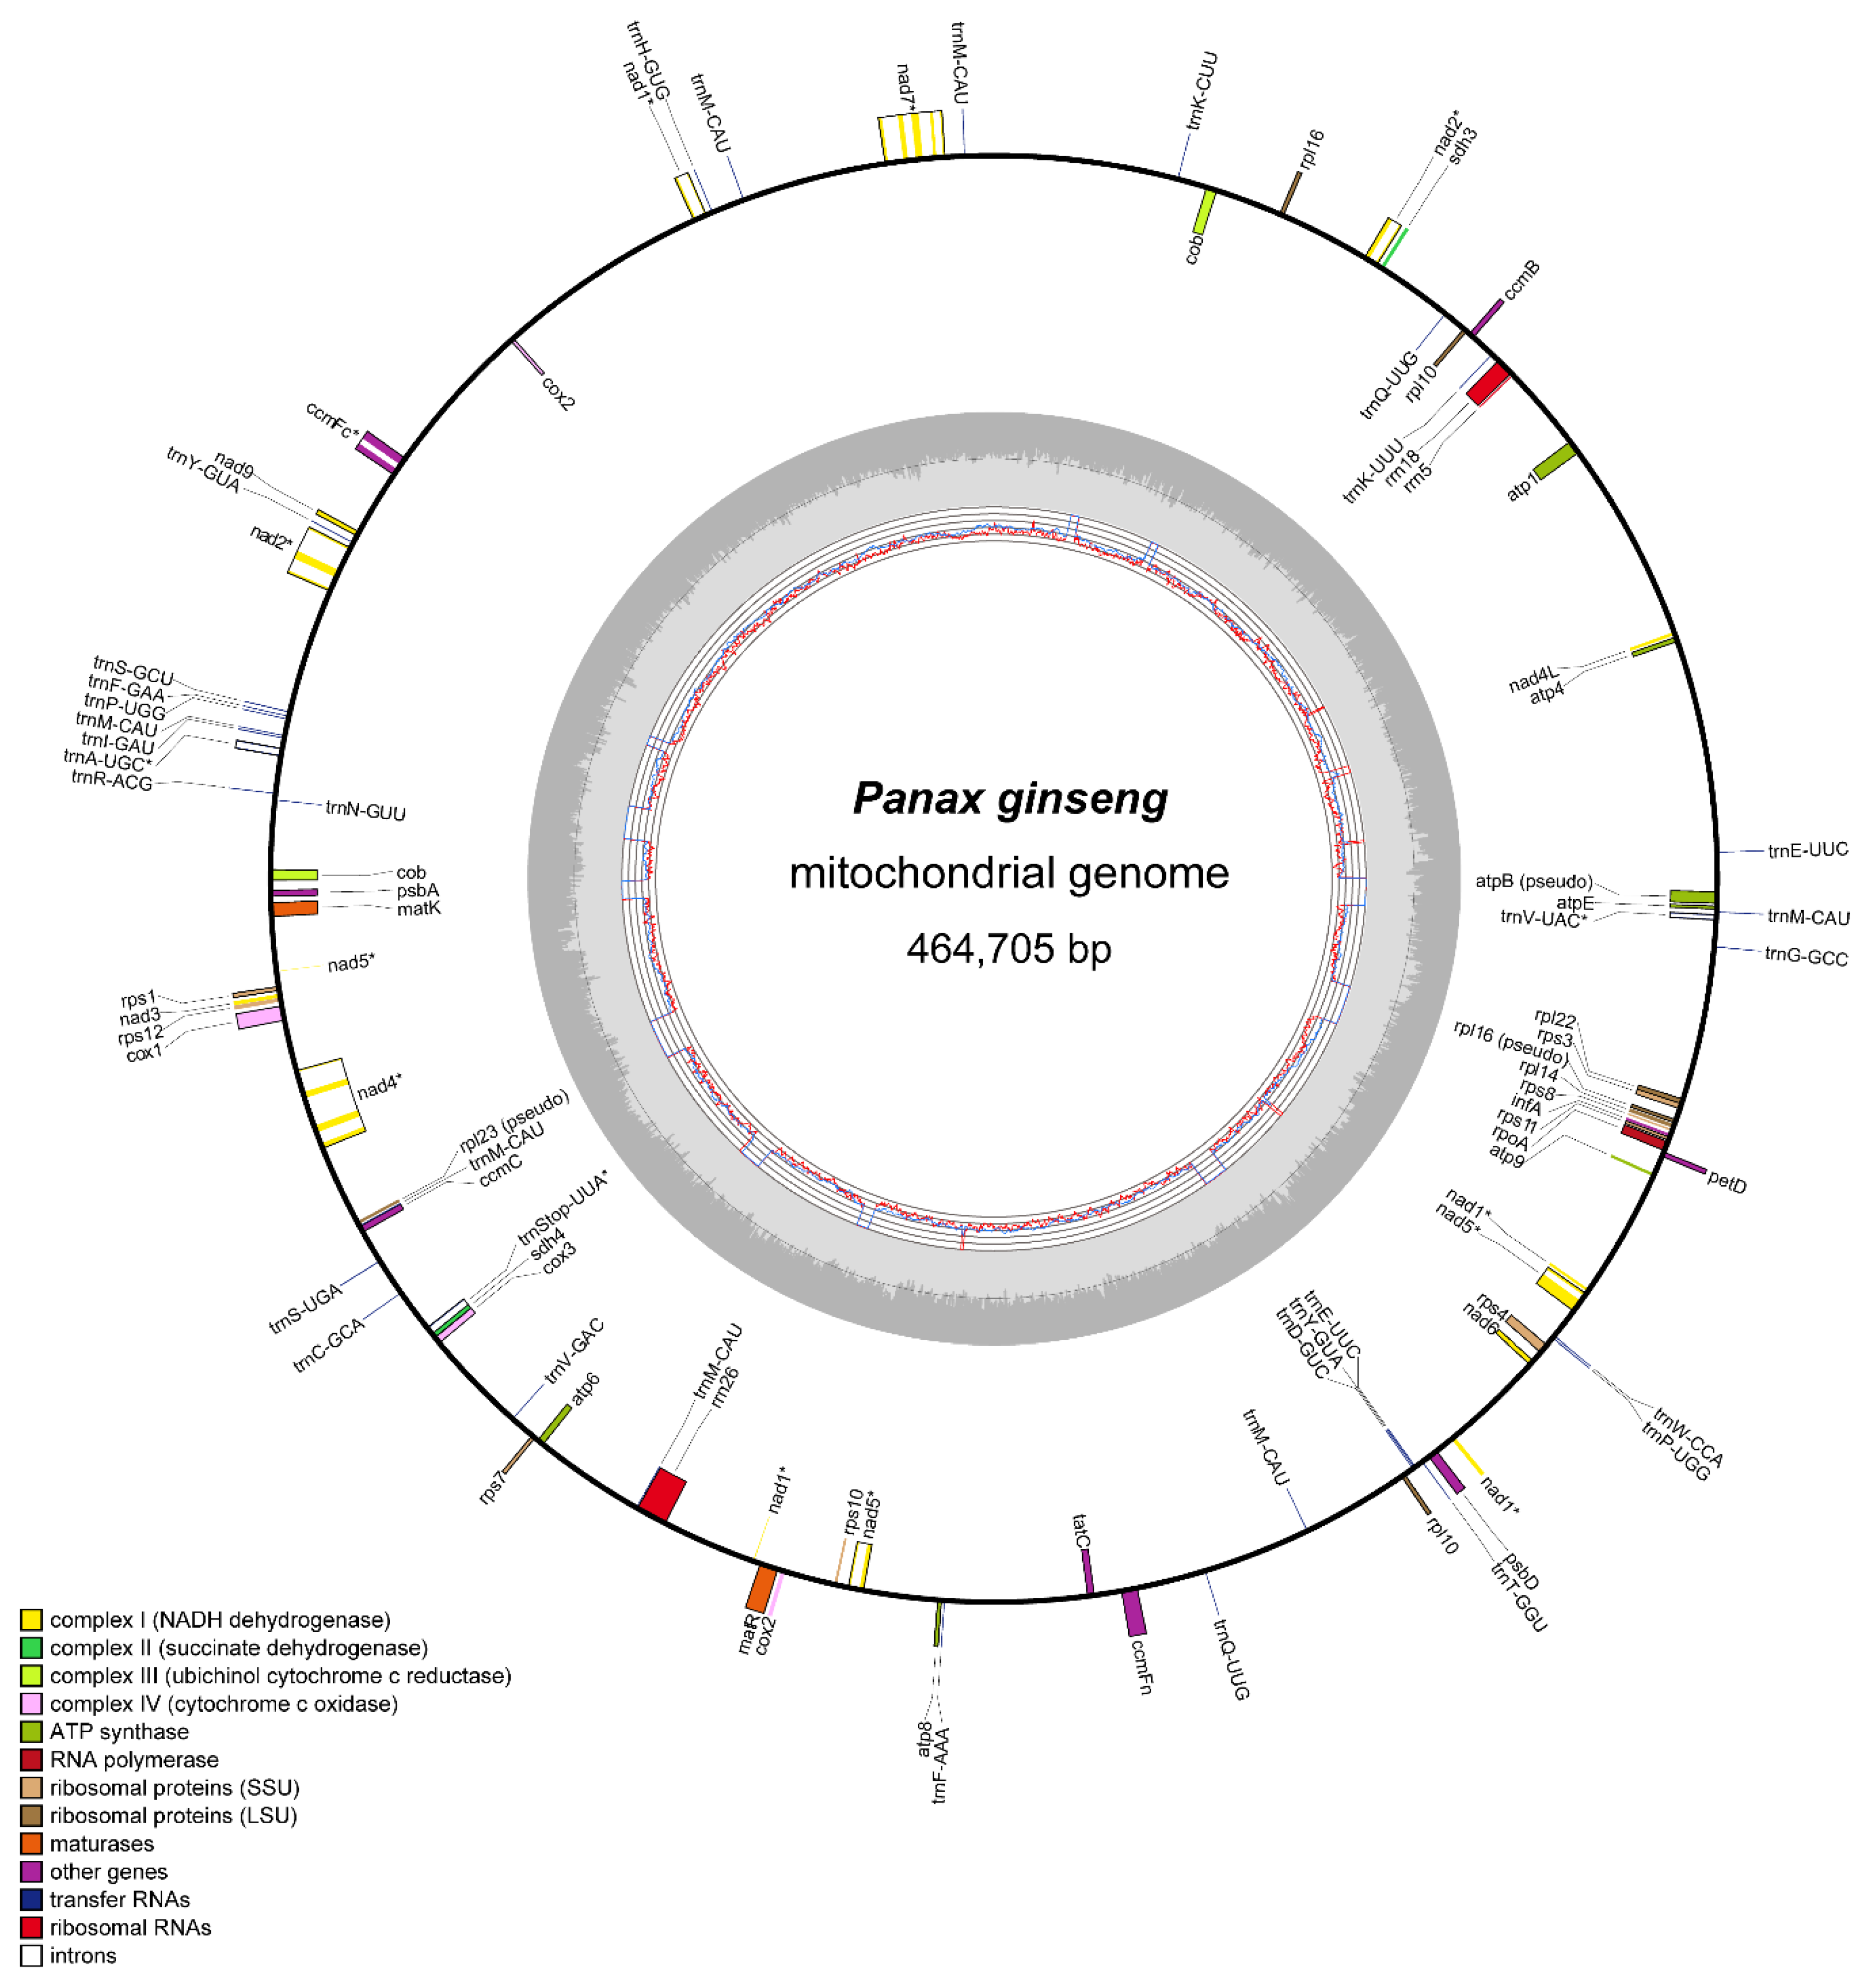
3.1. Complete Mitogenome Sequence of P. ginseng

We obtained the complete mitogenome sequence of P. ginseng cv. “Gumpoong” (GenBank accession no. MW029460) based on long-read data from ONT platforms. Short reads from the MiSeq platform were used for error correction. The total amounts of long- and short-reads were approximately 6.78 Gb and 5.58 Gb, respectively (Table S2). The de novo assembled sequence was 464,705 bp and had a single circular form (Figure 1). The new ginseng mitogenome was slightly larger than the previously reported genome (464,680 bp, GenBank accession no. KF735063). The average read depths were about 110× and 165×, respectively. The ginseng mitogenome encoded 72 unique genes, including 45 protein-coding, 24 tRNA, and 3 rRNA genes (Table 1; Table S3). Among these, seven genes (cob, rpl10, trnE-UUC, trnM-CAU, trnP-UGG, trnQ-UUG, and trnY-GUA) were duplicated in the mitogenome, and seven copies of the trnM-CAU gene were identified. As a result of the gene duplication, 84 genes encoding 47 proteins, 34 tRNAs, and 3 rRNAs were identified in the ginseng mitogenome. In addition, 10 genes (ccmFc, cox2, nad1, nad2, nad4, nad5, nad7, trnA-UGC, trnStop-UUA, and trnV-UAC) had two or more exonic regions, and four genes (cox2, nad1, nad2, and nad5) had exonic regions that were located far apart (Table S3). Most of the protein-coding genes in the mitogenome had the common start codon (ATG); however, three additional types of start codons were also identified: ACG (cox1, nad4L, rps1, and rps10; C to U RNA-editing), ATA (tatC; A to G RNA-editing), and GTG (atp1; G-to-A RNA editing on the first site).

3.2. Structure and Variation in Ginseng Mitogenome

The ginseng mitogenome harbored three large repeat structures, including two direct repeats and one inverted repeat (Figure 2). Two protein-coding genes (cob and rpl10) were duplicated due to these large repeat blocks. A total of 42 TR sequences were identified, mainly mononucleotides (18) and nonanucleotides (13) (Table S4). Mitogenome sequences of plastid origin (MTPTs), transferred from the plastid genome, were 48,463 bp (10.42%) in length (Table S5). The newly assembled ginseng mitogenome was highly similar to the reference sequence (GenBank accession no. KF735063), with a sequence identity of 99.8%. A comparative analysis of the two genomes revealed 278 polymorphisms, including 213 SNPs and 65 InDels, in the ginseng mitogenome (Table S6–S7). Most polymorphisms were located in intergenic regions; however, approximately 10.1% of the variants (24 SNPs and 4 InDels) were located in genic regions. In particular, the MTPT regions were mutational hotspots, including 74.5% of the variants (165 SNPs and 42 InDels) (Figure 2).

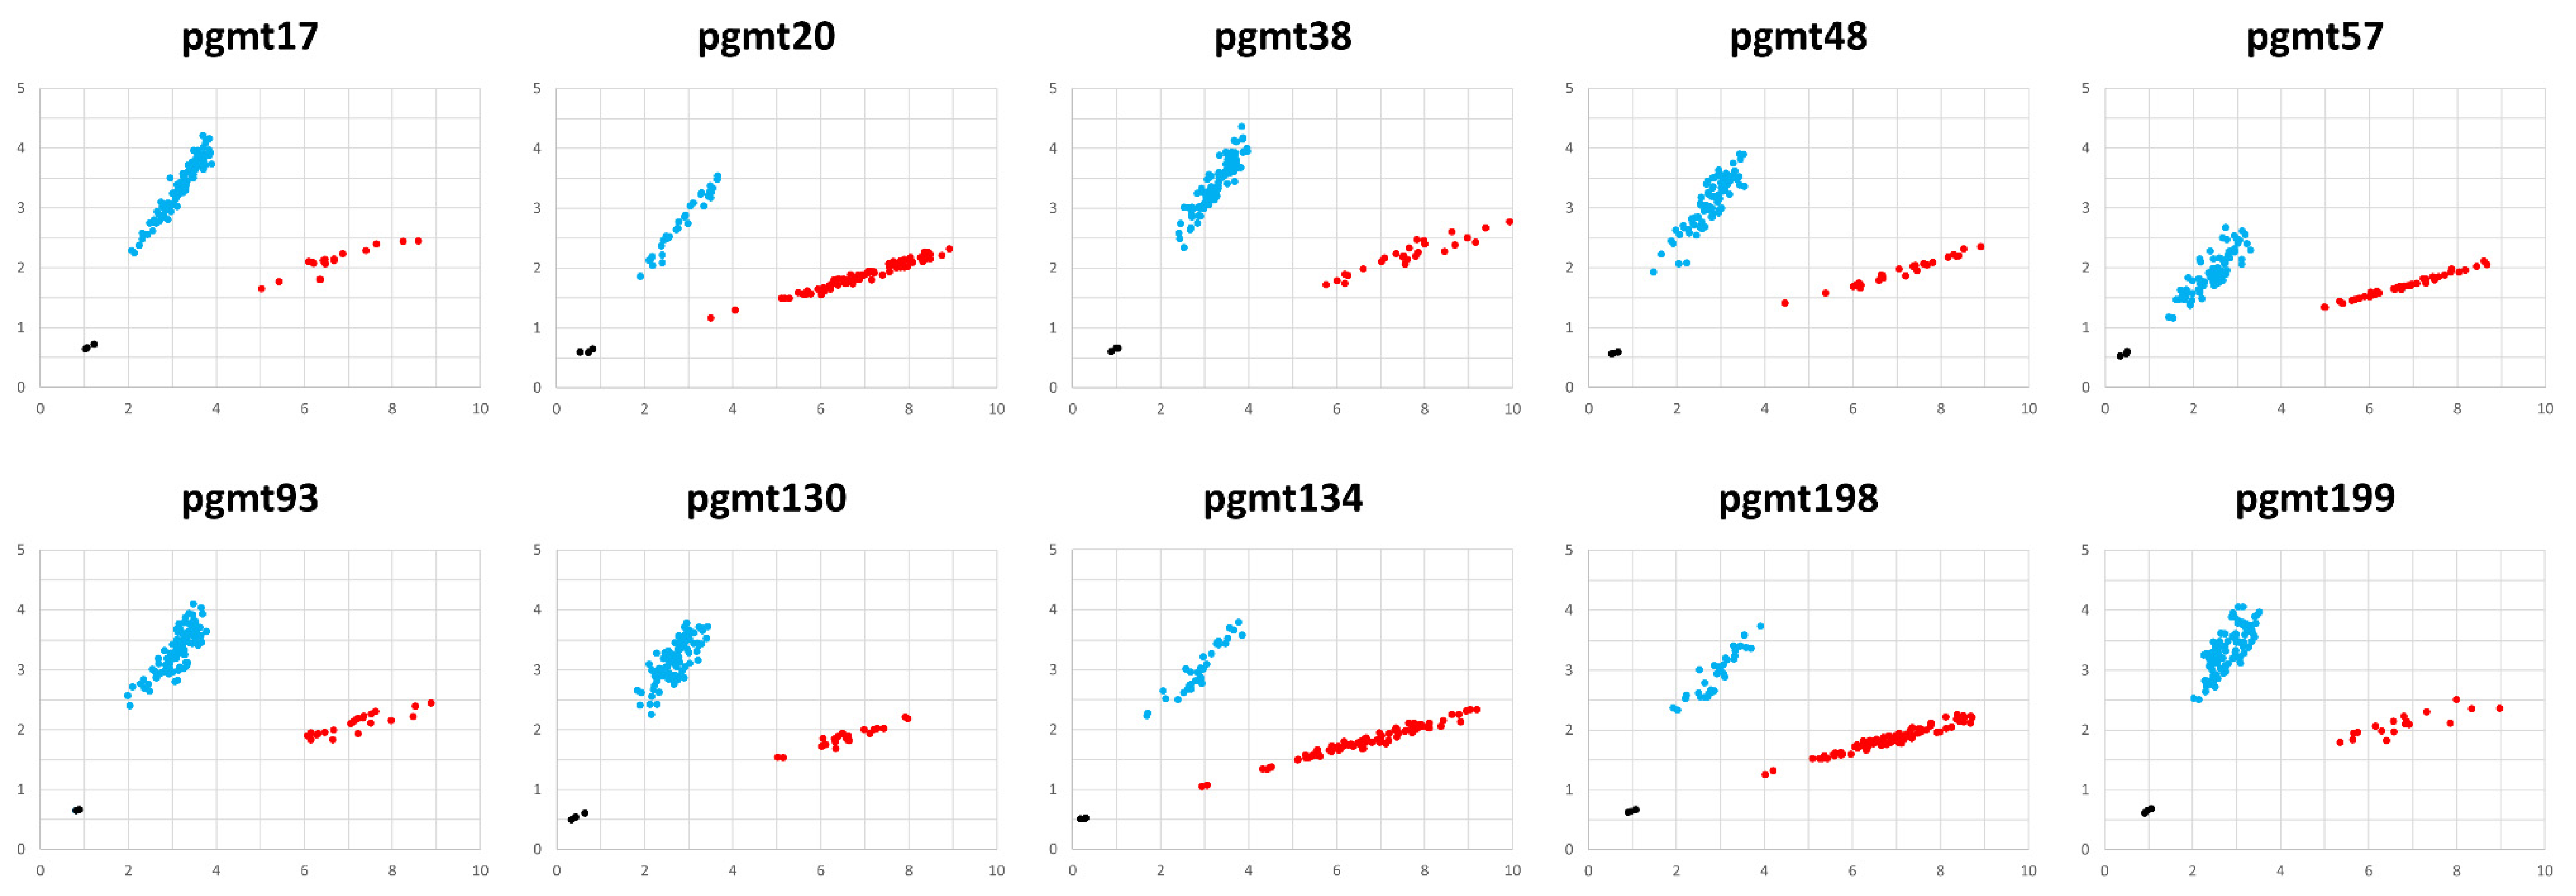
3.3. Development and Validation of KASP Markers

We developed allele-specific markers based on the SNPs and their 100-bp flanking sequences. Ten candidate SNPs were selected and a KASP primer set was designed (Table 2). The primer set was used to validate the polymorphisms and to genotype 79 ginseng accessions, including three Panax species. All the KASP markers provided genotyping results that could be classified into two clusters (Figure 3, Table S8). The Korean ginseng samples showed diverse genotypes, whereas each of the 10 American and 10 Chinese ginseng samples had no variation within populations. The pgmt20 and pgmt199 loci were not identified in Chinese ginseng accessions.

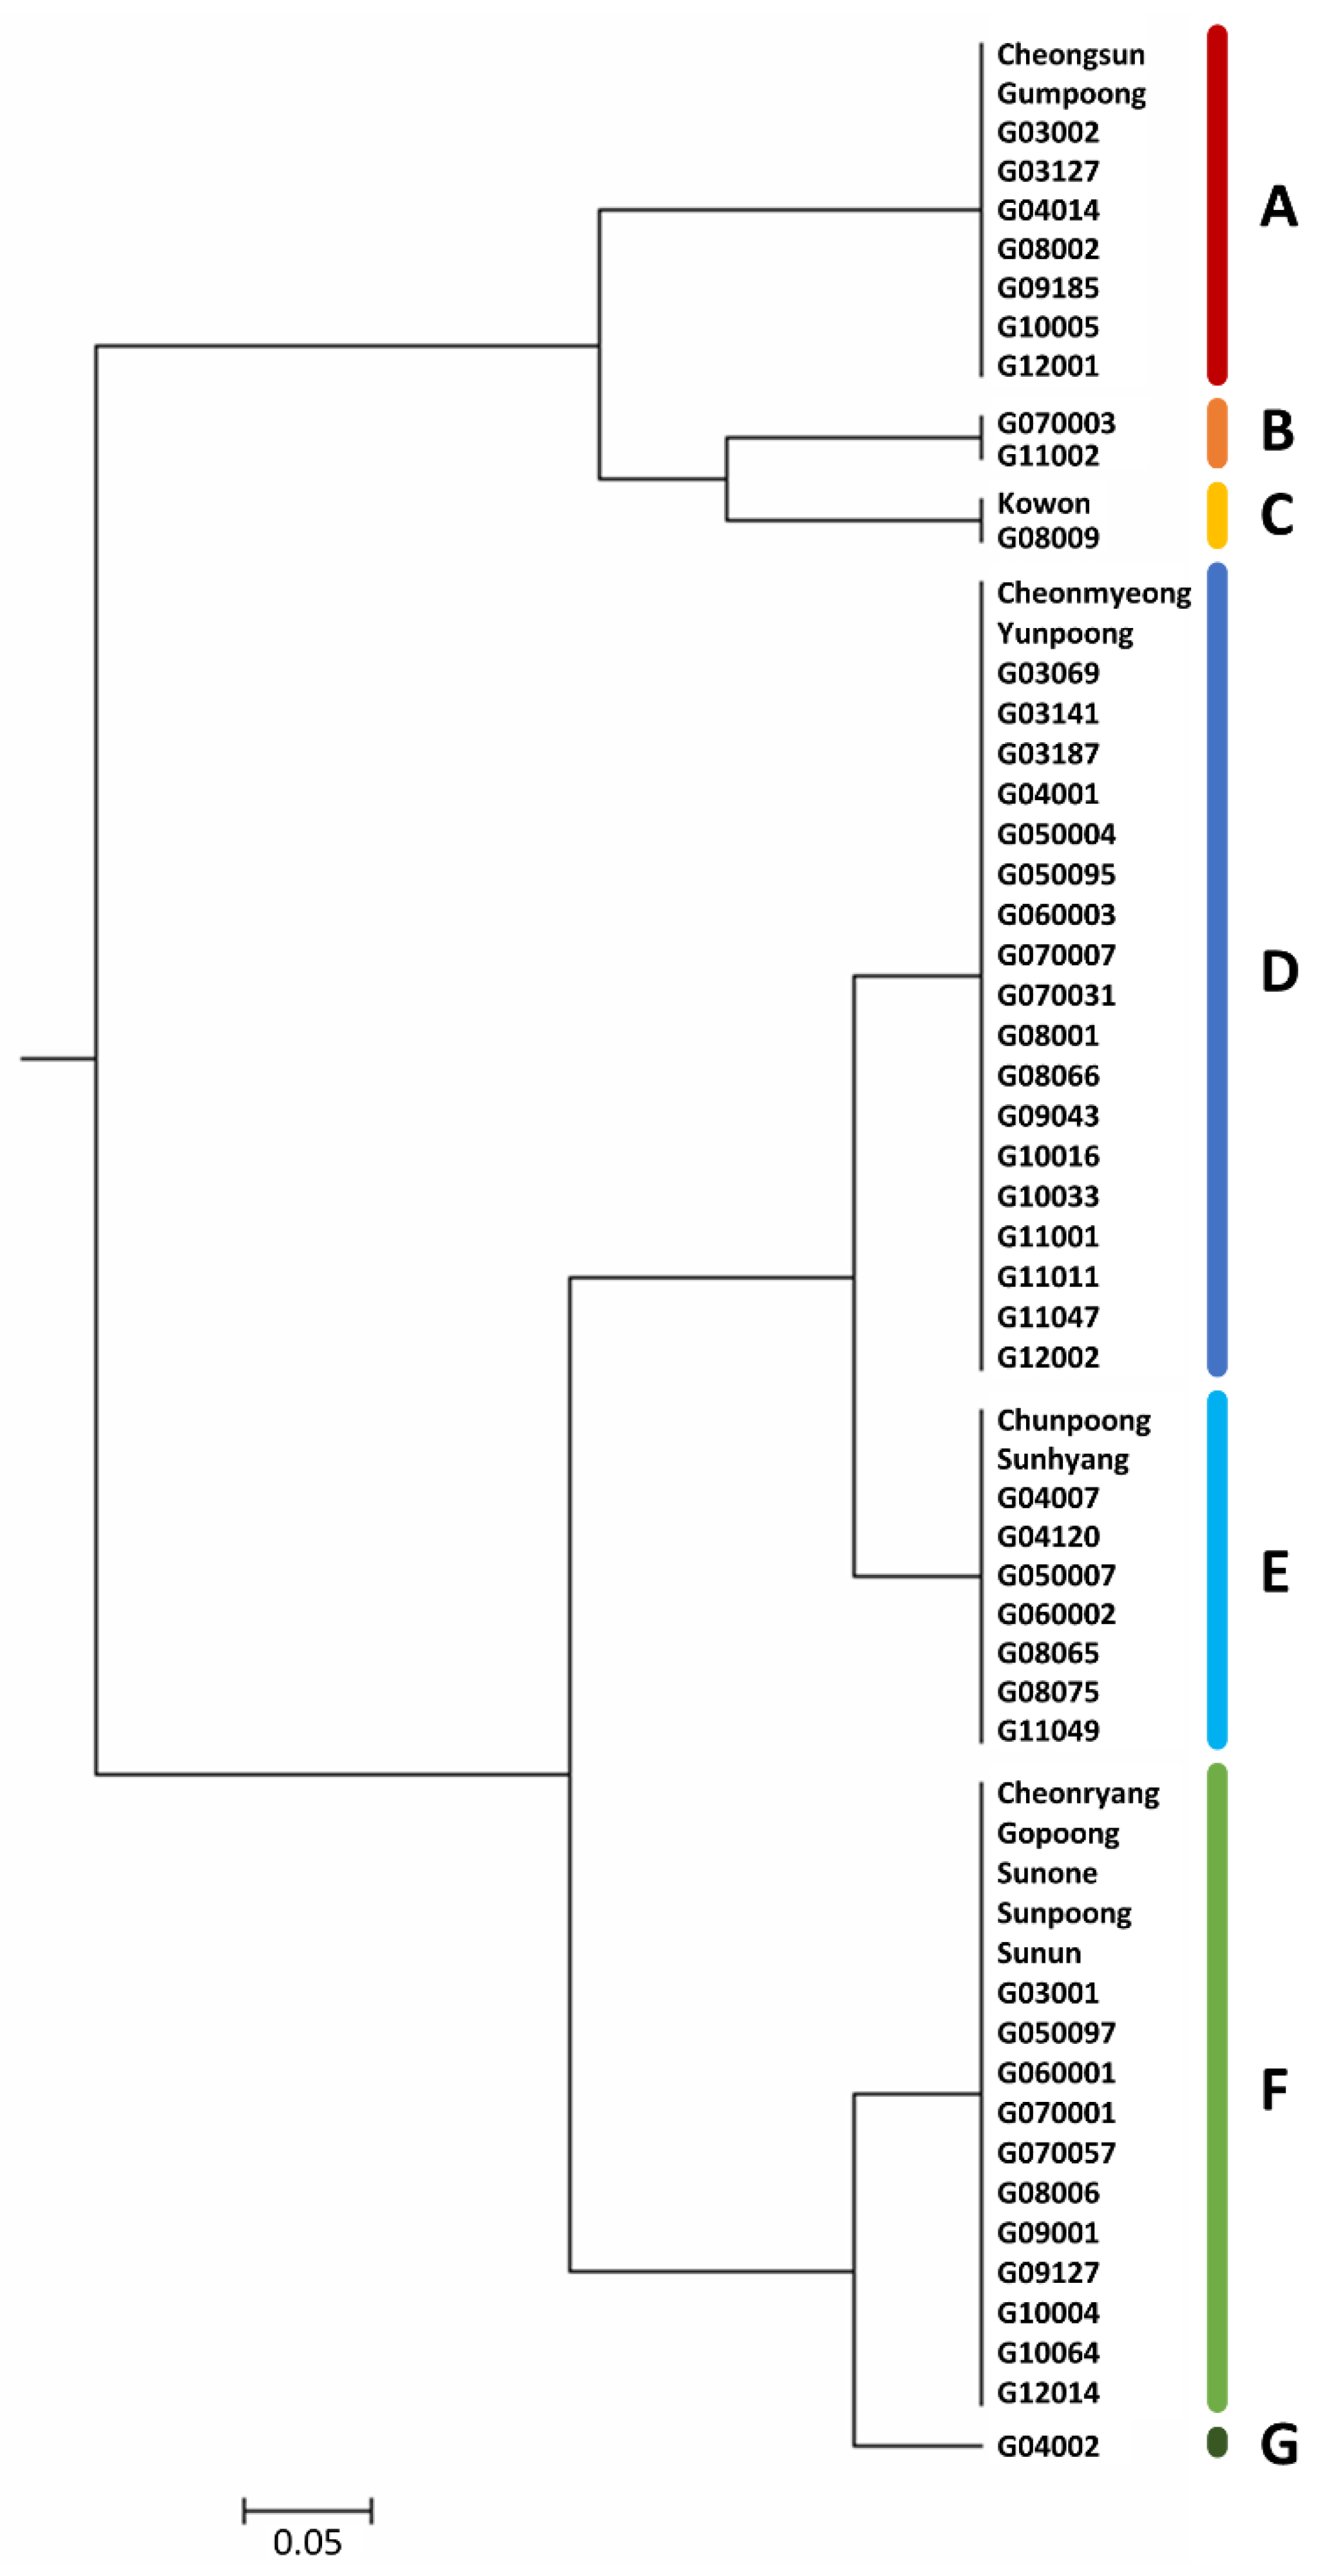
3.4. Genetic Diversity in Ginseng

The genotypes of 59 Korean ginseng accessions were surveyed based on the 10 KASP markers (Table S8). The KASP markers exhibited polymorphism among the Korean accessions. We used them to evaluate the diversity in the ginseng mitogenome (Table 3). All the KASP loci had two alleles, as expected, and the MAF at each locus ranged from 62.71% for pgmt57 to 84.75% for pgmt17 and pgmt199. On average, 76.61% of the accessions contained a common major allele. The GD for each locus ranged from 0.2585 to 0.4677, with an average of 0.3494. The PIC values for KASP markers from mitogenomes ranged from 0.2251 to 0.3583, with an average of 0.2862. A clustering analysis of Korean ginseng accessions showed that the populations could be divided into seven groups based on the mitogenome haplotypes (Figure 4).

4. Discussion

Plant mitogenomes are larger than those of animals [9,11,12]. Because these genomes have a complex structure, sequencing is very labor-intensive. The recent development of various assembly technologies has make it possible to obtain long and accurate sequences [38]. Complete mitogenome sequences have been reported for many plants [39,40,41]. However, in ginseng detailed studies of the mitogenome sequence are lacking, and only unverified sequence data (GenBank accession no. KF735063) have been reported. We assembled the complete ginseng mitogenome sequence into a 464,705-bp-long “master circle” based on long-read data (Figure 1). In vascular plants, the mitogenome often has a multipartite architecture derived from recombination between large repeats [42,43]. Ginseng also has three large repeat structures in the mitogenome, but a unique circular genome has been maintained for a long time.
Mitogenomes in plants generally exhibit lower variation rates than those of other intracellular genomes [16]. Accordingly, their structure and gene contents are highly conserved within a species. However, the results for ginseng differed from established theory [44]. A previous study of diverse cultivated ginseng accessions identified low levels of variation, including six SNPs and six InDels, in the chloroplast genome [22], whereas the newly assembled ginseng mitogenome had 278 polymorphisms (i.e., an increase of >23-fold), including 213 SNPs and 65 InDels. A similar phenomenon has been observed in algae and a few land plants [43,45,46]. These variations mainly occur in intergenic regions or in coding regions as synonymous substitutions [47,48]. This observation could be explained by the specific DNA repair mechanisms for the mitogenome [49,50]. In fact, variations occur frequently in the mitogenome; however, the nucleotide substitution rates are low in coding regions [47,51]. Most polymorphisms in the ginseng mitogenome were found in intergenic regions (90.0%), especially in the MTPT regions (74.5%). These results strongly support the hypothesis that a higher variation rate in the mitogenome than in the chloroplast among land plants might not be as uncommon as once thought.
The development of accurate molecular markers in ginseng is very difficult owing to the extensive repetitive regions [52,53] and, in particular, paralogous regions arising from recent whole genome duplication events [19,54]. Accordingly, molecular marker development should be performed with caution [55]. An approach based on the mitogenome or chloroplast genome could be a more efficient method. We successfully developed 10 KASP markers based on the SNPs in the ginseng mitogenome. The SNPs in MTPT regions were excluded to prevent misinterpretation caused by simultaneous amplification in the two organellar genomes [56]. The effectiveness of the 10 KASP markers developed in this study was validated to identify clear genotypes for various ginseng accessions simultaneously. We also characterized the mitogenome diversity in ginseng using the newly developed KASP markers. In a previous study, ginseng showed lower variation rates in the nuclear genome; however, high levels of diversity at the polymorphic loci were observed [25,57,58]. The ginseng mitogenome exhibited a lower diversity than that of the nuclear genome; however, there were many more polymorphisms in the mitogenome than in the chloroplast genome. Although the GD and PIC values were low because they are mitogenome-derived markers, the ginseng accessions were effectively classified based on mitogenome haplotypes using these KASP markers. In addition, since the mitogenome shows uniparental inheritance and has more polymorphisms than the chloroplast genome, it is advantageous for classifying resources and pedigree analyses. These KASP markers will be great supports for ginseng breeding where molecular breeding systems are not well established.
In this study, we sequenced the complete ginseng mitogenome using the official cultivar “Gumpoong” based on long-read data. Through a comprehensive sequence analysis, the structural characteristics of the ginseng mitogenome were determined, and an unusually high level of variation was observed. In addition, we developed 10 KASP markers to evaluate the diversity in ginseng mitogenomes and to classify ginseng accessions. We performed the first analysis of mitogenome diversity to date. These results broaden our understanding of the genetic diversity in ginseng and provide insight into the organellar genome. Furthermore, the complete mitogenome sequence will provide essential information for further studies, and the newly developed KASP markers will be essential genetic tools for efficient ginseng breeding.

Supplementary Materials

The following are available online at https://www.mdpi.com/2073-4395/10/12/1868/s1, Table S1: Sample information of 79 ginseng accessions used in this study; Table S2: Statistics of WGS and assembly summary for P. ginseng mitogenome; Table S3: Gene annotation summary for P. ginseng mitogenome; Table S4: Tandem repeats information in P. ginseng mitogenome; Table S5: BLASTN results between P. ginseng mitogenome and chloroplast genome; Table S6: SNP information in P. ginseng mitogenome; Table S7: InDel information in P. ginseng mitogenome; Table S8: Genotype and group information of 79 ginseng accessions.

Author Contributions

Conception and design: W.J., J.-W.C., and I.-H.J.; provided samples for the experiment: J.-U.K., J.-W.L., K.-H.B.; performed experiment: C.-E.H.; annotation: H.O.L.; data analysis: W.J., H.O.L., and I.-H.J.; data interpretation: all authors; writing: W.J.; review: J.-W.C., and I.-H.J. All authors have read and agreed to the published version of the manuscript.

Funding

This work was conducted with the support of the Cooperative Research Program for Agriculture Science & Technology Development (Project No. PJ01312401), Rural Development Administration, Republic of Korea.

Acknowledgments

This study was supported by 2020 the RDA Fellowship Program of National Institute of Horticultural and Herbal Science, Rural Development Administration, Republic of Korea.

Conflicts of Interest

The authors declare that there are no conflicts of interest.

Data Availability

The sequencing reads have been deposited in the NCBI database under BioProject accession no. PRJNA678803; the link is https://www.ncbi.nlm.nih.gov/bioproject/PRJNA678803 (the SRA accession no. of ONT and Illumina reads are SRX9517745 and SRX9517746, respectively). Mitogenome sequence data from this article can be found in the GenBank data libraries under the accession number MW029460.

References

  1. Yun, T.K. Brief introduction of Panax ginseng C. A. Meyer. J. Korean Med. Sci. 2001, 16 (Suppl. S3–S5). [Google Scholar] [CrossRef] [Green Version]
  2. Baeg, I.H.; So, S.H. The world ginseng market and the ginseng (Korea). J. Ginseng. Res. 2013, 37, 1–7. [Google Scholar] [CrossRef] [Green Version]
  3. Quan, F.S.; Compans, R.W.; Cho, Y.-K.; Kang, S.-M. Ginseng and Salviae herbs play a role as immune activators and modulate immune responses during influenza virus infection. Vaccine 2007, 25, 272–282. [Google Scholar] [CrossRef]
  4. Keum, Y.-S.; Park, K.-K.; Lee, J.-M.; Chun, K.-S.; Park, J.H.; Lee, S.K.; Kwon, H.; Surh, Y.-J. Antioxidant and anti-tumor promoting activities of the methanol extract of heat-processed ginseng. Cancer Lett. 2000, 150, 41–48. [Google Scholar] [CrossRef]
  5. Lee, H.-S.; Kim, M.-R.; Park, Y.; Park, H.J.; Chang, U.J.; Kim, S.Y.; Suh, H.J. Fermenting red ginseng enhances its safety and efficacy as a novel skin care anti-aging ingredient: In vitro and animal study. J. Med. Food 2012, 15, 1015–1023. [Google Scholar] [CrossRef] [Green Version]
  6. Jimenez-Perez, Z.E.; Singh, P.; Kim, Y.J.; Mathiyalagan, R.; Kim, D.H.; Lee, M.H.; Yang, D.C. Applications of Panax ginseng leaves-mediated gold nanoparticles in cosmetics relation to antioxidant, moisture retention, and whitening effect on B16BL6 cells. J. Ginseng. Res. 2018, 42, 327–333. [Google Scholar] [CrossRef]
  7. Tamamoto, L.C.; Schmidt, S.J.; Lee, S.Y. Sensory profile of a model energy drink with varying levels of functional ingredients-caffeine, ginseng, and taurine. J. Food Sci. 2010, 75, S271–S278. [Google Scholar] [CrossRef]
  8. Choi, K.T. Botanical characteristics, pharmacological effects and medicinal components of Korean Panax ginseng C. A. Meyer. Acta Pharmacol. Sin. 2008, 29, 1109–1118. [Google Scholar] [CrossRef] [Green Version]
  9. Mackenzie, S.; McIntosh, L. Higher plant mitochondria. Plant Cell 1999, 11, 571–586. [Google Scholar] [CrossRef]
  10. Birky, C.W., Jr. The inheritance of genes in mitochondria and chloroplasts: Laws, mechanisms, and models. Ann. Rev. Genet. 2001, 35, 125–148. [Google Scholar] [CrossRef]
  11. Ward, B.L.; Anderson, R.S.; Bendich, A.J. The mitochondrial genome is large and variable in a family of plants (Cucurbitaceae). Cell 1981, 25, 793–803. [Google Scholar] [CrossRef]
  12. Mower, J.; Sloan, D.; Alverson, A. Plant mitochondrial diversity–the genomics revolution. In Plant Genome Diversity; Wendel, J.F., Ed.; Springer: Berlin/Heidelberg, Germany, 2012. [Google Scholar]
  13. Sugiyama, Y.; Watase, Y.; Nagase, M.; Makita, N.; Yagura, S.; Hirai, A.; Sugiura, M. The complete nucleotide sequence and multipartite organization of the tobacco mitochondrial genome: Comparative analysis of mitochondrial genomes in higher plants. Mol. Genet. Genom. 2005, 272, 603–615. [Google Scholar] [CrossRef] [PubMed]
  14. Varre, J.S.; D’Agostino, N.; Touzet, P.; Gallina, S.; Tamburino, R.; Cantarella, C.; Ubrig, E.; Cardi, T.; Drouard, L.; Gualberto, J.M.; et al. Complete Sequence, Multichromosomal Architecture and Transcriptome Analysis of the Solanum tuberosum Mitochondrial Genome. Int. J. Mol. Sci. 2019, 20, 4788. [Google Scholar] [CrossRef] [PubMed] [Green Version]
  15. Alverson, A.J.; Rice, D.W.; Dickinson, S.; Barry, K.; Palmer, J.D. Origins and recombination of the bacterial-sized multichromosomal mitochondrial genome of cucumber. Plant Cell 2011, 23, 2499–2513. [Google Scholar] [CrossRef] [Green Version]
  16. Wolfe, K.H.; Li, W.-H.; Sharp, P.M. Rates of nucleotide substitution vary greatly among plant mitochondrial, chloroplast, and nuclear DNAs. Proc. Natl. Acad. Sci. USA 1987, 84, 9054–9058. [Google Scholar] [CrossRef] [Green Version]
  17. Hiesel, R.; von Haeseler, A.; Brennicke, A. Plant mitochondrial nucleic acid sequences as a tool for phylogenetic analysis. Proc. Natl. Acad. Sci. USA 1994, 91, 634–638. [Google Scholar] [CrossRef] [Green Version]
  18. Bi, C.; Paterson, A.H.; Wang, X.; Xu, Y.; Wu, D.; Qu, Y.; Jiang, A.; Ye, Q.; Ye, N. Analysis of the complete mitochondrial genome sequence of the diploid cotton Gossypium raimondii by comparative genomics approaches. BioMed. Res. Int. 2016, 2016. [Google Scholar] [CrossRef] [Green Version]
  19. Kim, N.H.; Jayakodi, M.; Lee, S.C.; Choi, B.S.; Jang, W.; Lee, J.; Kim, H.H.; Waminal, N.E.; Lakshmanan, M.; van Nguyen, B.; et al. Genome and evolution of the shade-requiring medicinal herb Panax ginseng. Plant Biotechnol. J. 2018, 16, 1904–1917. [Google Scholar] [CrossRef] [Green Version]
  20. Jayakodi, M.; Choi, B.S.; Lee, S.C.; Kim, N.H.; Park, J.Y.; Jang, W.; Lakshmanan, M.; Mohan, S.V.G.; Lee, D.Y.; Yang, T.J. Ginseng Genome Database: An open-access platform for genomics of Panax ginseng. BMC Plant Biol. 2018, 18, 62. [Google Scholar] [CrossRef]
  21. Kim, K.J.; Lee, H.L. Complete chloroplast genome sequences from Korean ginseng (Panax schinseng Nees) and comparative analysis of sequence evolution among 17 vascular plants. DNA Res. 2004, 11, 247–261. [Google Scholar] [CrossRef]
  22. Kim, K.; Lee, S.-C.; Lee, J.; Lee, H.O.; Joh, H.J.; Kim, N.-H.; Park, H.-S.; Yang, T.-J. Comprehensive survey of genetic diversity in chloroplast genomes and 45S nrDNAs within Panax ginseng species. PLoS ONE 2015, 10, e0117159. [Google Scholar] [CrossRef] [PubMed]
  23. Zhao, Y.; Yin, J.; Guo, H.; Zhang, Y.; Xiao, W.; Sun, C.; Wu, J.; Qu, X.; Yu, J.; Wang, X. The complete chloroplast genome provides insight into the evolution and polymorphism of Panax ginseng. Front. Plant Sci. 2015, 5. [Google Scholar] [CrossRef] [PubMed] [Green Version]
  24. Mohan, M.; Nair, S.; Bhagwat, A.; Krishna, T.; Yano, M.; Bhatia, C.; Sasaki, T. Genome mapping, molecular markers and marker-assisted selection in crop plants. Mol. Breed. 1997, 3, 87–103. [Google Scholar] [CrossRef]
  25. Jang, W.; Jang, Y.; Kim, N.-H.; Waminal, N.E.; Kim, Y.C.; Lee, J.W.; Yang, T.-J. Genetic diversity among cultivated and wild Panax ginseng populations revealed by high-resolution microsatellite markers. J. Ginseng. Res. 2020, 44, 637–643. [Google Scholar] [CrossRef] [PubMed]
  26. Nguyen, V.B.; Linh Giang, V.N.; Waminal, N.E.; Park, H.S.; Kim, N.H.; Jang, W.; Lee, J.; Yang, T.J. Comprehensive comparative analysis of chloroplast genomes from seven Panax species and development of an authentication system based on species-unique single nucleotide polymorphism markers. J. Ginseng. Res. 2020, 44, 135–144. [Google Scholar] [CrossRef] [PubMed]
  27. Semagn, K.; Babu, R.; Hearne, S.; Olsen, M. Single nucleotide polymorphism genotyping using Kompetitive Allele Specific PCR (KASP): Overview of the technology and its application in crop improvement. Mol. Breed. 2014, 33, 1–14. [Google Scholar] [CrossRef]
  28. Altschul, S.F.; Gish, W.; Miller, W.; Myers, E.W.; Lipman, D.J. Basic local alignment search tool. J. Mol. Biol. 1990, 215, 403–410. [Google Scholar] [CrossRef]
  29. Tillich, M.; Lehwark, P.; Pellizzer, T.; Ulbricht-Jones, E.S.; Fischer, A.; Bock, R.; Greiner, S. GeSeq—Versatile and accurate annotation of organelle genomes. Nucleic Acids Res. 2017, 45, W6–W11. [Google Scholar] [CrossRef]
  30. Lohse, M.; Drechsel, O.; Bock, R. OrganellarGenomeDRAW (OGDRAW): A tool for the easy generation of high-quality custom graphical maps of plastid and mitochondrial genomes. Curr. Genet. 2007, 52, 267–274. [Google Scholar] [CrossRef]
  31. Schwartz, S.; Kent, W.J.; Smit, A.; Zhang, Z.; Baertsch, R.; Hardison, R.C.; Haussler, D.; Miller, W. Human-mouse alignments with BLASTZ. Genom. Res. 2003, 13, 103–107. [Google Scholar] [CrossRef] [Green Version]
  32. Beier, S.; Thiel, T.; Munch, T.; Scholz, U.; Mascher, M. MISA-web: A web server for microsatellite prediction. Bioinformatics 2017, 33, 2583–2585. [Google Scholar] [CrossRef] [PubMed] [Green Version]
  33. Katoh, K.; Standley, D.M. MAFFT multiple sequence alignment software version 7: Improvements in performance and usability. Mol. Biol. Evol. 2013, 30, 772–780. [Google Scholar] [CrossRef] [PubMed] [Green Version]
  34. Page, A.J.; Taylor, B.; Delaney, A.J.; Soares, J.; Seemann, T.; Keane, J.A.; Harris, S.R. SNP-sites: Rapid efficient extraction of SNPs from multi-FASTA alignments. Microb. Genom. 2016, 2, e000056. [Google Scholar] [CrossRef] [PubMed] [Green Version]
  35. Nei, M.; Tajima, F.; Tateno, Y. Accuracy of estimated phylogenetic trees from molecular data. II. Gene frequency data. J. Mol. Evol. 1983, 19, 153–170. [Google Scholar] [CrossRef]
  36. Liu, K.; Muse, S.V. PowerMarker: An integrated analysis environment for genetic marker analysis. Bioinformatics 2005, 21, 2128–2129. [Google Scholar] [CrossRef] [Green Version]
  37. Michener, C.D.; Sokal, R.R. A quantitative approach to a problem in classification. Evolution 1957, 11, 130–162. [Google Scholar] [CrossRef]
  38. Sandhya, S.; Srivastava, H.; Kaila, T.; Tyagi, A.; Gaikwad, K. Methods and Tools for Plant Organelle Genome Sequencing, Assembly, and Downstream Analysis. In Legume Genomics; Springer: Berlin/Heidelberg, Germany, 2020; pp. 49–98. [Google Scholar]
  39. Unseld, M.; Marienfeld, J.R.; Brandt, P.; Brennicke, A. The mitochondrial genome of Arabidopsis thaliana contains 57 genes in 366,924 nucleotides. Nat. Genet. 1997, 15, 57–61. [Google Scholar] [CrossRef] [PubMed]
  40. Notsu, Y.; Masood, S.; Nishikawa, T.; Kubo, N.; Akiduki, G.; Nakazono, M.; Hirai, A.; Kadowaki, K. The complete sequence of the rice (Oryza sativa L.) mitochondrial genome: Frequent DNA sequence acquisition and loss during the evolution of flowering plants. Genet. Genom. 2002, 268, 434–445. [Google Scholar] [CrossRef]
  41. Clifton, S.W.; Minx, P.; Fauron, C.M.-R.; Gibson, M.; Allen, J.O.; Sun, H.; Thompson, M.; Barbazuk, W.B.; Kanuganti, S.; Tayloe, C. Sequence and comparative analysis of the maize NB mitochondrial genome. Plant Physiol. 2004, 136, 3486–3503. [Google Scholar] [CrossRef] [Green Version]
  42. Bena, I.; Warner, N.P. One ring to rule them all and in the darkness bind them? Adv. Theor. Math. Phys. 2005, 9, 667–701. [Google Scholar] [CrossRef] [Green Version]
  43. Sloan, D.B.; Alverson, A.J.; Chuckalovcak, J.P.; Wu, M.; McCauley, D.E.; Palmer, J.D.; Taylor, D.R. Rapid evolution of enormous, multichromosomal genomes in flowering plant mitochondria with exceptionally high mutation rates. PLoS Biol. 2012, 10, e1001241. [Google Scholar] [CrossRef] [PubMed] [Green Version]
  44. Jiang, P.; Shi, F.-X.; Li, M.-R.; Liu, B.; Wen, J.; Xiao, H.-X.; Li, L.-F. Positive selection driving cytoplasmic genome evolution of the medicinally important ginseng plant genus Panax. Front. Plant Sci. 2018, 9. [Google Scholar] [CrossRef] [PubMed]
  45. Smith, D.R.; Keeling, P.J. Twenty-fold difference in evolutionary rates between the mitochondrial and plastid genomes of species with secondary red plastids. J. Eukaryot. Microbiol. 2012, 59, 181–184. [Google Scholar] [CrossRef]
  46. Zhu, A.; Guo, W.; Jain, K.; Mower, J.P. Unprecedented heterogeneity in the synonymous substitution rate within a plant genome. Mol. Biol. Evol. 2014, 31, 1228–1236. [Google Scholar] [CrossRef] [Green Version]
  47. Drouin, G.; Daoud, H.; Xia, J. Relative rates of synonymous substitutions in the mitochondrial, chloroplast and nuclear genomes of seed plants. Mol. Phylogenet. Evol. 2008, 49, 827–831. [Google Scholar] [CrossRef]
  48. Smith, D.R. Mutation rates in plastid genomes: They are lower than you might think. Genom. Biol. Evol. 2015, 7, 1227–1234. [Google Scholar] [CrossRef] [Green Version]
  49. Davila, J.I.; Arrieta-Montiel, M.P.; Wamboldt, Y.; Cao, J.; Hagmann, J.; Shedge, V.; Xu, Y.-Z.; Weigel, D.; Mackenzie, S.A. Double-strand break repair processes drive evolution of the mitochondrial genome in Arabidopsis. BMC Biol. 2011, 9, 1–14. [Google Scholar] [CrossRef] [Green Version]
  50. Christensen, A.C. Plant mitochondrial genome evolution can be explained by DNA repair mechanisms. Genom. Biol. Evol. 2013, 5, 1079–1086. [Google Scholar] [CrossRef]
  51. Soria-Hernanz, D.F.; Braverman, J.M.; Hamilton, M.B. Parallel rate heterogeneity in chloroplast and mitochondrial genomes of Brazil nut trees (Lecythidaceae) is consistent with lineage effects. Mol. Biol. Evol. 2008, 25, 1282–1296. [Google Scholar] [CrossRef] [Green Version]
  52. Choi, H.I.; Waminal, N.E.; Park, H.M.; Kim, N.H.; Choi, B.S.; Park, M.; Choi, D.; Lim, Y.P.; Kwon, S.J.; Park, B.S. Major repeat components covering one-third of the ginseng (Panax ginseng C. A. Meyer) genome and evidence for allotetraploidy. Plant J. 2014, 77, 906–916. [Google Scholar] [CrossRef]
  53. Jang, W.; Kim, N.-H.; Lee, J.; Waminal, N.E.; Lee, S.-C.; Jayakodi, M.; Choi, H.-I.; Park, J.Y.; Lee, J.-E.; Yang, T.-J. A glimpse of Panax ginseng genome structure revealed from ten BAC clone sequences obtained by SMRT sequencing platform. Plant Breed Biotechnol. 2017, 5, 25–35. [Google Scholar] [CrossRef]
  54. Choi, H.-I.; Kim, N.-H.; Lee, J.; Choi, B.S.; Do Kim, K.; Park, J.Y.; Lee, S.-C.; Yang, T.-J. Evolutionary relationship of Panax ginseng and P. quinquefolius inferred from sequencing and comparative analysis of expressed sequence tags. Genet. Resour. Crop. Evol. 2013, 60, 1377–1387. [Google Scholar] [CrossRef]
  55. Kim, N.-H.; Choi, H.-I.; Kim, K.H.; Jang, W.; Yang, T.-J. Evidence of genome duplication revealed by sequence analysis of multi-loci expressed sequence tag–simple sequence repeat bands in Panax ginseng Meyer. J. Ginseng. Res. 2014, 38, 130–135. [Google Scholar] [CrossRef] [PubMed] [Green Version]
  56. Park, H.-S.; Jayakodi, M.; Lee, S.H.; Jeon, J.-H.; Lee, H.-O.; Park, J.Y.; Moon, B.C.; Kim, C.-K.; Wing, R.A.; Newmaster, S.G. Mitochondrial plastid DNA can cause DNA barcoding paradox in plants. Sci. Rep. 2020, 10, 6112. [Google Scholar] [CrossRef] [Green Version]
  57. Kim, N.-H.; Choi, H.-I.; Ahn, I.-O.; Yang, T.-J. EST-SSR marker sets for practical authentication of all nine registered ginseng cultivars in Korea. J. Ginseng. Res. 2012, 36, 298–307. [Google Scholar] [CrossRef] [Green Version]
  58. Choi, H.I.; Kim, N.H.; Kim, J.H.; Choi, B.S.; Ahn, I.O.; Lee, J.S.; Yang, T.J. Development of Reproducible EST-derived SSR Markers and Assessment of Genetic Diversity in Panax ginseng Cultivars and Related Species. J. Ginseng. Res. 2011, 35, 399–412. [Google Scholar] [CrossRef] [Green Version]
Figure 1. Complete mitogenome map of P. ginseng. Colored boxes represent conserved mitochondria genes that were classified based on product function. Genes shown inside the circle are transcribed clockwise, and those outside the circle are transcribed counterclockwise. Genes belonging to different functional groups are color-coded. The black line in the middle circular track indicates the GC-content. The red line and blue lines in the innermost circular track represent the sequencing reads depth from the ONT and Miseq platform, respectively, and a scale mark means 30× coverage. * Genes with exonic regions. GC-content, guanine-cytosine content; ONT, oxford nanopore technologies.
Agronomy 10 01868 g001
Figure 2. Variants and structure of the P. ginseng mitogenome. The outer circular track indicates the position of the variations in the mitogenome, and the blue and red bars mean SNPs and InDels, respectively. Green regions in the middle track indicate MTPT regions. Arrows on the inner track indicate the three large repeat regions and their directions in the ginseng mitogenome. InDel, insertion and deletion; MTPT, mitogenome sequences of plastid origin; SNP, single-nucleotide polymorphism.
Agronomy 10 01868 g002
Figure 3. Endpoint fluorescence scatter plots of 10 developed KASP markers applied to 79 ginseng accessions including three Panax species. Red and light-blue dots indicate two homozygous genotypes (A/A or B/B). The three black dots indicate negative controls. X and Y axes represent the fluorescence values of FAM and HEX, respectively. FAM, fluorescein amidite; HEX, hexachloro-fluorescein; KASP, kompetitive allele-specific PCR.
Agronomy 10 01868 g003
Figure 4. Cladogram of 59 Korean ginseng accessions based on mitogenome haplotypes. The cladogram was constructed using the UPGMA method by 10 polymorphic KASP markers. Letters on the right represent the each mitogenome group divided based on mitogenome haplotype. KASP, kompetitive allele-specific PCR; UPGMA, unweighted pair group method with arithmetic mean.
Agronomy 10 01868 g004
Table 1. Annotated genes list in the mitogenome of P. ginseng.
FunctionGenes
Complex I (NADH dehydrogenase)nad1 *,T, nad2 *,T, nad3, nad4 *, nad4L, nad5 *,T, nad6, nad7 *, nad9
Complex II (succinate dehydrogenase)sdh3, sdh4
Complex III (ubiquinol-cytochrome c reductase)cob
Complex IV (cytochrome c oxidase)cox1, cox2 *,T, cox3
Complex V (ATP synthase)atp1, atp4, atp6, atp8, atp9, atpE
Cytochrome c biogenesisccmB, ccmC, ccmFc *, ccmFn
Large subunit ribosomal proteinsrpl10, rpl14, rpl16, rpl22
Small subunit ribosomal proteinsrps1, rps10, rps11, rps12, rps3, rps4, rps7, rps8
MaturasematK, matR
Ribosomal RNAsrrn18, rrn26, rrn5
Transfer RNAstrnA-UGC*, trnC-GCA, trnD-GUC, trnE-UUC, trnF-AAA, trnF-GAA, trnG-GCC, trnH-GUG, trnI-GAU, trnK-CUU, trnK-UUU, trnM-CAU, trnN-GUU, trnP-UGG, trnQ-UUG, trnR-ACG, trnS-GCU, trnS-UGA, trnStop-UUA *, trnT-GGU, trnV-GAC, trnV-UAC *, trnW-CCA, trnY-GUA
Other genesinfA, petD, psbA, psbD, rpoA, tatC
* Genes containing introns; T trans-splicing genes. Genes in bold letters represent duplicated genes.
Table 2. The sequence information of 10 KASP markers developed from the P. ginseng mitogenome.
NoMarker
Name
RegionNucleotide PositionAlleleAllele-Specific Primer Sequence (5′->3′)Common Primer Sequence (5′->3′)
1pgmt17tRNA-Glu(TTC)~atp49736FAMGGAGTCGCCCCACTCACTTGAGTAGGCAAGTGGGAAACAAGGAATTGAATT
HEXTAGAGTCGCCCCACTCACTTGAT
2pgmt20atp4~rrn540,917FAMACGTTGATATGCAAAACAGAGGAAAAGATGAGTGCGCGAAGGTACAATCCTAAA
HEXCGTTGATATGCAAAACAGAGGAAAAGAG
3pgmt38orf109~tRNA-Met(CAT)124,782FAMGTGAGGCTTTCTTTCCCTTATTAGTCGAACGTCCCGCGCCCCCTT
HEXTGTTGAGGCTTTCTTTCCCTTATTAGTA
4pgmt48ccmFc~nad9194,878FAMCAGTCGATAATAAGGTCAGCTACCTGATGCGAAGGCTCACCTCATTGGAAA
HEXAAAGTCGATAATAAGGTCAGCTACCTT
5pgmt57orf214~tRNA-Ser(GCT)206,035FAMTGCCCGTTACTTCATCAAGATAGACTTTTGCACTTGGTGGTATCCCGACTTT
HEXGCCCGTTACTTCATCAAGATAGACTG
6pgmt93ccmC~tRNA-Ser(TGA)270,424FAMGATCTCGTCTAATAAGAAGAGCGCTCCGAGACTAGCGTGATGTAAGACAGAA
HEXTAAATCTCGTCTAATAAGAAGAGCGCTA
7pgmt130rps7~matR319,240FAMCGAGATAAGGAGCTAGCCTTTTAGAAGAGGTACTAGTGACTTCTTGCATCTCAAA
HEXAAGAGATAAGGAGCTAGCCTTTTAGAAT
8pgmt134matR~atp8328,368FAMAAGGCTTTTTTTATAGATTAAGAGGTGAGTAAGTTGGGGCTCTTTGGTCTTCCATT
HEXCGGCTTTTTTTATAGATTAAGAGGTGAGTC
9pgmt198rpl22~tRNA-Gly(GCC)444,629FAMAATAGAACTCCTAGCTCTGGAGCTGCGAAGCCTTTCGGTAGCTGTTAAA
HEXCAGAACTCCTAGCTCTGGAGCG
10pgmt199rpl22~tRNA-Gly(GCC)451,679FAMCTGGTTTTTCTCTTTCTACGTTCTTCCCTTCTAGCAACTAAGCACTCGGACAA
HEXAGTTTGGTTTTTCTCTTTCTACGTTCTTCA
Bold and underlined nucleotides in primer sequences represent allele-specific positions. FAM, fluorescein amidite; HEX, hexachloro-fluorescein; KASP, kompetitive allele-specific PCR.
Table 3. Characteristics of the 10 polymorphic SNP loci among the Korean ginseng accessions.
MarkerNAMAFGDPIC
Pgmt1720.84750.25850.2251
Pgmt2020.71190.41020.3261
Pgmt3820.77970.34360.2846
Pgmt4820.77970.34360.2846
Pgmt5720.62710.46770.3583
Pgmt9320.81360.30340.2573
Pgmt13020.81360.30340.2573
Pgmt13420.71190.41020.3261
Pgmt19820.72880.39530.3172
Pgmt19920.84750.25850.2251
Mean20.76610.34940.2862
GD, gene diversity; MAF, major allele frequency; NA, number of alleles; PIC, polymorphism information content; SNP, single-nucleotide polymorphism.
Publisher’s Note: MDPI stays neutral with regard to jurisdictional claims in published maps and institutional affiliations.

