


Polyphenols are a large and complex group of plant secondary metabolites present in plant-based foods and beverages, such as fruits, vegetables, cereals, legumes, nuts, cocoa, wine, coffee and tea. Over 500 different molecules are known in foods, which can be divided into classes and subclasses according to their chemical structure, ranging from low molecular weight to highly polymerised compounds. The four main polyphenol classes are phenolic acids, flavonoids, stilbenes and lignans and occur either as glycoside, ester or polymer, or in the free form (aglycone)(Reference Pérez-Jiménez, Neveu and Vos1).
Cohort studies have suggested an inverse association between polyphenol intake and the risk of chronic diseases, such as CVD(Reference Cassidy, Mukamal and Liu2,Reference Lajous, Rossignol and Fagherazzi3) , type 2 diabetes(Reference Tresserra-Rimbau, Guasch-Ferré and Salas-Salvadó4,Reference Zamora-Ros, Forouhi and Sharp5) , some types of cancer(Reference Zamora-Ros, Cayssials and Jenab6–Reference Lin, Yngve and Lagergren8) and neurodegenerative disease(Reference Devore, Kang and Breteler9), and overall mortality(Reference Bondonno, Dalgaard and Kyro10). However, the glycosylation pattern, hydroxylation, acylation, esterification and degree of polymerisation have a major influence on the bioavailability and bioactivity of dietary polyphenols; thus, it is important to investigate the intake of individual polyphenols and their role in health outcomes and disease prevention. Assessing dietary polyphenol intake and their major food sources is the first step towards documenting associations between polyphenols and diseases(Reference Wallace, Blumberg and Johnson11). In this regard, several databases on polyphenol content in foods have been used to assess the intake in populations, and the Phenol-Explorer database (www.phenol-explorer.eu/) is a useful tool for estimating individual polyphenol intake as it provides data on 501 different polyphenols in 452 foods(Reference Neveu, Perez-Jimenez and Vos12).
To date, studies assessing the total, classes and individual polyphenol intake have been published(Reference Chun, Chung and Song13–Reference Zamora-Ros, Knaze and Rothwell17); however, most of them are developed in European countries(Reference Pérez-Jiménez, Fezeu and Touvier14,Reference Ovaskainen, Torronen and Koponen15,Reference Zamora-Ros, Knaze and Rothwell17–Reference Vogiatzoglou, Mulligan and Lentjes25) . More studies in different geographical areas are needed, such as Latin America, because distinct dietary habits are observed and the amount (and diversity) of polyphenols consumed may vary immensely. Few data are available for Latin American countries, except for Mexico(Reference Zamora-Ros, Biessy and Rothwell26) and Argentina(Reference Rossi, Bassett and Sammán27). Previous studies were conducted with the Brazilian population, but these included small samples(Reference Miranda, Steluti and Fisberg28,Reference Nascimento-Souza, de Paiva and Pérez-Jiménez29) or the estimates were based on non-specified food consumption data(Reference Anacleto, Lajolo and Hassimotto30). There are no data on the estimated dietary intake of total and individual polyphenols in a representative sample of the Brazilian population. Thus, the present study aimed to estimate dietary intake of total and individual polyphenols in a representative sample of the Brazilian general population aged 10 years or older.
Methods
Study population
The data of the present study were retrieved from the Brazilian National Dietary Survey, conducted along with the 2008–2009 Household Budget Survey (HBS). The HBS is a survey carried out by the Brazilian Institute of Geography and Statistics and designed to assess Brazilian family’s consumption structures. In summary, the 2008–2009 HBS used two-stage cluster sampling involving census sectors stratified according to different geographical areas and socio-economic classes. First, the sectors were randomly selected from each stratum with probability proportional to the number of households present and, in the second stage, the households were selected by simple random sampling. Of the 55 970 households sampled from the 2008–2009 HBS, a subsample of about 25 % of households was randomly selected for data collection on individual food intake (see online Supplementary Fig. S1). Thus, the final sample included 13 596 households, which corresponded to 34 003 subjects ≥10 years old(31). The research protocol was approved by the Ethics Committee of the Institute of Social Medicine of the State University of Rio de Janeiro (CAAE 0011.0.259.000-11).
Dietary intake
Dietary intake was evaluated during the 12 months of research to encompass seasonal variations in food intakes. Individual food intake data were obtained using two 24-h dietary records on non-consecutive days. Participants were instructed to record all food and beverages consumed, including amount (household or volume measurements), food preparation technique (e.g. baking, broiling, frying and roasting), time and place of consumption (inside or outside the home). An instruction manual including photographs to facilitate the estimation of portion sizes was used. At the end, trained professionals reviewed the dietary records with the participant to prevent that any food was forgotten.
Recipes were converted into ingredients to estimate the amount of all ingredients in each mixed dish using the software ‘ILSI: Analysis of the average food consumption per capita of the Brazilian population’(Reference Pais and Valerio32), which contains information regarding the amounts of each food that composes the recipes mentioned in the 2008–2009 HBS dietary records.
Correspondence between food items in dietary records and in food composition database on polyphenols
For the present study, the dietary polyphenol intake was estimated from the two dietary records. The Phenol-Explorer database (www.phenol-explorer.eu/) was used to obtain data on the polyphenol content in foods, which contain data on 501 different polyphenols divided into eighteen polyphenol classes, such as phenolic acids, flavonoids, stilbenes and lignans. All individual polyphenols were determined by reverse-phase HPLC, except for proanthocyanidins, data of which correspond to normal-phase HPLC. For foods that contained polyphenols linked to the food matrix and only solubilised and quantified after basic or acid hydrolysis, content values were obtained by chromatography after hydrolysis, such as lignans in all foods, ellagic acid in walnuts and hydroxycinnamic acids in cereals, legumes and olives(Reference Neveu, Perez-Jimenez and Vos12). For some regional foods and others highly prevalent in the Brazilian diet (e.g. beans and orange), we used data from foods collected and analysed in Brazil by HPLC. We also used data from Brazilian Food Composition Database (TBCA) (www.tbca.net.br/), a database which contains data on flavonoid content in foods harvested in Brazil and analysed by HPLC(Reference Coelho, Bistriche and Grande33). When data were overlapped between the TBCA and Phenol-Explorer database, TBCA data had priority.
The total polyphenol intake was estimated based on the ingredient content in each mixed dish. The effects of food processing on polyphenol content were estimated using retention factors (RF) included in the Phenol-Explorer database. The RF estimates the polyphenol content in processed foods by taking into account weight loss or water gain during cooking(Reference Rothwell, Perez-Jimenez and Neveu34).
Estimation of polyphenol intake and dietary contributors to polyphenol intake
The individual polyphenol intake from each food was calculated by multiplying the content of each polyphenol by the daily amount of each food consumed. Total polyphenol intake was calculated as the sum of all individual polyphenol intakes from all food sources reported in the dietary records. For those polyphenols that are present in foods as glycosides and esters forms, the polyphenol intake was also calculated as aglycone equivalents by removing, for each individual polyphenol, the contribution to molecular weight of the non-phenolic part of the molecule.
Socio-demographic information
Socio-demographic characteristics were collected by trained professionals in a face-to-face interview using a structured questionnaire and included the following information: sex, age, race, Brazilian region, household area (urban or rural) and educational level. Brazilian region was divided into five categories: North (it comprises the states of Acre, Amapá, Amazonas, Pará, Rondônia, Roraima and Tocantins), Northeast (it comprises the states of Alagoas, Bahia, Ceará, Maranhão, Paraíba, Piauí, Pernambuco, Rio Grande do Norte and Sergipe), Middle-West (it comprises the states of Goiás, Mato Grosso and Mato Grosso do Sul), Southeast (it comprises the states of Espírito Santo, Minas Gerais, Rio de Janeiro and São Paulo) and South (it comprises the states of Paraná, Rio Grande do Sul and Santa Catarina). Educational level was divided into three categories: elementary school, secondary school and university. Personal income was assessed considering the monthly per capita income of all monetary and non-monetary sources of income and was divided into three categories: low income (first tercile), middle income (second tercile) and high income (third tercile).
Statistical analyses
Data are presented as medians for continuous variables and frequencies or percentages for categorical variables. Polyphenol intake distribution was analysed using the Kolmogorov–Smirnov test, and it did not follow a normal distribution. Thus, dietary polyphenol intakes were presented as medians and 25th and 75th percentiles, and the Kruskal–Wallis test with Dunn post hoc (significance values adjusted by Bonferroni correction) was used to test differences according to socio-demographic characteristics. Because the polyphenol intake increases with a higher food consumption, the polyphenol intake was also calculated in energy-adjusted terms (mg of polyphenols per 1000 kcal/d (4184 kJ/d) of total energy consumed). The main food contributors to the intake of polyphenols were determined by percentage of contribution. Estimates were performed using sample weights to allow population representativeness, with significance level of 5 % (P ≤ 0·05), using Stata software version 14.
Results
Total polyphenol intake
Information on 34 003 participants was available for analysis, comprising 15 700 men and 18 303 women. A total of 1971 food items were mentioned in the food records. After converting recipes into ingredients and excluding repeated foods, a list of 417 different food items was obtained and 229 have polyphenol content described (177 from Phenol-Explorer database and fifty-two from TBCA and published Brazilian data). Also, 253 polyphenols were found in these foods in aglycone, glycoside and esters forms, which correspond to 124 different aglycone polyphenols (see online Supplementary Table S1).
The median and 25–75th percentiles of polyphenol intake as aglycone equivalents for the whole population were 364·3 and 200·9–1008 mg/d, respectively. After energy adjustment, the median and 25–75th percentiles of polyphenol intake were 204 and 111·4–542·1 mg/1000 kcal/d (4184 kJ/d), respectively. The energy-adjusted polyphenol intake as aglycone equivalents according to socio-demographic characteristics is presented in Table 1. The intake of total polyphenols, phenolic acids and flavonoids was higher among females than in males (all P = 0·0001) after adjusting for energy intake (see online Supplementary Table S2). The consumption of total polyphenols, phenolic acids and lignans increased with age, unlike flavonoids, whose highest median intake was observed for adolescents (14–18 years). Total polyphenols intake was significantly higher in South (218 mg/d), compared with other regions, and lower in Midwest (171 mg/d). Phenolic acid intake was greatest in Northeast (95 mg/d), and flavonoid intake was highest in South (82 mg/d). Subjects living in rural areas consumed more total polyphenols, phenolic acids and lignans compared with those living in urban areas (P = 0·0001). In contrast, the median intake of flavonoids and other polyphenols was higher in the urban area compared with the rural area (P = 0·0001).
Table 1. Energy-adjusted total and polyphenol class intake (mg/1000 kcal/d (4184 kJ/d)) by socio-demographic characteristics* †(Median values and 25–75th percentiles)
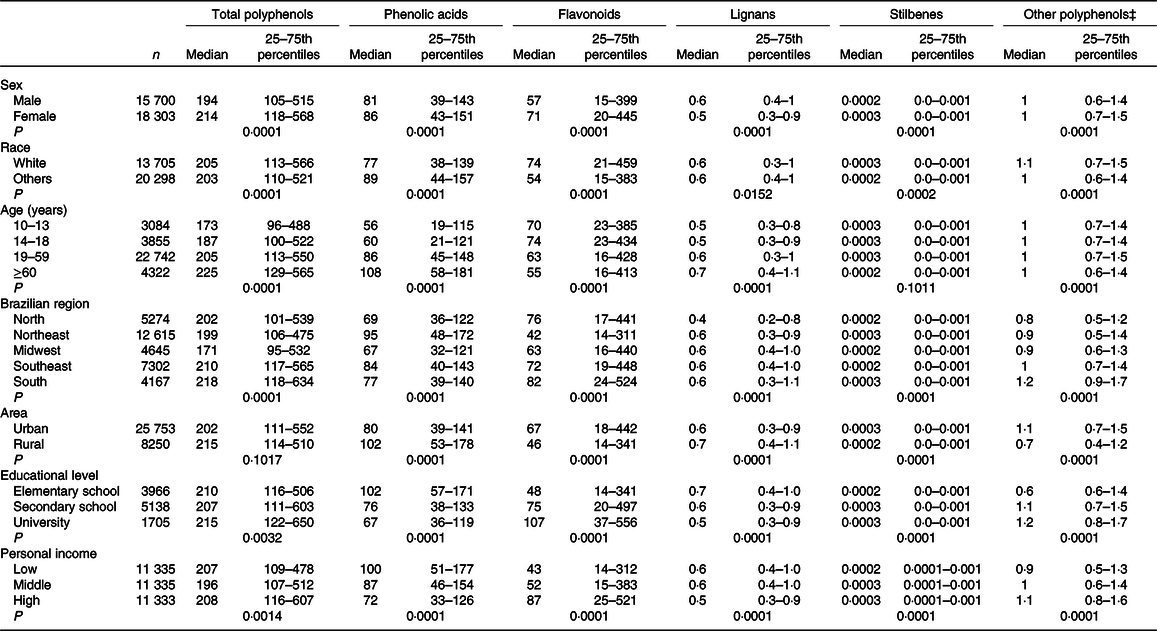
* Estimates were performed using sample weights to allow population representativeness.
† Comparisons across categories were performed by using the Kruskal–Wallis test.
‡ Other polyphenols as the sum of alkylphenols, alkylmethoxyphenols, furanocoumarins, hydroxybenzaldehydes, hydroxycoumarins, phenolic terpenes, tyrosols, catechols, pyrogallols and phlorins.
Subjects with lower educational level (elementary school) showed a higher phenolic acid and lignan intake than did subjects with higher educational level (university) (P = 0·0001). Additionally, subjects in lowest personal income tercile showed higher phenolic acids intake compared with subjects with higher personal income (P = 0·0001). The opposite was found for flavonoid intake, with higher median intake for subjects in the highest educational level (compared with lowest educational level group, P = 0·0001) and personal income category (compared with lowest personal income category, P = 0·0001).
The polyphenol classes intake and the contribution of individual polyphenols to the class are shown in Table 2. Hydroxycinnamic acids were the most consumed polyphenol class (299·9 and 152·8 mg/d as aglycone equivalents). The second most abundant polyphenol class consumed were flavanones (86·5 and 58·9 mg/d as aglycone equivalents). Other classes contributed to a lesser extent to the polyphenol intake. Flavones and flavan3ols were the two next classes with higher intakes, and it was estimated in 12·8 and 7·4 mg/d (6 and 6·3 mg/d as aglycone equivalents, respectively). Other polyphenols included alkylphenols (1·1 mg/d), lignans (1 mg/d), tyrosols (0·8 mg/d), alkylmethoxyphenols (0·2 mg/d), stilbenes (0·003 mg/d), furanocoumarins, hydroxybenzaldehydes, hydroxycoumarins, phenolic terpenes, catechols, pyrogallols and phlorins (0·1 mg/d).
Table 2. Main polyphenol subclass intake (mg/d) and the three most consumed individual polyphenols (Median values and 25–75th percentiles)
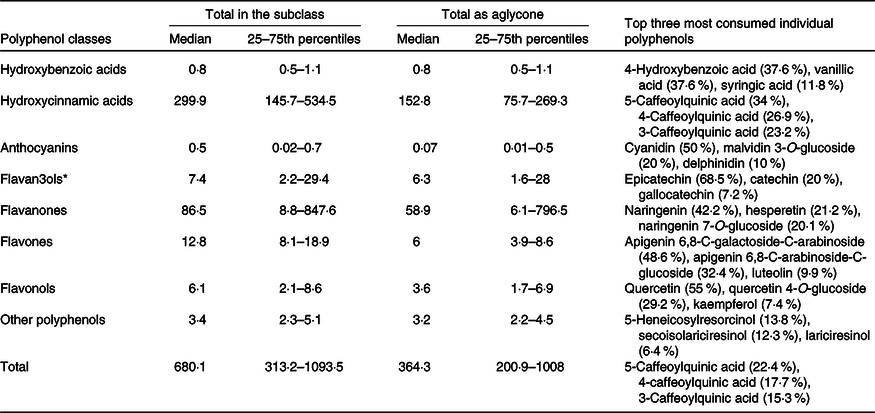
* Includes proanthocyanidins.
The individual polyphenols with higher contribution to total polyphenol and hydroxycinnamic acids intake were isomers of chlorogenic acid (5-caffeoylquinic acid, 4-caffeoylquinic acid and 3-caffeoylquinic acid). Naringenin, hesperetin and naringenin 7-O-glucoside were the main individual flavanones consumed, with contribution of 42·2 , 21·2 and 20·1 % to the subclass intake, respectively.
Polyphenol intake per food groups and main food contributors
The main food group sources as well as the three highest food contributors to total, classes and subclasses of polyphenol intake are shown in Table 3. Non-alcoholic beverages and fruits were the main polyphenol suppliers (contributions of 76 and 13 %, respectively), followed by cereals (3·5 %) and vegetables (3·1 %). The main individual food contributors to polyphenol intake were coffee and orange juice, with respective contribution of 59·4 and 16·3 % to total polyphenols intake. Non-alcoholic beverages and vegetables were the main food group for phenolic acids and hydroxycinnamic acids, with coffee, potato and bean as the main individual food contributors to the class and subclass intake. Non-alcoholic beverages, fruits and cocoa products were the main flavonoid providers with respective contribution of 58, 28·9 and 4·5 %.With respect to flavonoid subclasses, non-alcoholic beverages and fruits were the most abundant food group to flavanone intake (contribution of 76 and 24 %, respectively) and coca products and fruits were the richest food group to flavan3ol intake (66·8 and 14·9 %, respectively). Orange juice and orange were the main individual food contributors to total flavonoid and flavanone intake.
Table 3. Contribution (%) of food groups to total, classes and subclasses of polyphenol intake
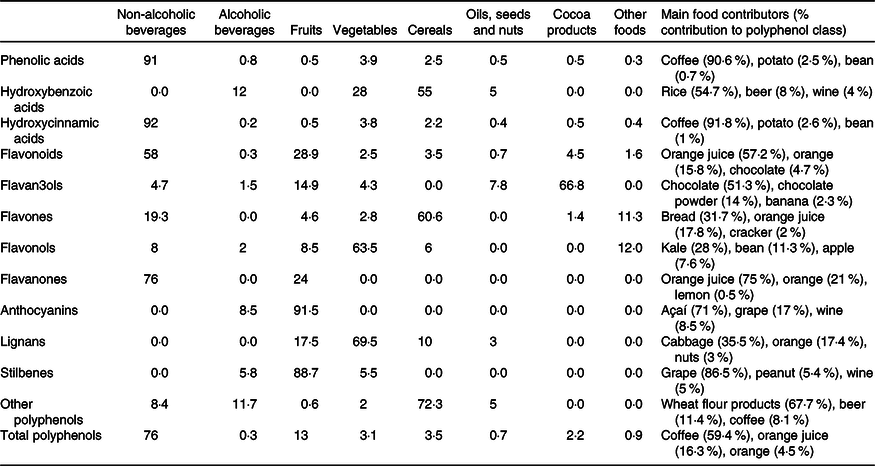
In regard to other polyphenol classes, vegetables and fruits were the main food group for lignan intake, with cabbage and orange as the major individual food contributors to the class intake (contributions of 35·5 and 17·4 %, respectively). Fruits were the main source for stilbenes intake, and cereals the major food group for other polyphenols (mainly alkylphenols) intake.
Discussion
To our knowledge, this is the first study to describe a detailed intake of total polyphenols and polyphenol classes in a nationally representative sample of the Brazilian population. Previous studies focused on specific polyphenol class (flavonoid) with a non-specific food consumption data(Reference Anacleto, Lajolo and Hassimotto30) or small samples that do not represent the entire population(Reference Miranda, Steluti and Fisberg28,Reference Nascimento-Souza, de Paiva and Pérez-Jiménez29) . In comparison with the available data, the present estimations of total polyphenols intake were lower than that previously reported for elderly subjects of Viçosa (533 mg/d)(Reference Nascimento-Souza, de Paiva and Pérez-Jiménez29). The median intake of total polyphenols and polyphenol classes in the present study is also lower than values reported by other studies. French adults in the SU.VI.MAX cohort had a mean polyphenol intake of 820 mg/d(Reference Pérez-Jiménez, Fezeu and Touvier14), adults in the Finnish cohort FINDIET had an intake of 863 mg/d(Reference Ovaskainen, Torronen and Koponen15) and adult females in UK had a mean intake of 1080 mg/d(Reference Yahya, Day and Lawton18) (all values expressed as aglycone equivalents). In regard to the polyphenol classes, the median flavonoid intake found in our study is also lower than reported intakes for adults in the USA(Reference Chun, Chung and Song13) and Korea(Reference Jun, Shin and Joung16). The Brazilian median intake of phenolic acids and stilbenes was lower than that reported for adults from the UK(Reference Yahya, Day and Lawton18) and in the European Prospective Investigation into Cancer and Nutrition (EPIC) cohort(Reference Zamora-Ros, Rothwell and Scalbert20).
The differences between studies could be explained by different dietary preferences and habits according to different populations, which are related to the food availability and local cultures. Specifically, in our analysis, it is important to highlight some considerations about the Brazilian dietary pattern, which can justify the low polyphenol intake. During the last decades, there was an increase in processed food intake and replacement of traditional meals with high-energy foods, rich in fat and added sugars. The per capita fruit and vegetable intake is very low (69·1 g/d for men and 92·6 g/d for women), even lower than that reported in Viçosa study (per capita fruit and vegetable intake was 247·6 g/d). In addition, the low food variety (just 417 different food items mentioned in dietary records) in the Brazilian diet resulted in a reduced number of consumed polyphenols, lower than that reported in other populations(Reference Pérez-Jiménez, Fezeu and Touvier14,Reference Zamora-Ros, Biessy and Rothwell26) . Together, these figures illustrate the low quality of the Brazilian diet and point to important health issues, corroborating the nutritional concern of the country.
It is also important to point that food composition data of some local fruits and other plant-based foods mentioned in dietary records are not available. Although they represented less than 5 % of total fruit and vegetable intake, the systematic publication of the polyphenol food composition data, as well as comprehensive compilation of these information, should be encouraged to facilitate researches on this topic. Other methodological issues may explain the differences of intake between studies, such as the use of different databases of polyphenol content in foods (which differ with respect to the polyphenol classes analysed and to the polyphenol content in foods) and the use of different data collection methods.
Hydroxycinnamic acids were the main contributors to total polyphenols intake, followed by flavanones. In non-Mediterranean(Reference Zamora-Ros, Knaze and Rothwell17) and Latin American countries, such as Mexico(Reference Zamora-Ros, Biessy and Rothwell26) and Argentina(Reference Rossi, Bassett and Sammán27), although the polyphenol intake in our study was lower in these countries, the contribution of phenolic acids and flavonoids to the polyphenol intake was similar. Other polyphenol classes were consumed in very low amounts, which could be explained to their low content in foods and to the low intake of main food sources. Although these polyphenols classes exhibit promising biological properties, their low daily intake by the Brazilian population and others(Reference Pérez-Jiménez, Fezeu and Touvier14,Reference Yahya, Day and Lawton18,Reference Grosso, Stepaniak and Topor-Madry19,Reference Tetens, Turrini and Tapanainen21–Reference Wisnuwardani, De Henauw and Androutsos23,Reference Zamora-Ros, Biessy and Rothwell26) raises issues to their importance in health and lower disease risk.
Coffee was the main food source for total polyphenols and hydroxycinnamic acids intake, corroborating with studies conducted with São Paulo(Reference Miranda, Steluti and Fisberg28), Viçosa(Reference Nascimento-Souza, de Paiva and Pérez-Jiménez29) and other Western populations(Reference Yahya, Day and Lawton18,Reference Tresserra-Rimbau, Medina-Remón and Pérez-Jiménez22,Reference Wisnuwardani, De Henauw and Androutsos23) . Orange juice and oranges were the main contributors to total polyphenols and flavonoid intake. Previous studies support that orange is the main food source for flavonoids intake by the Brazilian population(Reference Miranda, Steluti and Fisberg28,Reference Anacleto, Lajolo and Hassimotto30,Reference Arabbi, Genovese and Lajolo35) .
In the study conducted with Viçosa(Reference Nascimento-Souza, de Paiva and Pérez-Jiménez29), beans had a higher contribution to the flavonoid intake. It is important to note that in our study, the phenolic content in beans was extracted from a research evaluating the phenolic profile of Brazilian bean cultivars after soaking and cooking(Reference Ranilla, Genovese and Lajolo36). The previous study considered data from Phenol-Explorer, and the RF information is not available to all beans’ polyphenols. This fact may justify the lower contribution of beans to the polyphenol intake in our study.
In our study, total polyphenols and polyphenol classes intake was higher in females than males after adjusting for energy intake, suggesting that the higher intake in men is due to the higher food intake, while the higher intake in females is due to a higher polyphenol-rich foods intake(Reference Ziauddeen, Rosi and Del Rio24). Total polyphenols and phenolic acids intake increased with age, probably due to the greater intake of the main food contributor to polyphenol and phenolic acids (coffee). In addition, age is inversely related to highly processed foods intake and directly related to vegetable consumption(Reference Canella, Louzada and Claro37).
Total polyphenol and polyphenol classes intake varied widely according to country region. Total polyphenols and flavonoid intake was higher in South (218 and 82 mg/d, respectively), whereas Midwest had the lowest total polyphenols and phenolic acids intake (171 and 67 mg/d, respectively). In Brazil, dietary habits vary according to the region, and in North, Northeast and Midwest regions, the intake of local fruits and vegetables is higher. Tea intake is highly prevalent in South, which could explain the higher total intake of total polyphenols and flavonoids(Reference Souza, Pereira and Yokoo38). Median intake of total polyphenols and phenolic acids was higher in rural areas. The population of urban areas consumes a higher amount of highly processed foods, which could explain the lower medians in urban area(Reference Ranilla, Genovese and Lajolo36). However, flavonoid intake was higher in urban areas, corroborating the previously reported for adult females in the Mexican Teachers’ Cohort(Reference Zamora-Ros, Biessy and Rothwell26). A potential explanation could be that subjects in rural areas consume more local plant-based foods, such as fruits and vegetables, with limited polyphenol content described.
The major strengths of the present study are the large and comprehensive sample size, added to the use of sample expansion factors, which provides a reliable approximation of the situation in Brazil. Other strengths include the assessment of intake by socio-demographic factors, which is useful for establishing public health policies, and the inclusion of polyphenol content information in Brazilian foods obtained by high-quality analytical methods, in addition to the use of the Phenol-Explorer database, the most comprehensive database for polyphenols. The separation of the ingredient content in each mixed dish and the use of the RF is another strength, since it provides more reliable data. However, the present study has also certain limitations. As mentioned, information on some local fruits and vegetables is still scarce because they have not been characterised or only poorly characterised. Other limitation is the lack of information about polyphenol content on cooked foods, since RF information in the Phenol-Explorer database is not comprehensive to all foods, compounds and processing methods.
In conclusion, for the first time, the present study provided data on total polyphenols and polyphenol classes intake in a nationally representative sample of the Brazilian population. Our results corroborate central nutritional concern in Brazil, in which the intake of traditional meals and plant-based foods has been decreasing in the last few decades. The results described will facilitate the study associations between the polyphenol classes intake and health outcomes and will be useful to investigate the potential role on health of certain foods consumed in greater amounts by the Brazilian population, such as coffee and orange juice.
Acknowledgements
The authors would like to thank International Life Sciences Institute Brasil (Task Force Agrochemicals) for technical support in the initial phase of the study. The authors thank Food Research Center – CEPID-FAPESP (Research Innovation and Dissemination Centers, São Paulo Research Foundation) and the National Counsel of Technological and Scientific Development (CNPq).
This work was not supported by any funding agency.
F. M. L. designed, planned and assisted the research, and reviewed the manuscript; R. A. C. conducted research, performed data analysis and wrote the paper; N. M. A. H. critically reviewed the manuscript. All authors read and approved the final version of the manuscript.
There are no conflicts of interest.
Supplementary material
For supplementary materials referred to in this article, please visit https://doi.org/10.1017/S0007114520004237


