Improving Situational Awareness in the Arctic Ocean
 Luc Rainville1*
  Jeremy Wilkinson2
  Mary Ellen J. Durley3 Scott Harper4 Julia DiLeo5 Martin J. Doble6 Andrew Fleming2 David Forcucci3 Hans Graber5 John T. Hargrove5 John Haverlack7
  Nick Hughes8 Brett Hembrough9,10 Martin O. Jeffries4,11
  Craig M. Lee1 Brendon Mendenhall9 David McCormmick12 Sofia Montalvo12 Adam Stenseth3 Geoffrey B. Shilling1 Harper L. Simmons7 James E. Toomey IV3 John Woods4,12
- 1Applied Physics Laboratory, University of Washington, Seattle, WA, United States
- 2British Antarctic Survey, Cambridge, United Kingdom
- 3United States Coast Guard (USCGC Healy, WAGB (20)), Seattle, WA, United States
- 4Office of Naval Research, Arlington, VA, United States
- 5Center for Southeastern Tropical Advanced Remote Sensing, University of Miami, Miami, FL, United States
- 6Polar Scientific Inc., Appin, United Kingdom
- 7College of Fisheries and Ocean Sciences, University of Alaska, Fairbanks, AK, United States
- 8Norwegian Meteorological Institute, Tromsø, Norway
- 9Scripps Institution of Oceanography, University of California, San Diego, La Jolla, CA, United States
- 10Marine Operations, Oregon State University, Corvallis, OR, United States
- 11Cold Regions Research and Engineering Laboratory, Hanover, NH, United States
- 12United States National Ice Center, Suitland, MD, United States
To successfully operate in a harsh environment like the Arctic Ocean, one must be able to understand and predict how that environment will evolve over different spatial and temporal scales. This is particularly challenging given the on-going and significant environmental changes that are occurring in the region. Access to the most recent environmental information provides timely knowledge that enables ship-based operations to proceed efficiently, effectively and safely in this difficult arena. Knowledge of the evolving environmental conditions during a field campaign is critical for effective planning, optimal execution of sampling strategies, and to provide a broader context to data collected at specific times and places. We describe the collaborations and processes that enabled an operational system to be developed to provide a remote field-team, located on USCGC Healy in the Beaufort Sea, with near real-time situational awareness information regarding the weather, sea ice conditions, and oceanographic processes. The developed system included the punctual throughput of near real-time products such as satellite imagery, meteorological forecasts, ice charts, model outputs, and up to date locations of key sea ice and ocean-based assets. Science and operational users, as well as onshore personnel, used this system for real-time practical considerations such as ship navigation, and to time scientific operations to ensure the appropriate sea ice and weather conditions prevailed. By presenting the outputs of the system within the context of case studies our results clearly demonstrate the benefits that improved situational awareness brings to ship-based operations in the Arctic Ocean, both today and in the future.
Introduction
Motivations
Our ability to understand the environment around us is very much linked to our ability to accurately predict how this environment will evolve in the future; hours, weeks, seasons, and years. However, when an environment changes beyond what is considered normal, then our predictive capability is substantially diminished. The Arctic Ocean is presently outside these boundaries. For example satellite observations over an extended period of time have clearly shown a reduction in sea ice extent in all seasons (Stroeve et al., 2012; Meier et al., 2014), changes to sea ice motion (Spreen et al., 2011), a dramatic decrease in concentration and extent of multi-year ice (Comiso, 2012), and an expansion of the marginal ice zone (Strong and Rigo, 2013; Bliss et al., 2019). These changes would not have seemed possible only a few decades ago. Understanding these changes and predicting and anticipating their effects are formidable tasks.
Over recent years, political, military, societal and commercial interest in the Arctic has increased significantly. Coinciding with this interest has been an expansion in human activity in Arctic waters, which is set to continue for the foreseeable future. At present, most sea-based operations in the Arctic are concentrated around the summer months. This summer focus is changing as operational experience is gained, infrastructure is enhanced, and the extension of the ice-free season stretches into other seasons (Wilkinson and Stroeve, 2018). Whilst the navigation of vessels through sea ice is generally considered to be more challenging, it is the plethora of environmental scenarios that could play out and the speed in which ice and weather conditions can change that increases the complexity significantly. The combination of natural variability and climate-forced changes in the Arctic marine system bring further difficulties (Wilkinson and Stroeve, 2018; Hwang et al., 2020). Given these challenges it is essential that mariners, scientists and other key personnel operating in the Arctic marine environment have access to the latest situational awareness products, such as sea ice, oceanographic and meteorological information. Arctic observational networks are growing (e.g., Lee et al., 2019; Smith et al., 2019). This information must be in a format that is simple to understand, able to be easily incorporated into the ship’s navigation and operational systems, and can be transmitted in a timely fashion within the communication limitations that exist in the high Arctic.
SODA: Stratified Ocean Dynamics of the Arctic
The ‘Stratified Ocean Dynamics of the Arctic’ Departmental Research Initiative (SODA DRI), funded by the Office of Naval Research (ONR), was motivated by the need to understand how the changing Arctic sea ice environment impacts ocean stratification and circulation, sea ice evolution, and the marine acoustic environment. SODA is a highly collaborative project involving over 25 principal investigators from more than a dozen institutions (Lee et al., 2016, 2017).
The program’s science objectives aim to quantify and understand the processes affecting buoyancy, momentum, and heat within the upper-ocean. To do this, the team utilized a series of autonomous instruments to measure key atmospheric, oceanographic and sea ice parameters over an annual cycle. Together, this coordinated array of instrumentation aims to elucidate the impact of changing sea ice properties on momentum and heat transfer from the atmosphere to the upper-ocean.
In order to achieve these aims, two separate research cruises took place in Fall 2018: (Cruise 1) a process study cruise aboard the R/V Sikuliaq focused on processes at the shelf break and in the southern portion of the Beaufort Gyre, and (Cruise 2) a cruise on USCGC Healy (hereafter Healy) to deploy science moorings in 3 locations (to capture ocean and ice properties), autonomous gliders that sample between and around the moorings (guided by signals from an array of navigation moorings), and several ice-based instruments that measure atmospheric, ice, and oceanic properties while drifting with the ice pack (Figure 1). These clusters included Ice Tethered Profilers (ITP1), Autonomous Ocean Flux Buoys (AOFB; Shaw et al., 2008), and Weather, Waves-Ice Mass Balance-Ocean buoy (WIMBO; Doble et al., 2017). Pressure-Inverted Echosounders (PIES) and Air Launched Autonomous Micro-Observer (ALAMO2) profiling floats were also deployed as part of SODA.
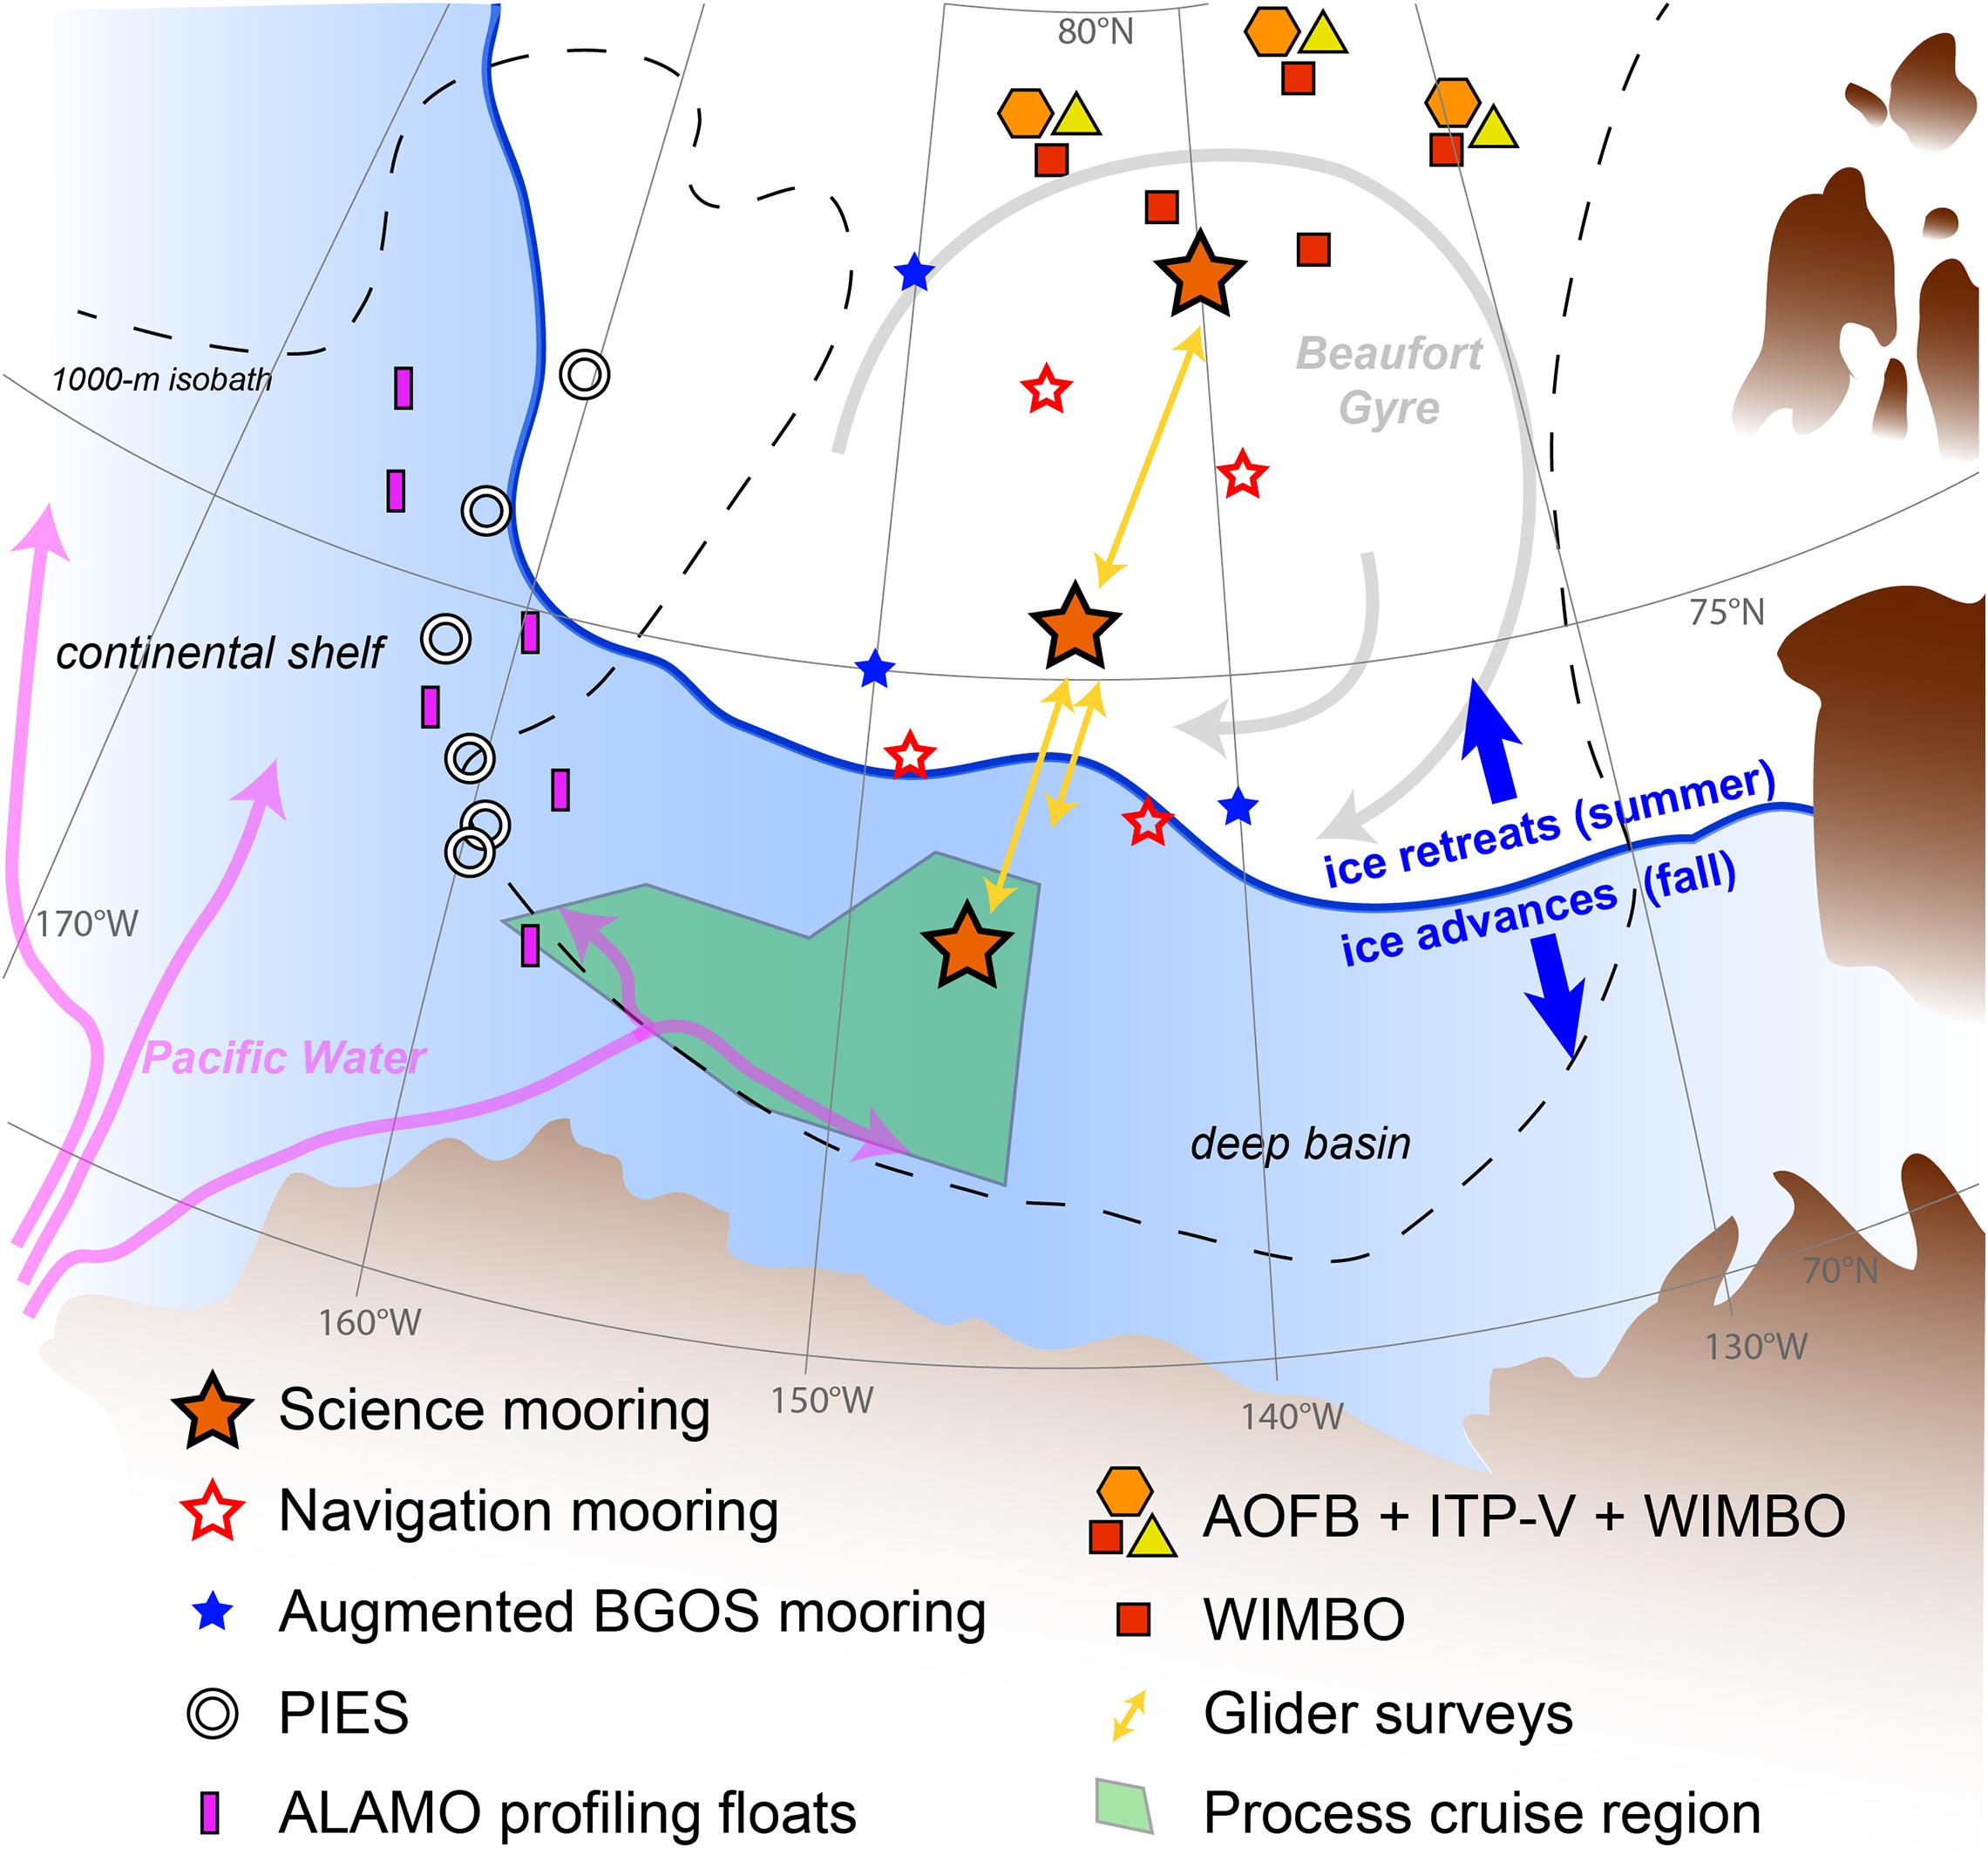
Figure 1. Schematic map of the SODA observational assets. The orange hexagons (ITP-V), yellow triangles (AOFB) and red squares (WIMBO) mark instruments deployed directly onto sea ice. Note that there are 3 clusters that include all three instruments, plus two additional WIMBO sites. Science moorings (orange stars) are surrounded by acoustic navigation moorings (red stars), providing positional information for the gliders (yellow lines) when sampling under a canopy of sea ice. The Sikuliaq process cruise took place in the region highlighted in green. Healy deployed the moorings and ice instruments (up to 80°N). Argo and ALAMO floats (purple triangles) and PIES monitor circulation from the shelf to the deep basin.
As the cruises were operating in both ice-covered and ice-free regions in Fall, the ice conditions were expected to be changeable and the weather tempestuous. Consequently, obtaining high-quality and near-real time knowledge of the weather, ice conditions and ocean properties was a priority for SODA field teams. Scientists aboard R/V Sikuliaq focused on capturing key processes at the constantly evolving ice edge, or along dynamic oceanic features, and thus needed a thorough understanding of the local environment along with the ability to constantly adapt their sampling strategy to environmental conditions and to real-time observations. The Healy team focused on logistical and scientific operations needed for mooring, glider and buoy deployments; thus, they required advanced knowledge of weather and ice conditions. Beyond the mooring and glider requirements, the team needed to locate thick ice floes away from the ice edge upon which to deploy their ice-based instruments. Co-locating several complementary ice-based platforms on one ice floe greatly increases the value of the collected data set relative to distributing these assets over a wider area. Even though all the on-ice assets float, it is advisable to avoid open-water deployments because instruments deployed into open water will disperse rapidly and have failure rates of >50% during freeze up, largely due to damage from rafting by newly formed ice. The requirement for co-location of assets combined with our apprehension of not finding thick enough ice to deploy these assets (due to a warming Arctic) motivated us to spend considerable time and energy ensuring we had adequate situational awareness whilst on our scientific cruises.
This paper focuses on the situational awareness products and protocols used by the team on the Healy cruises, although similar protocols were utilized by the Sikuliaq team. Our intent is to highlight the protocols and procedures, along with the close relationship between the science users, the ship operators (here, the United States Coast Guard), and the supporting agencies that are needed in order to increase the throughput of near-real time situational awareness information to a remote field party. In particular, the U.S. National Ice Center (USNIC) was a key supporting agency for these ship-based campaigns and the SODA program as a whole. USNIC’s mission is to provide global to tactical scale sea ice and snow products, sea ice forecasting, and other environmental intelligence services for the United States government, and the programs it supports. USNIC routinely provides up-to-date analyses of the ice types and position of the ice edge on its public website, but it can also provide targeted analyses for specific missions and research programs.
Situational Awareness Products
Seamless access to, and an understanding of, satellite images, model output, weather charts and other observational products, is essential to provide the situational awareness that one needs to excel in the Arctic marine environment. There are a wide range of products that are freely available from different space agencies, weather outlets, and associated organizations. Exactly which products are routinely used operationally depends on the expertise of the team along with the needs and location of the mission. Normally there is no single product or service that provides an ideal solution, so effective situational awareness must be achieved through the blending of several products. This multi-product approach reinforces the need to seriously consider the tools and formats required to support the integrated visualization of all the geospatial information products. By identifying the suite of products needed, and being familiar with their visualization and interpretation, a vessel operating in ice-infested waters should be able to navigate through, or around, the sea ice more effectively, and thus efficiently and safely achieve the objectives of the mission.
It is the most up-to-date products that have the maximum value. Generally, the time-window associated with situational awareness products is usually less than 24 h from the time of collection. Forecasts, such as weather predictions, are valuable out to about 5 days, and this advanced knowledge will allow for significant weather events (that could affect operations) to be identified and ensure preparations can be made in advance. Figure 2 captures the time-period associated with the tactical planning for forecasts (Tactical Future) and near-real time data such as satellite observations that have been collected (Tactical past). It also shows the varying spatial resolution of available products, with higher resolution generally providing only local coverage, and lower resolution information required for wider regional coverage.
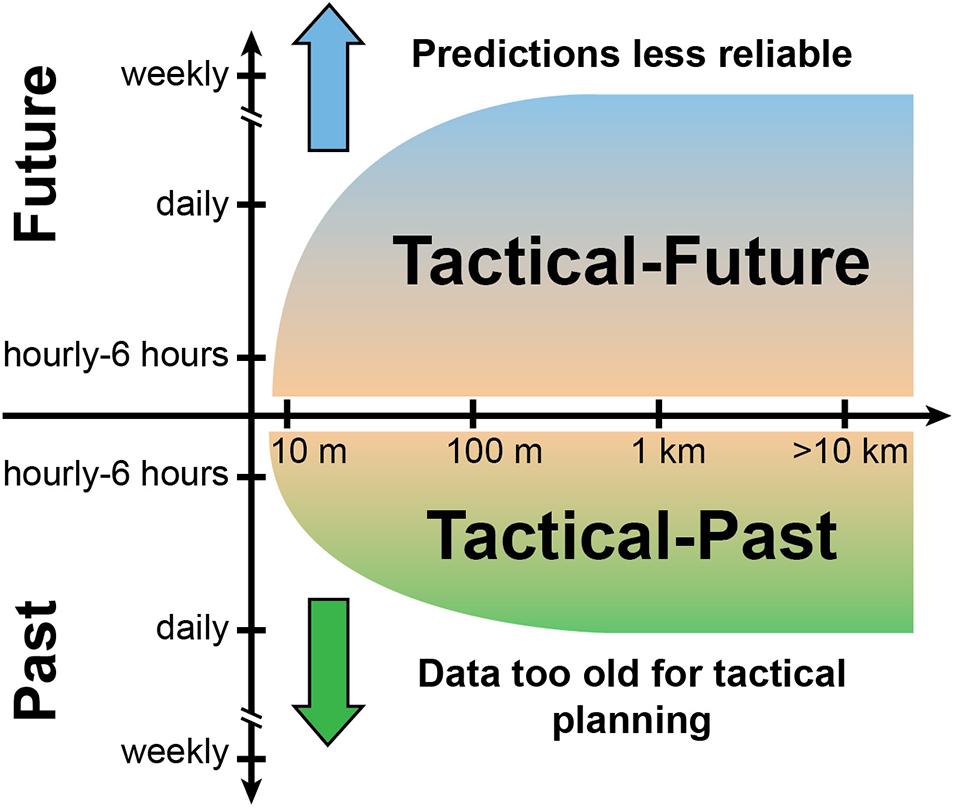
Figure 2. Schematic showing the timeline associated with the usefulness of Earth Observing, modeling, and forecast products. The older the product the less useful it becomes for tactical planning. Different uses will likely require products with different horizontal resolutions (horizontal axis) and coverage.
It is beyond the scope of this document to provide links to all the various satellite, modeling and weather products available. But many products that are routinely accessed by the ship operators and/or field-based personnel are listed in the catalogs maintained by, amongst others, the United States National Aeronautics and Space Administration (NASA) and the EU Copernicus services. Most of these products are available at no cost, but they often have challenges associated with automatically downloading them and/or making them available in a format that is useful to specific users. Resources exist online to browse and identify relevant products, like the Polar View consortium3 and NASA’s Worldview https://worldview.earthdata.nasa.gov.
For completeness we provide an overview of the products sent to, and utilized by, our field teams aboard Healy:
(a) Sea ice products: ice conditions change constantly, requiring information on a wide range of scales. We utilized the following Earth Observation products:
– Synthetic Aperture Radar (SAR) satellite imagery: SAR is routinely used for ship-based navigation in ice covered seas. The advantage of SAR images is that they are high resolution, can see through the polar night and ubiquitous Arctic clouds, and most importantly the backscatter characteristics (the amount of energy that returns to SAR sensor) can be used to clearly distinguish sea ice floes, sea ice ridges, leads, and ice type (e.g., Kwok et al., 1999). Furthermore, the motion of the sea ice can be derived from repeat pass SAR imagery. For our needs we utilized both publicly available SAR imagery (e.g., Sentinel-1), as well as others specifically ordered to support the mission (e.g., RADARSAT-2, COSMO-SkyMed, and TerraSAR-X).
– Visible imagery: visible imagery has the advantage of being relatively easy for untrained personnel to interpret; it can be thought of as equivalent to a photograph. In addition, many vessels have a local onboard reception capability for visible imagery (e.g., DARTCOM) which provides access to imagery independent of internet connectivity. Visible imagery does have the disadvantage that it cannot see through the polar night or clouds (a limitation in the polar regions), and thus many images may not be utilized to their full potential. The SODA shore-team occasionally downloaded MODIS visual images directly from the tools provided in Worldview.
– Passive Microwave: since the late 1970’s passive microwave-derived ice concentration maps have been available over the Polar Regions. These daily images provide a pan-arctic overview of the ice concentration and extent. While they have relatively low spatial resolution, they do provide a good, reliable, routine and daily representation of ice conditions, particularly in Winter and Spring, with reduced accuracy in Summer and Fall due to ice surface melt.
– Ice charts: the United States National Ice Center (USNIC) regularly provides ice charts detailing the ice types and position of the ice edge. In addition to products publicly available, USNIC specialists can provide targeted analyses to projects supported by United States agencies, identifying regions of older, thicker ice for example. In our case, it was this ice type that we wanted to deploy our assets on, as it gives them the best chance for survivability. We utilized both the standard ice charts and their specialized product.
(b) Weather products: daily access to the latest weather forecasts is mandatory for any field program. The Arctic weather can be severe, and an up-to-date picture of the local weather conditions is essential. We note that ships often have access to separate targeted weather reports (e.g., Healy receives daily reports from the Naval Fleet Weather Center Norfolk VA). More generally, access to forecasts is needed for ‘on the fly’ planning as Arctic field campaigns are very weather dependent. Ideally, 12, 24, 48, and 72 h forecasts should be available daily.
– Weather charts: partners at the United States National Weather Services also provided targeted weather forecasts to the ship operators and scientists in the fields, complementing more broadly available tools displaying weather conditions and forecasts. For example, the https://www.windy.com site maintained by a private company elegantly displays the European Centre for Medium-Range Weather Forecasts (ECMWF) and Global Forecast System (GFS) forecast models.
(c) Model products: some variables, such as sea ice thickness or certain ocean properties, are not available in near real-time. For these products we relied on model output.
– Model sea ice extent, thickness and drift data were obtained from the Naval Research Laboratory’s high-resolution Global Ocean Forecasting System (GOFS) model. This output, with forecasts over the next 24–48 h, was made available for the Chukchi and Beaufort Seas (the SODA operational area).
Other products are also derived in near-real time from analysis of SAR and other remote sensing products. For example, daily sea ice drifts based on a Maximum Cross Correlation technique are now routinely available from various data centers (e.g., European Organisation for the Exploitation of Meteorological Satellites (EUMETSAT), Ocean and Sea Ice Satellite Application Facilities (OSI SAF)]. Some projects augment these capabilities with specific modeling efforts – for example, the Sea Ice Drift Forecast Experiment (SIDFEx4), to predict the drift of the Multidisciplinary drifting Observatory for the Study of Arctic Climate (MOSAiC).
Communication Limitations of Operating in the High Arctic
Moving data to and from vessels operating at high latitudes presents challenges beyond those encountered at lower latitudes. The primary mode for a vessel to move and receive data is through satellite communication systems, which is normally achieved by C, Ku, or Ka-band transmission via high-orbit geosynchronous satellites. These systems maintain a high equatorial orbit, so that their apparent position as viewed from the Earth’s surface does not change. These large spaceborne communication assets are extremely expensive and difficult to develop, manufacture, launch, maintain, and operate, and accordingly tend to be designed and configured in ways intended to maximize revenue, rather than enable and enhance communication in the sparsely populated polar areas. As a result, there are only a few geostationary communication satellite systems available in polar regions (Inmarsat, Eutelsat, Thuraya, Intelsat, etc.), and all have limited coverage poleward of 75°, and essentially no coverage above 80°N (Figure 3).
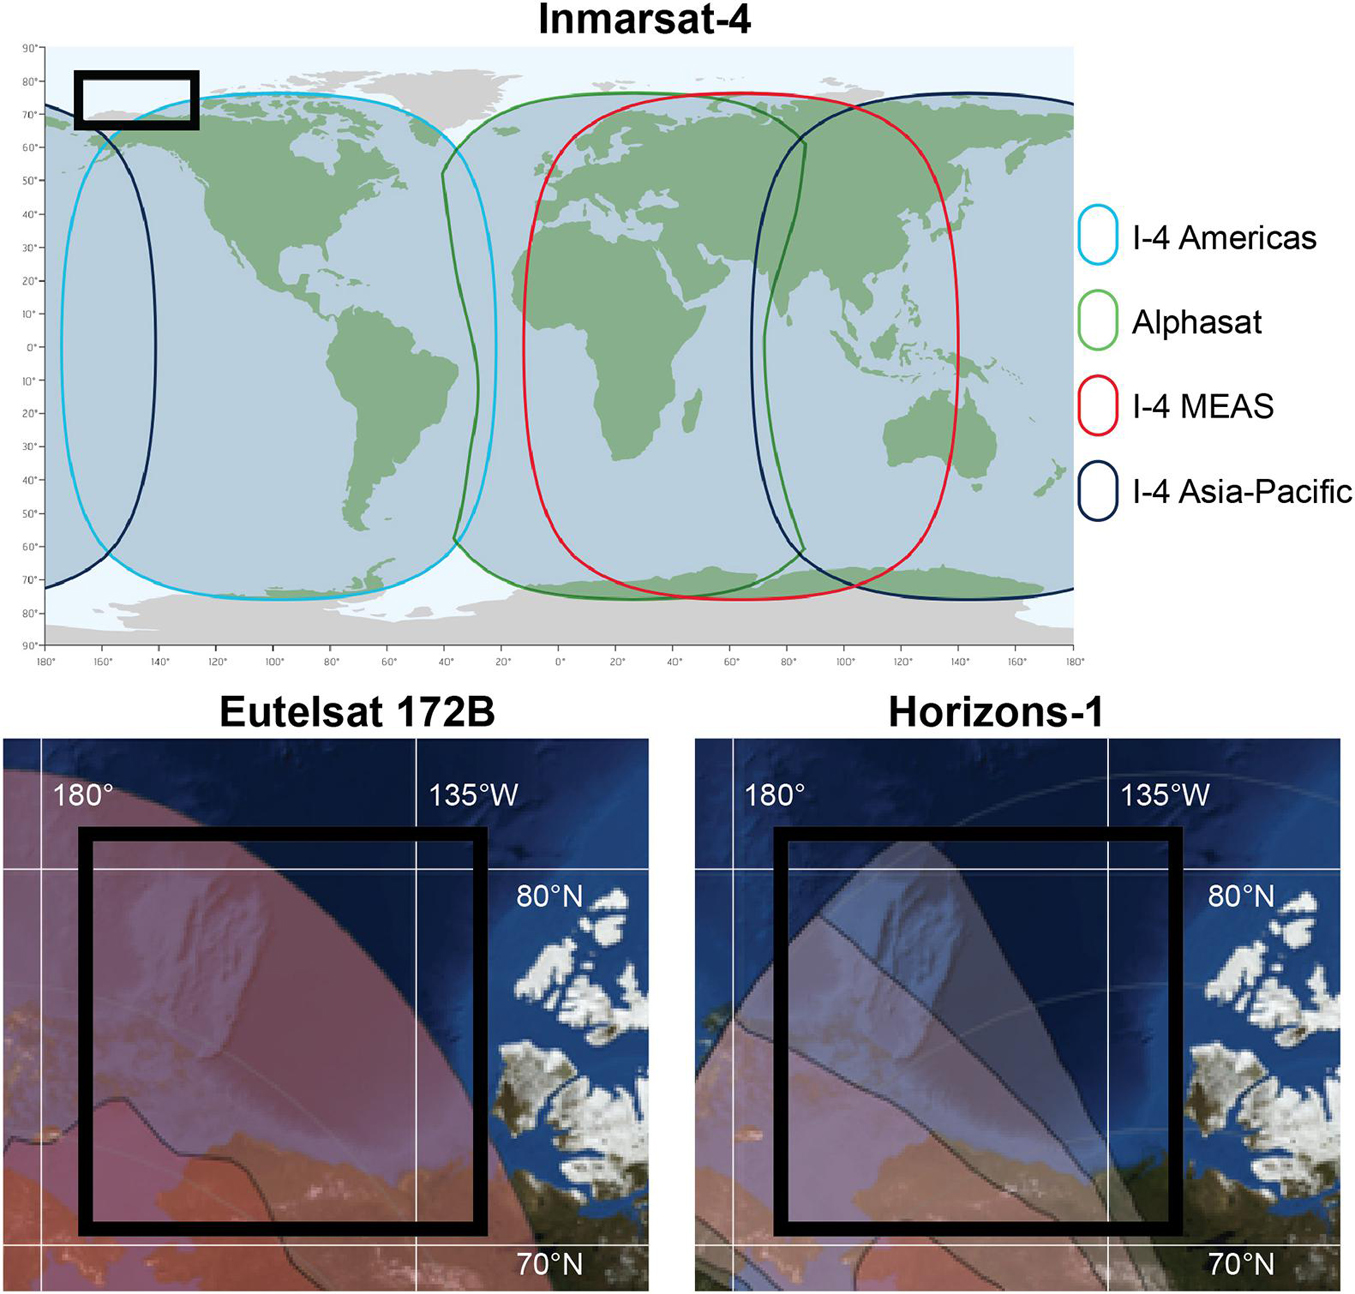
Figure 3. Map of Ku band coverage projection from (top) the Inmarsat constellation, from inmarsat.com, for (bottom left) Eutelsat 172B North Pacific Ku-band transceiver. Increasingly red shades indicate larger relative effective radiative transmit power of the satellite (signal strength). SODA operation region is highlighted (black rectangles).
At latitudes above 80°N and for applications requiring less bandwidth, one can use low earth orbiting (LEO) communication satellites, of which the internally routing Iridium satellite constellation is the main provider. As LEOs are deployed in large numbers they are able to provide full global coverage for voice and data, although the bandwidth is severely limited (around 1,300 bps). We note that a new generation of Iridium satellites, known as CERTUS, has the potential to further revolutionize data transmissions in the high Arctic by increasing the bandwidth by about a factor of 50 (Jones et al., 2019).
System Designed to Enhance Situational Awareness
Overview
Perhaps the most critical component of situational awareness is the need for good lines of communication, along with clear mission objectives. Starting several months before the field program, the team of SODA investigators held regular teleconferences, which were aimed at establishing the needs and priorities of the mission, as well as identifying Partners that were essential to the success of the mission: the logistics providers (in our case, the USCG), and the operational sea ice charting community (primarily USNIC).
Regular communication and coordination between the science party, the USCG and the USNIC allowed the SODA team (and its partners) to identify what situational awareness products were needed, and who could provide them. The next step was to develop the mechanisms to automatically obtain these products as soon as they became available from the providers, archive them on a data-server in a logical manner, and to provide the protocols to automatically ‘push’ these products to the field-team, or for the field-team to ‘pull’ the products from the server. An overview of the developed system (Figure 4) is provided in this section, and the components are described in more detail below.
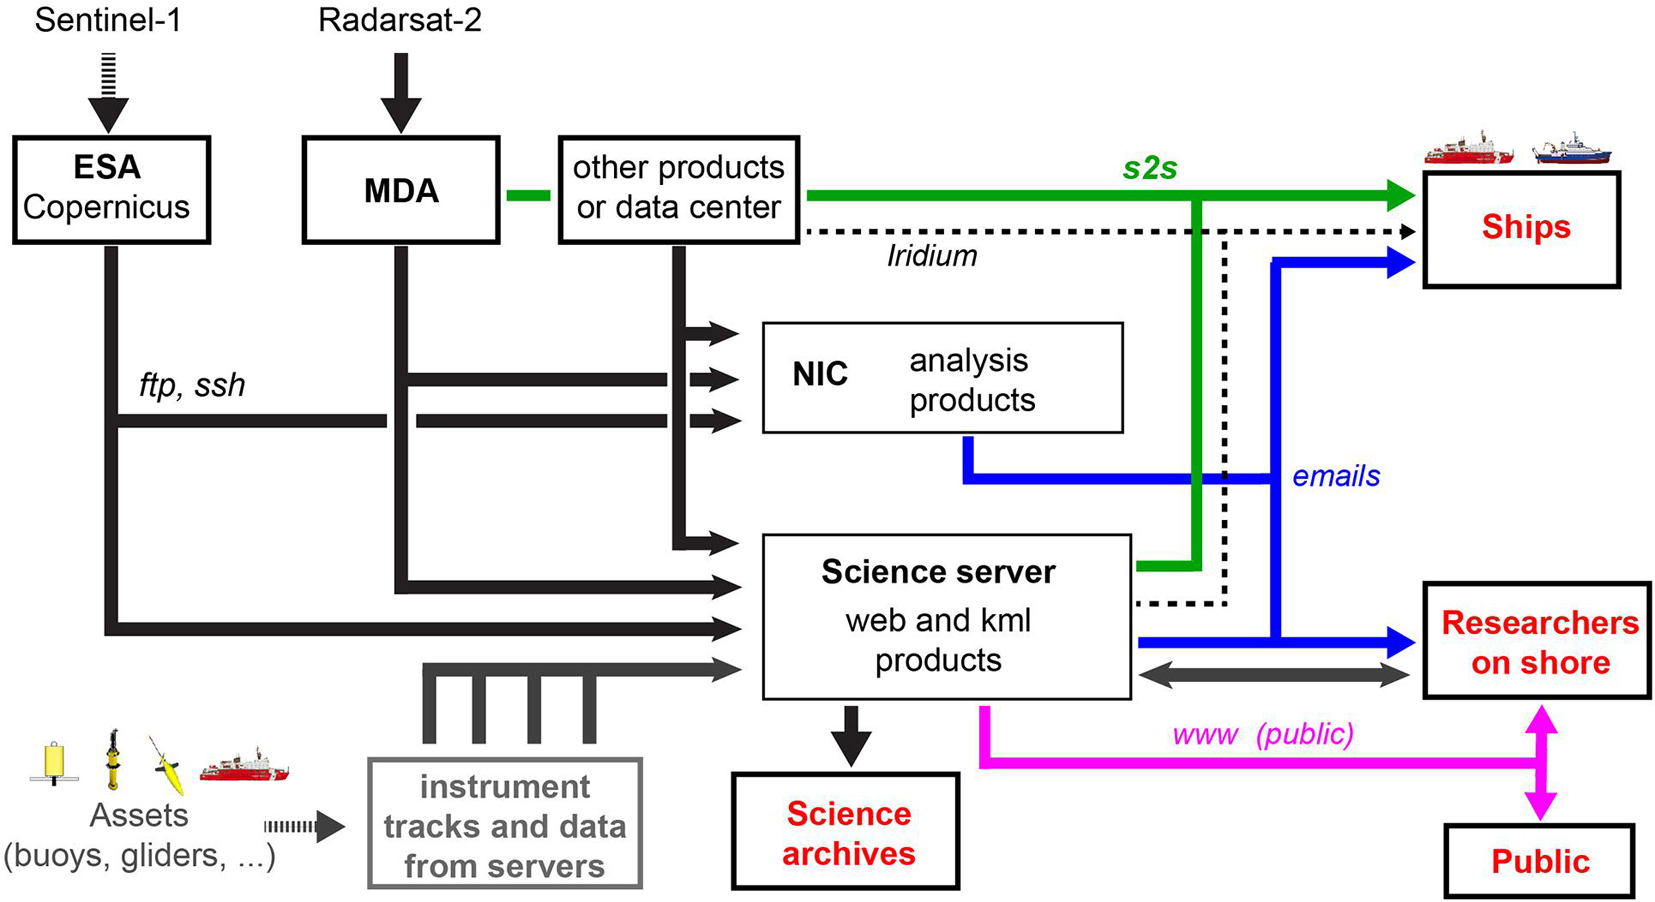
Figure 4. Block diagram of the information sharing during the SODA field campaigns. Data and product providers (black boxes) provide information to users (red). The system and its connection pathways (arrows) are described in detail in the text.
The three black boxes in upper left in Figure 4 represent the satellite remote sensing and other essential situational awareness products (see section “Ordering and Acquiring Products”). These were automatically downloaded directly from data providers via fast and secure protocols (solid black arrows in Figure 4) by both the USNIC and a science server located at the Applied Physics Laboratory, University of Washington (APL-UW). Each product was obtained by slightly different means: Sentinel-1 data were available through the ESA Copernicus servers, whilst for RADARSAT-2, a direct connection between the science and the prime contractor, MacDonald Dettwiler and Associates (MDA), was established to limit the latency in obtaining the images. Other products, such as ice concentration, weather charts, and model outputs, were also included in the suite of products shared and archived. In addition, a centralized database of the hourly positions (drift tracks) of all deployed assets was maintained on the science server (Figure 4, gray box; see section “Drift Tracks From Deployed Instrumentation”). Some products, such as the USNIC ice analysis charts (as well as their bespoke SODA product), were distributed to investigators and ships via email (Figure 4, blue arrows; see section “Operational Sea Ice Analysis From USNIC”).
To ensure all products were up to date, they were automatically downloaded as soon as they became available from the provider and processed on a science-server at APL-UW (RADARSAT-2 were processed directly by MDA for Healy). Because of known communication limitations, satellite products were resampled into different spatial resolutions; high-resolution/large file size images for good bandwidth regions, through to low-resolution/small file sizes for lower bandwidth regions. An additional high-resolution product was produced for specific areas, e.g., such as small regions around the planned mooring sites. To further ensure efficient transfer, a low-resolution version of each image was produced and posted on a website as both a Google Earth kml and a geotiff (Figure 4, pink arrows; see section “Data Visualization”). These products were also made available to the public. All remote sensing data and products were archived on a separate server, for future analyses and processing.
To ensure the latest information was held by all land-based and ship servers they were synchronized using Ka-Ku-band connection (Figure 4, green arrows; see section “Data Transmission: Getting Data to the Ships”). When Healy sailed out of range of fast Ka-Ku-band communication, smaller file sizes were transmitted through the Iridium connection (Figure 4, dashed arrows).
Ordering and Acquiring Products
SAR: Sentinel-1 Products
Sentinel-1 is a pair of satellites, Sentinel-1A and -B, launched in 2014 and 2016, respectively, that provide all-weather imaging coverage using C-band (5.405 GHz) synthetic aperture radar (SAR). The satellites are part of the European Copernicus Programme, which has a further five types of Earth Observing satellites, all providing routine operational monitoring over large areas of the globe. These are made freely available to all users in near-real time (NRT, <24 h) through Copernicus’ open data policy. Operational users including the Copernicus Marine Environment Monitoring Service (CMEMS) and Collaborative Ground Segment operators including the Norwegian Meteorological Institute, which can also access data in near-real time (<3 h).
The satellites were built and operated by the European Space Agency (ESA) on behalf of the European Commission Copernicus Programme. The imaging capabilities of Sentinel-1 are similar to those of the older Canadian RADARSAT-2, but with fewer imaging modes. The two main modes are (1) Extra Wide (EW) with a swath width of 400 km and pixel size of 40 m, typically used for maritime monitoring including the polar regions, and (2) Interferometric Wide (IW) with a swath width of 250 km and higher spatial resolution (20 m pixel size), used for land monitoring. An additional two modes, Stripmap and Wave, are used for high resolution disaster and emergency mapping, and ocean background monitoring, respectively. The imaging can also be conducted as single co-polarization (HH or VV) or dual co- and cross-polarization (HH + HV or VV + VH), with single polarization being used over open ocean and high sea ice concentrations, and dual polarization being used over the marginal ice zone (MIZ). Apart from the Stripmap mode the monitoring modes acquire data according to a predetermined coverage that is designed in consultation with users, primarily the Copernicus services. As SAR is a power intensive and high data volume instrument, operating time is limited to 25 min per orbit. This can prioritize daily coverage of areas of the Arctic and Antarctic of European interest, with areas outside of these regions, including the Beaufort Sea, being covered less frequently.
Data are available via a number of web portals and online sites, depending on the user. The primary source is the Copernicus Open Access Hub5. This, and a number of other portals specific to Copernicus services or national space agencies, e.g., the Norwegian Collaborative Ground Segment6, provide a rolling archive of the most recent data using a common application program interface (API). For older archive data, Copernicus has set up a number of Data and Information Access Services (DIAS) that provide data access and commercial cloud computing resources. In addition, ESA established a number of Thematic Exploitation Platforms (TEPs), including the Polar-TEP7, that provide a similar data exploration and processing capability.
The use of a common API allows scripting for automated downloading and processing of Sentinel-1 data, for example the Check ESA SciHub routine8 and ESA SNAP software9. Such. scripts were used during SODA to automatically download all images overlapping with a polygon extending from 70 to 83°N and 170° to 130°W.
SAR: RADARSAT-2 Products
The USNIC typically orders RADARSAT-2 imagery on a monthly basis to meet the needs of USNIC analysts creating their freely available daily and weekly ice products, as well as to support active missions (like SODA) in the Arctic. When planning and placing orders, the USNIC employs a “follow the marginal ice zone (MIZ)” approach. The MIZ is a transition area between open water and full ice cover, it is typically the most dynamic during the freeze-up/melt seasons. Orders are focused on regions for which Sentinel imagery is not available and placement is based on current ice conditions, past climatology, and current forecasts. A bulk imagery request covering a 30-day period is submitted to MDA 1–2 weeks before the first image acquisition. Orders are sent to MDA for approval and to resolve any conflicts with other commercial RS-2 users, due to tasking limitations of the satellite. Generally, the USNIC orders images in ScanSAR Wide mode, which provides the largest, 500 km, footprint and 100-m resolution.
In addition to placing RADARSAT-2 imagery orders for nominal operations, the USNIC also creates customized imagery plans for special support missions, such as the SODA mission. The USNIC communicates extensively with active missions to best utilize joint resources. This includes staying updated on a ship’s planned intended movements (PIM), while providing updated kml files which show imagery footprints and metadata. The USNIC is able to adjust RADARSAT-2 imagery orders up to 3 days prior to an image acquisition without incurring financial penalties. This allows the USNIC to continually update plans to account for changing sea ice conditions and ship movement. Orders placed, or altered, with less than 3 days’ notice have a much higher risk of not being acquired due to conflicts or other tasking limitations.
Images are acquired and downloaded from one of several ground stations utilized by MDA. MDA then performs initial processing of the acquired data and posts the data to an ftp site. During SODA, users were alerted via email that a new file was available. Between 20 September and 31 October 2018 (40 days), MDA acquired 147 images in the Beaufort Sea for the USNIC, which were passed to the SODA science team and Healy. The time interval separating the image acquisition to the file being available on the MDA ftp site (latency) had a bimodal distribution: for images acquired between 0000 and 0400 UTC (110 images), the latency was 6.7 ± 1.5 h, but posting was much faster for images acquired from 1,500 to 1,800 UTC (30 images, 0.8 ± 0.2 h). MDA has several latency options available when imagery orders are placed. Two latency options were utilized for the SODA missions, near-real time (the fastest option) and rush. Imagery defined as near-real time is made available up to 4 h after being downlinked from the satellite to the ground station. This option was utilized for acquisitions from 1,500 to 1,800 UTC, allowing the USNIC analysts on duty to utilize the most up to date imagery. When analysts are not on duty, the rush option is utilized which allows for a longer latency (6–24 h). This allows the USNIC to optimize financial resources while ensuring that mission needs are met. All images were available within 12 h of acquisition, with the fastest delivery being 0.3 h.
Other SAR Products
During the SODA campaigns, additional high-resolution SAR remote sensing imagery on specific targets (such as the on-ice instruments clusters, and Sikuliaq during the process study cruise) was ordered, purchased, and processed by the Center for Southeastern Tropical Advanced Remote Sensing (CSTARS) at the University of Miami. The cost of these images has to be weighed against their utility. In this case, guided by the SODA Science Plan (Lee et al., 2016), the very high-resolution images (order of a meter) are important for estimating ice characteristics around the instruments measuring the ice/ocean interface. These images were primarily collected by the COSMO-SkyMed (COnstellation of small Satellites for the Mediterranean basin Observation) system operated by e-GEOS for the Italian Space Agency (ASI), and the TanDEM-X/TerraSAR-X system operated by Airbus Defence and Space for the German Aerospace Center (DLR). CSTARS is a satellite ground station and provided download and processing services for both satellite systems. During the process cruise, low resolution versions of the image products were provided via email to users on the Sikuliaq within 3 h of acquisition.
CSTARS coordinated with the satellite operators directly to order the imagery. The small footprint (40 by 40 km is typical) of high-resolution Stripmap mode imagery presented an additional challenge for this process compared to the acquisition of wide-area ScanSAR imagery. Requesting a satellite image within a cost-effective 24–48-h (depending on system) window prior to collection required forecasting the target’s location in approximately 30–54 h. For the process cruise, this involved consultations between a CSTARS scientist on board the Sikuliaq, the chief scientist, and the ship’s officers, the outcome of which was passed along to CSTARS personnel at the ground station, who then performed a feasibility analysis to match target time and location with satellite orbit characteristics, before ordering the optimal acquisition. The process was similar for the on-ice instrument clusters, with CSTARS personnel typically utilizing the current position of an asset and a simple persistence drift model to forecast its location at image acquisition time. The success rate of capturing the target in imagery depended on many factors, including the nature of the target and environmental conditions, but generally exceeded 85%.
Passive Microwave
Pan-Arctic sea ice conditions derived from passive microwave instruments have been a standard product for over 40 years. We obtained daily from AMSR2 (and AMSR-E) sea ice concentrations in near real time (Spreen et al., 2008) and posted at https://seaice.uni-bremen.de/sea-ice-concentration/amsre-amsr2/. This service is part of the GMES project Polar View and of the Arctic Regional Ocean Observing System (Arctic ROOS).
Drift Tracks From Deployed Instrumentation
SODA, like many similar large field programs, employed a diverse mix of platforms and sensors. Visualization of asset locations was critical for maintaining efficient operations and optimizing the use of observing resources. Every instrument transmitted its location on an hourly (or less) basis, together with other data from on-board sensors. The owner of each instrument typically has their own server where they gather the transmitted position information and data. The science server at APL-UW automatically gathered this information for all the instruments listed in Figure 1 and posted their respective time-stamped positions (tracks) in a common format in a common place.
It was quickly realized that any single graphical file or kml generated won’t satisfy everyone. Our solution was to make a simple compromise kml file that worked for the users on the ship and on shore, and produce, uniformly formatted, time-latitude-longitude text files for every instrument. It should be noted that simply pointing to all the different servers is not enough, since protocol issues and format changes inevitably occur. An often neglected challenge is that several hours per week are typically spent by someone on shore to maintain simple processes like generating the position text files from various instruments. These files are in turn used by many researchers both in real time and in post processing.
Operational Sea Ice Analysis From USNIC
An important component of the situational awareness during SODA was two-way communication with the United States National Ice Center (USNIC). At an early stage USNIC was engaged with the SODA scientists and detailed plans were drawn up to provide regular annotated images of the ice conditions in the operating area (Figure 5), well before the ship sailed and instruments were deployed. In addition to being invaluable during the field program to guide operations, having access to these analyses before the cruise enabled the team to obtain a good understanding of the ice conditions in the region of operation well before they are actually encountered.
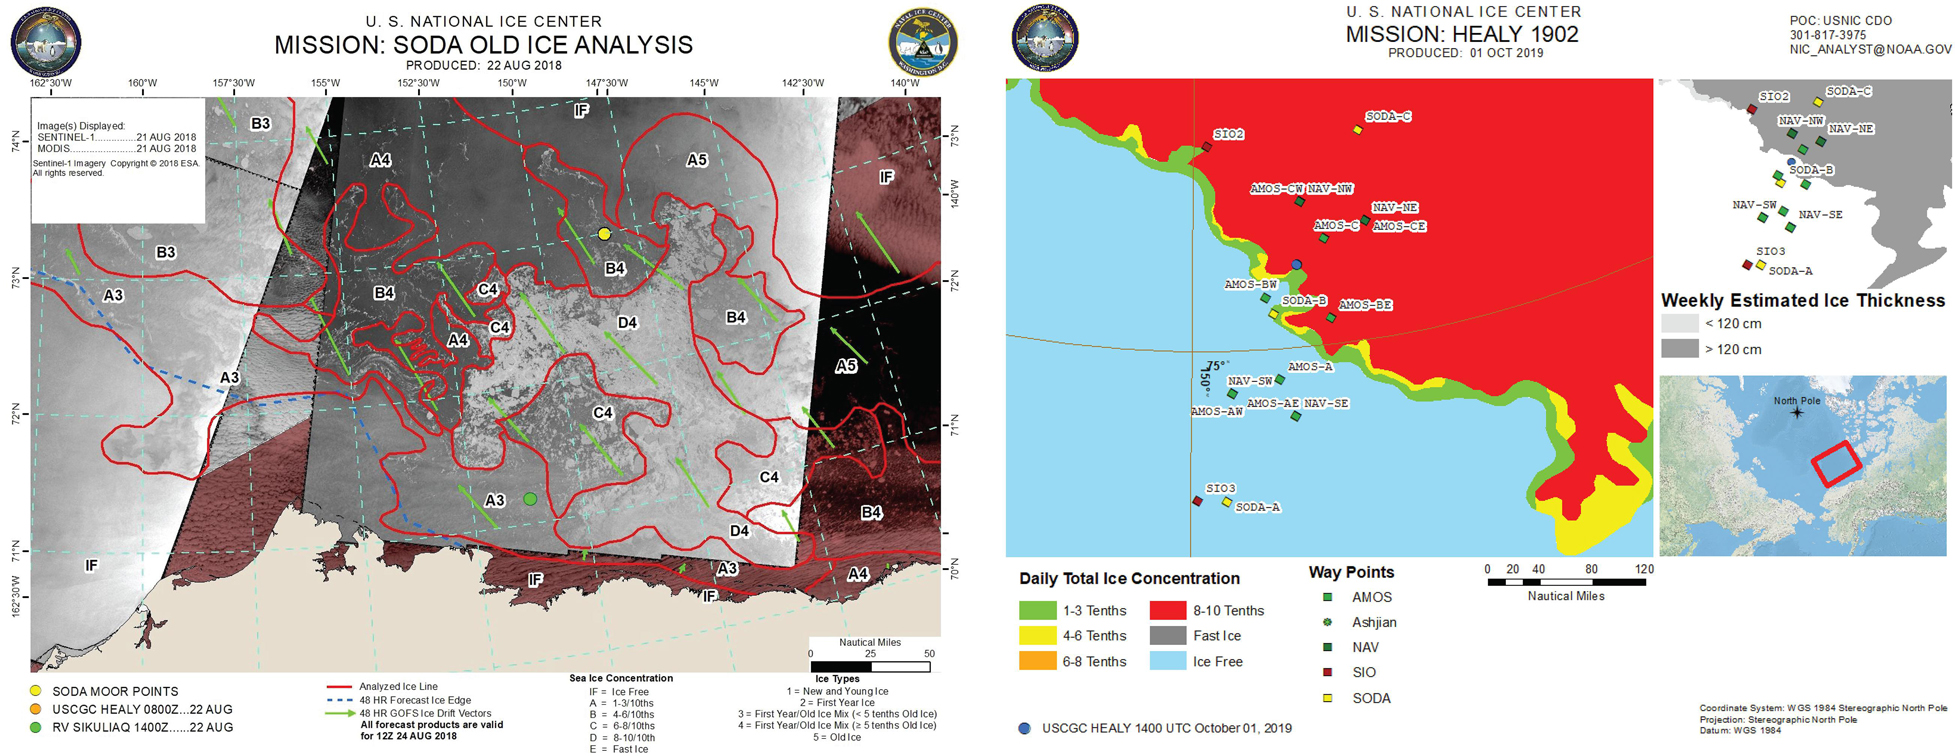
Figure 5. (Left) Annotated image showing ice analysis from USNIC for August 22, 2018. Background is a mosaic of SAR images from RADARSAT-2 and Sentinel-1 (gray images), and visual (MODIS) images (pink to black images). (Right) USNIC ice analysis for October 01, 2019, showing ice types and estimated thickness around the SODA array during the recovery cruise.
These analyses combined all the remote sensing products available to the USNIC analysts. Typically, the USNIC supplements visual satellite images with images from Synthetic Aperture Radar (SAR) satellites, some of them available publicly (e.g., Sentinel-1 from the European Space Agency) and other specifically ordered to support their mission (e.g., RADARSAT-2). For SODA the USNIC specialists were asked to identify regions of older, thicker ice. It was this ice type that we wanted to deploy our assets on, as it gives them the best chance for survivability.
Formatting/File Size Challenges
Full resolution extra wide swath (EW) or ScanSAR Wide SAR images can have a pixel resolution smaller than 50 m and be several hundreds of km wide. Higher resolution products can have resolution on the order of a meter. As a result, their file size is generally too large to be sent over a bandwidth-limited communication system. After compression and downsizing, each of the S1 and RS2 overlays were reduced to about 300 KB in size. This size can reasonably be transmitted even with low-bandwidth connections.
Understanding the environment, the needs of the mission, and the limitations in communication ensures that the most relevant information can be extracted from the latest situational awareness products for a specific region. This knowledge is particularly important as it guides decisions regarding how much a product can be downgraded in resolution, and/or compressed in order to still be useful for evidence-based decision making in the field. During SODA, detailed images were generated with 100 m resolution over a 100 km × 100 km box centered on a planned operational site, such as a mooring deployment. Each of these high-resolution images was between 3 and 4 MB in size.
Data Transmission: Getting Data to the Ships
The ship-to-shore (S2S) system uses an open-source software package, Syncthing10, as a robust, highly configurable and fault tolerant transport protocol which synchronizes data efficiently over any Internet connection. Data is synced between directories on ship and shore side nodes, and local area network (LAN) access for scientists can be provided by a number of methods including Server Message Block (SMB) network shared drives, File Transfer Protocol (FTP), Hypertext Transfer Protocol (HTTP), Secure Shell (SSH), rsync, etc. Syncthing is a highly customizable service allowing data propagated across nodes to be prioritized, bandwidth throttled and targeted for custom purposes. Bandwidth throttling is particularly important over satellite networks such that data syncing does not saturate limited vessel bandwidth. Only new and modified files are copied, data can be modified on either end of a sync, and data synchronization runs continually without external scripting, automatically resuming following network interruptions. Syncthing runs transparently on Windows, Mac, Android, and all Linux platforms.
For the purposes of SODA, a shore-side Syncthing server, located at University of Alaska Fairbanks (UAF), was used to sync directly to Syncthing nodes on Healy and Sikuliaq. In this configuration both Healy and Sikuliaq servers were able to synchronize data to and from shore independently of satellite bandwidth availability on the other vessel. Access to data propagated across these nodes varies from node to node:
• On Healy and Sikuliaq, a recurring automatic process uses the rsync program to push data from the shipboard node to the primary shipboard data storage array, where it is accessible to embarked science personnel.
• A shore-server, located at UAF during SODA, acted as a repository for files that needed to be transferred to and from Healy and Sikuliaq.
• Processed images or tracks and other data files were copied to a directory on a server located at APL-UW, a copy of which was pushed to the UAF shore server.
While this configuration requires data to be transmitted twice (Healy → Shore → Sikuliaq), the overall reliability of the system was maximized and worked well with no issues during the SODA cruise.
Lack of familiarity by security groups with modern distributed services and advanced techniques like those used by Syncthing is a potential obstacle for institutions with more traditional security policies. Broader adoption of distributed technologies will require more advanced security discussions and assessment.
If timing is critical, a more direct process (automated or manual ftp or sftp pull upon receipt of notification of product availability) can also be employed. In both cases the primary limiting factor is allocated throughput, which is generally a function of contracted bandwidth on the satellite transceiver. In an academic research context, this is generally a function of economic resource allocation. The return on investment becomes smaller as the ship gets to very high latitudes, further away from the Equator, and transmit power needs to increase in order to reliably attain nominal download rates.
Data Visualization
As parts of the situational awareness system will be used differently by various users, building such a system is an exercise in flexibility. We found that generating a series of network kml files that can be easily accessed through the desktop version of Google Earth (Gorelick et al., 2017) provides a good overview for shore-users with good connectivity. All products described above are therefore packaged as such, extracting only the portion of the fields relevant to the program. With the appropriate time stamp these can be used to visualize and contextualize the data.
For people onshore, we generated a kml with network links, keeping everyone up to date with the latest information. This could be done by simply adding this network link in a desktop version of Google Earth. This “network kml” pointed to the instrument tracks and the remote sensing information. For people on the ship or with limited connectivity, a compressed file that included all the track information locally could be downloaded.
For example, ice concentration maps from passive microwave, RS2 SAR images, and Sentinel-1 SAR images from 23 September 2018 during SODA cruise on Healy is shown in Figure 6.
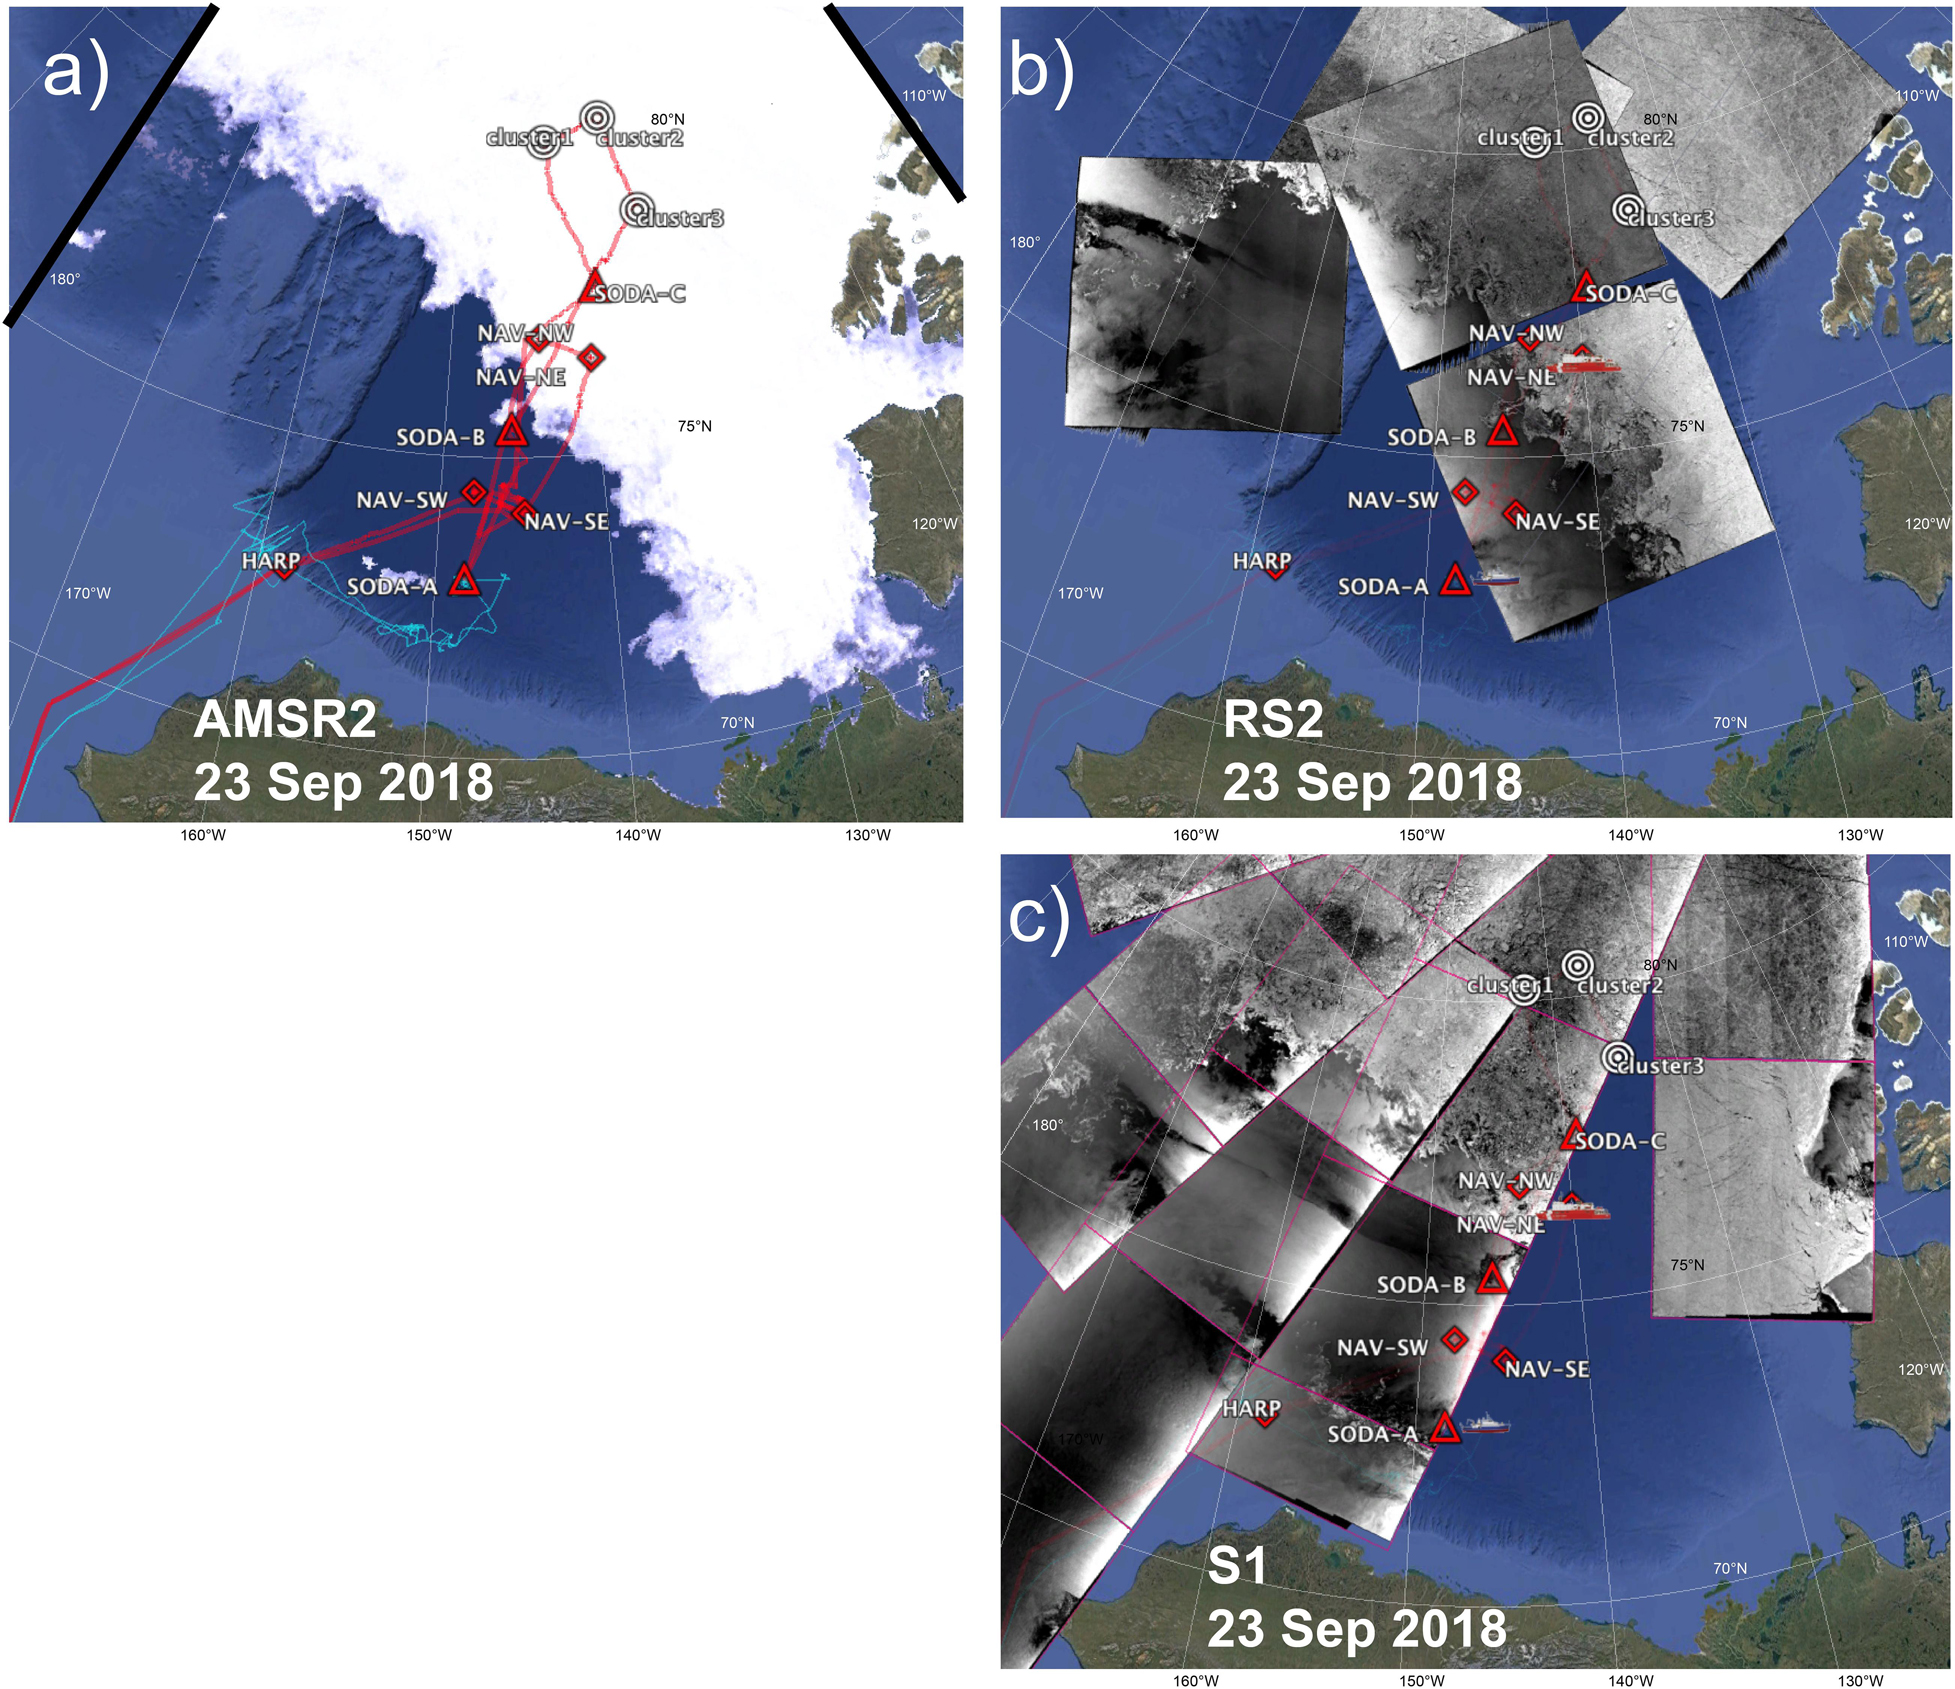
Figure 6. Example of (a) Passive Microwave (AMSR2), displayed only between 170 and 110°W, (b) Radarsat-2, and (c) Sentinel-1 remote sensing products on September 23, 2018. Healy (red) and Sikuliaq (cyan) cruise tracks are shown in (a), and the location of the ships on that day in (b,c). SODA moorings and instrument clusters are also shown. Images are displayed as an overlay in Google Earth.
A local kml version of these files (built by attaching the overlay in a kmz archive as opposed to pointing to a network link) were pushed to the ship and used locally. Acknowledging both licensing issues and personal preferences from various users, the same overlays are also packaged as geotiff, which can be read by various commercial software products (ArcGIS, QGIS, GlobalMapper, etc.).
All instruments have their own kml and txt files (latitude, longitude, and time) on the public server. The positions also included a simple “all_fix.txt” file which listed the latest position of each asset, which can easily be shared with the bridge, for example.
We also note the importance of archiving raw images for future science analyses. Typically, these archives are not publicly accessible, as it is important to also keep track of the security and copyright issues associated with some of the data/images. In their native resolution, SAR data in particular are often proprietary and/or sensitive. Lower resolution and derived products can usually be shared freely. As with most research sponsored by ONR and ONR Global, the SODA program has a clear data sharing agreement protecting data and intellectual contributions, while encouraging collaborations and data sharing both within the program and with the broader community.
The SODA kml is available at UW Digital Library11 and can be downloaded and opened in Google Earth to explore the products described in this paper. The archive is 2.6 GB and includes the ship tracks (Healy, 2018, 2019; Sikuliaq, 2018), the instrument location and tracks (moorings, PIES, ITPs, WIMBOs, AOFBs, and SOLO floats), and the remote sensing images (AMSR2, RS2 and Sentinel-1, as well as the TDX and CSX images acquired by CSTARS; Table 1).
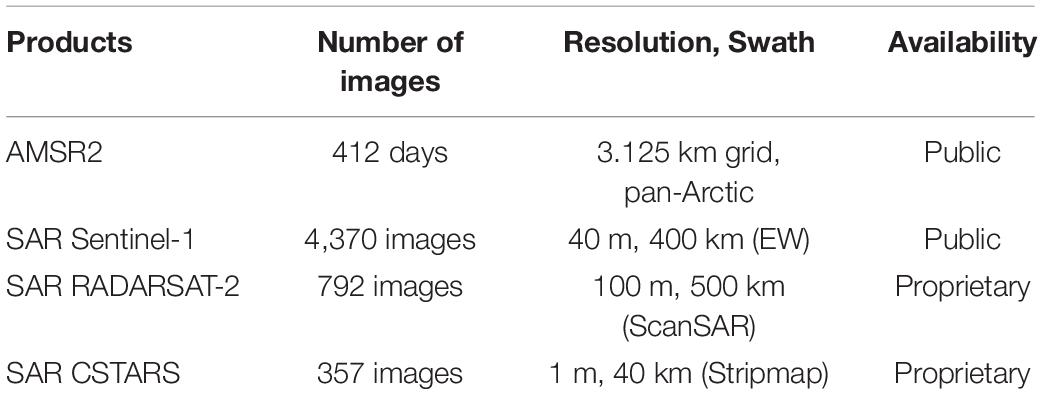
Table 1. Satellite ice imagery acquired during SODA (2018-09-01 to 2019-10-15) in the Beaufort Sea, defined as the region 66–85°N, 180–110°W, included in the SODA kml.
System Applications
Case Study 1: Navigation
Possibly the most important use of situational awareness products for a vessel within ice covered waters is to enhance the safety and efficiency of navigation. The second is to achieve the mission requirements; for SODA this included deployment of clusters of ice-based instruments and moorings in the northern Beaufort Sea. Both of these objectives demanded extensive navigation through ice-covered waters. To support extended work in the ice, an on-board USNIC analyst monitored the sea ice around the ship, along planned paths, and around the different mooring sites through the use of the imagery acquired. Healy did not have a helicopter available for ice reconnaissance flights.
Every evening the Captain, Officers and Chief Scientist would be briefed on the ice conditions for every possible direction the ship may steam over the next 24 h, and to plan accordingly. The briefs would contain images from RADARSAT-2, Sentinel-1 and MODIS/VIIRS with annotation (similar to Figure 5) showing the location of the ice edge, the ship location at the time, mooring locations, and possible paths through thinner ice and leads. From this, the Captain, Operations Officer, Navigator and Chief Scientist would decide which direction the ship would proceed to ensure efficient steaming, or to identify specific mooring locations or deploy ice-based assets. After the evening briefing, the analyst would go up to the bridge with the Operations Officer and the Navigator and aid in plotting out a course using knowledge of the velocity of the sea ice (obtained from model sea ice drift data) and the timing of the satellite images. The model sea ice drift data were from the Naval Research Laboratory’s high-resolution Global Ocean Forecasting System (GOFS) model output for the Chukchi and Beaufort seas. The ice drifts and model wind data were used to brief the officers on a forecast for how the ice would move over the next 24–48 h. All these products were transmitted daily through the situational awareness system. We note that when in the ice pack, the ship and all the floes can be assumed to generally drift together, so relative course can be set using past images to navigate to specific leads or floes.
Case Study 2: Mooring Deployments
Ice cover complicates mooring operations, as it severely restricts vessel maneuverability and poses a threat to mooring hardware and instruments during deployment and recovery. Timely and detailed knowledge of the weather and ice conditions in the vicinity of mooring sites can be used to mitigate risk and improve efficiency by allowing the mooring team to target weather windows as well as favorable features, such as leads or areas dominated by weaker, smaller floes, and guiding path planning to optimize the ship’s approach.
Deployment of science mooring SODA-B illustrates the use of targeted, rapidly delivered satellite remote sensing, and dedicated analyses to guide operations in ice-covered waters. On September 26, 2018, with Healy still 200 km south of the SODA-B target site, passive microwave retrievals for sea ice concentration indicated extensive ice over the site, while weather forecasts predicted strong winds. Faced with a high-risk deployment in high concentrations of rapidly moving ice, the SODA team used the imagery to identify a suitable open-water site south of the original target. Analysis of an RS2 image (Figure 7) received as Healy transited to this alternative site led to a refinement of the target, shifting west to take advantage of winds pushing ice to the east, thus acting to clear the target region. RS2 acquisition had been specifically targeted to support the SODA-B deployment, and was thus able to provide timely, high-resolution scenes suitable to guide real-time decision making. Advance planning and coordination between the SODA team and the USNIC established the communication and decision-making protocols required for nimble, highly responsive targeting of acquisitions. Guided by the image (almost a day old at that point), the ship selected a starting point in open water, at the target latitude, and transited eastward to the ice edge. Healy then positioned into the wind for an open water mooring deployment, beginning the operation almost exactly 24 h after the image acquisition. This application provides a good illustration of adaptive, evidence-based decision making that was guided by targeted remote sensing and weather information and bounded by significant logistical and operation constraints.
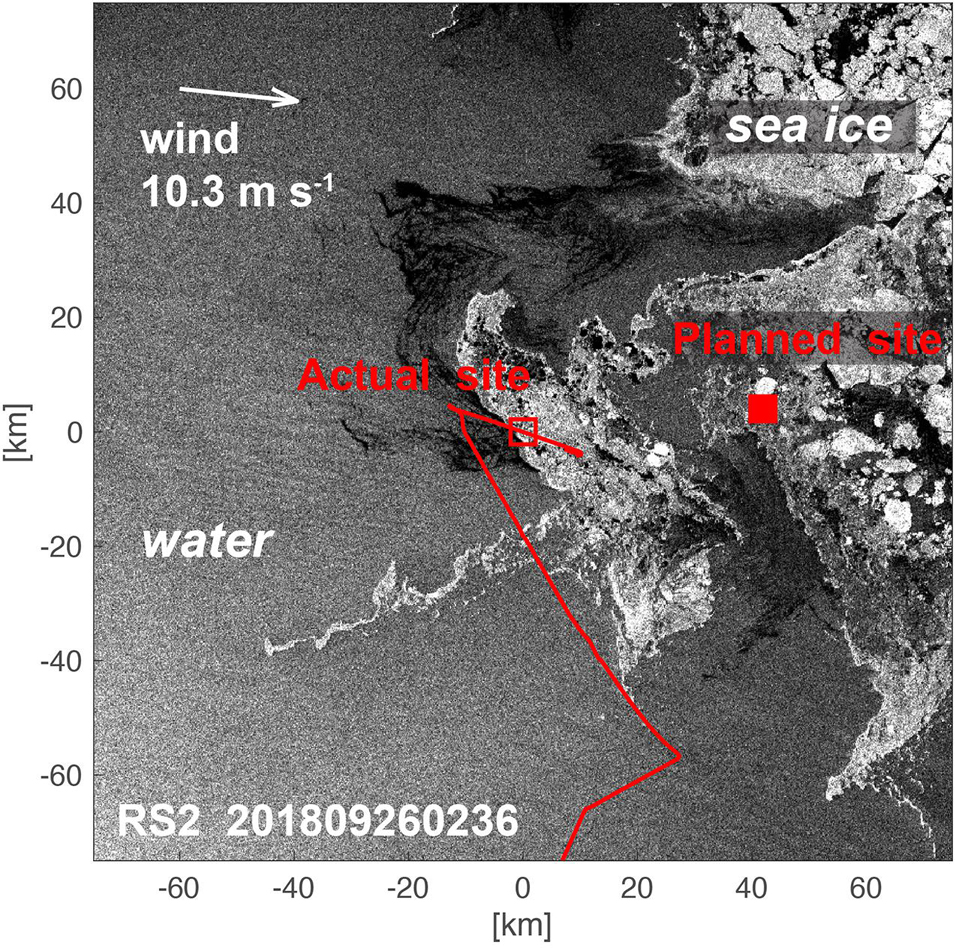
Figure 7. RS2 image from 2018-09-26 02:36, 24 h before the start of the mooring deployment. Red line is the track of Healy during the 24-h period after the image acquisition, as the mooring deployment site was adjusted from the planned (solid red square) to actual (open red square) location. In general, gray areas represent open water (left of image), white areas are sea ice (right of image), and the dark areas are newly forming sea ice.
Case Study 3: Context for Upper Ocean Sampling
Toward the end of the 2018 Healy expedition, there was an opportunity to enhance our knowledge of the impact of sea ice formation on upper-ocean physics. Access to high-quality and recent remote sensing images (Figure 8) allowed the ship to take advantage of limited time available to locate the ice edge and optimize the route to sample from open waters to inside a field of newly formed sea ice crystals (frazil ice) which were slowly aggregating into pancake ice (the next stage of the ice formation cycle) under calm wind conditions. Using these images, a ‘mowing the lawn’ cruise track was identified which took the ship from open water though to regions of new ice formation and back out to open water a number of times (red line in Figure 8). The survey was also augmented with sampling from a Surface Wave Instrument Float with Tracking (SWIFT), a free drifting system to measure waves, winds, turbulence, and ambient noise at the ocean surface (Thomson, 2012). In addition to facilitating the decisions in the field, the situational awareness system, making all the positions of instruments and remote sensing images available in a centralized location and under a uniform format, allows scientists to contextualize the observations and identify the most promising analysis ideas.
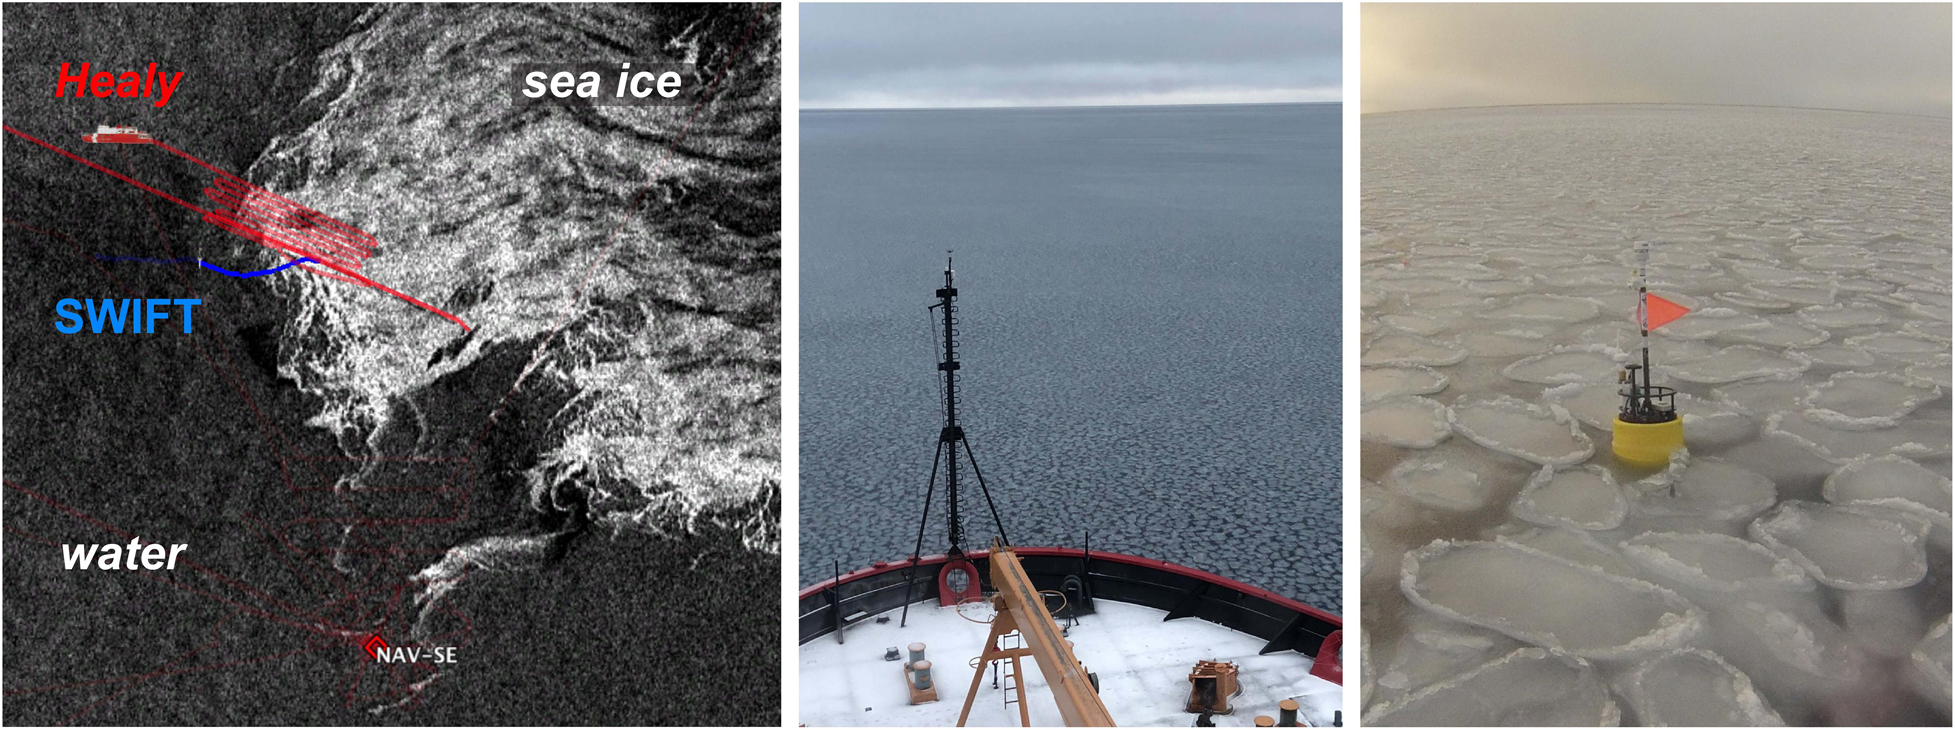
Figure 8. (Left) 100 km square RS2 image (201810120308_RS2_SCWA) with 100 m resolution centered in a new ice formation region on 12 October. Location of the ship (red) and SWIFT buoy (blue) at the time of the image are indicated by their respective icons, with a 24 h track. (Center) Photograph of the pancake ice near the time of the image. After 12 h (Right), pancakes were about 1 m in their longest dimension and 6 cm thick. The SWIFT buoy is pictured on the right.
Case Study 4: Floe Selection for Ice-Based Instruments
It is clear that the Arctic is undergoing strong environmental changes, and to better understand these changes it is important to have the capability for year-round monitoring of key environmental parameters. Robust technology that is suited to this harsh environment, such as on-ice assets that monitor atmospheric, oceanic and sea ice properties, provide this opportunity. Their long-term survival is very much enhanced if they are deployed on thicker ice that is away from the ice edge, rather than regions of thin ice or open water. However, this is not always possible for logistical, scientific or environmental reasons.
The SODA science objectives demanded that the on-ice assets should be deployed in the vicinity of 75–82°N, 130–160°W. As there was no aerial reconnaissance available to the cruise, we relied entirely on remote sensing imagery to determine suitable floes for each cluster’s deployment. Prior to the cruise we worked with USNIC to identify, through remotely sensed products, regions of multiyear ice that were located within the box: In the absence of liquid water on the floe surface, these show a distinct brightness contrast to younger ice in SAR images. This partnership continued during the cruise, and daily SAR images (obtained through the situational awareness system) were used to identify a series of large multi-year ice floe targets that have potential as deployment sites. These target floes were ranked and their locations, including drift calculated from received model data, were presented to the Healy Captain and science stakeholders. If the relevant weather charts showed good conditions, the ship sailed to the vicinity of the highest ranked floe, whereby a combination of its latest known position, ship’s radar and personnel with binoculars (lookouts) were posted to find the floe. Since the target floe is rarely the only MY ice in a given region, any suitable floe with similar properties might be selected during the transit to the appointed spot.
While remote sensing offers a versatile mechanism to evaluate candidate ice floes, there is no substitute for in situ observation. Once a target floe was identified, the Healy Conning Officer would slowly guide the ship into the floe – this maneuvering was typically done from the ‘aloft conn’ station, which offered throttle and rudder control from a higher vantage point on the ship (a higher height of eye and consequently greater field of view). As the vessel slowly broke through the ice, embarked researchers would view the ice thickness. This is easily gauged as the ice blocks immediately beside the hull often turn on their side, allowing the ice thickness to be directly compared to a calibrated measuring pole which hangs over the ship’s rail above the ice. These observations might take place from the bridge, aloft conn, or other convenient station. Even on-site, the remote sensing effort continued to be useful for deployment site selection within the target floe, as it could delineate the expected size of the floe and the degree of ridging, which is not always evident in restricted visibility or flat lighting conditions.
If the ice appeared to be of suitable thickness for the instrumentation – a criterion of 70 cm or more was generally desired – the ship was slowly brought ‘hove-to’ with the floe. Once Healy was determined to be dynamically stable with the floe, an ice team was dispatched to confirm that the floe was suitable, drilling with ice augers to determine a representative thickness value and checking whether any frozen melt ponds might present risks to personnel. This method was favored over more complex alternatives (such as electromagnetic induction techniques) because of the immediate and unequivocal result and the simple, lightweight equipment required (augers were attached to a powerful electric hand-drill). Importantly, drilling provides a direct measurement of ice thickness without the need for collaboration. If safe, the assets were deployed, which might be a prolonged operation over several hours or continuing the next day, following a break overnight. If the situation was unstable, we resumed the search, transiting to neighboring floes of similar thickness if available or, failing that, the next highest-ranked floe on the list. It should be noted that in one event, as the team proceeded to offload equipment, a crack developed and propagated along the floe between the team and ship. Given the possible risk of the team being separated from the ship, the equipment and the team were immediately evacuated from the floe. Thus, highlighting the need to always be aware of the local environment, and to act appropriately when it changes. Afterward, the ship proceeded onto a new candidate floe nearby and little time was lost.
An example of the floe choice for the deployment of WIMBO 1 can be seen in Figure 9. It clearly demonstrates the value of having good situational awareness as the selected multi-year ice floe was particularly robust. Though only 93 cm ice thickness at the buoy site, it was the thickest encountered in these southerly regions of the ice cover, and hence was one of the last to completely melt in the warm-water adjacent to the coast (green box in Figure 9 shows location of WIMBO 1 on the floe). Our process thus demonstrably selected a good platform for the deployed asset.
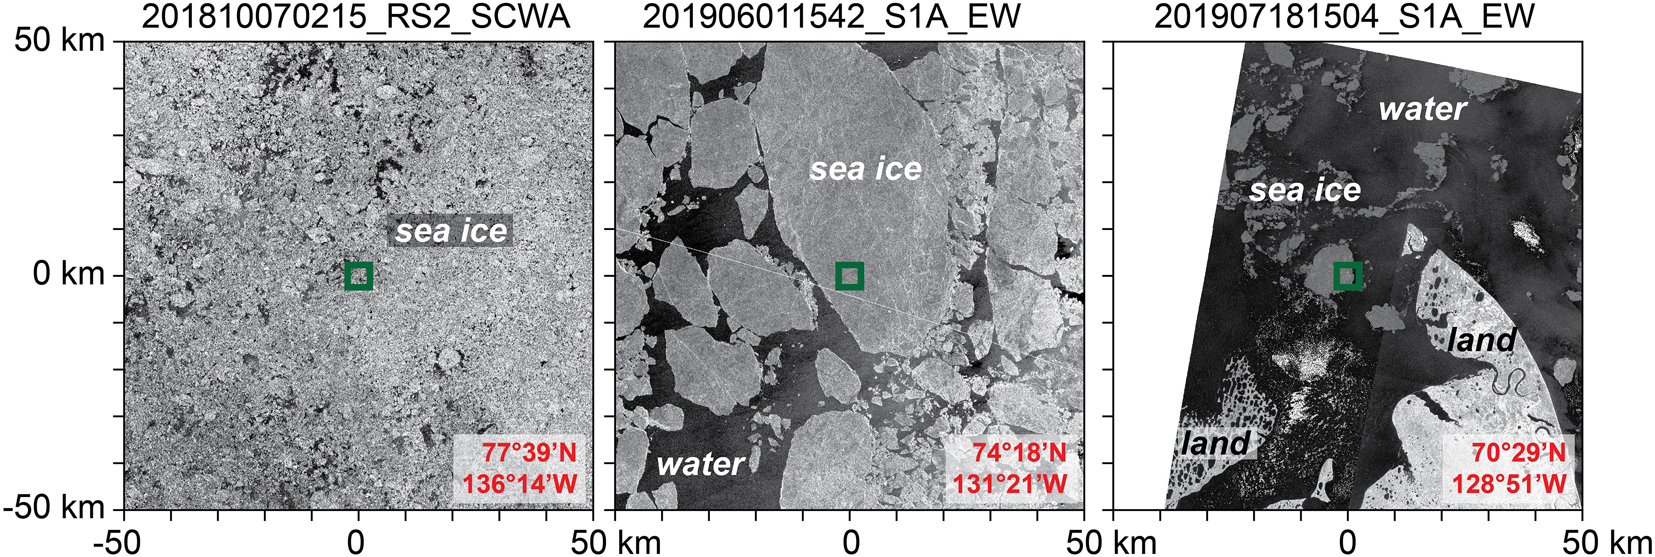
Figure 9. Ice conditions shortly after deployment of WIMBO1 (20181007) and in the following spring (20190601) and summer (20190718) as it drifted 100 s of kilometers south. The floe chosen for WIMBO1 deployment was one of the last floes to melt near the Canadian coast. Bottom row shows 100-m resolution SAR images in a 100-km box centered on WIMBO1 (green box) from October 07, 2018, June 01, 2019, and July 18, 2019. Cape Bathurst is apparent in the last SAR image.
Summary and Challenges
Over the past few decades the ice, ocean and atmospheric conditions within the Arctic Ocean have changed significantly, which has led to more challenging marine-based operations. The combination of a changing environment with a predicted increase in marine traffic within the Arctic waters suggests accurate situational awareness is essential.
During this period, weather predictions have become more reliable, the availability and selection of satellite-based products has increased dramatically, computer model output is more accurate and satellite communications in the polar regions have improved (albeit slowly). By making the best use of these technological advances, partnering with expert organizations, and having clear goals and lines of communication we can improve the situational awareness through enhancing access to these data streams in a timely fashion, even in remote regions of the Arctic Ocean. This naturally leads to better decision-making across a broad range of operational and scientific scenarios. Successes, challenges, and closing thoughts from each of the different users of the SODA situational awareness system are offered below as a summary.
Coast Guard
Safe operation of an icebreaker in high latitudes requires both good knowledge of environmental conditions and clear communications of the various requirements and desires of the users. The USCG benefits greatly from the relationship with USNIC and its ice analysts. While the ship’s navigation and operational systems are separated from the science-centered situational awareness system described here, the availability and sharing of information across the science, ship-board technical groups, and Healy Command, makes planning and executing the science mission of Healy easier.
The SAR Order Desk Lead at the USNIC sent the Radarsat2 order swaths via kml to the analyst and shipboard technical group on board Healy. This ensured that the crew knew when we would have imagery on the bridge and saved bandwidth when only a corner of the image was necessary to download for proper situational awareness. Similar products showing future Sentinel-1 images are also available from Polarview. Knowledge of future acquisitions is very useful for all decisions in the field.
On a more local scale, Healy utilized a Rutter Sigma S6 Ice NAV Radar to support navigation through ice, particularly in poor weather conditions and low visibility (a common phenomenon in the Arctic). This Rutter ice navigation radar system processes the signal from the ship’s radar system and enhances the definition along ice edges; this can indicate the presence of thick ice floes with weathered edges and identify ice leads. This improved fuel efficiency, reduced wear and tear on the vessel from the battering of breaking ice, and ultimately provided more time to fulfill mission requirements.
Although this paper focuses on the 2018 campaign, it is worth noting the additional challenge faced in recovering the SODA moorings in the 2019 Healy mission. Even minor latency in receipt of ice imagery quickly erodes its tactical value. Mooring recoveries require a precise understanding of the net ice drift and presence of polynyas and leads. A high-fidelity image will inform the party on required time on-scene and provide indicators as to the efficacy of the objective (i.e., moving onto the next target and returning to the original objective at a later time.
United States National Ice Center
USNIC benefits from communication and feedback from the customer on support and ice conditions. Constant communication of sea ice observations from the embarked analyst to the USNIC was used to validate and improve the location of the ice edge, multiyear ice, and knowledge of hard to detect new ice formation. Then, forecasters at the USNIC adjusted their analysis of the ice locations to align with the most recent imagery.
High resolution GOFS model ice drift data and model winds were used to make a best guess on how the ice was moving to make the imagery useful 6–12 h after they were acquired. The limitation on ships to the usefulness of old imagery is on obtaining the ice drift forecast and being able to mentally shift the ice in the correct direction. Having a USNIC analyst on board with this data readily available and knowledge on forecasting helped to alleviate these limitations for Healy and SODA science team.
Shipboard Technical Group (STG)
The STG is the provider of expertise, personnel, and instrumentation to scientists that use Healy, the shipboard technical group is an important component of the ship’s situational awareness system. When incorporating ice imagery into navigation systems, often there was a challenge in converting between different projections (Polar Stereographic and Mercator) – this would often result in image distortion when overlaid onto charts, particularly at the extremes of the image. The STG was able to resolve the issue through collaboration with USNIC and MDA. Furthermore, parties using ice imagery should be cautious to the potential for offset from image center when overlaid onto a chart. In some cases, the image appeared several miles offset from what was observed in situ (well beyond the effect of ice drift for the given time period between image capture and receipt).
Science
Arctic marine field programs can pose complex challenges, with multiple research teams aiming to conduct coordinated observations above, on and below the sea ice, all within a finite time-window. The Arctic Ocean is an operational environment where the sea ice and weather conditions determine everything from vessel transit times through to scientific instrument deployment opportunities.
Mission success depends on good team skills, adaptive decision-making abilities, and the timely access to accurate information that improves our situational awareness, including up-to-date information on the sea ice and oceanic conditions, instrument positions, and weather forecasts. However, the seagoing experience of a scientific team varies significantly, as does their ability to gather, transmit, and interpret situational awareness products. Especially the ability to process, plot and interpret heterogeneous data streams, curated data products, such as charts and plots (e.g., sea ice with ship and asset tracks) and data sets delivered in formats that enable integration, analysis, and display both at sea and onshore, offer the most value.
The provision of such products requires advance planning and cooperation by the science team, the logistics provider and other related agencies, as well as ongoing shoreside effort throughout the cruise to ensure timely data delivery to the ship. The rewards are well worth the effort, as we have clearly highlighted by the four very different case studies (navigation, mooring deployment, upper-ocean sampling, and floe selection). Each of these studies utilized products in slightly different ways, but all provided an improved situational awareness. By having this advanced knowledge better evidence-based decisions were made which led to successful scientific and operational outcomes.
Good communication is key to good decisions. During active science deployments, nightly science meetings allowed all science stakeholders to be presented with and discuss the latest information regarding situational awareness received that day. This provided a two-way dialogue whereby all science personnel could then add value to the analysts’ interpretation and help guide upcoming site selection and other decisions.
It is important to realize that many situational awareness products have a value beyond the life of a field program. They are invaluable for providing context to field observations at specific time and place. This is particularly true for the Arctic where conditions can change rapidly, and therefore Earth Observation data provides a broader spatial context to point measurements, such as those made from buoys or ship operations. As a result, investment in targeting, acquisition, distribution, and archiving of satellite remote sensing products are critical for efficient use of ship, instrument, and personnel resources, and also to ensure that the data can be analyzed to its full potential. Keeping in mind that the data will be used to make discoveries that, by nature, can’t be anticipated, providing information about what is available should be prioritized.
Data acquired during the operational portion of the program continue to be available and discoverable. Full resolution images or additional instruments can be identified and downloaded for specific analyses, for example estimates of sea-ice concentration over various spatial scales around a mooring. The utility of a good situational awareness system extends past the intense operational period.
A challenge particular to the sea ice-based assets, and one that is getting more difficult due to changing ice and atmospheric conditions, is our ability to predict where a given ice-mounted instrument will be to be able to order high-resolution remote sensing products. Such predictions require accurate atmospheric and ice drifts predictions several days ahead. Improving our ability to do this routinely would mean streamlining information exchange between in situ instrumentation, real-time assimilation models, satellite data providers, and scientists.
Closing Words
Improving access to a variety of data streams enhances situational awareness and understanding how to interpret these data is a critical component for all Arctic marine operations. The successful use of a situational awareness system, such as the one described here for Arctic operations is the result of good planning and cooperation between, scientists, logistic providers, and operators. It should be recognized from the beginning that any situational awareness system will not meet every need of every user. It should, however, provide a centralized visualization about what information is available both in real-time and for future analyses. In that context, it should be flexible and as simple as possible, while meeting most operational needs.
The technical and human resources required to put in place and maintain a 24/7 situational awareness system are not negligible. However, this investment should be a priority for every large scientific or logistical marine program. Particularly in the harsh Arctic marine environment, these systems greatly improve safety for operations, ensure knowledge-based decisions are made that benefit both for the scientists and the operators of the vessels, and provide invaluable context for future uses of the data collected. We hope that this manuscript shows how to overcome many of the challenges associated with obtaining timely situational awareness information in remote regions.
Data Availability Statement
The datasets generated for this study can be found in online repositories. The names of the repository/repositories and accession number(s) can be found below: UW Digital Library, http://hdl.handle.net/1773/45592.
Author Contributions
LR and JeW: conceptualization and writing – original draft. MEJD: conceptualization and project administration. SH: conceptualization, resources, and project administration. JD and GS: methodology, software, and data curation. MJD: writing – review and Editing. AF: writing – review and editing, software, and data curation. DF: methodology. HG, BM, and JoW: methodology and resources. JTH: writing – review and editing, and data curation. JH and NH: writing – review and editing, and software. BH: conceptualization. MJ and HS: conceptualization and writing – review and editing. CL: writing – review and editing, and supervision. DM, SM, and JT: writing – review and editing, and resources. AS: conceptualization, software, and visualization. All authors contributed to the article and approved the submitted version.
Funding
The work presented here was supported by multiple ONR grants, with important additional contributions from the United States Coast Guard, National Oceanic and Atmospheric Administration (NOAA), European Space Agency, as well as multiple other international agencies. In additional, JeW and NH acknowledge the contribution of the EU funded KEPLER programme (Grant Agreement No. 821984).
Conflict of Interest
MJD is employed by Polar Scientific Inc.
The remaining authors declare that the research was conducted in the absence of any commercial or financial relationships that could be construed as a potential conflict of interest.
The reviewer BR declared a past co-authorship with one of the authors, CL, to the handling editor.
Acknowledgments
We would like to acknowledge contributions from all members of the SODA team. We appreciate the expert help from the captains and the crews of USCGC Healy and R/V Sikuliaq. RADARSAT-2 Data and Products are under a copyright of MDA Geospatial Services Inc. 2018 – All Rights Reserved, obtained via the United States National Ice Center. RADARSAT is an official mark of the Canadian Space Agency. Sentinel-1 data was obtained from the Copernicus Data Hub, supported by the European Space Agency.
Footnotes
- ^ https://www.whoi.edu/itp
- ^ https://www.mrvsys.com
- ^ https://www.polarview.aq
- ^ https://sidfex.polarprediction.net
- ^ https://scihub.copernicus.eu/
- ^ https://satellittdata.no/
- ^ https://portal.polartep.io/
- ^ http://doi.org/10.5281/zenodo.159450
- ^ https://step.esa.int/main/toolboxes/snap/
- ^ https://syncthing.net/
- ^ http://hdl.handle.net/1773/45592
References
Bliss, A. C., Steele, M., Peng, G., Meyer, W. N., and Dickinson, S. (2019). Regional variability of Arctic sea ice seasonal change climate indicators from a passive microwave climate data record. Environ. Res. Lett. 14:045003. doi: 10.1088/1748-9326/aafb84
Comiso, J. C. (2012). Large decadal decline of the Arctic multiyear ice cover. J. Clim. 25, 1176-1193. doi: 10.1175/JCLI-D-11-00113.1
Doble, M. J., Wilkinson, J. P., Valcic, L., Robst, J., Tait, A., and Preston, M. (2017). Robust wavebuoys for the marginal ice zone: experiences from a large array in the Beaufort Sea. Elem. Sci. Anth. 5:47. doi: 10.1525/elementa.233
Gorelick, N., Hancher, M., Dixon, M., Lyushchenko, S., Thau, D., and Moore, R. (2017). Google Earth Engine: planetary-scale geospatial analysis for everyone. Remote Sens. Environ. 202, 18–27. doi: 10.1016/j.rse.2017.06.031
Hwang, B., Aksenov, Y., Blockley, E., Tsamados, M., Brown, T., Landy, J., et al. (2020). Impacts of climate change on Arctic sea ice. MCCIP Sci. Rev. 20, 208-217.
Jones, K. L., Martin, R., and Patel, S. (2019). Closing the Arctic Infrastructure Gap: Existing and Emerging Space-based Solutions. Technical Report, The Aerospace Corporation, 46. Available online at: https://aerospace.org/sites/default/files/2019-10/Jones_ClosingArcticGap_10172019.pdf.
Kwok, R., Cunningham, G. F., LaBelle-Hamer, N. M., Holt, B., and Rothrock, D. (1999). Ice thickness derived from high-resolution radar imagery EOS. Trans. Am. Geophys. Union 80, 495–497. doi: 10.1029/EO080i042p00495-01
Lee, C. M., Starkweather, S., Eicken, H., Timmermans, M. L., Wilkinson, J., and Sandven, S. (2019). A framework for the development, design and implementation of a sustained arctic ocean observing system. Front. Mar. Sci. 6:451. doi: 10.3389/fmars.2019.00451
Lee, C. M., Sylvia, C., Martin, D., James, M., Ruth, M., and Tom, P. (2016). Stratified Ocean Dynamics in the Arctic: Science and Experiment Plan. Technical Report APL-UW TR 1601. Seattle, WC: Applied Physical Laboratory, University of Washington, 46.
Lee, C. M., Thomson, J., the Marginal Ice Zone, and Arctic Sea State Teams. (2017). An autonomous approach to observing the seasonal ice zone in the western Arctic. Oceanography 30, 56–68. doi: 10.5670/oceanog.2017.222
Meier, W. N., Mats, A. G., Sebastian, G., Donald, K. P., Jeffrey, R. K., and Kit, M. K. (2014). Arctic sea ice in transformation: A review of recent observed changes and impacts on biology and human activity. Rev. Geophys. 52, 185-217. doi: 10.1002/2013RG000431
Shaw, W. J., Stanton, T. P., McPhee, M. G., and Kikuchi, T. (2008). Estimates of surface roughness length in heterogeneous under-ice boundary layers. J. Geophys. Res. 113:C08030. doi: 10.1029/2007JC004550
Smith, G. C., Allard, R., Babin, M., Bertino, L., Chevallier, M., Corlett, G., et al. (2019). Polar ocean observations: a critical gap in the observing system and its effect on environmental predictions from hours to a season. Front. Mar. Sci. 6:429. doi: 10.3389/fmars.2019.00429
Spreen, G., Kaleschke, L., and Heygster, G. (2008). Sea ice remote sensing using AMSR-E 89 GHz channels. J. Geophys. Res. 113:C02S03. doi: 10.1029/2005JC003384
Spreen, G., Kwok, R., and Menemenlis, D. (2011). Trends in Arctic sea ice drift and role of wind forcing: 1992–2009. Geophys. Res. Lett. 38:L19501. doi: 10.1029/2011GL048970
Stroeve, J. C., Kattsov, V., Barrett, A., Serreze, M., Pavlova, T., Holland, M., et al. (2012). Trends in Arctic sea ice extent from CMIP5, CMIP3 and observations. Geophys. Res. Lett. 39:L16502. doi: 10.1029/2012GL052676
Strong, C., and Rigo, I. G. (2013). Arctic marginal ice zone trending wider in summer and narrower in winter. Geophys. Res. Lett. 40, 4864–4868. doi: 10.1002/grl.50928
Thomson, J. (2012). Wave Breaking Dissipation Observed with “SWIFT” Drifters. J. Atmos. Ocean. Technol. 29, 1866–1882. doi: 10.1175/JTECH-D-12-00018.1
Keywords: situational awareness, Arctic, SAR, navigation, communication, visualization
Citation: Rainville L, Wilkinson J, Durley MEJ, Harper S, DiLeo J, Doble MJ, Fleming A, Forcucci D, Graber H, Hargrove JT, Haverlack J, Hughes N, Hembrough B, Jeffries MO, Lee CM, Mendenhall B, McCormmick D, Montalvo S, Stenseth A, Shilling GB, Simmons HL, Toomey JE IV and Woods J (2020) Improving Situational Awareness in the Arctic Ocean. Front. Mar. Sci. 7:581139. doi: 10.3389/fmars.2020.581139
Received: 07 July 2020; Accepted: 04 November 2020;
Published: 25 November 2020.
Edited by:
Gilles Reverdin, Centre National de la Recherche Scientifique (CNRS), FranceReviewed by:
Benjamin Rabe, Alfred Wegener Institute, Helmholtz Centre for Polar and Marine Research (AWI), GermanyBrian Ward, National University of Ireland Galway, Ireland
Sabrina Speich, École Normale Supérieure, France
Copyright © 2020 Rainville, Wilkinson, Durley, Harper, DiLeo, Doble, Fleming, Forcucci, Graber, Hargrove, Haverlack, Hughes, Hembrough, Jeffries, Lee, Mendenhall, McCormmick, Montalvo, Stenseth, Shilling, Simmons, Toomey and Woods. This is an open-access article distributed under the terms of the Creative Commons Attribution License (CC BY). The use, distribution or reproduction in other forums is permitted, provided the original author(s) and the copyright owner(s) are credited and that the original publication in this journal is cited, in accordance with accepted academic practice. No use, distribution or reproduction is permitted which does not comply with these terms.
*Correspondence: Luc Rainville, lucrain@uw.edu