Integrated Geophysical Analyses of Shallow-Water Seismic Imaging With Scholte Wave Inversion: The Northern Adriatic Sea Case Study
 M. Giustiniani
 U. Tinivella
 S. Parolai
 F. Donda
 - Istituto Nazionale di Oceanografia e di Geofisica Sperimentale—OGS, Trieste, Italy
The integrated analysis using different seismic wave types in a record is a very efficient approach for a comprehensive characterization of marine sediments, especially in shallow water conditions. The proposed integrated method to analyze seismic data in post-critical conditions consists of: 1) the inversion of Scholte waves to obtain a reliable Vs distribution of the near seafloor; 2) pre-processing of seismic data; 3) construction of the P-wave velocity field by using all available information, including available well data; and 4) the application of the wave equation datuming and post-processing, such as pre-stack time migration. We demonstrate how this approach could be successfully applied on seismic datasets characterized by post-critical conditions and the occurrence of the Scholte waves, which may be exploited to provide fundamental information instead of being only an unwanted effect. The integrated analysis of seismic events can thus help, together with data processing, by providing better seismic imaging, which is a priority for a reliable seismostratigraphic interpretation.
Introduction
Over past several decades, seismic methods have been widely adopted for the characterization of the shallow marine environment for different purposes, e.g., geological and geohazard assessments, infrastructures site characterization, monitoring of gas storage sites, and archeology. In shallow water depths, one of the main challenging issues is the attenuation of the seabed multiples, guided waves, peg-legs and/or out-of-plane events (Yilmaz, 2001). Many authors have proposed different methods to attenuate these undesired signals based on CMP-stack, separating different moveout, and predictability, or, on separating primaries and multiples applied in x-t and tau-p domains (i.e., Verschuur et al., 1992; Alái et al., 2002; Hung et al., 2010). Alternatively, in the case of complex geology, another valid method is the application of seismic migration algorithms, which consider a velocity model and the angle of incidence at the reflectors (i.e., Yilmaz, 2001).
Sometimes, the attenuation of these events is more complicated because primary water-bottom reflection at the near offset is not recorded and the reflections at the seafloor occurs at post-critical angles (i.e., Verschuur, 2006; Tinivella et al., 2017), a condition not included in many of the above-mentioned methods. In this case, the wave equation datuming (WED) could be a valid means of attenuating these undesired signals (Tinivella et al., 2017). In fact, these events, not verifying the wave equation, are considered as coherent noises during the WED application, so they will be attenuated. This method, which has been applied in different geological settings (i.e., Barison et al., 2011; Giustiniani et al., 2015; Tinivella et al., 2017; Giustiniani et al., 2018; Tinivella et al., 2018), requires a very reliable definition of the velocity distribution because it is very sensitive to near-surface velocity.
In very shallow waters (less than 20 m), it is difficult to obtain a reliable near-surface velocity distribution from P-waves because they interfere with other events, such as multiples. The analysis of interface waves, if recorded, can provide a reliable near-surface velocity distribution. These interface waves, propagating along the seafloor, are called Scholte waves and have peculiar characteristics in respect with the body waves, since they have low velocities, low frequencies, and a high degree of polarization (i.e., Rauch, 1986; Zhang et al., 2013). The energy of this type of waves is concentrated at the water-sediments interface and becomes dispersive with depth due to the occurrence of several wave modes because of changes in the sediment properties (i.e., Flores-Mendez et al., 2012; Johansen and Ruud, 2020). Clearly, the occurrence of Scholte waves could represent a real problem in seismic data processing and interpretation because they can completely mask deeper reflections (Zheng et al., 2012). On the other hand, these waves could be very useful for extracting the near-surface velocity and deriving the elastic properties of shallow marine sediments, especially for geotechnical-engineering applications (i.e., van Vossen et al., 2002; Bohlen et al., 2004; Kugler et al., 2005; Kugler et al., 2007; Muyzert, 2007a; Muyzert, 2007b; Carbajal-Romero et al., 2013; Johansen and Ruud, 2020). For example, Nolet and Dorman (1996) proposed to apply the nonlinear waveform fitting to match Scholte waves. They can be processed by using the same techniques developed for Rayleigh waves. In fact, the maximum deviation of the Scholte velocity with respect to Rayleigh waves velocity is usually less than 5%, falling below the uncertainty level of the measurements (Park et al., 2005).
The integration of different seismic wave types recorded on a shot gather is thus a very useful approach for a comprehensive study of the characteristics of marine sediments at different depths, especially in shallow water environments. These interface waves can therefore help to extract information about the near-surface layers (approximately the first 150 m), while P-waves are indispensable for resolving deeper structures.
In this study, we show how the application of WED on seismic data collected in a very shallow marine basin, i.e., the Northern Adriatic Sea offshore of Venice, helps to better image the shallow portions of the stratigraphic succession. To obtain a reliable near-surface velocity model, we analyzed the Scholte waves and then choose an empirical relation to get the P-wave (Vp) velocities obtained from the S-wave (Vs) velocities, estimated from Scholte waves inversion, and those obtained from the well logs in the study area. This integrated use of Scholte waves, P-waves and available well data has allowed us to improve the resulting resolution and to better image the shallower parts (about 1.5 s) of a selected seismic line acquired in ca. 20 m of water depth. In our real data example, the Scholte wave inversion represents the only possible solution for the characterization of the shallower sediment layers.
Geophysical Data
We analyzed a seismic line acquired in 2009 by the Istituto Nazionale di Oceanografia e di Geofisica Sperimentale offshore of Venice. This seismic profile is part of a large seismic dataset consisting of ca. 1,300 km of multichannel seismic lines, Compressed High Intensity Radar Pulse (CHIRP) sub-bottom profiles and swath morpho-bathymetry data collected in the Northern Adriatic Sea with the double aims of: a) reconstructing the geological and stratigraphic setting of the study area (i.e., Donda et al., 2013) and b) to characterize the widespread occurrence of fluid flow features in the subsurface (i.e., Donda et al., 2015; Donda et al., 2019). In fact, the occurrence of both deep and shallow gas is well known in the study area, and is testified by the occurrence of acoustically anomalous zones, i.e., wipe-out zones, represented by acoustically opaque facies where reflectors are strongly dimmed and high frequencies area lost. Gas chimneys and diffuse acoustic blanking are widespread, and they almost completely mask the underlying reflections in the stratigraphic succession (Donda et al., 2015; Donda et al., 2019).
The selected seismic line was collected in water depth less than 24 m using a sleeve gun as the seismic source located at 5 m below sea level with a total volume of 1,180 cu. in. (Figure 1A). The streamer consisted of 48 hydrophone channels spaced 12.5 m and located at 3 m below sea level. The shot interval was 12.5 m and data were recorded with a sample rate of 1 ms for a total length of 4 s. The selected acquisition parameters (i.e., nearest offset equal to 17 m), set to image deep-targeted geological formations, did not allow for the recording of the water-bottom reflection because it was in a post-critical condition. An example of acquired shots is presented in Figure 2A, showing the Scholte waves presence. These events strongly affect the recorded data and impede the accurate analysis of the stratigraphic succession. Unfortunately, refracted events interfere with the reflections, which could be related to the limited offsets (maximum offset about 600 m) and quite homogenous near-surface sediment characteristics. In fact, the analysis of compressed high intensity radar pulse data acquired in the area allowed calculating reflection coefficients and the P-wave velocity, whose a uniform distribution, suggest a slightly variations in the elastic properties in the near seafloor (Donda et al., 2019). Anomalous values are related to local lithological changes, as supported by the absence of reversal phases along the corresponding seismic lines (Donda et al., 2019). In addition, the morphology of the seafloor does not show significant variations (Figure 1B).
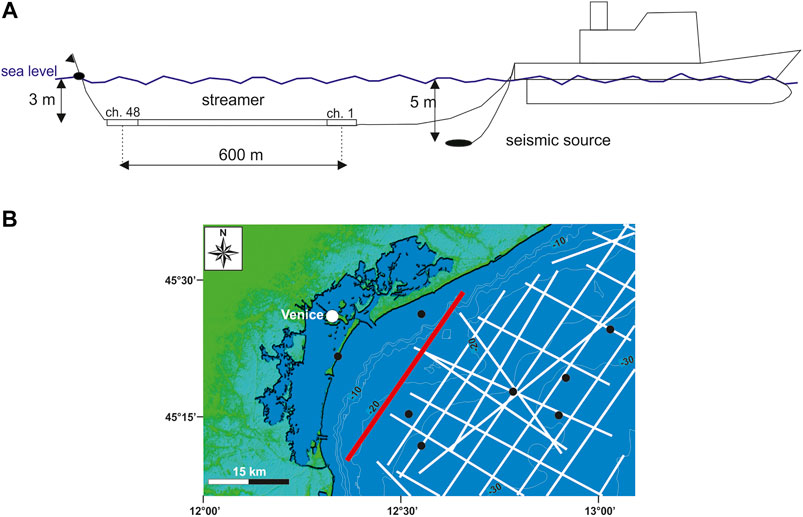
FIGURE 1. (A) Sketch of multichannel survey geometry and (B) Location map of the geophysical data collected by OGS in the study area (white lines). Black dots indicate the position of the hydrocarbon exploration wells (modified from Donda et al., 2019). The red line indicated the seismic line analyzed in the frame of this study (i.e., ST 15).
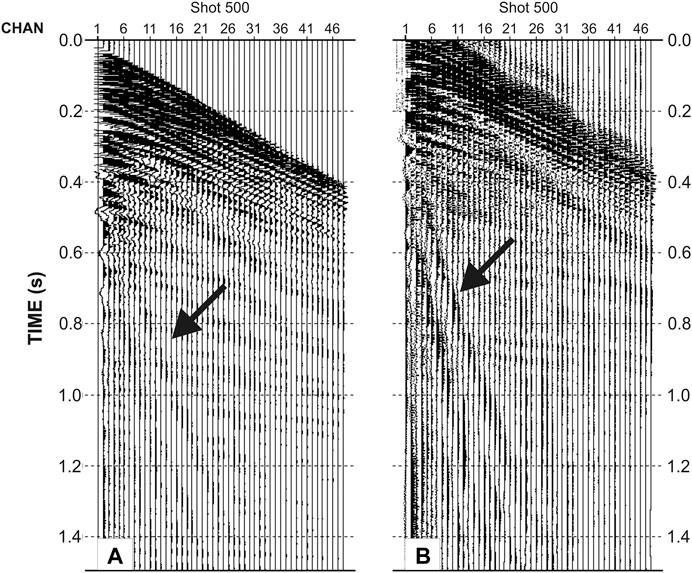
FIGURE 2. (A) An example of a raw shot and (B) a deconvolved shot used for inversion for Scholte waves. Note that in the deconvolved shot, a virtual source is located at the position of the first receiver and the enhanced signal of the Scholte waves.
Our analyses on the seismic data have been integrated with information derived from geophysical logs of hydrocarbon exploration boreholes drilled in the study area over the past decades, when several gas fields were discovered and exploited. Well data are available through the ViDEPI “Visibility of Petroleum Exploration Data in Italy” database (http://www.videpi.com), which is a huge data set comprising well and seismic data, in conjunction with technical reports concerning exploration permits collected by oil companies since the 1950s. In our study, we used information from the Arcobaleno borehole, located about 4,500 m away from the analyzed seismic line.
Seismic Data Analysis
In order to improve the seismic data quality, we have applied the following procedure summarized in Figure 3: 1) inverting the Scholte waves to obtain a reliable Vs distribution of the near-surface (first 100 m); 2) pre-processing of the seismic data for WED application; 3) construction of the P-wave velocity field; and 4) application of WED and post-processing.
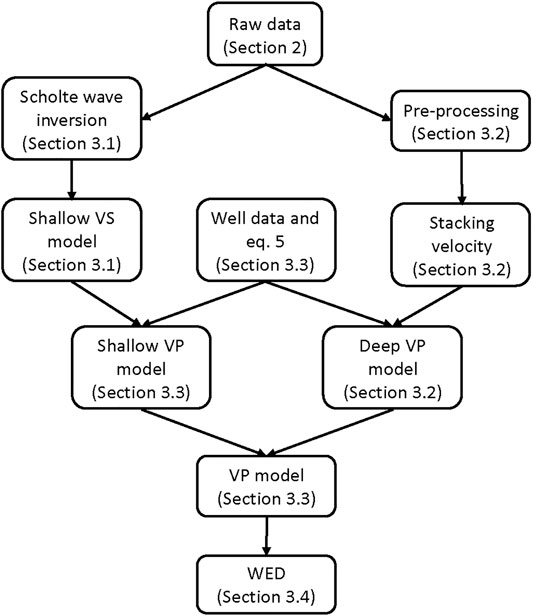
FIGURE 3. Flowchart of the applied procedure.
Scholte Wave Inversion
Scholte waves can be generated by a sleeve gun source in the water column, as also evident in our raw seismic data (Figure 1A). To perform the inversion, we selected a group of five shot records every 500 shots between shot 500 to 3,000. We performed the dispersion analysis and the inversion to infer the Vs by using genetic algorithms (GA). First, the raw seismograms are deconvolved with respect to the one nearest to the source, in order to remove the source signature. The deconvolution of the shot recorded at distance d1 with that at distance d2 (where d = 0 at the source position) can be written in the frequency domain as:
where u (d1,ω) and u (d2,ω) are the Fourier transforms of the motion recorded at distances d1 and d2, respectively. However, the deconvolution is applied to data corrupted by noise and, therefore, since this problem is ill-conditioned, small errors in the data could lead to unacceptable solutions from a physical point of view.
To avoid this instability, a regularized Tikhonov deconvolution was used (Tikhonov and Arsenin, 1977; Bertero and Boccacci, 1998):
where S(ω) denotes the Fourier spectrum of the deconvolved wavefield and
is the filter. ε refers to a constant added to the denominator to prevent the numerical instability of Eq. 1. In order to apply Eq. 3, ε was chosen to be 10% of the average spectral power of u (0,ω). Figure 2 shows an example of a raw shot (panel A) and a deconvolved one (panel B) used in the analysis.
The dispersion curves were calculated by applying the Multi-Channel Analysis of Surface Waves (MASW; Park, et al., 1999) method:
where S (x,ω) is the spectrum of the deconvolved wavefield for each receiver at a distance x from the reference one, k is the wavenumber, ω is the circular frequency and v is the assumed phase velocity.
Figure 4A shows an example of the dispersive curves where the first and higher modes of propagation of the Scholte waves are clearly depicted. Each curve is obtained by stacking the results of three consecutive shots. The estimated phase velocities, obtained by picking the values corresponding to the maxima in Figure 4A (green points) are then inverted by using the scheme proposed by Parolai et al. (2005) extended for allowing the joint inversion of different modes. The inversion is based on the modified GA proposed by Yamanaka and Ishida (1996).
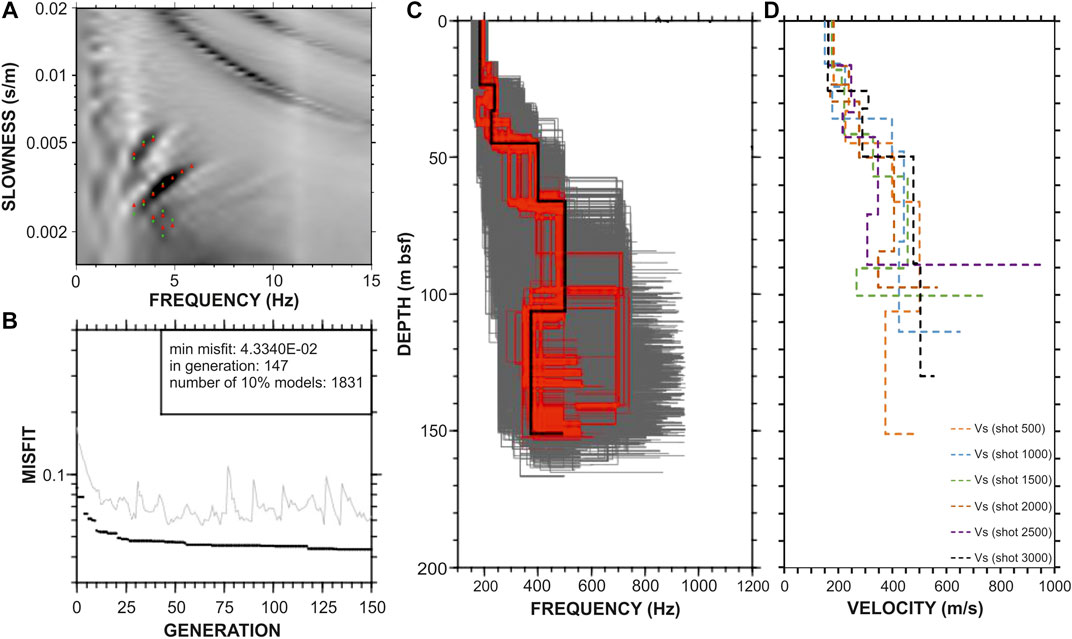
FIGURE 4. (A) Velocity spectrum and dispersion curves. The green points represent the observed phase velocities, while the red triangles represent the calculated ones. (B) Minimum misfit (black dots), and average misfit (gray line) vs. the number of generations for the seed number leading to the best model. (C) Scholte wave dispersion curves inversion for shot 500: all tested models (gray), models lying within 10% of the minimum misfit (red) and the minimum misfit model (black). (D) Vs profiles from selected shots obtained by the Scholte waves inversion.
With this algorithm, a search area is defined for the velocity and thickness of the sub-sea-floor surface layers. After trial and error tests, we defined a model made up of six layers plus a half space for the case at hand. An initial population of 50 members was generated and genetic operations were applied in order to generate a new population with the same size. This population was reproduced based on a cost function for each individual. The iterations were terminated at the 150th generation, because no further significant reduction of the misfit was observed. Since this inversion is a kind of probabilistic approach using random numbers and finds models close to a global optimal solution, it was repeated five times, varying the initial random number. The optimal model was selected considering the minimum of the chosen cost function.
Figure 4B shows an example of the results obtained by the GA inversion. The distribution of the models lying within the 10% of minimum misfit shows that the uppermost 70 m is very well constrained, while the reliability of the obtained models decreases with depth. A very good fit of the input data is obtained for the best model (Figure 4A) after 150 iterations (Figure 4C). Figure 4D shows the obtained Vs profiles for the six groups of the selected shots.
Pre-processing of the Seismic Data for Wave Equation Datuming Application
The first step for the application of the WED consisted of the pre-processing of the seismic data to increase the signal to noise ratio with amplitude recovery and the balancing of the shots and receivers’ responses. After assignment of the shots and receivers coordinates, we removed noisy traces or parts of them. Then, we performed a Q compensation by testing different Q values, because the study area is characterized by the presence of diffused gas that caused frequencies to be lost to attenuation. We considered a linear variation with time of Q value of 20–100 at 1.5 s (Hamilton, 1972). Therefore, Q compensation was necessary to better image the geological structures that suffer from resolution and amplitude degradation. A geometric spreading correction was applied to restore the amplitudes. We applied a band-pass filter to remove low (less than 5 Hz) and high (more than 200 Hz) frequencies that are related to coherent and incoherent noises. After applying a predictive deconvolution, we muted the upper parts of the records. After some preliminary tests, we removed 20 channels because the cable was not inline, introducing some artificial events during the pre-processing steps. An example of some shots before and after the pre-processing is shown in Figures 5A,B, respectively. We then performed the velocity analysis through the semblance analysis (Yilmaz, 2001). Clearly, the velocity analysis accuracy was strongly affected by the limited number of channels.
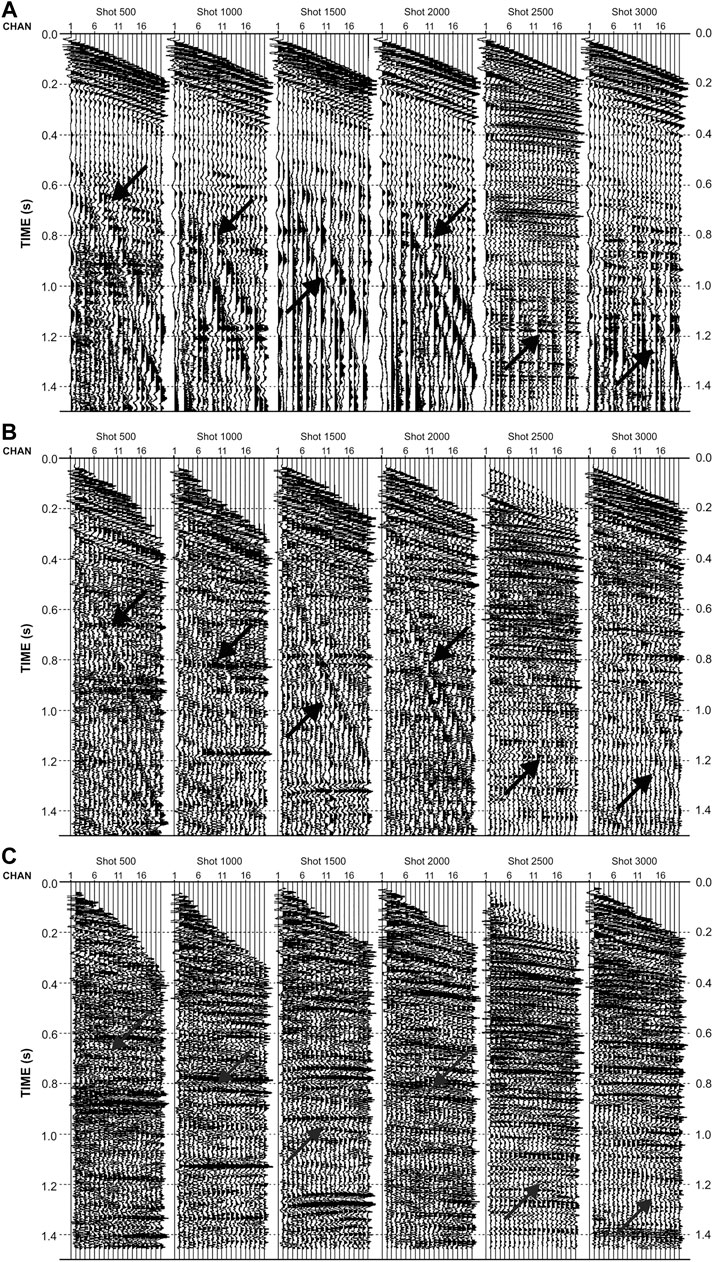
FIGURE 5. An example of the selected shot gathers before (panel A) and after pre-processing (panel B), and after WED application (panel C). In the panels, the black arrows indicate the Scholte waves.
P-Wave Velocity Field
On the basis of the well data, the empirical relationship for water-saturated sandstone proposed by Castagna et al. (1985) was chosen:
where the velocities are expressed in km/s. The Vs obtained by the Scholte wave inversion (see Figure 4D) was translated in term of Vp using Eq. 5, allowing the characterization of the first 100 m below sea-floor. The Vp field of the deeper parts was the combination of that obtained by stacking velocity analysis and well data. In particular, the stacking velocity analysis was useful for building the velocity fields until a depth of about 800 m, while the deeper part was extracted by referring to the well data. The water velocity was constrained based on the available literature (Donda et al., 2019). The obtained Vp field is reported in Figure 6.
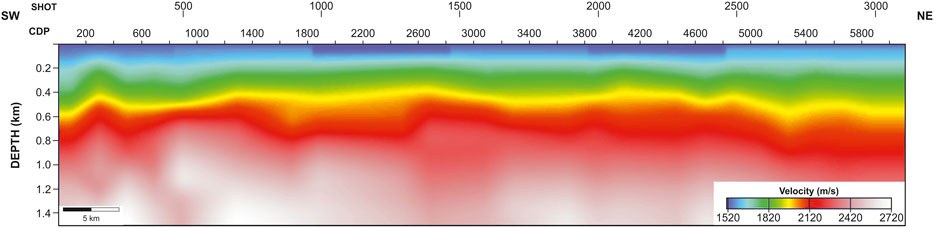
FIGURE 6. P-wave velocity field adopted for the WED application (see details in the text).
Wave-Equation Datuming
To improve the seismic imaging down to the targeted depth, i.e., ca. 1,500 m, we applied the WED first in the common-source domain (moving the receivers to the datum plane: 50 mbsl) and then in the common-receiver domain (moving the shots to the datum plane: 50 mbsl). The first step was to regularize the geometry of the seismic data, i.e., constant distance between receivers in each common shot gather and constant distance between shots in each common receiver gather, as the WED application requires. Moreover, we defined the best aperture to adopt to be equal to 500 m. Figure 5C shows the selected shots after the application of the WED method.
After the application of the WED, we sorted the data in the CDP gathers and performed the velocity analysis again to improve the result, even if only slight changes were applied. In order to improve the imaging, the pre-stack time migration was applied with an angle of 20° and by using the velocity field reduced by 10% (Yilmaz, 2001). Finally, to improve the imaging, a time-varying filter was applied. The obtained seismic section is shown in Figure 7.
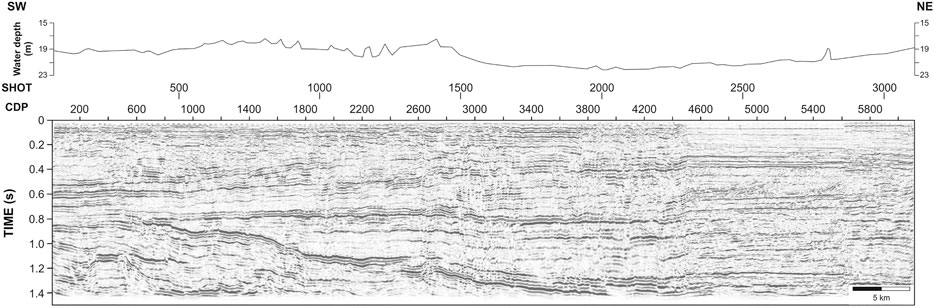
FIGURE 7. Migrated seismic section. The bathymetry along the seismic line is displayed on the top.
Results and Discussion
In shallow marine seismic data, especially in the case of post-critical data, it is very difficult to have information about the shallowest subsurface layers, which influences the image of the deeper parts. The integrated analysis of Scholte waves and P-waves identified on the shot records demonstrated a working method for extracting important information, especially about the shallow subsurface.
The first step consisted of the Scholte waves inversion in order to obtain Vs information. The Vs profile at shot 500 reached a depth of 160 m, while the other Vs profiles investigated showed more limited depths with a minimum depth of about 90 m at the shot 2,500. The Vs is about 200 m/s in the first 20 m and reaches 400 m/s by about 50 m below the seafloor. From shot 2000 to shot 2,500, the Vs shows a decrease vs. depth compared to other profiles (Figure 4). The Vs estimates were then translated to Vp using the relationship for water-saturated sandstone proposed by Castagna et al. (1985; Eq. 5). The obtained Vp profiles at the selected shot positions were linearly interpolated to obtain a Vp distribution along the seismic line. The deeper part of the velocity section was obtained by integrating the stacking velocities and the well data. As already mentioned, the stacking velocities were adopted to constrain the velocity fields until a depth of about 800 m, while the well data led to extend the analysis down to a depth of 1,500 m. The final velocities reveal values raging from ca. 1,550 m/s in the near surface (first 30 m) to about 2,750 m/s at 1,500 m below sea-floor.
The WED application allowed us to strongly attenuate undesired signals, such as the Scholte waves and multiples. In fact, these events do not verify the wave equation, so during the WED application they are considered as coherent noises. The migrated seismic section (Figure 7) better images features that were only partially evident in the previous versions of the seismic line where a standard processing was applied (e.g., Figure 4 of Donda et al., 2013, Figure 6 of Donda et al., 2015, and Figure 5 of Zecchin et al., 2017). One of the most peculiar acoustic features is the portion characterized by high frequencies between CDP 4400 and 5,600, with a lower energy in the uppermost 0.3 s with respect to the surrounding area. This portion of the seismic line is clearly bounded by pull-down reflector configurations, well imaged at CDP 4400. Such reflector configurations possibly reflect the presence of gas, as previously stated (Donda et al., 2013; Donda et al., 2015; Donda et al., 2019). Our advanced processing procedure allows us to clearly image localized gas migration pathways and accumulations (Figure 7), and the stratigraphic setting of the late Quaternary succession, where glacioeustatic changes were predominant (i.e., Zecchin et al., 2017).
Conclusion
The analyzed seismic line was acquired with the main objective of characterizing the whole sedimentary succession, but, due to the shallow water depth and the presence of coherent noise, the upper portion has not been well resolved in the past. In this study, we demonstrated that the integrated use of the different wave types identified on the shot gathers can help to better characterize the subsurface and extract more information. The Scholte wave inversion was indispensable for obtaining information about the near-surface Vs and Vp values, while P-wave waves were fundamental to characterizing the deeper parts, as well as well data. We demonstrated that the unwanted events, such as Scholte waves, that mask the primary signals represent key elements for revealing the characteristics of the upper portion of the sedimentary succession, which would have been otherwise blind.
The application of the proposed methodology allows a great improvement in the characterization of near-surface sediment layers, thus leading to a better definition of the main geological features and of the gas-related structures (i.e., changes in frequency response, gas chimneys or migration pathways, etc.) that need good quality data and a careful analysis to be completely constrained. Moreover, the advanced reprocessing of the whole geophysical dataset collected in the Northern Adriatic Sea could help to improve and better refine the seismostratigraphic interpretation of the area.
We have demonstrated how the approach presented in this study could be successfully applied to seismic datasets characterized by post-critical conditions and the presence of the Scholte waves, taking advantage of their presence, which is normally considered to be unwanted events. The integrated analysis of seismic signals can contribute to the processing and imaging, and, consequently, it greatly helps with the seismostratigraphic interpretation, especially in shallow-water environments. In conclusion, the results clearly show a great improvement in the subsurface image that allows a better seismostratigraphic interpretation not achievable with a standard seismic signal processing.
Data Availability Statement
The datasets analyzed for this study can be found in the repository “Seismic data Network Access Point (SNAP)” (https://snap.ogs.trieste.it/cache/index.jsp).
Author Contributions
MG, UT, and FD developed the idea. MG, UT and SP analyzed the data. All authors contributed to the interpretation of the data. MG, UT, and SP wrote the manuscript. MG prepared the figures. All authors aided in editing.
Conflict of Interest
The authors declare that the research was conducted in the absence of any commercial or financial relationships that could be construed as a potential conflict of interest.
Acknowledgments
We would like to thank Kevin Fleming for the useful suggestions that helped us to improve the paper. The seismic data are avalaible on “Seismic data Network Access Point (SNAP)” (https://snap.ogs.trieste.it). This work is partially supported by the Italian Ministry of Education,Universities and Research (Decreto MIUR No. 631 dd.August 8, 2016) under the extraordinary contribute for the Italian participation to the activities related to the international infrastructure PRACE–The Partnershipfor Advanced Computing in Europe (www.prace-ri.eu). We used Paradigm® Epos® to process the data.
References
Alái, R., Verschuur, D. J., Drummond, J., Morris, S., and Haughey, G. (2002). Shallow water multiple prediction and attenuation, case study on data from the Arabian Gulf. SEG Tech. Progr. Expand. Abstr. 21 (1), 2229–2232. doi:10.1190/1.1817154
Barison, E., Brancatelli, G., Nicolich, R., Accaino, F., Giustiniani, M., and Tinivella, U. (2011). Wave equation datuming to marine OBS data and to land high resolution seismic profiling. J. Appl. Geophys. 73, 267–277. doi:10.1016/j.jappgeo.2011.01.009
Bertero, M., and Boccacci, P. (1998). Introduction to inverse problems in imaging. Bristol, United Kingdom: Institute of Physics Publishing.
Bohlen, T., Kugler, S., Klein, G., and Theilen, F. (2004). 1.5D inversion of lateral variation of Scholte-wave dispersion. Geophysics 69 (2), 330–344. doi:10.1190/1.1707052
Carbajal-Romero, M., Flores-Guzmán, N., Flores-Mendez, E., Núñez-Farfán, J., Olivera-Villaseñor, O., and Sánchez-Sesma, F. J. (2013). Scholte waves on fluid-solid interfaces by means of an integral formulation. Geofisc. Int. 52 (1), 21–30. doi:10.1016/S0016-7169(13)71459-4
Castagna, J. P., Batzle, M. L., and Eastwood, R. L. (1985). Relationships between compressional-wave and shear-wave velocities in clastic silicate rocks. Geophysics 50, 571581. doi:10.1190/1.1441933
Donda, F., Civile, D., Forlin, E., Volpi, V., Zecchin, M., Gordini, E., et al. (2013). The northernmost Adriatic Sea: a potential location for CO2 geological storage? Mar. Geol. 42, 148–159. doi:10.1016/j.marpetgeo.2012.10.006
Donda, F., Forlin, E., Gordini, E., Panieri, G., Buenz, S., Volpi, V., et al. (2015). Deep-sourced gas seepage and methane-derived carbonates in the Northern Adriatic Sea. Basin Res. 27 (4), 531–545. doi:10.1111/bre.12087
Donda, F., Tinivella, U., Gordini, E., Panieri, G., Volpi, V., Civile, D., et al. (2019). The origin of gas seeps in the Northern Adriatic Sea. Ital. J. Geosci. 138 (2). doi:10.3301/IJG.2018.34
Flores-Mendez, E., Carbajal-Romero, M., Flores-Guzman, N., Sanchez-Martinez, R., and Alejandro Rodriguez-Castellanos, A. (2012). Rayleigh’s, Stoneley’s, and Scholte’s interface waves in elastic models using a boundary element method. J. Appl. Math. 2012. doi:10.1155/2012/313207
Giustiniani, M., Tinivella, U., and Nicolich, R. (2018). Crustal structure of central Sicily. Tectonophysics 722, 299–313. doi:10.1016/j.tecto.2017.08.034
Giustiniani, M., Tinivella, U., and Nicolich, R. (2015). Reflection seismic sections across the geothermal province of Tuscany from reprocessing CROP profiles. Geothermics 53, 498–507. doi:10.1016/j.geothermics.2014.09.003
Hamilton, E. L. (1972). Compressional-wave attenuation in marine sediments. Geophysics 37 (4), 573–705. doi:10.1190/1.1440287
Hung, B., Yang, K. L., Zhou, J., Guo, Y. H., and Xia, Q. L. (2010). Surface multiple attenuation in seabeach-shallow water, case study on data from the Bohai Sea technique. SEG Tech. Progr. Expand. Abstr. 80, 3431–3435. doi:10.1190/1.3513561
Johansen, A. T., and Ruud, B. O. (2020). Characterization of seabed properties from Scholte waves acquired on floating ice on shallow water near surface. Geophysics 18, 49–59. doi:10.1002/nsg.12082
Kugler, S., Bohlen, T., Bussat, S., and Klein, G. (2005). Variability of Scholte-wave dispersion in shallow-water marine sediments. J. Environ. Eng. Geophys. 10 (2), 203–218. doi:10.2113/JEEG10.2.203
Kugler, S., Bohlen, T., Forbriger, T., Bussat, S., and Klein, G. (2007). Scholte-wave tomography for shallow-water marine sediments. Geophys. J. Int. 168 (2), 551–570. doi:10.1111/j.1365-246X.2006.03233.x
Muyzert, E. (2007a). Seabed property estimation from ambient-noise recordings: part I—compliance and Scholte wave phase-velocity measurements. Geophysics 72 (2), U21–U26. doi:10.1190/1.2435587
Muyzert, E. (2007b). Seabed property estimation from ambient-noise recordings: Part 2—Scholte-wave spectral-ratio inversion. Geophysics 72 (4), U47–U53. doi:10.1190/1.2719062
Nolet, G., and Dorman, L. M. (1996). Waveform analysis of Scholte modes in ocean sediment layers. Geophys. J. Int. 125, 385–396. doi:10.1111/j.1365-246X.1996.tb00006.x
Park, C. B., Miller, R. D., Xia, J., Ivanov, J., Sonnichsen, G. V., Hunter, J. A., et al. (2005). Underwater MASW to evaluate stiffness of water-bottom sediments. Lead. Edge 24, 724–728. doi:10.1190/1.1993267
Park, C. B., Miller, R. D., and Xia, J. (1999). Multi-channel analysis of surface waves using vibroseis (MASW). Geophysics 64 (3). doi:10.1190/1.1444590
Parolai, S., Picozzi, M., Richwalski, S. M., and Milkereit, C. (2005). Joint inversion of phase velocity dispersion and H/V ratio curves from seismic noise recordings using a genetic algorithm, considering higher modes. Geophys. Res. Lett. 32, L01303. doi:10.1029/2004GL021115
Rauch, D. (1986). “On the role of bottom interface waves in ocean seismoacoustics: a review,” in Ocean seismo-acoustics low frequency underwater acoustics. Editors T. Akal, and J. Berkson, (Boston, MA: Springer), 623–642.
Tikhonov, A. N., and Arsenin, V. Y. (1977). Solution of ill-posed problems. Washington, DC: Whinston and sons.
Tinivella, U., Giustiniani, M., and Nicolich, R. (2018). Wave equation datuming applied to S-wave seismic data. J. Appl. Geophys. 152, 167–172. doi:10.1016/j.jappgeo.2018.03.015
Tinivella, U., Giustiniani, M., and Vargas-Cordero, I. (2017). Wave equation datuming applied to seismic data in shallow water environment and post-critical water bottom reflections. Energies 10, 1414. doi:10.3390/en10091414
van Vossen, R., Robertsson, J. O. A., and Chapman, C. H. (2002). Finite-difference modeling of wave propagation in a fluid-solid configuration. Geophysics 67 (2), 618–624. doi:10.1190/1.1468623
Verschuur, D. J., Berkhout, A. J., and Wapenaar, C. P. A. (1992). Adaptive surface-related multiple elimination. Geophysics 57, 1166–1177. doi:10.1190/1.1443330
Verschuur, D. J. (2006). Seismic multiple removal techniques: past, present and future. Houten, Netherlands: EAGE Publications.
Yamanaka, H., and Ishida, H. (1996). Application of generic algorithms to an inversion of surface-wave dispersion data. Bull. Seismol. Soc. Am. 86, 436–444.
Yilmaz, O. (2001). Seismic data analysis: processing, inversion, and interpretation of seismic data. Tulsa, OK: Society of Exploration Geophysicists.
Zecchin, M., Donda, F., and Forlin, E. (2017). Genesis of the Northern Adriatic Sea (Northern Italy) since early Pliocene. Mar. Pet. Geol. 79, 108–130. doi:10.1016/j.marpetgeo.2016.11.009
Zhang, Z., Yuefeng, S., Berteussen, K., and Ali, M. (2013). Effect of Scholte wave on rotation of multi-component OBC seismic data in shallow water environment of the Arabian Gulf. SEG Tech. Progr. Expand. Abstr. 32, 1689–1693. doi:10.1190/segam2013-1233.1
Keywords: Scholte waves, inversion, multichannel seismic data, wave equation datuming, seismic image
Citation: Giustiniani M, Tinivella U, Parolai S, Donda F, Brancolini G and Volpi V (2020) Integrated Geophysical Analyses of Shallow-Water Seismic Imaging With Scholte Wave Inversion: The Northern Adriatic Sea Case Study. Front. Earth Sci. 8:587898. doi: 10.3389/feart.2020.587898
Received: 27 July 2020; Accepted: 16 October 2020;
Published: 25 November 2020.
Edited by:
Pier Paolo Bruno, University of Naples Federico II, ItalyReviewed by:
David Iacopini, University of Naples Federico II, ItalyYingcai Zheng, University of Houston, United States
Robert I. Odom, University of Washington, United States
Copyright © 2020 Giustiniani, Tinivella, Parolai, Donda, Brancolini and Volpi. This is an open-access article distributed under the terms of the Creative Commons Attribution License (CC BY). The use, distribution or reproduction in other forums is permitted, provided the original author(s) and the copyright owner(s) are credited and that the original publication in this journal is cited, in accordance with accepted academic practice. No use, distribution or reproduction is permitted which does not comply with these terms.
*Correspondence: M. Giustiniani, mgiustiniani@inogs.it