Analysis of Genetic Diversity and Population Structure of Pigeonpea [Cajanus cajan (L.) Millsp] Accessions Using SSR Markers


Abstract
:1. Introduction
2. Materials and Methods
2.1. Plant Material
2.2. DNA Extraction
2.3. Polymerase Chain Reaction (PCR) Amplification
2.4. Data Analysis
3. Results
3.1. Genetic Polymorphism of Simple Sequence Repeat (SSR) Markers
3.2. Genetic Relationship among 48 Pigeonpea Genotypes Based on Source of Collection
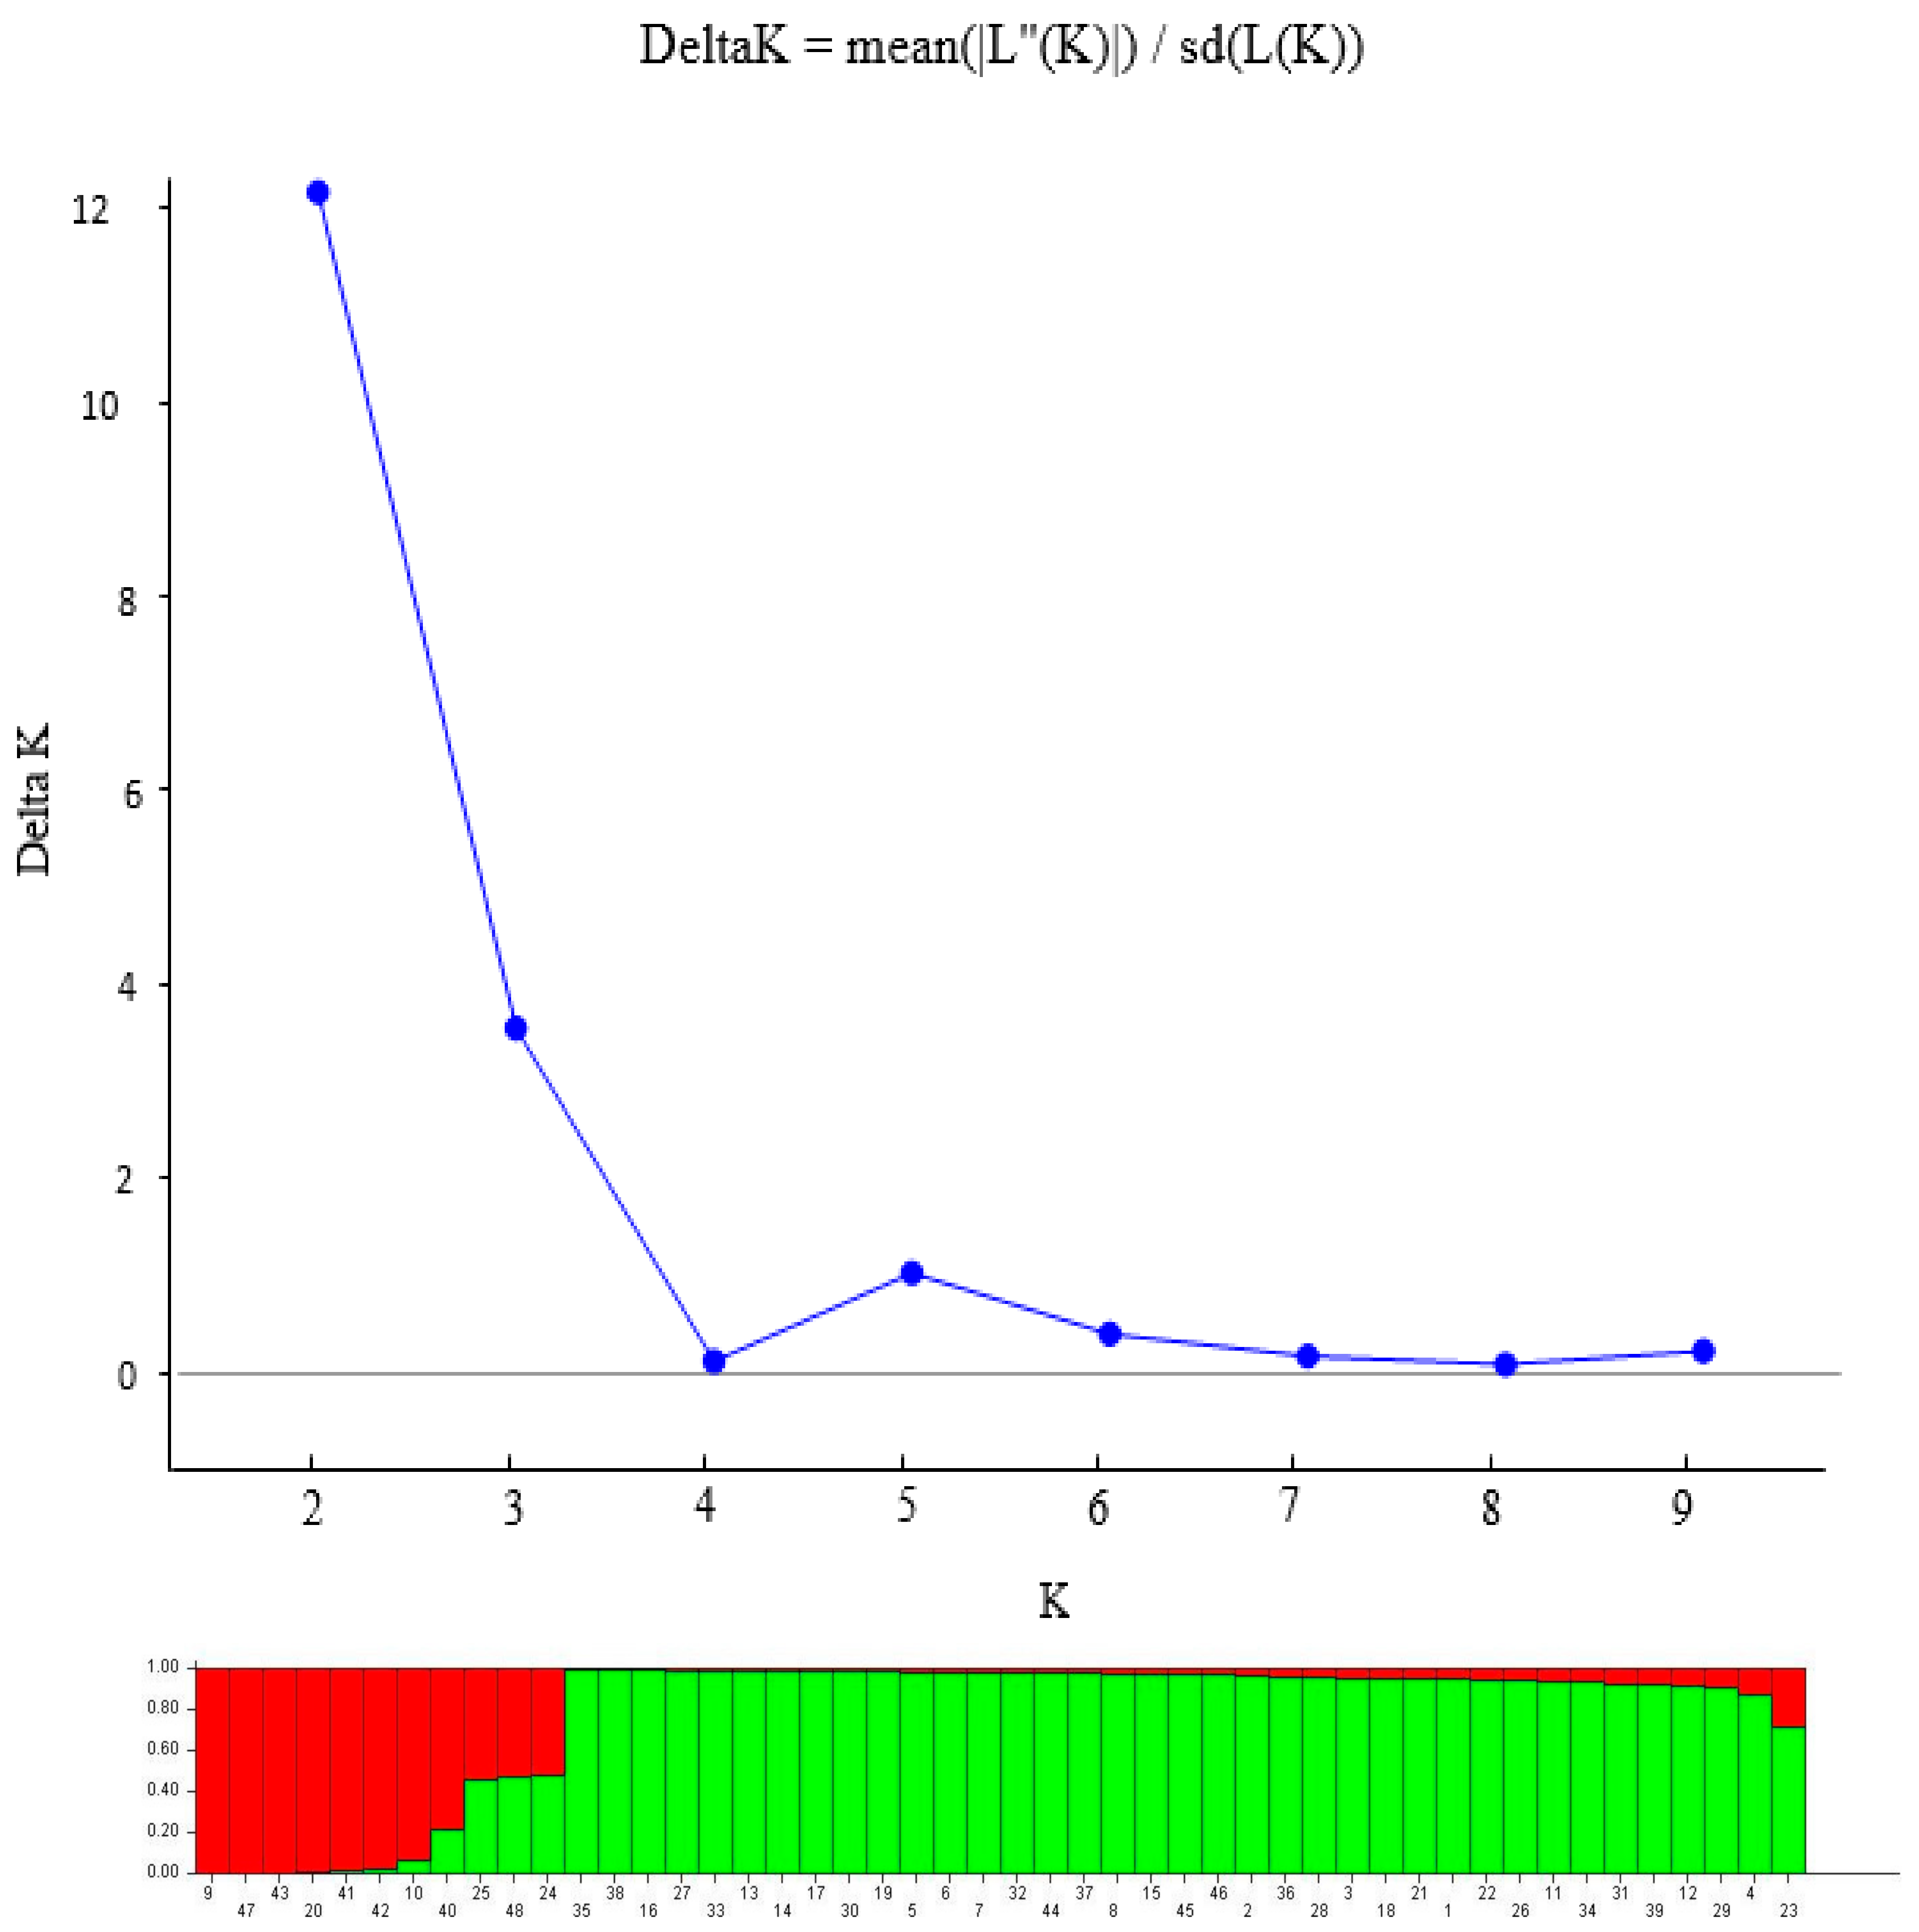
3.3. Population Structure of 48 Pigeonpea Accessions
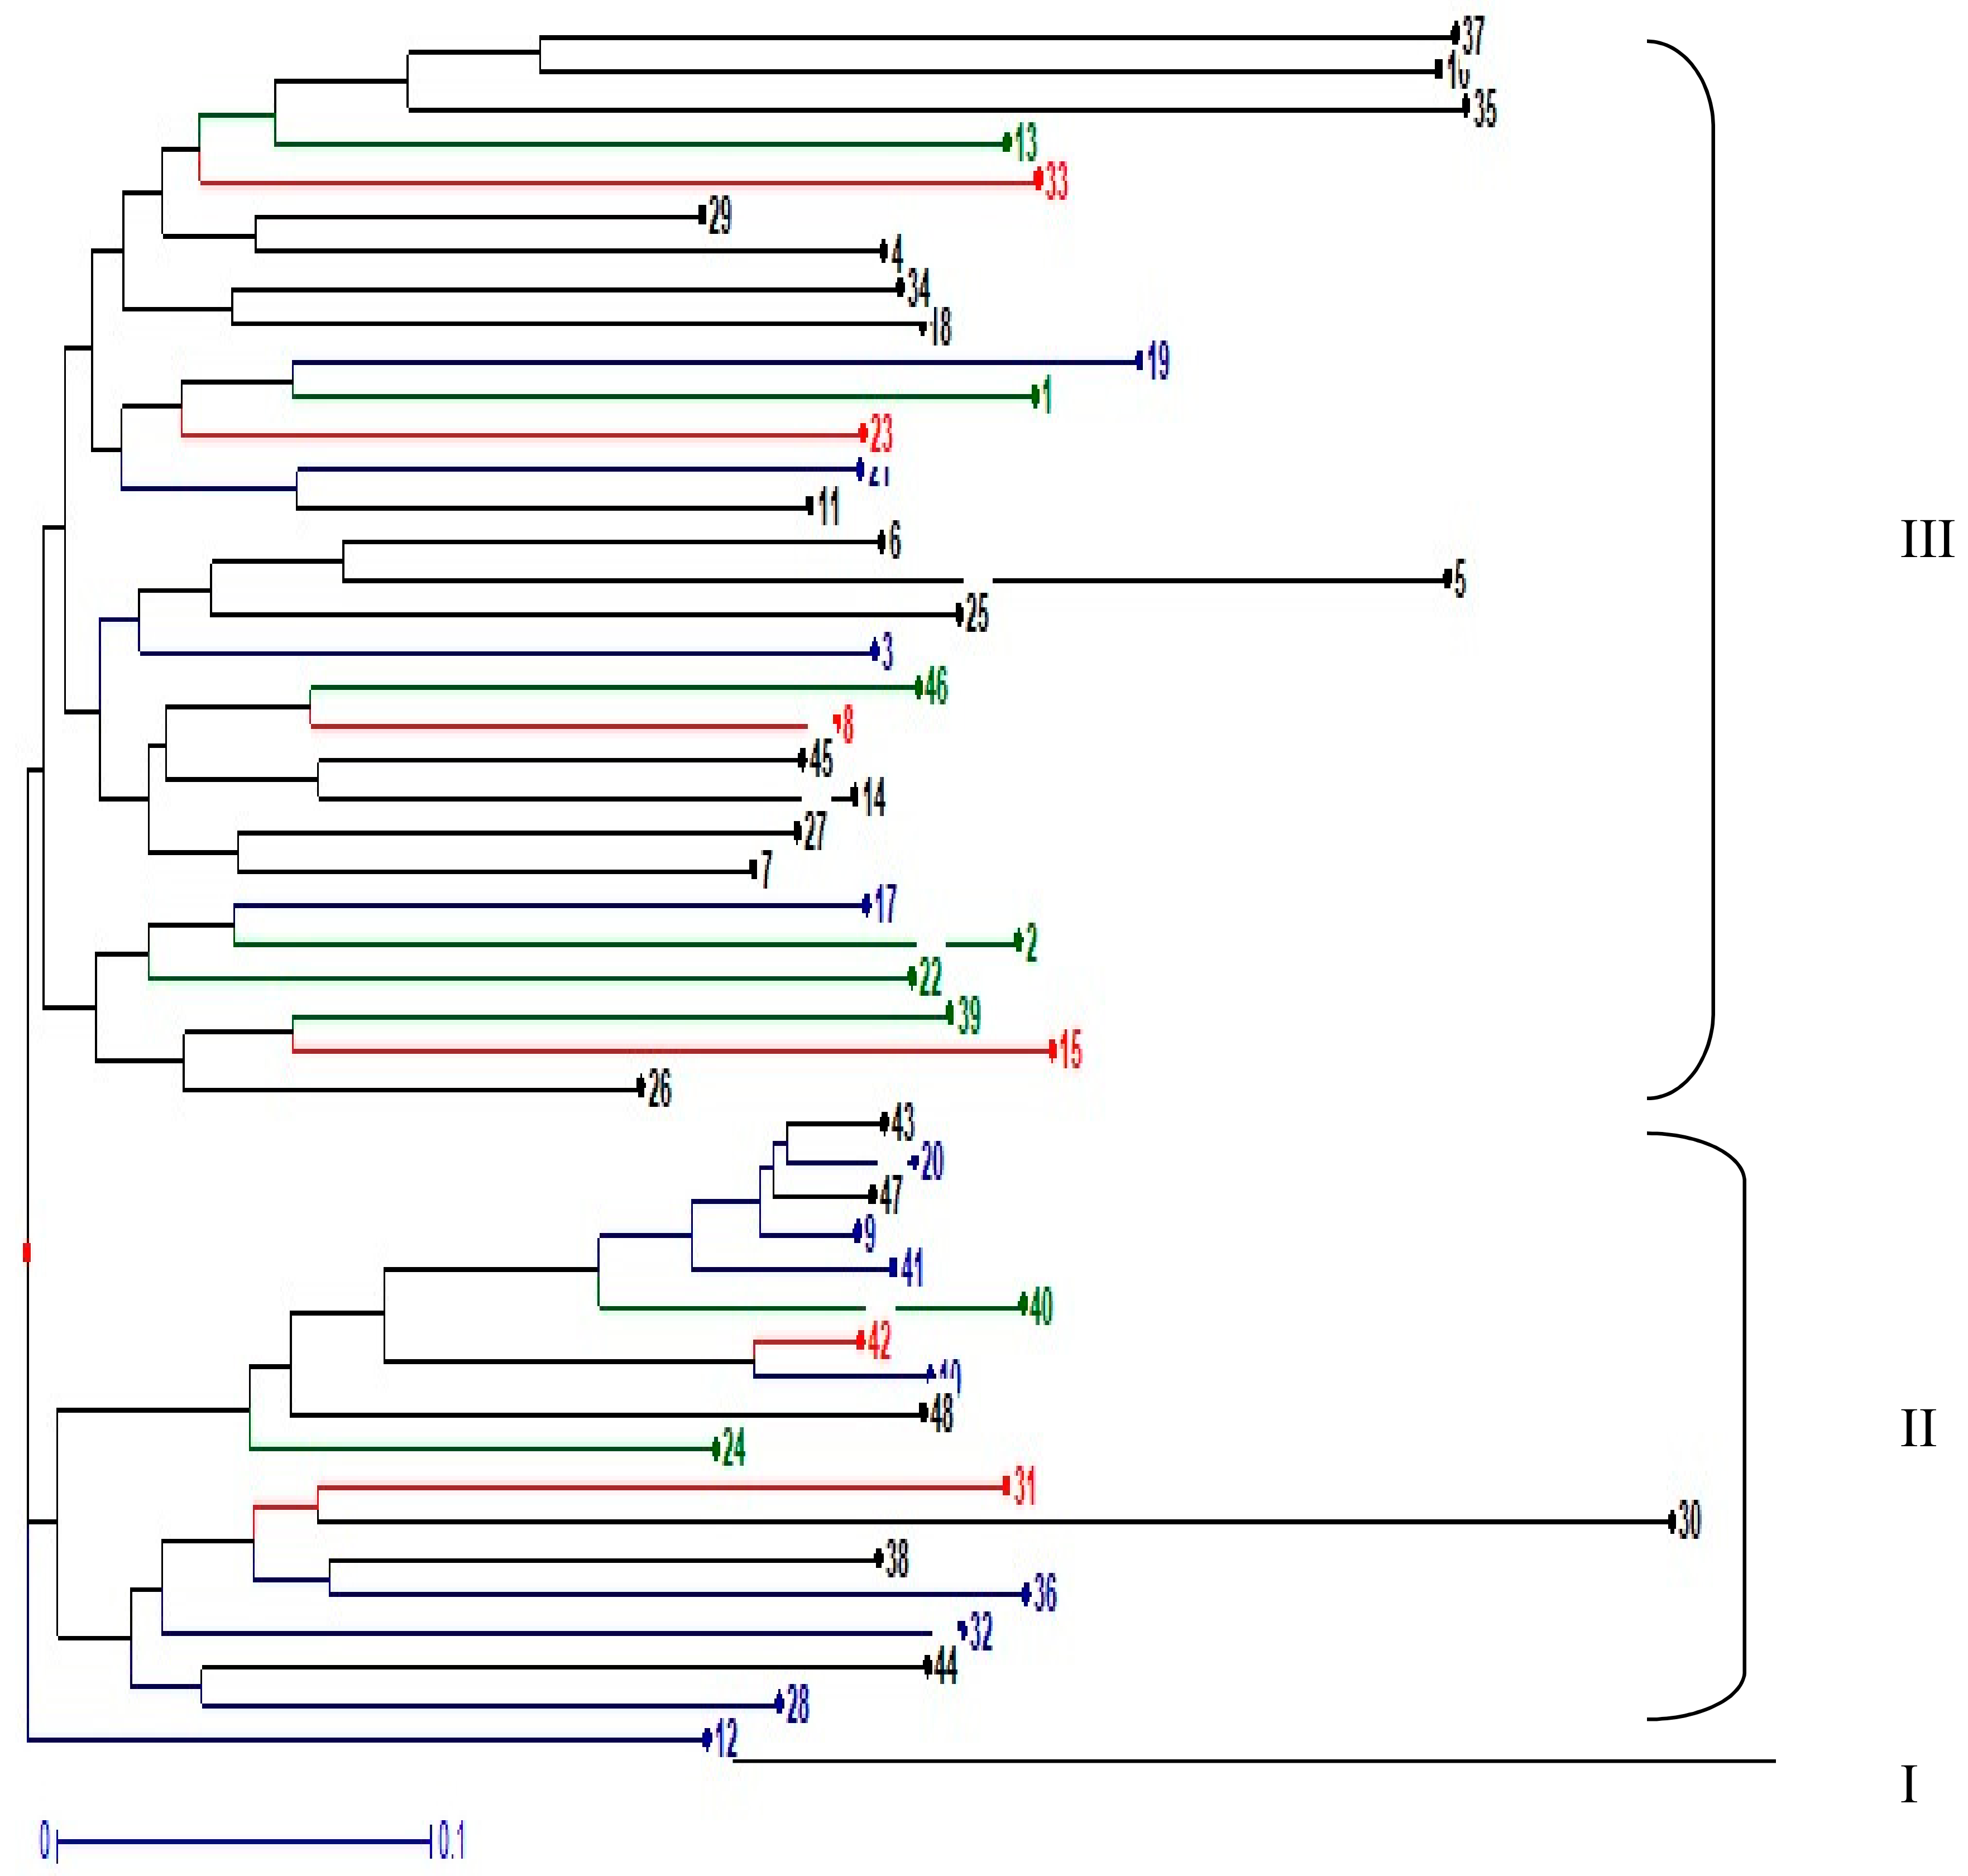
3.4. Genetic Cluster Analysis of 48 Pigeonpea Accessions
3.5. Analysis of Molecular Variance (AMOVA)
4. Discussion
5. Conclusions
Author Contributions
Funding
Acknowledgments
Conflicts of Interest
References
- Mligo, J.K.; Myaka, F.A.; Mbwaga, A.; Mpangala, B.A. On-station research, technology exchange and seed systems for pigeonpea in Tanzania. In Status and Potential of Pigeonpea in Eastern and Southern Africa; Silim, S.N., Mergeai, G., Kimani, P.M., Eds.; ICRISAT: Nairobi, Kenya, 2001; pp. 197–206. [Google Scholar]
- Goud, V.V.; Kale, H.B.; Konde, N.M. Optimization of crop geometry and nutrient requirements of medium duration pigeonpea hybrid under rainfed condition. J. Food Leg. 2012, 25, 243–245. [Google Scholar]
- Shiferaw, B.; Silim, S.; Muricho, G.; Audi, P.; Mligo, J.; Lyimo, S.; You, L.; Christiansen, J.L. Assessment of the Adoption and Impact of Improved Pigeonpea Varieties in Tanzania; Working Paper Series no. 21: Socioeconomics and Policy; International Crops Research Institute for the Semi-Arid Tropics: Patancheru, India, 2005. [Google Scholar]
- Tanzania Bureau of Statistics. Pigeonpea and sub Sector in Northern Tanzania; Technoserve-TA, ICRISAT/SARI report; Tanzania Bureau of Statistics: Arusha, Tanzania, 1990.
- Odeny, D.A. Microsatellite Development and Application in Pigeonpea [Cajanus cajan (L.) Millsp.]. Ph.D. Thesis, University of Bonn, Bonn, German, 2006. [Google Scholar]
- Odeny, D.A. The potential of pigeonpea [Cajanus cajan (L.) Millsp.] in Africa. Nat. Res. Forum 2007, 31, 297–305. [Google Scholar] [CrossRef]
- Saxena, K.B. Quality nutrition through pigeonpea—A review. Health 2010, 2, 1335–1344. [Google Scholar] [CrossRef] [Green Version]
- Baker, G.H.; Tann, C.R. Mating of Helicorvepa armigera [Lepidoptera: Noctuidae] moths and their host plant origins as larvae within Australian cotton systems. Bul. Ent. Res. 2013, 103, 171–181. [Google Scholar]
- Peoples, M.B.; Herridge, D.F.; Ladha, J.K. Biologiccal nitrogen fixation: An efficient source of Nirogen for sustainable agricultural production. Plant Soil 1995, 174, 3–28. [Google Scholar]
- Tesema, B.A. Experience from 10 agro climatic zones of Ethiopia, India, Kenya, Tanzania and Uganda. In Profitable Agroforestry Innovations for Eastern Africa; World Agroforestry Centre (ICRAF): Nairobi, Kenya, 2007. [Google Scholar]
- Manyasa, E.O.; Silim, S.M.; Mwangi, S.G.; Christiansen, L. Diversity in Tanzanian pigeonpea [Cajanus cajan (L.) Millsp.] landraces and their reponse to environments. Gen. Res. Crop. Evol. 2008, 55, 379–387. [Google Scholar]
- Upadhaya, H.D.; Pundir, R.P.S.; Gowda, C.L.L.; Reddy, K.N.; Singh, S. Geographical patterns of diversity for qualitative and quantitative traits in the pigeonpea germplasm collection. Plant. Gen. Res. 2005, 3, 331–352. [Google Scholar] [CrossRef] [Green Version]
- Upadhaya, H.D.; Reddy, K.N.; Gowda, C.L.L.; Singh, S. Phenotypic diversity in the pigeonpea [Cajanus cajan (L.) Millsp.] core collection. Genet. Res. Crop. Evol. 2007, 54, 1167–1184. [Google Scholar]
- Saxena, R.K.; Prathima, C.; Saxena, K.B.; Hoisington, D.A.; Singh, N.K.; Varshney, R.K. Novel SSR Markers for polymorphism Detection in Pigeonpea [Cajanus cajan (L.) Millsp.]. Plant Breed. 2009. [Google Scholar] [CrossRef] [Green Version]
- Mittal, N.; Dubey, A.K. Microsatellite markers—A new practice of DNA based markers in molecular genetics, A review. Plant Breed. 2009, 3, 235–246. [Google Scholar]
- Gupta, P.K.; Varshney, R.K. The development and use of microsatellite markers for genetic analysis and plant breeding with emphasis on bread wheat. Euphytica 2000, 113, 163–185. [Google Scholar]
- Njung’e, V.; Deshpande, S.; Siambi, M.; Jones, R.; Silim, S.; De Villiers, S. SSR genetic diversity assessment of popular pigeonpea varieties in Malawi reveals unique fingerprints. Elect. J. Biotechnol. 2016, 21, 65–71. [Google Scholar] [CrossRef] [Green Version]
- De Sousa, A.C.B.; Godoy, R.; Sforca, D.A.; De Campos, T.; Zuchi, M.I.; Jank, L.; De Souza, A.P. Genetic diversity analysis among pigeonpea genotypes adapted to South American regions based on microsatellite markers. Sci. Agric. 2011, 68, 431–439. [Google Scholar] [CrossRef]
- Zavinon, F.; Adoukonou-Sagbadja, H.; Keilwagen, J.; Leinert, H.; Ordon, F.; Perovic, D. Genetic diversity and population structure in Beninese pigeon pea [Cajanus cajan (L.) Huth] landraces collection revealed by SSR and genome wide SNP markers. Genet. Res. Crop. Evol. 2020, 67, 191–208. [Google Scholar] [CrossRef]
- Powell, W.; Machrayand, G.C.; Provan, J. Polymorphism revealed by simple sequence repeats. Trends Plant Sci. 1996, 1, 215–222. [Google Scholar] [CrossRef]
- Mace, E.S.; Buhariwalla, H.K.; Crouch, J.H. A high throughput DNA extraction protocol for tropical molecular breeding programs. Plant. Mol. Biol. Rep. 2003, 21, 459–460. [Google Scholar] [CrossRef]
- Bohra, A.; Dubey, A.; Saxena, R.K.; Penmetsa, R.V.; Poornima, K.N.; Kumar, N.; Farmer, A.D.; Srivani, G.; Upadhyaya, H.D.; Gothalwal, R.; et al. Analysis of BAC-end sequences (BESs) and development of BES-SSR markers for genetic mapping and hybrid purity assessment in pigeonpea [Cajanus cajan (L.) Millsp.]. BMC Plant Biol. 2011, 11, 56–60. [Google Scholar] [CrossRef] [Green Version]
- Peakall, R.; Smouse, P.E. GENALEX 6: Genetic analysis in Excel; Population genetic software for teaching and research. Mol. Ecol. Notes. 2007, 6, 288–295. [Google Scholar] [CrossRef]
- Nei, N.; Li, W. Mathematical model for studying genetic variation in terms of restriction endo nucleases. Proc. Natl. Acad. Sci. USA 1979, 76, 5269–5273. [Google Scholar]
- Pritchard, J.; Stephens, M.; Rosenberg, N.; Donnelly, P. Association mapping in structured populations. Am. J. Hum. Genet. 2000, 67, 170–180. [Google Scholar] [CrossRef] [Green Version]
- Evanno, G.; Regnaut, S.; Goudet, J. Detecting the number of clusters of individuals using the software structure: A simulation study. Mol. Ecol. 2005, 14, 2611–2620. [Google Scholar] [CrossRef] [PubMed] [Green Version]
- Earl, E.A.; Von Holdt, B.M. Structure Harvester: A website and program for visualizing STRUCTURE output and implementing the Evanno method. Conserv. Genet. Res. 2012, 4, 359–361. [Google Scholar] [CrossRef]
- Perrier, X.; Jacquemoud-Collet, J.P. DARwin Software. Dissimilarity Analysis and Representation for Windows. 2006. Available online: http://www.darwin.cirad.fr/darwin.html (accessed on 14 October 2019).
- Wright, S. Variability within and among Natural populations. In Evolution and the Genetics of Populations; University of Chicago Press: Chicago, IL, USA, 1978; Volume 4. [Google Scholar]
- Bohra, A.; Jha, J.; Pandey, G.; Patil, P.G.; Saxena, R.K.; Singh, I.P.; Singh, D.; Mishra, R.K.; Mishra, A.; Singh, F.; et al. New Hypervariable SSR Markers for Diversity Analysis, Hybrid Purity Testing and Trait Mapping in Pigeonpea [Cajanus cajan (L.) Millsp.]. Front. Plant. Sci. 2017, 8, 377. [Google Scholar] [CrossRef]
- Singh, A.K.; Rai, V.P.; Chand, R.; Singh, R.P.; Singh, M.N. Genetic diversity studies and identification of SSR markers associated with Fusarium wilt (Fusarium udum) resistance in cultivated pigeonpea [Cajanus cajan (L.) Millsp.]. J. Genet. 2013, 92, 273–280. [Google Scholar] [CrossRef] [PubMed]
- Singh, A.K.; Rai, V.P.; Singh, M.N.; Chand, R.; Ramdhari, R.; Singh, R.M. Genetic Diversity Analysis in [Cajanus cajan (L.) Millsp.] Species Using SSR Markers. In Proceedings of the VIth International Conference on Legume Genetics and Genomics, Hyderabad, India, 2 October 2012. [Google Scholar]
- Walunjkar, B.C.; Panhar, A.; Singh, N.K.; Parmar, L.D. Genetic diversity of wild and cultivated genotypes of pigeonpea through RAPD and SSR markers. J. Environ. Biol. 2015, 36, 461–466. [Google Scholar] [PubMed]
- Rani, P.; Sirohi, A.; Pariharand, K.; Gupta, A. Assessing genetic variation of pigeonpea [Cajanus cajan (L.) Millsp.] genotypes using RAPD and ISSR markers systems. Bioscan 2015, 10, 957–962. [Google Scholar]
- Saxena, K.B. Genetic improvement of pigeonpea—A review. Trop. Plant. Biol. 2008, 1, 159–178. [Google Scholar] [CrossRef]
- Smartt, J. Evolution of genetic resources of pigeonpea. In Grain Legumes; Smartt, J., Ed.; Cambridge University Press: Cambridge, UK, 1990. [Google Scholar]
- Souframaniem, J.; Manjaya, J.G.; Krishna, T.G.; Pawar, E.S. Random Amplified Polymorphic DNA Analysis of cytoplasmic male sterile and male fertile pigeonpea [Cajanus cajan (L.) Millsp.]. Euphytica 2003, 129, 293–299. [Google Scholar] [CrossRef]
- Songok, S.; Ferguson, M.; Muigai, A.W.; Silim, S. Genetic diversity in pigeonpea [Cajanus cajan (L.) Millsp.] landraces as revealed by simple sequence repeat markers. Afr. J. Biotechnol. 2010, 9, 3231–3241. [Google Scholar]
- Wasike, S.; Okori, P.; Rubaihayo, P.R. Genetic variability and relatedness of the Asian and African pigeonpea as revealed by AFLP. Afr. J. Biotechnol. 2005, 4, 1228–1233. [Google Scholar]
- Kumar, R.; Agrawal, K.; Bhat, K.V. Analysis of genetic diversity and its stratification in pigeonpea germplasm using BES-derived microsatellite markers. Indian J. Biotechnol. 2014, 13, 473–485. [Google Scholar]
- Pushpavalli, S.; Rajeswari, R.R. Discerning genetic diversity among super early pigeonpea germplasm using microsatellite markers. Leg. Res. 2017, 40, 191–195. [Google Scholar] [CrossRef] [Green Version]
- Kassa, M.T.; Penmetsa, R.V.; Carrasqulla-Garcia, N.; Sarma, B.K.; Datta, S.; Upadhyaya, H.D.; Varshney, R.K.; von Wettberg, E.J.; Cook, D.R. Genetic Patterns of Domestication in Pigeonpea [Cajanus cajan (L.) Millsp.] and Wild Relatives. PLoS ONE 2012, 7, e39563. [Google Scholar] [CrossRef] [PubMed] [Green Version]
- Petchiammal, K.I.; Muthiah, A.R.; Jayamani, P. Molecular characterization of cultivated and Wild cajanus species using simple sequence repeat markers. Leg. Res. 2015, 38, 742–747. [Google Scholar] [CrossRef] [Green Version]
- Singh, S.; Singh, K.N.; Kant, R.; Mehfooz, S.; Dutta, S. Assessment of genetic diversity among pigeonpea genotypes using SSR markers. Indian J. Genet. 2008, 68, 255–260. [Google Scholar]
- Choudhury, P.R.; Singh, I.P.; George, B.; Verma, A.K.; Singh, N.P. Assessment of genetic diversity among pigeonpea cultivars using RAPD analysis. Biol. Planta 2008, 52, 648–653. [Google Scholar] [CrossRef]


| S/N | Genotype | Status | Origin | Country | S/N | Genotype | Status | Origin | Country |
|---|---|---|---|---|---|---|---|---|---|
| 1 | ICEAP 00040 | Released cultivar | TARI | Tanzania | 25 | ICEAP 01172/2 | Breeding line | ICRISAT | Kenya |
| 2 | ICEAP 00936 | Breeding line | ICRISAT | Kenya | 26 | ICEAP 01154/15 | Breeding line | ICRISAT | Kenya |
| 3 | Babati White | Landraces | Farmers | Tanzania | 27 | ICEAP 00979/1 | Breeding line | ICRISAT | Kenya |
| 4 | TZA 253 | Landraces | NPGRC | Tanzania | 28 | ICEAP 01172/2 | Breeding line | ICRISAT | Kenya |
| 5 | TZA 2466 | landraces | NPGRC | Tanzania | 29 | ICEAP 01154/2 | Breeding line | ICRISAT | Kenya |
| 6 | TZA 2785 | Landraces | NPGRC | Tanzania | 30 | ICEAP 0673-1 | Breeding line | ICRISAT | Kenya |
| 7 | TZA 197 | landraces | NPGRC | Tanzania | 31 | ICEAP 00554 | Released cultivar | TARI | Tanzania |
| 8 | ICEAP 00557 | Released cultivar | TARI | Tanzania | 32 | Mthawanjuni | Landraces | Farmers | Tanzania |
| 9 | ICEAP O1179 | Breeding line | ICRISAT | Kenya | 33 | TZA 2514 | Landraces | NPGRC | Tanzania |
| 10 | Bangili | Landraces | Farmers | Tanzania | 34 | TZA 2464 | Landraces | NPGRC | Tanzania |
| 11 | ICEAP 00540 | Breeding line | ICRISAT | Kenya | 35 | TZA 5596 | Landraces | NPGRC | Tanzania |
| 12 | Kondoa | Landraces | Farmers | Tanzania | 36 | TZA 5582 | Landraces | NPGRC | Tanzania |
| 13 | TZA 2692 | Landraces | NPGRC | Tanzania | 37 | Arumeru | landraces | Farmers | Tanzania |
| 14 | No. 40 | Landraces | Farmers | Tanzania | 38 | TZA 5463 | Landraces | NPGRC | Tanzania |
| 15 | ICEAP 00911 | Breeding line | ICRISAT | Kenya | 39 | TZA 2496 | Landraces | NPGRC | Tanzania |
| 16 | TZA 250 | Landraces | NPGRC | Tanzania | 40 | Tumia | Released cultivar | TARI | Tanzania |
| 17 | TZA 5464 | Landraces | NPGRC | Tanzania | 41 | ICEAP 00932 | Released cultivar | TARI | Tanzania |
| 18 | Komboa | Released cultivar | TARI | Tanzania | 42 | Ilonga | Landraces | Farmers | Tanzania |
| 19 | TZA 5557 | Landraces | NPGRC | Tanzania | 43 | ICEAP 00576-1 | Breeding line | ICRISAT | Kenya |
| 20 | TZA 2509 | Landraces | NPGRC | Tanzania | 44 | Hombolo | Landraces | Farmers | Tanzania |
| 21 | Kiteto | Landraces | Farmers | Tanzania | 45 | TZA 5541 | Landraces | NPGRC | Tanzania |
| 22 | TZA 5555 | Landraces | NPGRC | Tanzania | 46 | TZA 2456 | Landraces | NPGRC | Tanzania |
| 23 | ICEAP 01147 | Breeding line | ICRISAT | Kenya | 47 | TZA 2807 | Landraces | NPGRC | Tanzania |
| 24 | TZA 2439 | Landraces | NPGRC | Tanzania | 48 | ICEAP 00053 | Released cultivar | TARI | Tanzania |
| Marker Name | GenBank ID | SSR Motif | Forward Primer (5′–3′) | Reverse Primer (5′–3′) | Product Size (bp) |
|---|---|---|---|---|---|
| CcM0121 | FI191501 | (TA)17 | AGAAATTGGAGGCTTGGTCA | GGTATAAGGCTCAAACCCGA | 273 |
| CcM0443 | FI200654 | (TA)17n(AT)5 | TGACAAAATAATGCGGTCACA | CAAGCCAAAGTTTGTTTGAACT | 261 |
| CcM2044 | FI245729 | (TAT)9 | ATCACTCCAAGCACCCAAAC | TGCAAATGGAAGGGAATAGC | 212 |
| CcM0444 | FI200657 | (TA)7 | TGTCATGAGTGGCTGATCCT | TCAACCAAAATCCAAACCAA | 184 |
| CcM0494 | FI202253 | (AT)21 | ACGTGAAAAATCCGCAACTT | GCTTGTGTTTCAAAATCCAACTT | 117 |
| CcM1251 | FI224872 | (CCA)9 | CAAATGGCAGAACAGAGCAG | CGGAGATTGCATTGTTCCTT | 228 |
| CcM2097 | FI246959 | (CT)12 | TGATAGGAATATTTCGGCGG | CCTTTGAAATTGAAGGCGAG | 193 |
| CcM2409 | FI255641 | (TTA)6 | TGAAGGTTGATCCAAGGAGG | CGTGCAAAATAATTGTCCAAAA | 186 |
| CcM0974 | FI216621 | (AT)13 | CGTCTTACAGACGATCTGCATC | CAAAGAAACAGACATGATAAAGAGAGA | 161 |
| CcM2379 | FI254391 | (TC)10 | CCGGAAAAATTGCCTATTGA | TTCGATGACAGAATTTAGGTGC | 151 |
| CcM2895 | FI272645 | (AT)24 | AATGATAATTGGACACTTCTTTTTC | TGCGTTAATTAAACAAGCAAGC | 268 |
| CcM0246 | FI195094 | (AT)16 | ATGGAGCCAAAGTGTCCAAG | ATGAAAAGCAACTACGCGCT | 226 |
| CcM0721 | FI209310 | (AT)19 | ATCCAACCACGTGTTTCACA | TTTGAAATGGTATCGATGATTAAA | 169 |
| CcM0195 | FI193462 | (AT)11 | CAACAATAAAGCATAAACCACCA | TGACGTAGATTGGGTAGTTAGGA | 223 |
| CcM0361 | FI198648 | (TA)9 | TCTTCCTGTCCTCATCCTCG | TGGAAACCAAAGTTGTGCAT | 172 |
| CcM0374 | FI198903 | (TA)11 | GAACCGTCTTAAAATTTCTCATTT | CAATGGCACATTGTCAAAAA | 161 |
| CcM0484 | FI201979 | (T)12n(ATT)5n(AT)5 | TGGAAATTAAACACCATGAAACA | TGCATGCTACCAAGGAATTG | 248 |
| CcM2049 | FI245893 | (TAT)9 | GCGACCAGGTACTTTCAAGC | CGAAAAGCGATTTCAGAATTT | 260 |
| CcM0594 | FI205393 | (GA)9n(TC)9 | GGCTTGGTTCTTTCTTGGTG | AAGTCCCTGACTTTCCCCAT | 185 |
| CcM0956 | FI216271 | (AT)16 | AGCCCCAACTCAATTATCAAA | TTCCTTGCGGTTTGAGCTAT | 224 |
| CcM1357 | FI227664 | (AT)15n(ATA)5 | TCTAGCATCTCCATTAAACCATTT | ACACATATGACATTTAGCAAATAAAAA | 280 |
| CcM2004 | FI244896 | (CT)7n(AG)12 | AGGAATGCGACATTTTGGAG | TCCCCATCCCTTTCTTTCTT | 209 |
| CcM0492 | FI202198 | (AT)21 | AAAATTTACGAGCACTAAAATGAAAAA | TCAACAATAAATTGTCATATGTCTGG | 271 |
| CcM0698 | FI208758 | (AAT)17 | CTCTTCTTGTTGTCCCTCGC | GCAGTTCTGGAATACCTCGC | 188 |
| CcM0785 | FI210851 | (AT)9 | GCATGTGTTTTTACTTGAGTCGTC | TGGAGGCGATCTCTTTCTTG | 277 |
| CcM1982 | FI244391 | (TC)17 | TATCAAACCTGGCGATCACA | ATTCCGCAAACACATCACAA | 246 |
| CcM2704 | FI265930 | (AT)10 | AAAAATGTTCAATGTCGTAGTATTTGA | TGCCATATATCATGCCCTCA | 127 |
| CcM0248 | FI195265 | (TA)8 | CAAACTCAACCCTACCAATGC | CATTCCTTGTCATCAATGAAGTTT | 280 |
| CcM0673 | FI208212 | (AT)6(AG)9 | TGACCACCAACCATTACCAA | CATGCACCAGACCAGAATCA | 272 |
| CcM1045 | FI219229 | (AT)6 | AACCTTAGTTGGTGATAGATTTCAGA | ACCGTCAAGTCCCAAATCAC | 262 |
| CcM2394 | FI255036 | (TC)12 | TGGAAACGATTTCCTACCACA | ACAAGGGGAAAAGGGAAAGA | 260 |
| CcM0381 | FI199172 | (TA)21 | CGATCCCTGCTTGAAATCAT | GGTTCAAGCGATGCACTACA | 267 |
| CcM0834 | FI212739 | (AT)10 | GTCCGGCTTGCCTATAAGGT | AAGGCAACCTCCCCAGTATT | 262 |
| CcM2505 | FI259241 | (GAA)8 | CCTCGGAAGAGATTGCAGTT | TGATGAATTGGGAAGCAACA | 201 |
| CcM2697 | FI265781 | (CT)9n(T)14 | AGAGTTCGGTGACGGTTACG | GATCTGTCGAGGTTGAGGCT | 242 |
| Markers | N | Na | Ne | I | Ho | He | uHe | F | Pic |
|---|---|---|---|---|---|---|---|---|---|
| CcM0121 | 47 | 5 | 2.03 | 1.01 | 0.21 | 0.51 | 0.51 | 0.58 | 0.51 |
| CcM0195 | 48 | 4 | 3.01 | 1.19 | 0.44 | 0.67 | 0.67 | 0.34 | 0.67 |
| CcM0246 | 47 | 11 | 6.15 | 2.03 | 0.36 | 0.84 | 0.85 | 0.57 | 0.84 |
| CcM0248 | 47 | 4 | 1.68 | 0.80 | 0.32 | 0.40 | 0.41 | 0.21 | 0.40 |
| CcM0361 | 44 | 4 | 2.79 | 1.20 | 0.05 | 0.64 | 0.65 | 0.93 | 0.64 |
| CcM0374 | 48 | 3 | 1.18 | 0.33 | 0.08 | 0.16 | 0.16 | 0.46 | 0.16 |
| CcM0381 | 46 | 7 | 4.06 | 1.60 | 0.26 | 0.75 | 0.76 | 0.65 | 0.75 |
| CcM0443 | 48 | 11 | 5.48 | 1.91 | 0.42 | 0.82 | 0.83 | 0.49 | 0.82 |
| CcM0444 | 48 | 4 | 1.11 | 0.25 | 0.10 | 0.10 | 0.10 | −0.04 | 0.10 |
| CcM0484 | 47 | 2 | 1.24 | 0.34 | 0.17 | 0.19 | 0.19 | 0.11 | 0.19 |
| CcM0492 | 46 | 9 | 5.17 | 1.83 | 0.46 | 0.81 | 0.82 | 0.43 | 0.81 |
| CcM0494 | 48 | 6 | 2.89 | 1.34 | 0.29 | 0.65 | 0.66 | 0.55 | 0.65 |
| CcM0594 | 46 | 2 | 1.24 | 0.34 | 0.13 | 0.19 | 0.20 | 0.33 | 0.19 |
| CcM0673 | 47 | 2 | 1.94 | 0.68 | 0.28 | 0.49 | 0.49 | 0.43 | 0.49 |
| CcM0721 | 46 | 6 | 3.49 | 1.48 | 0.50 | 0.71 | 0.72 | 0.30 | 0.71 |
| CcM0785 | 47 | 2 | 1.26 | 0.36 | 0.15 | 0.21 | 0.21 | 0.28 | 0.21 |
| CcM0834 | 48 | 4 | 1.29 | 0.48 | 0.17 | 0.23 | 0.23 | 0.26 | 0.23 |
| CcM0956 | 39 | 6 | 2.91 | 1.33 | 0.31 | 0.66 | 0.67 | 0.53 | 0.66 |
| CcM0974 | 47 | 8 | 3.78 | 1.63 | 0.49 | 0.74 | 0.74 | 0.34 | 0.74 |
| CcM1045 | 48 | 2 | 1.16 | 0.26 | 0.10 | 0.14 | 0.14 | 0.23 | 0.14 |
| CcM1251 | 39 | 2 | 1.85 | 0.65 | 0.26 | 0.46 | 0.47 | 0.44 | 0.46 |
| CcM1357 | 46 | 5 | 2.07 | 0.96 | 0.37 | 0.52 | 0.52 | 0.29 | 0.52 |
| CcM1982 | 47 | 4 | 1.30 | 0.52 | 0.17 | 0.23 | 0.24 | 0.27 | 0.23 |
| CcM2004 | 47 | 3 | 1.16 | 0.30 | 0.15 | 0.14 | 0.14 | −0.07 | 0.14 |
| CcM2044 | 48 | 4 | 2.99 | 1.17 | 0.69 | 0.67 | 0.67 | −0.03 | 0.67 |
| CcM2049 | 47 | 3 | 1.30 | 0.47 | 0.21 | 0.23 | 0.23 | 0.08 | 0.23 |
| CcM2097 | 46 | 5 | 2.37 | 1.07 | 0.37 | 0.58 | 0.59 | 0.36 | 0.58 |
| CcM2394 | 47 | 3 | 1.11 | 0.23 | 0.06 | 0.10 | 0.10 | 0.37 | 0.10 |
| CcM2409 | 48 | 3 | 1.53 | 0.57 | 0.19 | 0.35 | 0.35 | 0.46 | 0.35 |
| CcM2505 | 47 | 3 | 1.09 | 0.20 | 0.09 | 0.08 | 0.08 | −0.04 | 0.08 |
| CcM2697 | 48 | 4 | 2.22 | 0.95 | 0.31 | 0.55 | 0.56 | 0.43 | 0.55 |
| CcM2704 | 46 | 10 | 4.52 | 1.73 | 0.50 | 0.78 | 0.79 | 0.36 | 0.78 |
| CcM2895 | 47 | 7 | 4.62 | 1.67 | 0.47 | 0.78 | 0.79 | 0.40 | 0.78 |
| Mean | 46.52 | 4.60 | 2.48 | 0.94 | 0.28 | 0.47 | 0.47 | 0.34 | 0.47 |
| S.E | 0.37 | 0.45 | 0.25 | 0.10 | 0.03 | 0.04 | 0.05 | 0.04 |
| Population | N | Na | Ne | I | Ho | He | uHe | F |
|---|---|---|---|---|---|---|---|---|
| Popn 1 | 11.58 | 3.27 | 2.10 | 0.75 | 0.20 | 0.40 | 0.42 | 0.41 |
| Popn 2 | 5.88 | 3.24 | 2.34 | 0.83 | 0.35 | 0.45 | 0.49 | 0.16 |
| Popn 3 | 8.79 | 3.42 | 2.30 | 0.82 | 0.28 | 0.43 | 0.46 | 0.27 |
| Popn 4 | 20.27 | 4.15 | 2.47 | 0.93 | 0.30 | 0.48 | 0.49 | 0.31 |
| Mean | 11.63 | 3.52 | 2.30 | 0.83 | 0.28 | 0.44 | 0.46 | 0.29 |
| SE | 0.47 | 0.16 | 0.11 | 0.05 | 0.02 | 0.02 | 0.02 | 0.03 |
| Cluster | Genotype | % Membership | He | Fst |
|---|---|---|---|---|
| 1 | E9, E10, E20, E40, E40, E41, E42, E43, E47 | 22 | 0.16 | 0.71 |
| 2 | E1, E2, E3, E4, E5, E6, E7, E8, E9, E12, E13, E13, E14, E15, E16, E17, E18, E19, E21, E23, E26, E27, E30, E31, E32, E33, E34, E35, E36, E37, 38, E39, E44, E46 | 78 | 0.54 | 0.01 |
| Source | df | SS | MS | Est. Var. | % | F-Statistics |
|---|---|---|---|---|---|---|
| Among Populations | 3 | 52.76915 | 17.58972 | 0.263732 | 3.2 | 0.001 |
| Among Individual | 44 | 511.2413 | 11.61912 | 3.601227 | 43.5 | 0.001 |
| Within Individual | 48 | 212 | 4.416667 | 4.416667 | 53.3 | 0.001 |
| Total | 95 | 776.0104 | 8.219584 | 100 | ||
| Fixation indices | Value | |||||
| Fst | 0.031845 | |||||
| Fis | 0.449149 | |||||
| Fit | 0.466691 | |||||
| Nm | 7.60042 |
Publisher’s Note: MDPI stays neutral with regard to jurisdictional claims in published maps and institutional affiliations. |
© 2020 by the authors. Licensee MDPI, Basel, Switzerland. This article is an open access article distributed under the terms and conditions of the Creative Commons Attribution (CC BY) license (http://creativecommons.org/licenses/by/4.0/).
Share and Cite
Kimaro, D.; Melis, R.; Sibiya, J.; Shimelis, H.; Shayanowako, A. Analysis of Genetic Diversity and Population Structure of Pigeonpea [Cajanus cajan (L.) Millsp] Accessions Using SSR Markers. Plants 2020, 9, 1643. https://doi.org/10.3390/plants9121643
Kimaro D, Melis R, Sibiya J, Shimelis H, Shayanowako A. Analysis of Genetic Diversity and Population Structure of Pigeonpea [Cajanus cajan (L.) Millsp] Accessions Using SSR Markers. Plants. 2020; 9(12):1643. https://doi.org/10.3390/plants9121643
Chicago/Turabian StyleKimaro, Didas, Rob Melis, Julia Sibiya, Hussein Shimelis, and Admire Shayanowako. 2020. "Analysis of Genetic Diversity and Population Structure of Pigeonpea [Cajanus cajan (L.) Millsp] Accessions Using SSR Markers" Plants 9, no. 12: 1643. https://doi.org/10.3390/plants9121643