Assessing Laser Cleaning of a Limestone Monument by Fiber Optics Reflectance Spectroscopy (FORS) and Visible and Near-Infrared (VNIR) Hyperspectral Imaging (HSI)


Abstract
:1. Introduction
2. Materials and Methods
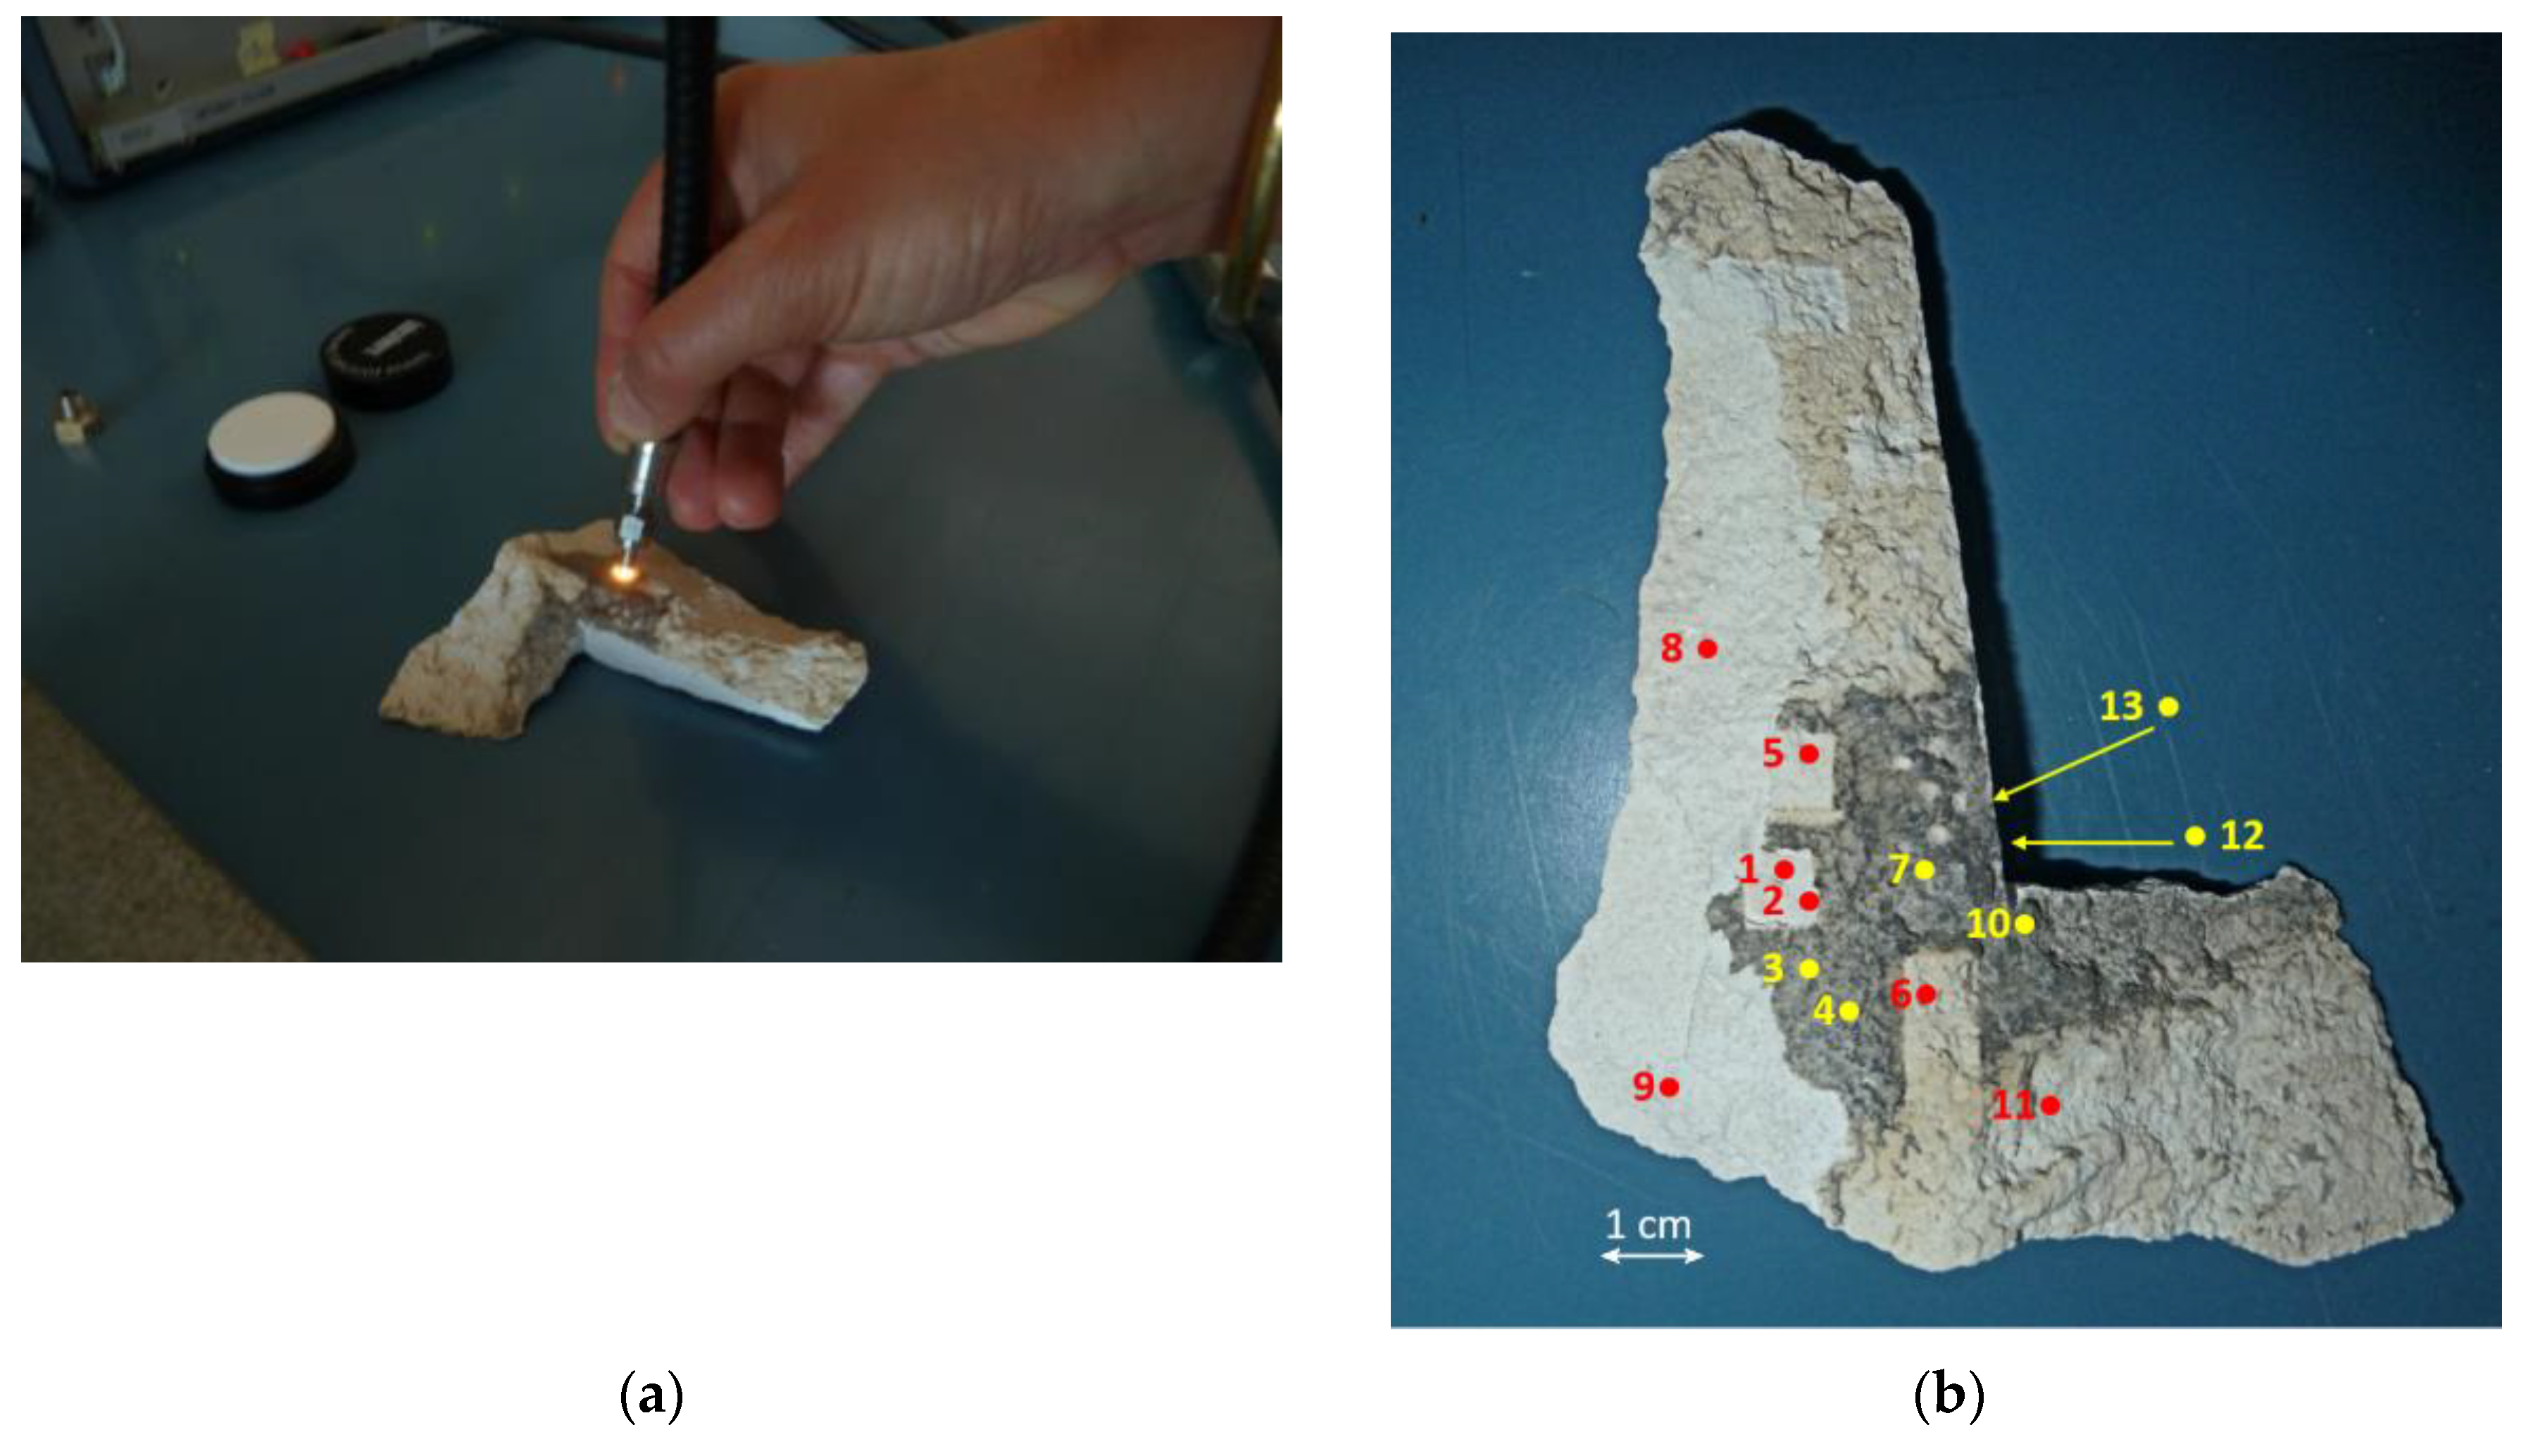
2.1. Sample
2.2. Laser Cleaning Procedure
2.3. Vis–NIR–SWIR FORS and HSI Analyses
2.4. Data Treatment with PCA and SAM
3. Results and Discussion
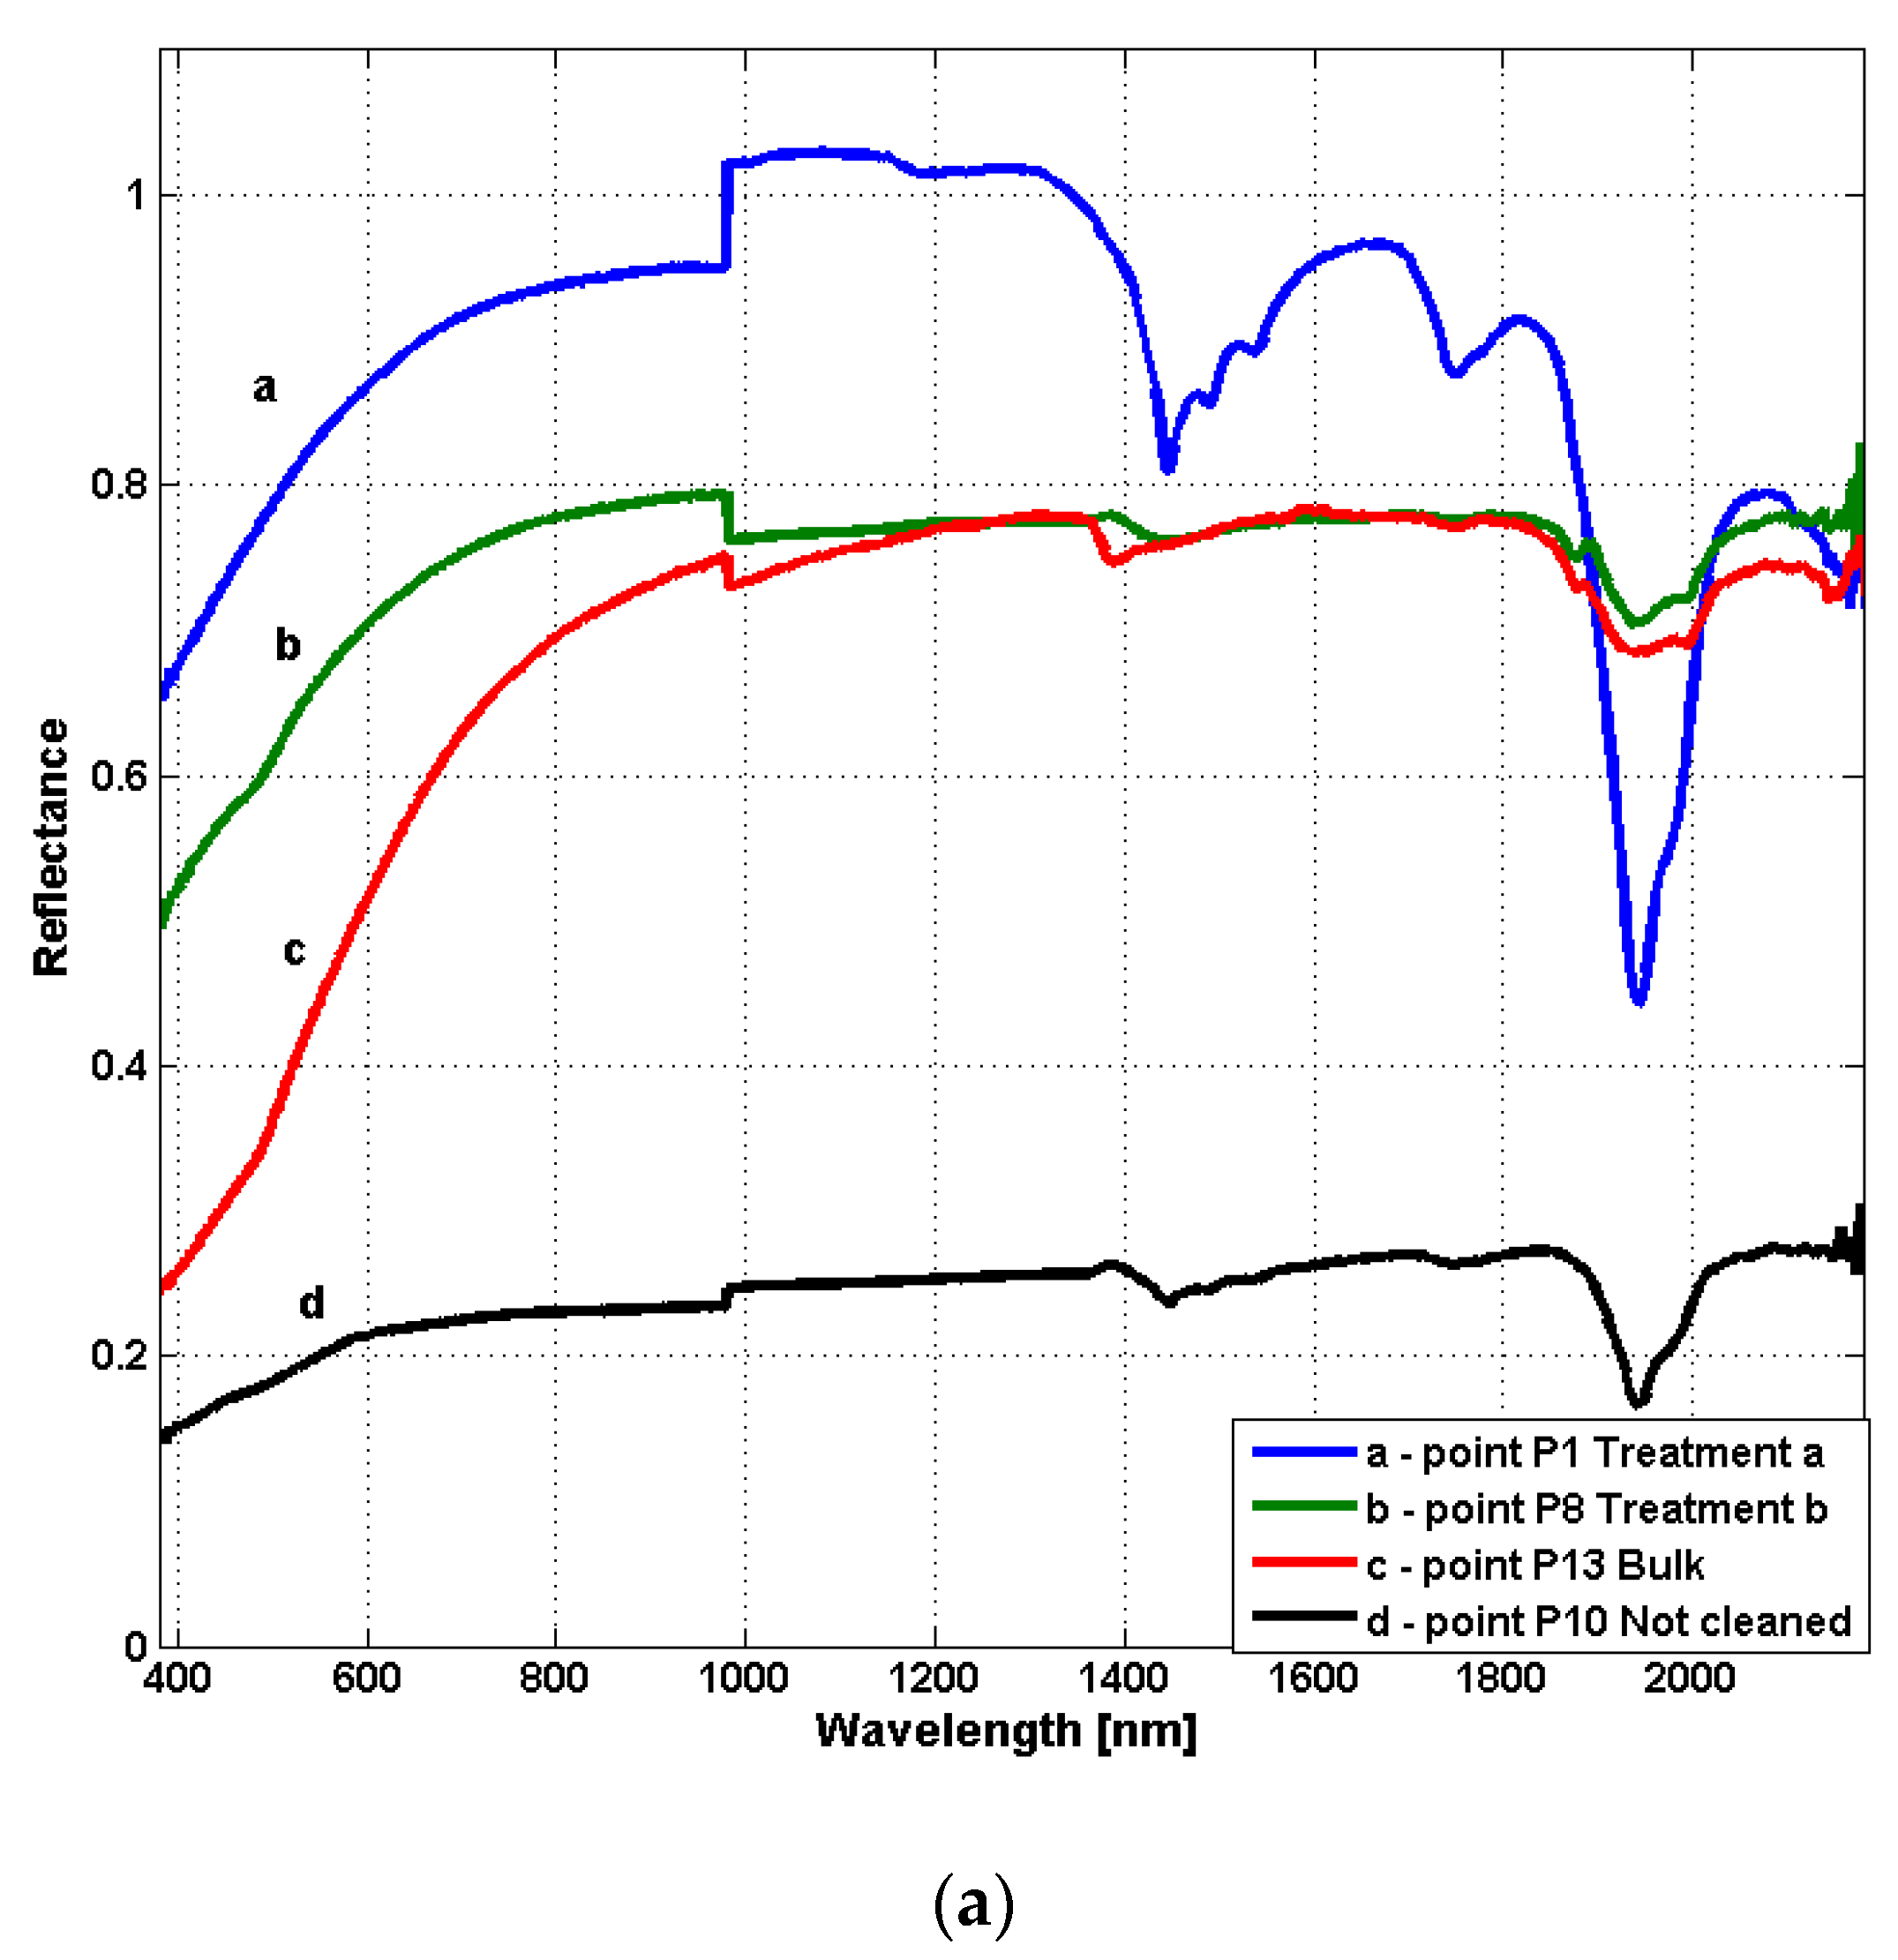
3.1. Vis–NIR–FORS
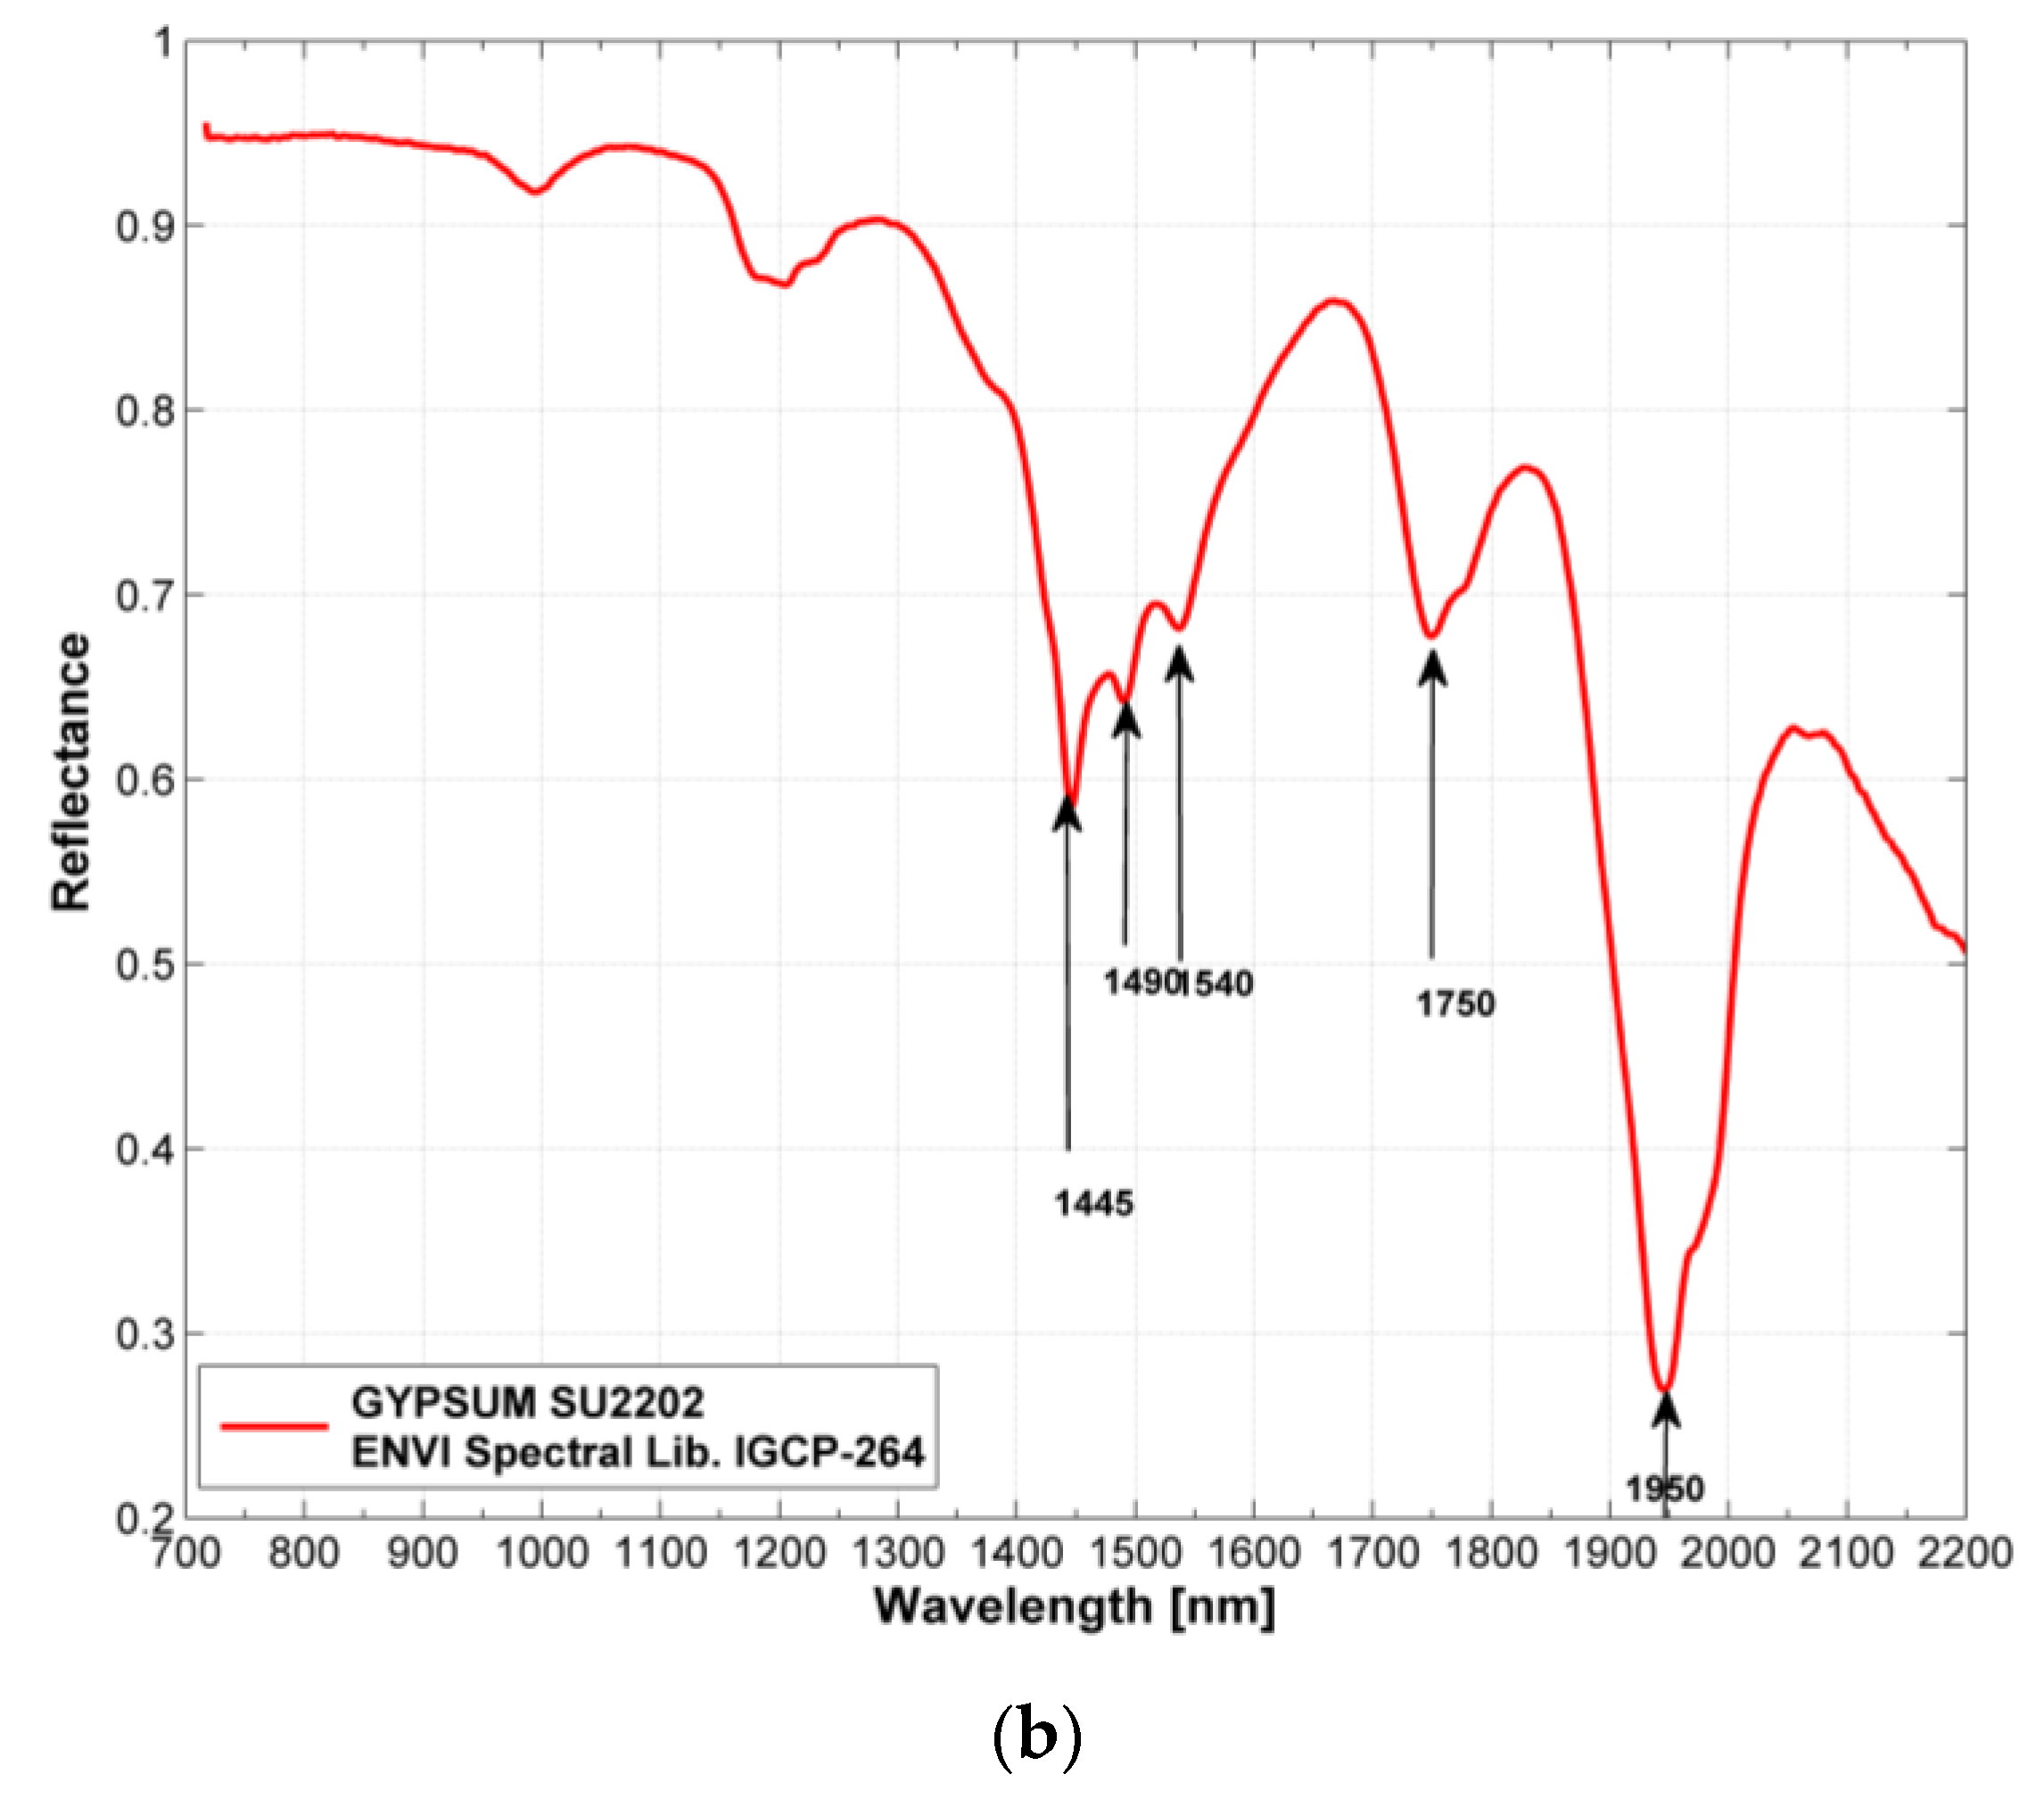
3.2. Vis–NIR–HSI
4. Conclusions
Author Contributions
Funding
Acknowledgments
Conflicts of Interest
References
- Dell’Anna, L.; Laviano, R. Cretaceous limestone in historic buildings and monuments of Apulia (Southern Italy): Geochemical and mineralogical characteristics and decay. Plinius 1990, 2, 51–53. [Google Scholar]
- Smith, B.J.; Gomez-Heras, M.; Viles, H.A. Underlying issues on the selection, use and conservation of building limestone. In Limestone in the Built Environment: Present-Day Challenges for the Preservation of the Past; Smith, B.J., Gomez-Heras, M., Viles, H.A., Cassar, J., Eds.; Geological Society Special Publications: London, UK, 2010; pp. 1–11. [Google Scholar]
- Bell, F.G. Durability of carbonate rock as building stone with comments on its preservation. Environ. Earth Sci. 1993, 21, 187–200. [Google Scholar] [CrossRef]
- Price, C.A.; Amoroso, G.G.; Fassina, V. Stone Decay and Conservation: Atmospheric Pollution, Cleaning, Consolidation and Protection. Stud. Conserv. 1984, 29, 158. [Google Scholar] [CrossRef]
- Sabbioni, C. Contribution of atmospheric deposition to the formation of damage layers. Sci. Total Environ. 1995, 167, 49–55. [Google Scholar] [CrossRef]
- Belfiore, C.M.; Barca, D.; Bonazza, A.; Comite, V.; La Russa, M.F.; Pezzino, A.; Ruffolo, S.A.; Sabbioni, C.; Sabbioni, C. Application of spectrometric analysis to the identification of pollution sources causing cultural heritage damage. Environ. Sci. Pollut. Res. 2013, 20, 8848–8859. [Google Scholar] [CrossRef] [PubMed]
- Siano, S.; Agresti, J.; Cacciari, I.; Ciofini, D.; Mascalchi, M.; Osticioli, I.; Mencaglia, A.A. Laser cleaning in conservation of stone, metal, and painted artifacts: State of the art and new insights on the use of the Nd:YAG lasers. Appl. Phys. A 2011, 106, 419–446. [Google Scholar] [CrossRef]
- Quist, W.J.; Van Bommel, A.J. The Noble Patina of Age. In The Ageing of Materials and Structures; Van Breugel, K., Koleva, D., Van Beek, T., Eds.; Springer: Cham, Switzerland, 2018; pp. 153–165. [Google Scholar]
- Zanini, A.; Trafeli, V.; Bartoli, L. The laser as a tool for the cleaning of Cultural Heritage. IOP Conf. Ser. Mater. Sci. Eng. 2018, 364, 012078. [Google Scholar] [CrossRef]
- Rodrigues, J.D. Defining, mapping and assessing deterioration patterns in stone conservation projects. J. Cult. Herit. 2015, 16, 267–275. [Google Scholar] [CrossRef]
- Sabatini, G.; Giamello, M.; Pini, R.; Siano, S.; Salimbeni, R. Laser cleaning methodologies for stone façades and monuments: Laboratory analyses on lithotypes of Siena architecture. J. Cult. Herit. 2000, 1, S9–S19. [Google Scholar] [CrossRef]
- Brimblecombe, P.; Grossi, C.M. Aesthetic thresholds and blackening of stone buildings. Sci. Total Environ. 2005, 349, 175–189. [Google Scholar] [CrossRef]
- Asmus, J.F.; Seracini, M.; Zetler, M.J. Surface morphology of laser-cleaned stone. Lithoclastia 1976, 1, 23–46. [Google Scholar]
- Cooper, M. Laser Cleaning in Conservation: An Introduction; Butterworth-Heinemann: Oxford, UK, 1998. [Google Scholar]
- Pini, R.; Salimbeni, R. Tecniche e Sistemi Laser per il Restauro dei Beni Culturali; Cardini Editore: Firenze, Italy, 2001. [Google Scholar]
- Fotakis, C.; Kautek, W.; Castillejo, M. Lasers in the Preservation of Cultural Heritage. Laser Chem. 2007, 2006, 1. [Google Scholar] [CrossRef] [Green Version]
- Gobernado-Mitre, I.; Prieto, A.C.; Zafiropulos, V.; Spetsidou, Y.; Fotakis, C. On-Line Monitoring of Laser Cleaning of Limestone by Laser-Induced Breakdown Spectroscopy and Laser-Induced Fluorescence. Appl. Spectrosc. 1997, 51, 1125–1129. [Google Scholar] [CrossRef]
- Senesi, G.S.; Carrara, I.; Nicolodelli, G.; Milori, D.M.B.P.; De Pascale, O. Laser cleaning and laser-induced breakdown spectroscopy applied in removing and characterizing black crusts from limestones of Castello Svevo, Bari, Italy: A case study. Microchem. J. 2016, 124, 296–305. [Google Scholar] [CrossRef]
- Anglos, D. Laser-induced breakdown spectroscopy in heritage science. Phys. Sci. Rev. 2019, 4, 20180005. [Google Scholar] [CrossRef]
- Lee, J.; Watkins, K. In-process monitoring techniques for laser cleaning. Opt. Lasers Eng. 2000, 34, 429–442. [Google Scholar] [CrossRef]
- Picollo, M.; Bacci, M.; Casini, A.; Lotti, F.; Porcinai, S.; Radicati, B.; Stefani, L. Fiber Optics Reflectance Spectroscopy: A Non-destructive Technique for the Analysis of Works of Art. In Optical Sensors and Microsystems; Martellucci, S., Chester, A.N., Mignani, A.G., Eds.; Springer: Boston, MA, USA, 2002; pp. 259–265. [Google Scholar]
- Dupuis, G.; Elias, M.; Simonot, L. Pigment Identification by Fiber-Optics Diffuse Reflectance Spectroscopy. Appl. Spectrosc. 2002, 56, 1329–1336. [Google Scholar] [CrossRef]
- Cheilakou, E.; Troullinos, M.; Koui, M. Identification of pigments on Byzantine wall paintings from Crete (14th century AD) using non-invasive Fiber Optics Diffuse Reflectance Spectroscopy (FORS). J. Archaeol. Sci. 2014, 41, 541–555. [Google Scholar] [CrossRef]
- Bacci, M.; Bellucci, R.; Frosinini, C.; Picollo, M.; Porcinai, S.; Radicati, B.; Cucci, C. Fiber Optics Reflectance Spectroscopy in the Entire VIS-IR Range: A Powerful Tool for the Non-invasive Characterization of Paintings. In Materials Issues in Art and Archaeology Materials Research Society Symposium Proceedings; Vandiver, P., Mass, J., Murray, A., Eds.; Cambridge University Press: Cambridge, UK, 2005; Volume 852, pp. 297–302. [Google Scholar]
- Fischer, C.; Kakoulli, I. Multispectral and hyperspectral imaging technologies in conservation: Current research and potential applications. Stud. Conserv. 2006, 51, 3–16. [Google Scholar] [CrossRef]
- Cucci, C.; Delaney, J.K.; Picollo, M. Reflectance Hyperspectral Imaging for Investigation of Works of Art: Old Master Paintings and Illuminated Manuscripts. Accounts Chem. Res. 2016, 49, 2070–2079. [Google Scholar] [CrossRef]
- Cucci, C.; Casini, A. Hyperspectral imaging for artworks investigation. Data Handl. Sci. Technol. 2020, 32, 583–604. [Google Scholar] [CrossRef]
- Delaney, J.K.; Ricciardi, P.; Glinsman, L.D.; Facini, M.; Thoury, M.; Palmer, M.; De La Rie, E.R. Use of imaging spectroscopy, fiber optic reflectance spectroscopy, and X-ray fluorescence to map and identify pigments in illuminated manuscripts. Stud. Conserv. 2014, 59, 91–101. [Google Scholar] [CrossRef] [Green Version]
- Cucci, C.; Picollo, M.; Chiarantini, L.; Uda, G.; Fiori, L.; De Nigris, B.; Osanna, M. Remote-sensing hyperspectral imaging for applications in archaeological areas: Non-invasive investigations on wall paintings and on mural inscriptions in the Pompeii site. Microchem. J. 2020, 158, 105082. [Google Scholar] [CrossRef]
- Dooley, K.A.; Conover, D.M.; Glinsman, L.D.; Delaney, J.K. Complementary Standoff Chemical Imaging to Map and Identify Artist Materials in an Early Italian Renaissance Panel Painting. Angew. Chem. 2014, 126, 13995–13999. [Google Scholar] [CrossRef]
- Greenberger, R.N.; Mustard, J.F.; Ehlmann, B.L.; Blaney, D.L.; Cloutis, E.A.; Wilson, J.H.; Green, R.O.; Fraeman, A.A. Imaging spectroscopy of geological samples and outcrops: Novel insights from microns to meters. GSA Today 2015, 25, 4–10. [Google Scholar] [CrossRef] [Green Version]
- Pouli, P.; Zafiropulos, V.; Balas, C.; Doganis, Y.; Galanos, A. Laser cleaning of inorganic encrustation on excavated objects: Evaluation of the cleaning result by means of multi-spectral imaging. J. Cult. Herit. 2003, 4, 338–342. [Google Scholar] [CrossRef]
- Pozo-Antonio, J.; Fiorucci, M.; Ramil, A.; López, A.J.; Rivas, T. Evaluation of the effectiveness of laser crust removal on granites by means of hyperspectral imaging techniques. Appl. Surf. Sci. 2015, 347, 832–838. [Google Scholar] [CrossRef]
- Senesi, G.S.; Nicolodelli, G.; Milori, D.M.B.P.; De Pascale, O. Depth profile investigations of surface modifications of limestone artifacts by laser-induced breakdown spectroscopy. Environ. Earth Sci. 2017, 76, 565. [Google Scholar] [CrossRef]
- Cucci, C.; Casini, A.; Picollo, M.; Stefani, L. Extending hyperspectral imaging from Vis to NIR spectral regions: A novel scanner for the in-depth analysis of polychrome surfaces. In Proceedings of the Optics for Arts, Architecture, and Archaeology IV, Munich, Germany, 15–16 May 2013; The International Society for Optical Engineering SPIE: Washington, DC, USA, 2013; Volume 8790, p. 879009. [Google Scholar] [CrossRef]
- Rodarmel, C.; Shan, J. Principal component analysis for hyperspectral image classification. Surv. Land Inf. Sci. 2002, 62, 115–122. [Google Scholar]
- Kruse, F.; Lefkoff, A.; Boardman, J.; Heidebrecht, K.; Shapiro, A.; Barloon, P.; Goetz, A. The spectral image processing system (SIPS)—Interactive visualization and analysis of imaging spectrometer data. Remote Sens. Environ. 1993, 44, 145–163. [Google Scholar] [CrossRef]
- Harris Geospatial Solutions, Spectral Angle Mapper. Available online: https://www.harrisgeospatial.com/docs/SpectralAngleMapper.html (accessed on 20 November 2020).
- Clark, R.N.; King, T.V.V.; Klejwa, M.; Swayze, G.A.; Vergo, N. High spectral resolution reflectance spectroscopy of minerals. J. Geophys. Res. Space Phys. 1990, 95, 12653–12680. [Google Scholar] [CrossRef] [Green Version]
- Senesi, G.S.; Campanella, B.; Grifoni, E.; Legnaioli, S.; Lorenzetti, G.; Pagnotta, S.; Poggialini, F.; Palleschi, V.; De Pascale, O. Elemental and mineralogical imaging of a weathered limestone rock by double-pulse micro-Laser-Induced Breakdown Spectroscopy. Spectrochim. Acta Part B At. Spectrosc. 2018, 143, 91–97. [Google Scholar] [CrossRef]


Publisher’s Note: MDPI stays neutral with regard to jurisdictional claims in published maps and institutional affiliations. |
© 2020 by the authors. Licensee MDPI, Basel, Switzerland. This article is an open access article distributed under the terms and conditions of the Creative Commons Attribution (CC BY) license (http://creativecommons.org/licenses/by/4.0/).
Share and Cite
Cucci, C.; De Pascale, O.; Senesi, G.S. Assessing Laser Cleaning of a Limestone Monument by Fiber Optics Reflectance Spectroscopy (FORS) and Visible and Near-Infrared (VNIR) Hyperspectral Imaging (HSI). Minerals 2020, 10, 1052. https://doi.org/10.3390/min10121052
Cucci C, De Pascale O, Senesi GS. Assessing Laser Cleaning of a Limestone Monument by Fiber Optics Reflectance Spectroscopy (FORS) and Visible and Near-Infrared (VNIR) Hyperspectral Imaging (HSI). Minerals. 2020; 10(12):1052. https://doi.org/10.3390/min10121052
Chicago/Turabian StyleCucci, Costanza, Olga De Pascale, and Giorgio S. Senesi. 2020. "Assessing Laser Cleaning of a Limestone Monument by Fiber Optics Reflectance Spectroscopy (FORS) and Visible and Near-Infrared (VNIR) Hyperspectral Imaging (HSI)" Minerals 10, no. 12: 1052. https://doi.org/10.3390/min10121052