Article

Properties of Impact-Related Pseudotachylite and Associated Shocked Zircon and Monazite in the Upper Levels of a Large Impact Basin: a Case Study From the Vredefort Impact Structure

by
Elizaveta Kovaleva
1,* and
Roger Dixon
2,†
1
Department of Geology, University of the Free State, Bloemfontein 9300, South Africa
2
Department of Geology, University of Pretoria, Pretoria 0028, South Africa
*
Author to whom correspondence should be addressed.
Author has passed away.
Minerals 2020, 10(12), 1053; https://doi.org/10.3390/min10121053
Submission received: 5 October 2020 / Revised: 16 November 2020 / Accepted: 18 November 2020 / Published: 25 November 2020

Abstract

:
The Vredefort impact structure in South Africa is deeply eroded to its lowermost levels. However, granophyre (impact melt) dykes in such structures preserve clasts of supracrustal rocks, transported down from the uppermost levels of the initial structure. Studying these clasts is the only way to understand the properties of already eroded impactites. One such lithic clast from the Vredefort impact structure contains a thin pseudotachylite vein and is shown to be derived from the near-surface environment of the impact crater. Traditionally, impact pseudotachylites are referred to as in situ melt rocks with the same chemical and isotopic composition as their host rocks. The composition of the sampled pseudotachylite vein is not identical to its host rock, as shown by the micro-X-ray fluorescence (µXRF) and energy-dispersive X-ray (EDX) spectrometry mapping. Mapping shows that the melt transfer and material mixing within pseudotachylites may have commonly occurred at the upper levels of the structure. The vein is spatially related to shocked zircon and monazite crystals in the sample. Granular zircons with small granules are concentrated within and around the vein (not farther than 6–7 mm from the vein). Zircons with planar fractures and shock microtwins occur farther from the vein (6–12 mm). Zircons with microtwins (65°/{112}) are also found inside the vein, and twinned monazite (180°/[101]) is found very close to the vein. These spatial relationships point to elevated shock pressure and shear stress, concentrated along the vein’s plane during impact.

1. Introduction

The Vredefort impact structure is amongst the largest impact basins known on Earth. Having been deeply eroded during 2020 My of its history, it allows investigation of the impactites at the lowest levels of this large impact structure [1,2,3,4,5]. For example, impact-related pseudotachylites, formed at 8–10 km below the original level of the Vredefort structure, have been investigated in detail; their geochemical, isotopic, and (micro)structural properties have been studied continuously for over a century [4,6,7,8,9,10,11,12]. However, the properties of the impactites formed in Vredefort at the higher structural levels, closer to the original surface, are practically unknown, with the upper portions of the structure being eroded [13,14]. Two billion years of erosion made such studies difficult, but not completely impossible.
The Vredefort impact structure contains remnants of Vredefort granophyre dykes, considered to have been derived from above, from the Vredefort impact melt sheet [1,3,15,16,17,18]. Impact melt was injected into the fractures, penetrating to 5.5–7.5 km below the crater floor [5]. On its way downwards, the granophyre melt incorporated various lithic clasts of the country rock, many preserved within the granophyre dykes as xenoliths. Therefore, the Vredefort granophyre dykes are a library, which provides an opportunity to study otherwise eroded impactites. By investigating these lithic clasts, we can learn about the impact processes occurring closer to the impacted surface [19]. French and Nielsen [18] emphasized the importance of studying shock features in lithic clasts enclosed in impact melts. According to these authors, detailed petrographic studies of such clasts may point to the superheated nature of granophyre, providing “evidence for the impact melt origin of the granophyre, and would enable some understanding of the mechanism of emplacement of the granophyre itself” [18], (p. 135).
Kovaleva et al. [20] described one such clast, enclosed in granophyre and containing a thin pseudotachylite (PT) vein. At that time, however, doubts about the origin of the PT vein existed. Considering the long tectonic history of the area, this PT vein could be interpreted to have a pre-impact, tectonic origin, or an impact-related origin [20,21]. The small sample size and the high degree of alteration make it difficult to perform isotopic dating on the PT vein in question. Later, Kovaleva et al. [19] found shocked granular zircons, which are spatially associated with the PT vein, and suggested that this discovery is an indirect proof for the impact origin of the PT vein. Based on zircon deformation microstructures, the authors have further suggested that the clast was derived from the uppermost levels of the impact structure.
In the present study, we provide direct evidence of the impact origin of the reported PT vein, such as crosscutting relationships. We describe the properties of this unique PT vein in more detail using optical microscopy, semi-quantitative micro-X-ray fluorescence (µ-XRF) and energy-dispersive X-ray (EDX) spectroscopy mapping, and electron backscatter diffraction (EBSD) mapping of deformed accessory minerals (zircon and monazite). This study enables us to learn more about the impact-related pseudotachylites formed at the upper levels of the impact structure and the associated processes. The study is significant for planetary science, specifically for investigating the samples from other planetary bodies with melt veins and/or shocked accessory minerals that can be better interpreted based on our results. The article also contributes to the mineralogy and crystallography of accessory minerals, demonstrating a variety of shock deformation modes of the zircon and monazite crystals.

2. The Vredefort Impact Structure: Geological Setting

The Vredefort impact structure (Figure 1A) is located on the stable Kaapvaal craton in South Africa and is ~100 km in diameter along its N-S axis [22]. Its original diameter before erosion is estimated at between 160–180 km [23] and 250–300 km [2,14]. Isotopic dating was done on zircon, crystallized from impact melts, and yielded 2020 ± 3 Ma, which is presently accepted as the most accurate age [24]. Since the impact event, the impact structure has been eroded to a depth of 8–10 km [13,14].
The central uplift of the structure consists of Archean basement granites in the core, with the overturned supracrustal sequence in the collar exposed in the NW. The collar consists of the Dominion Group and the Witwatersrand, Ventersdorp, and Transvaal Supergroups (Figure 1A). The SE part of the structure is covered by the Karoo sedimentary and volcanic rocks [22].
Within the granitic core and along the core-collar boundary, nine granophyre dykes are exposed [3,7,15,22]. These dykes have a dacitic composition and contain numerous lithic clasts from the supracrustal sequence [1,3,18]. The dykes are believed to have been an impact melt, which was injected downwards [1,15,16,17,18]. Recently, the core granophyre dyke on the farm Daskop was shown to have a very limited downwards extent (~3 m; [5]), providing additional evidence that the melt source was located above the present erosional level.
The sample discussed in this study was collected from the Daskop granophyre dyke (26°56’51.66’’ S 27°22’27.06” E). It is a small meta-granite clast with a sharply crosscutting vein (Figure 1B). Preliminary petrological and geochemical analyses of this clast were presented in [20]. It was shown geochemically and petrographically that the vein has a granitic affinity, rather than being an offshoot of a granophyre within the inclusion [20].

3. Methods

3.1. Optical and Scanning Electron Microscopy (SEM) Images

Four polished thin sections were prepared from the sampled clast (Figure 1C) and were investigated by optical microscopy and scanning electron microscopy (SEM) at the Department of Geology, University of the Free State, South Africa. Optical transmitted light images were acquired using an Olympus BX51 optical microscope equipped with an Olympus 162 U-TVO.63XC camera (Olympus Corporation, Tokyo, Japan). Backscattered electron (BSE) images and qualitative energy-dispersive X-ray (EDX) spectrometry maps were obtained using a JEOL JSM-6610 SEM (JEOL Ltd., Tokyo, Japan) equipped with a LaB6 electron gun and a Thermo Scientific Ultradry EDX detector (Thermo Fisher Scientific, Waltham, MA, USA). The EDX detector was used to identify mineral phases and to collect semi-quantitative chemical maps of the areas of interest. Zircon and monazite crystals were located using BSE imaging. The analytical conditions for collecting the BSE images and chemical maps were 15 kV accelerating voltage, 8 nA probe current, and 10 mm working distance.

3.2. Energy-Dispersive Micro-X-Ray Fluorescence Spectrometry (ED-µXRF)

One of the thin sections was mapped semi-quantitatively for distribution of elements using a Bruker M4 Tornado, an energy-dispersive micro-X-ray fluorescence spectrometer (ED-μXRF; Bruker Corporation, Billerica, MA, USA) at the Stoneman Laboratory, University of Pretoria, Pretoria, South Africa. The instrument is configured with a Rhodium tube, which was operated at 50 kV, 500 μA, and 30 W. The polychromatic beam (0–50 keV) is focused using a polycapillary lens to a spot size of ca. 25 μm, with the incident beam and take-off angles at 51°. The instrument is equipped with two silicon drift detectors with an energy resolution of 145 eV for Mn Kα, which face each other at a 180° angle and 90° to the tube with respect to the sample surface. The sample chamber was evacuated to <20 Mbar to enable light elements such as Na to be measured. A step size of 25 µm and an integration time per pixel of 50 ms was used for a larger area, with the step size reduced to 5 µm for a smaller area. The distribution of the following 20 elements was qualitatively mapped: Si, Ti, Al, Fe, Ca, Mg, Mn, Na, K, Ba, Co, Cr, Cu, Ni, P, Rb, S, Sr, V, and Zn.

3.3. Electron Backscatter Diffraction (EBSD) Analyses

The thin sections were chemo-mechanically polished and carbon-coated with a thin carbon layer (5–10 nm). Deformation microstructures in zircon were analyzed in situ with forescatter electron (FSE) and electron backscatter diffraction (EBSD) in a field emission gun scanning electron microscope (FEG-SEM). These analyses were performed at the Laboratory for scanning electron microscopy and focused ion beam applications, Faculty of Earth Sciences, Geography and Astronomy, University of Vienna, Austria. Orientation contrast images were produced using an FSE detector mounted on the EBSD-tube of an FEI Quanta 3D FEG-SEM (Field Electron and Ion Company, Hillsboro, OR, USA), which is equipped with a Schottky field emission electron source, an EDAX Pegasus Apex 4 system consisting of a Digiview IV EBSD camera, and an Apollo XV silicon drift detector for EDX analysis (AMETEK, Inc., Berwyn, PA, USA). Electron beam conditions for analyses were 15 kV accelerating voltage, 4 nA probe current using the analytic mode. Stage settings were at 70° tilt and 14 mm working distance. After potentially deformed crystals of zircon and monazite were identified based on BSE and orientation contrast images, EBSD crystallographic orientation mapping was applied to selected grains. An EBSD camera binning of 4 × 4 was used to index single frame data at 49 ms exposure time, reaching indexing rates of ca. 20 points per second. The Kikuchi pattern contrast was improved by applying both static and dynamic background subtraction and intensity histogram normalization. Hough transformation settings were 120 × 120 pixels binned pattern size and 1° Theta step size, while the Rho fraction was limited to the inner 88% of the Kikuchi pattern. A 9 × 9 convolution mask was applied to index 3–15 peaks with a minimum peak distance of 8 pixels in Hough space. The following zircon lattice parameters were used for reference: di-tetragonal, Laue group 4/mmm, a = b = 6.612 Å, c = 5.983 Å, ɑ = β = γ = 90° [26]. The following monazite parameters were used for a reference: monoclinic prismatic, Laue group 2/m, a = 6.79 Å, b = 7.02 Å, c = 6.467 Å, ɑ = γ = 90°, β = 103.38° [27]. Map data were collected in hexagonal grid mode using step sizes of 80 to 90 nm (specified for each map in figure captions). EDX intensities and EBSD data were collected simultaneously using the OIM v7.3 Data Collection software.
The EBSD data were re-indexed with the EDAX OIM v7.3 Analysis software. Data re-indexing was assisted by assigning data points to phases based on selected EDX intensity ranges in EDX energy regions of interest. Crystal orientation maps were cleaned using the Confidence Index Standardization (CIS) procedure, which unifies the confidence index of equally oriented points within a grain (presuming a minimum grain size of 3 pixels in more than one row and a tolerance angle of 5°). The Confidence Index (CI) represents the difference in the number of triangles (found between three bands each) between the first and second orientation solution, divided by the total number of identified triangles. No orientation data were changed during cleanup. The data were filtered for CI > 0.1 to exclude single, statistically poor data points, which do not belong to a “grain.” EBSD data were visualized with the EDAX OIM v7.3 Analysis software and the MTEX v5.1.1. toolbox for MATLAB [28].

4. Results

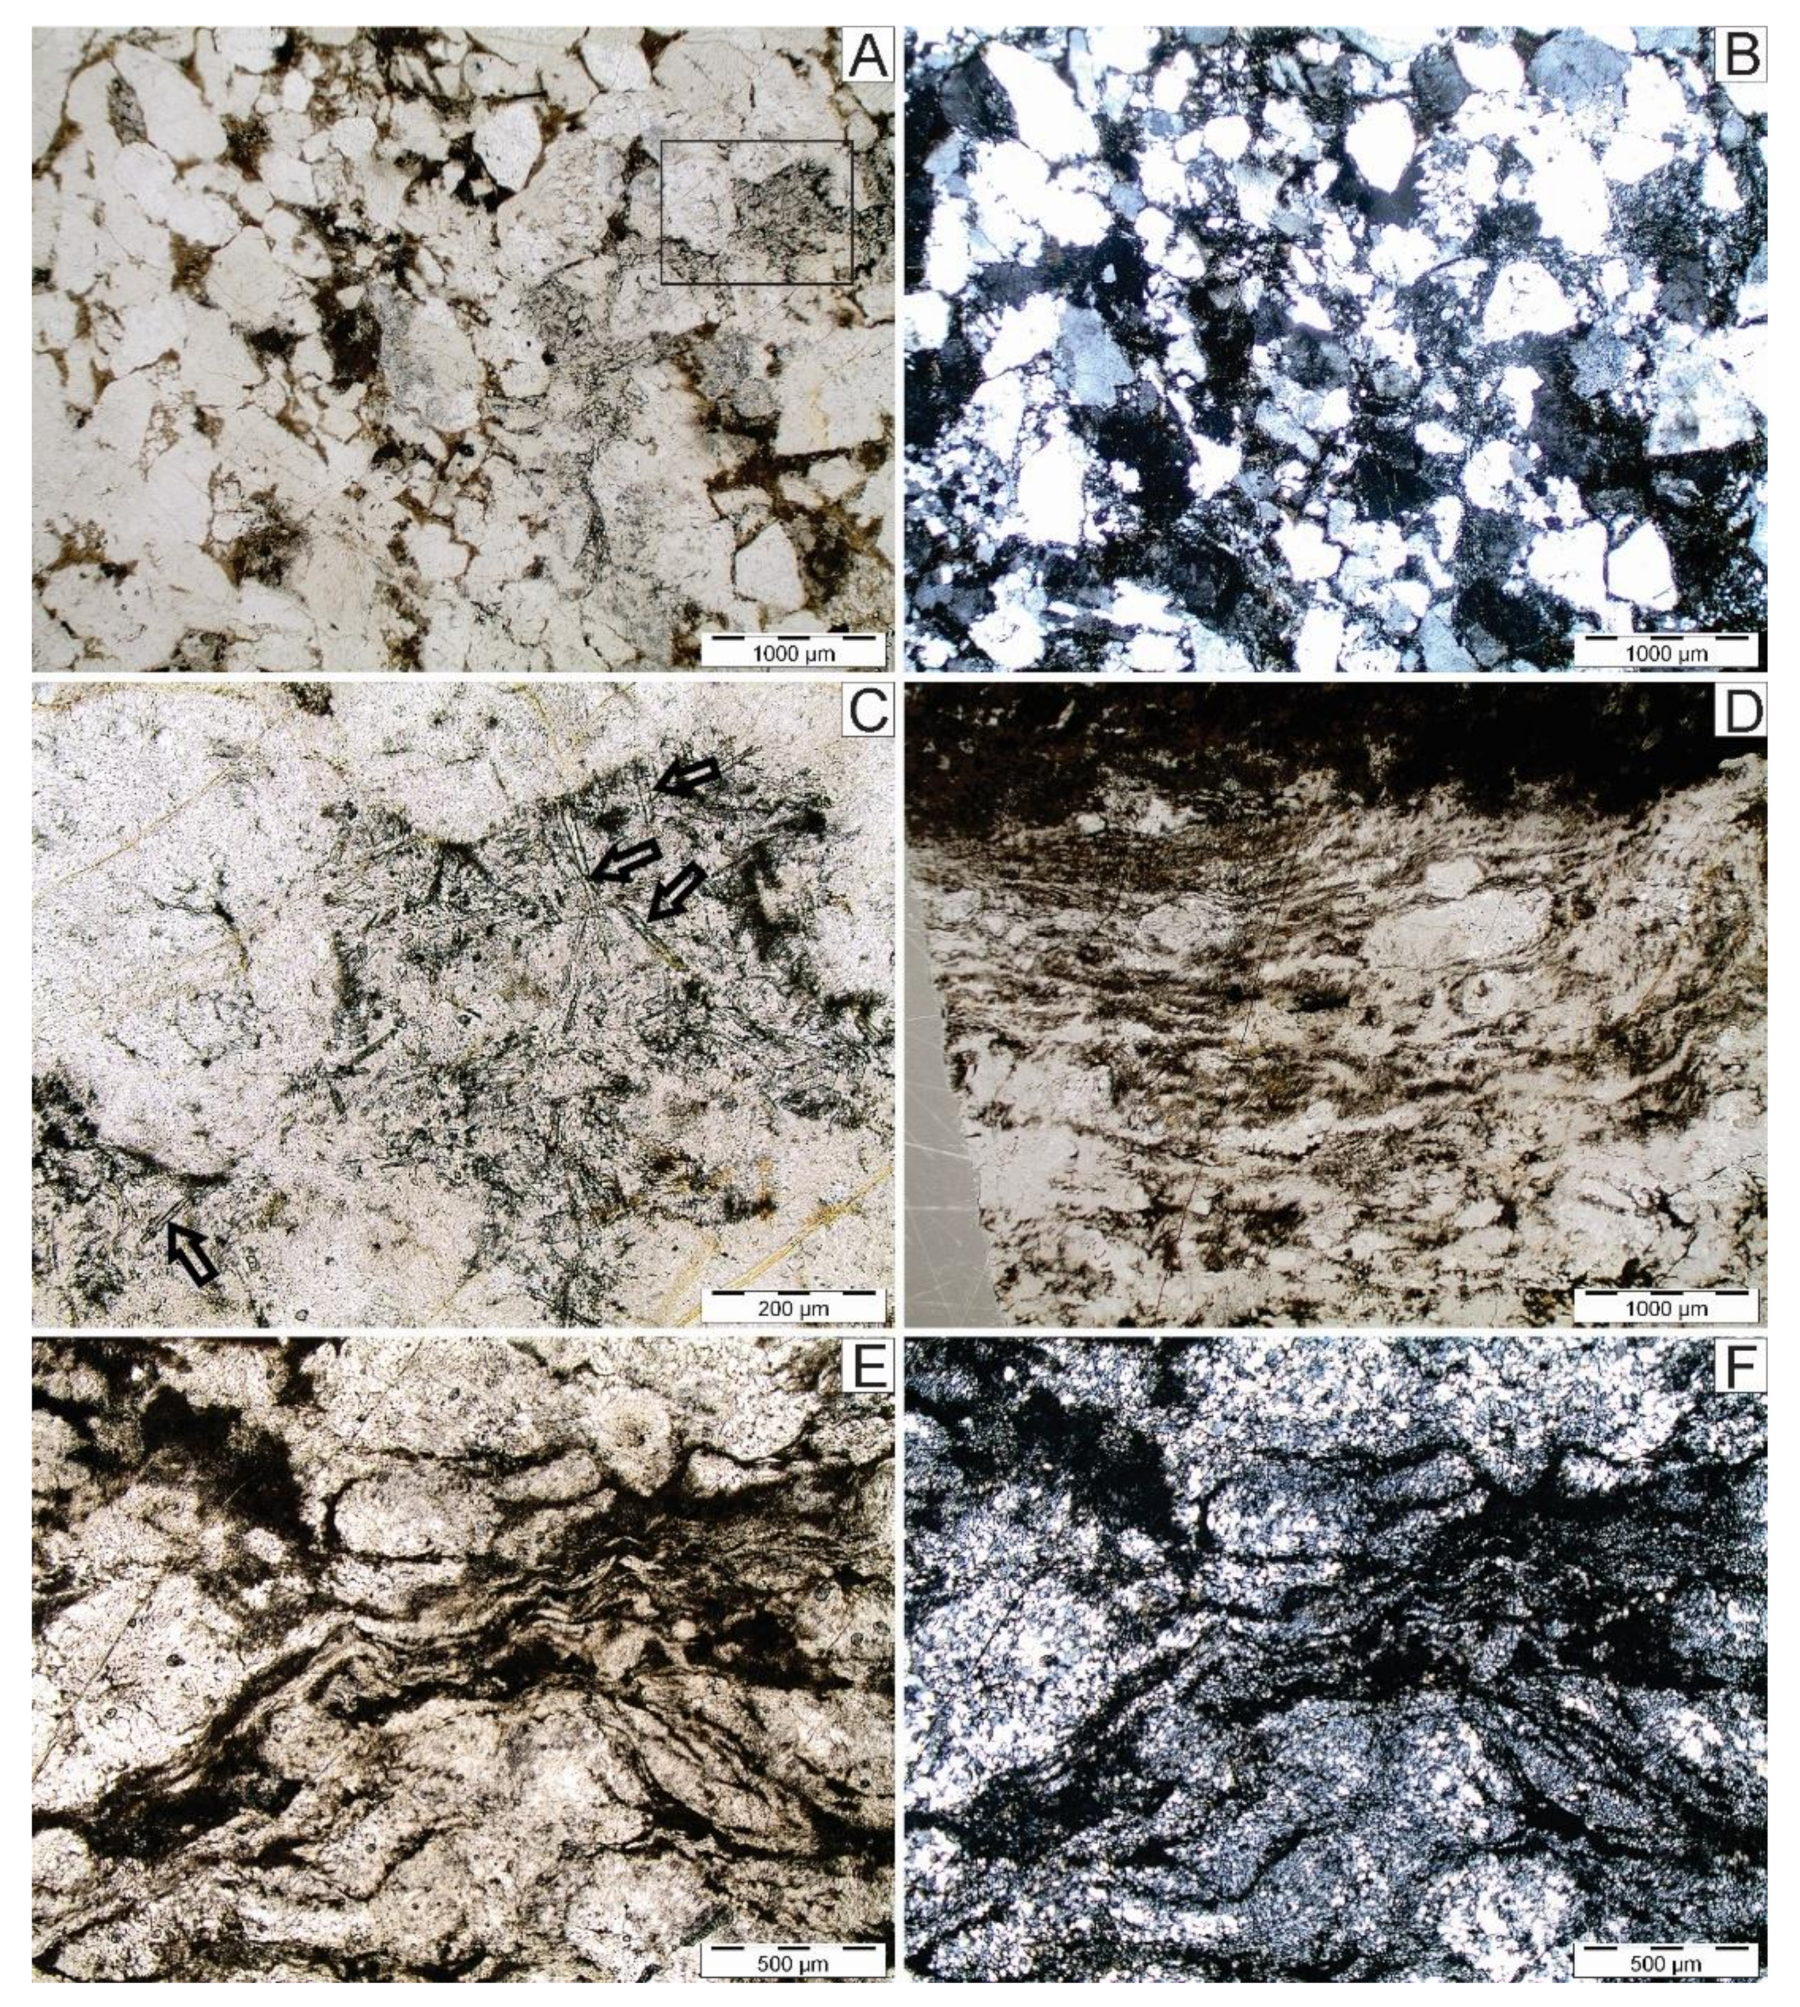
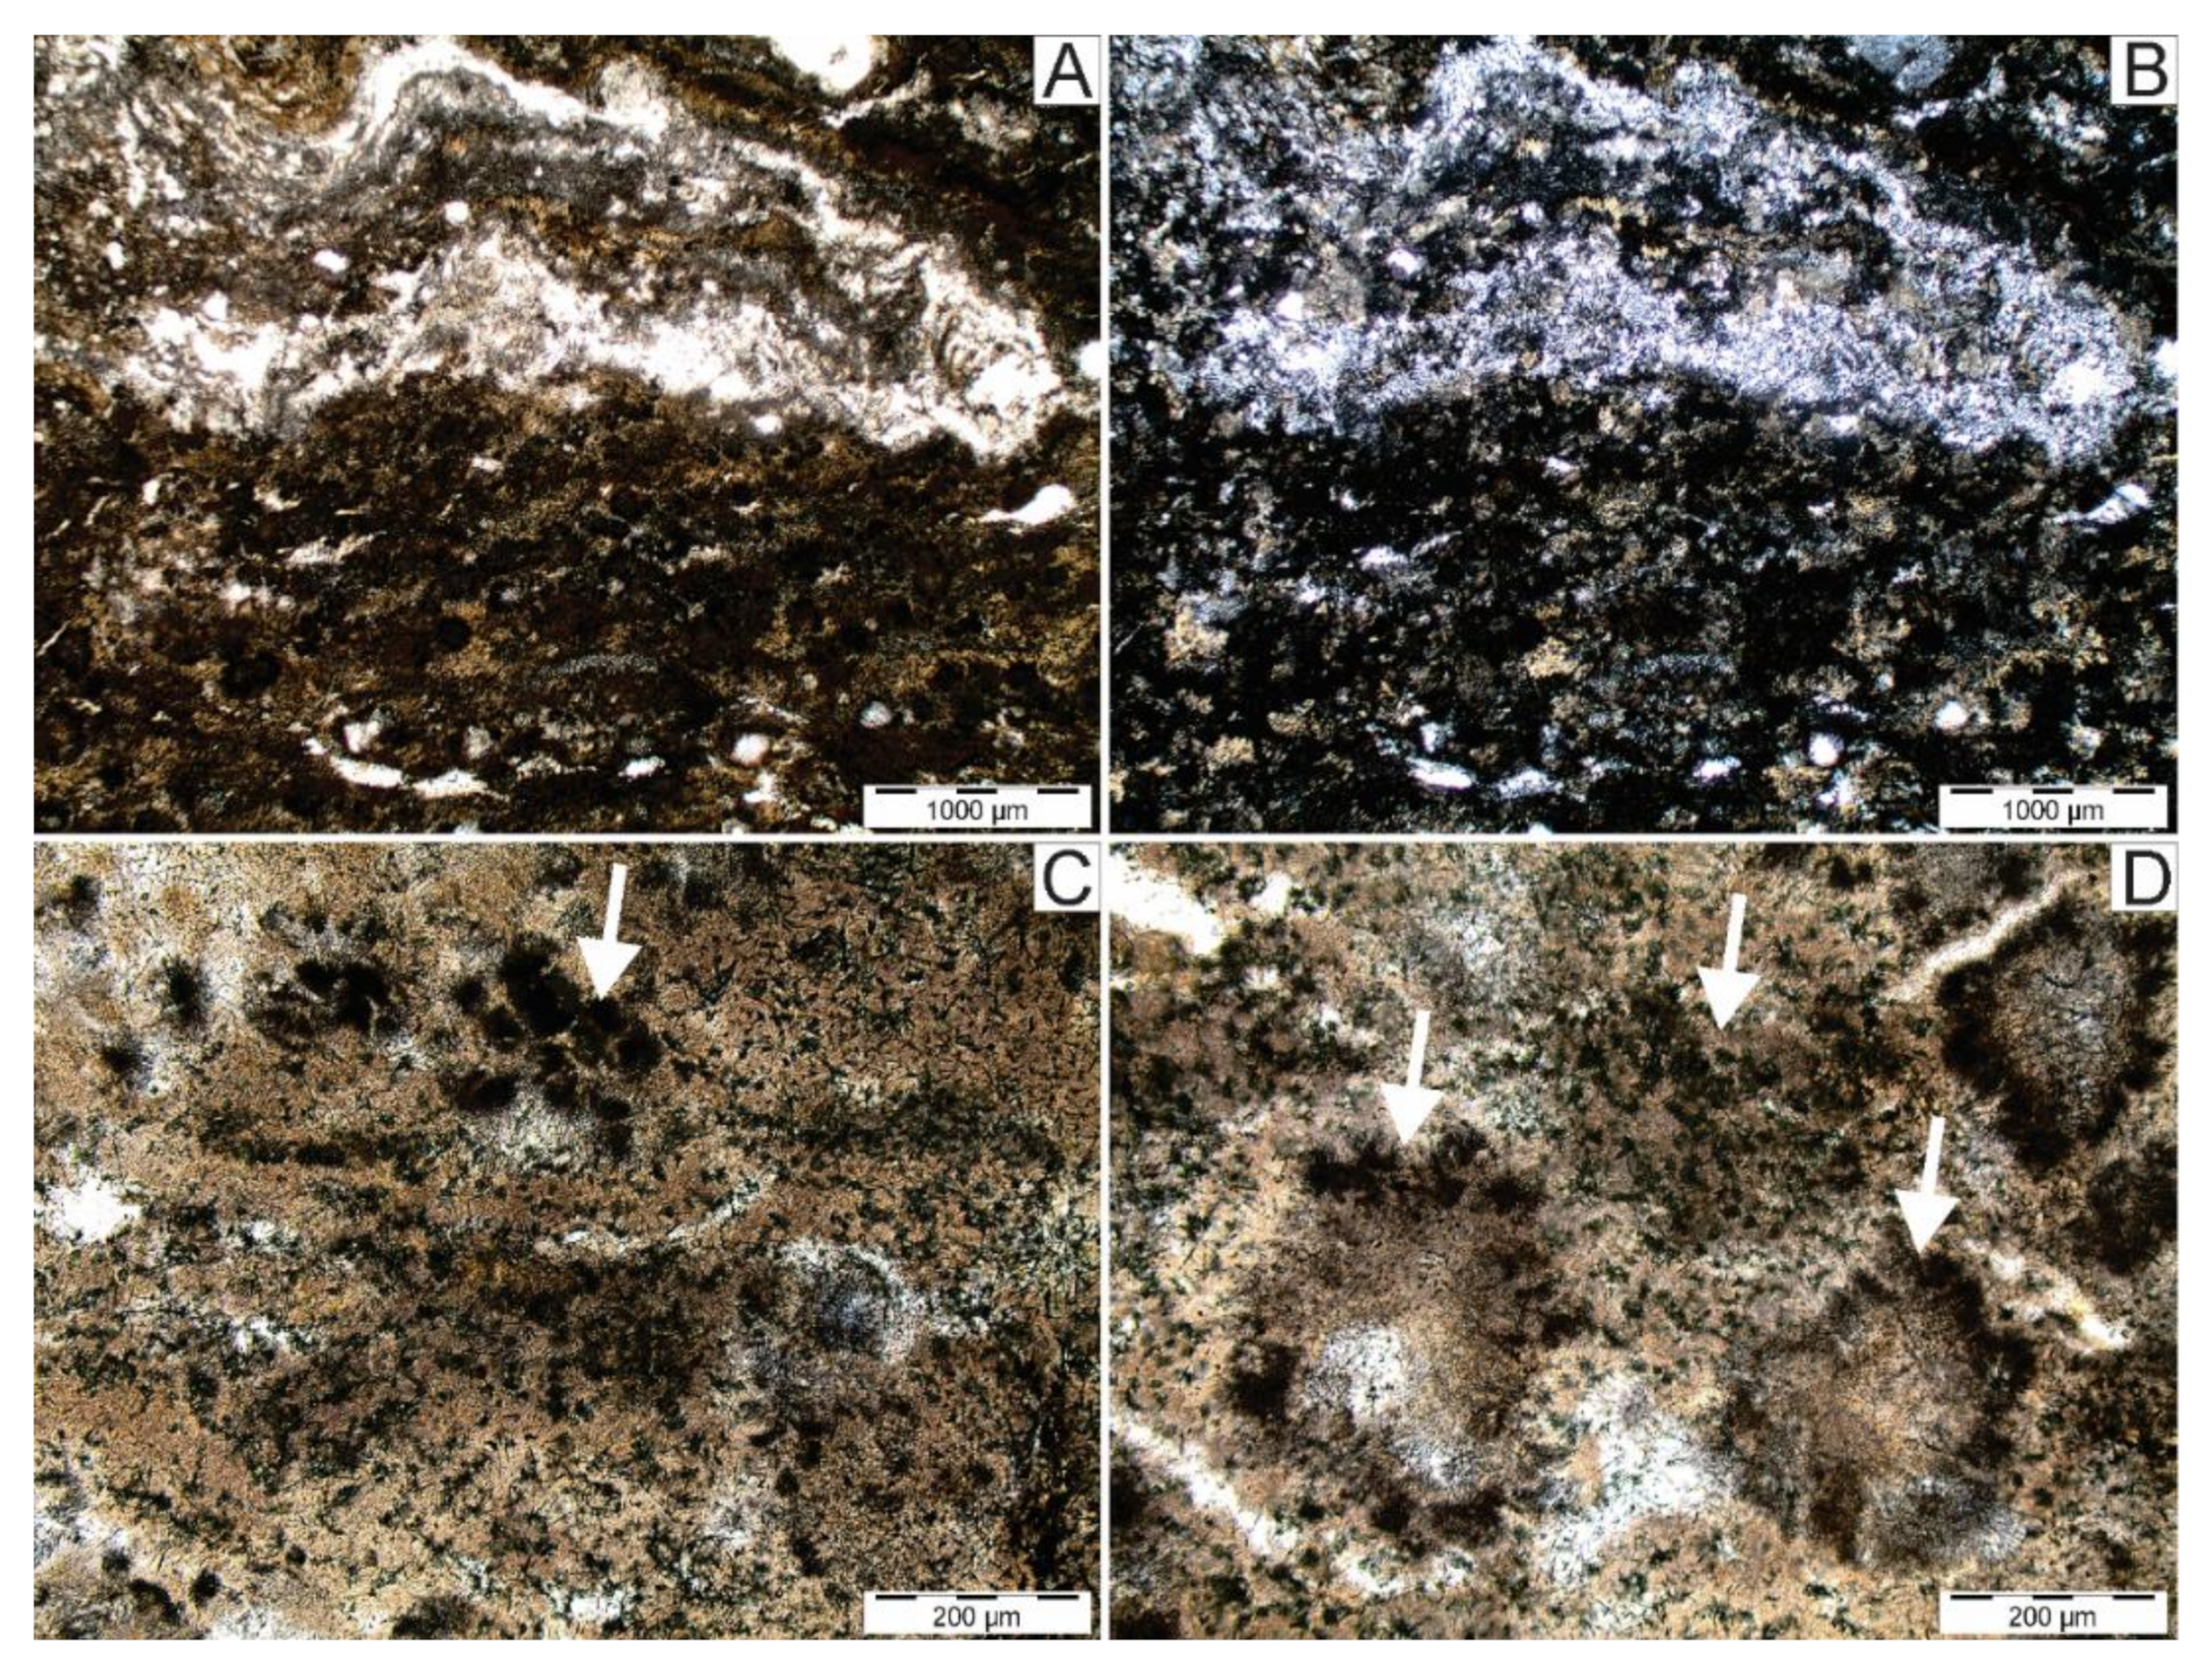
4.1. Optical Imaging
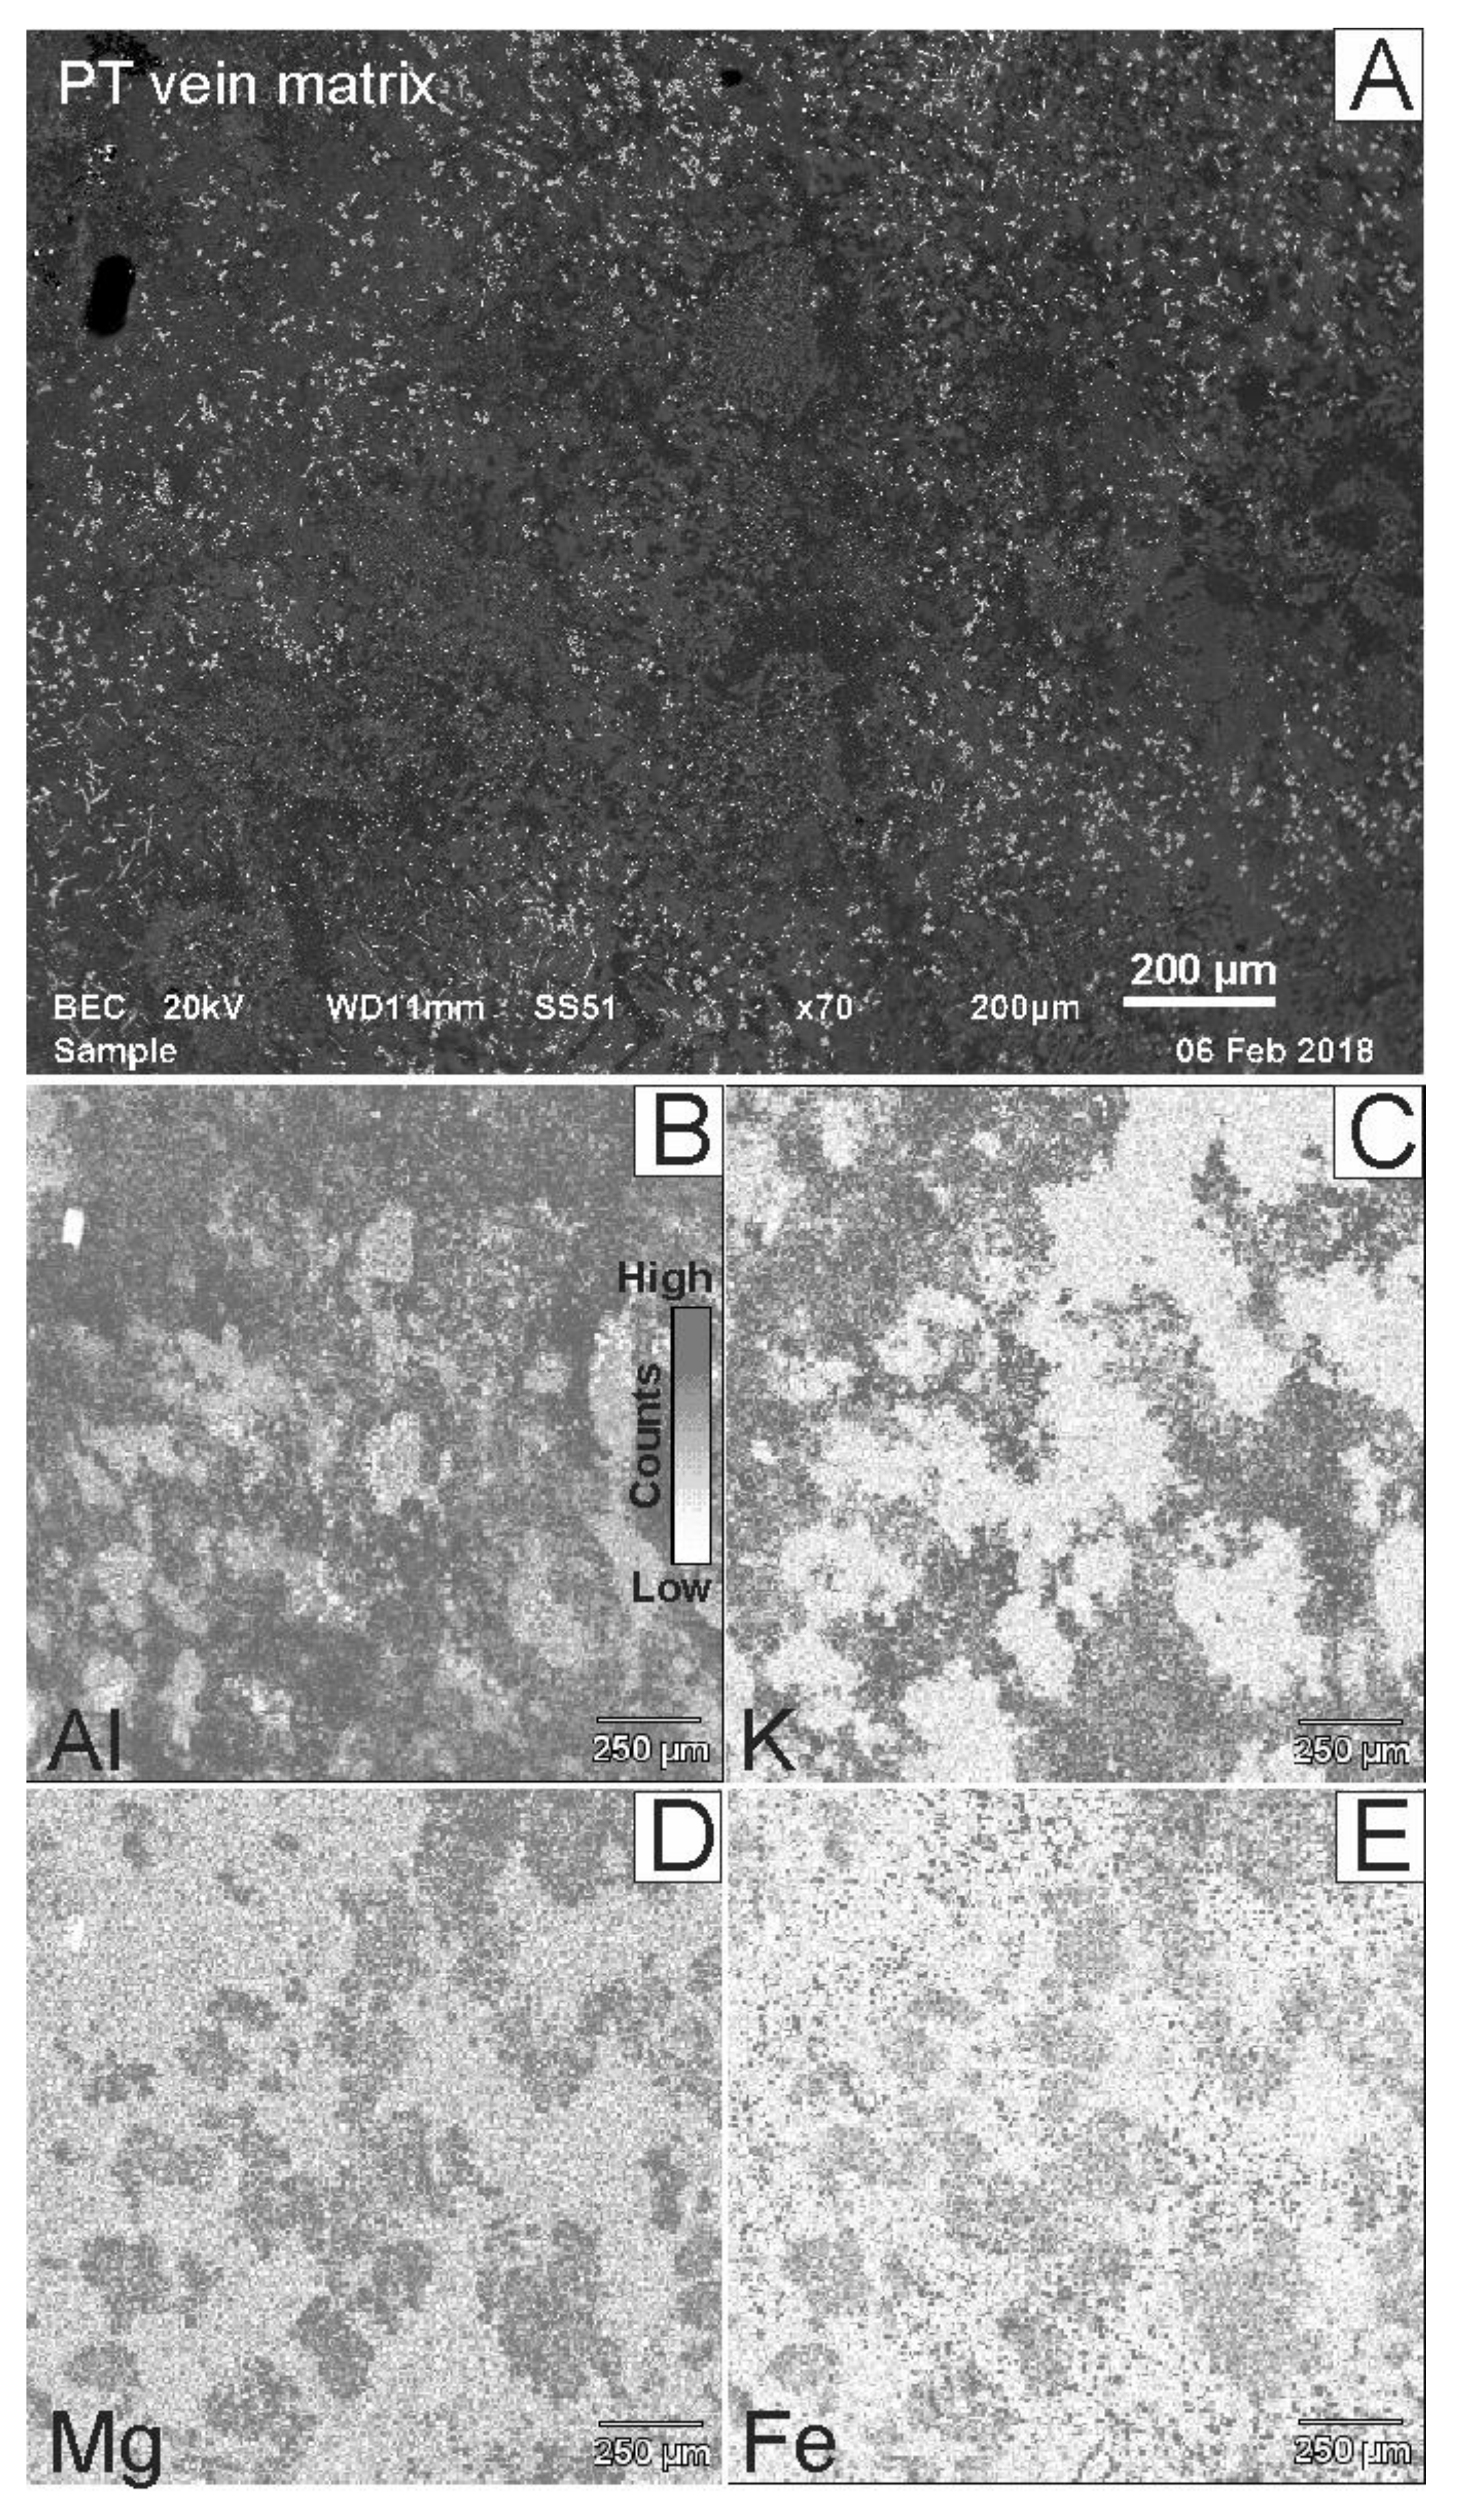
The clast is massive, and we consider it to be a meta-granite (Figure 1C), with irregularly shaped fractured quartz grains up to 600 µm in diameter, interstitial fine-grained quartz, and interstitial altered biotite (Figure 2A,B; see also [20]). The clast is shocked and thermally reworked within impact melt; therefore, there is also a possibility that it could be a fragment of meta-sedimentary rock with granitic composition, such as sandstone cemented by clay (dark pockets between the quartz grains). As the clast has granitic composition [20], for convenience, we will call it “granite” or “meta-granite” hereafter in the text.
Locally, close to the clast edges, granophyre pockets with characteristic orthopyroxene needles and fine-grained matrix are observed (Figure 2C). Closer to the PT vein, in the center of the clast, the texture is foliated and consists of fine-grained polycrystalline quartz interlayered with thin veinlets of optically dark material (Figure 2D–F). The PT vein is brown to black and contains fine-grained, plastically deformed, and partially molten quartz aggregates (Figure 1C and Figure 3A,B, upper part). The PT vein’s matrix is cryptocrystalline, inhomogeneous in color, with dark clustered spherules up to 50 µm in diameter (Figure 3C, arrow), and dark ring textures up to 300 µm in diameter (Figure 3D, arrows) surrounded by white to light-brown material. Opaque acicular crystals up to 50 µm long are ubiquitous in the vein’s matrix (Figure 3C,D).

4.2. µXRF Mapping

Chemical (µXRF) mapping of the clast’s edge, where the meta-granite is resorbed by granophyre, shows the chemical contrast between granophyre and clast (Figure 4). The granophyre is enriched in Ca, Fe, Mg, Mn, Cr, Ti, and S, of which Fe, Mg, Mn, and Cr are concentrated in the orthopyroxene needles (e.g., Figure 4E), and Ca and Ti are enriched in the matrix (Figure 4D,F). On the other hand, meta-granite contains more Si (Figure 4B), Zn, Sr, and Rb. The elements K, Al, Na, and V concentrations are roughly equal in both rock phases (e.g., Figure 4C). These chemical relationships reflect literature data for basement granite and granophyre (see overview in [20]), except Sr and Rb, of which Sr should be enriched in granophyre. In contrast, Rb should be approximately equal in both rock phases.
The µXRF mapping of the central part of the clast, where the PT vein is in contact with the foliated granite, shows that the PT vein differs in composition from the host meta-granite. The PT vein is relatively enriched in Fe, Mg, Mn, Ti, Al, Cr, and V (e.g., Figure 5A,B,D), and depleted in Si, Zn, Rb, and Sr (Figure 5A) with respect to the host granite. The PT vein is locally enriched in S and Cu, including patches in the surrounding foliated granite (“melt pockets,” Figure 5E). The elements K (Figure 5C) and Na are roughly the same in granite and the PT vein but are depleted in the foliated zone around the PT vein, whereas Ca was not detected (Figure 5F). The PT vein matrix is inhomogeneous and displays a patchy distribution of Fe, and Mg (Figure 5B,C), as well as Mn, K, and Na.

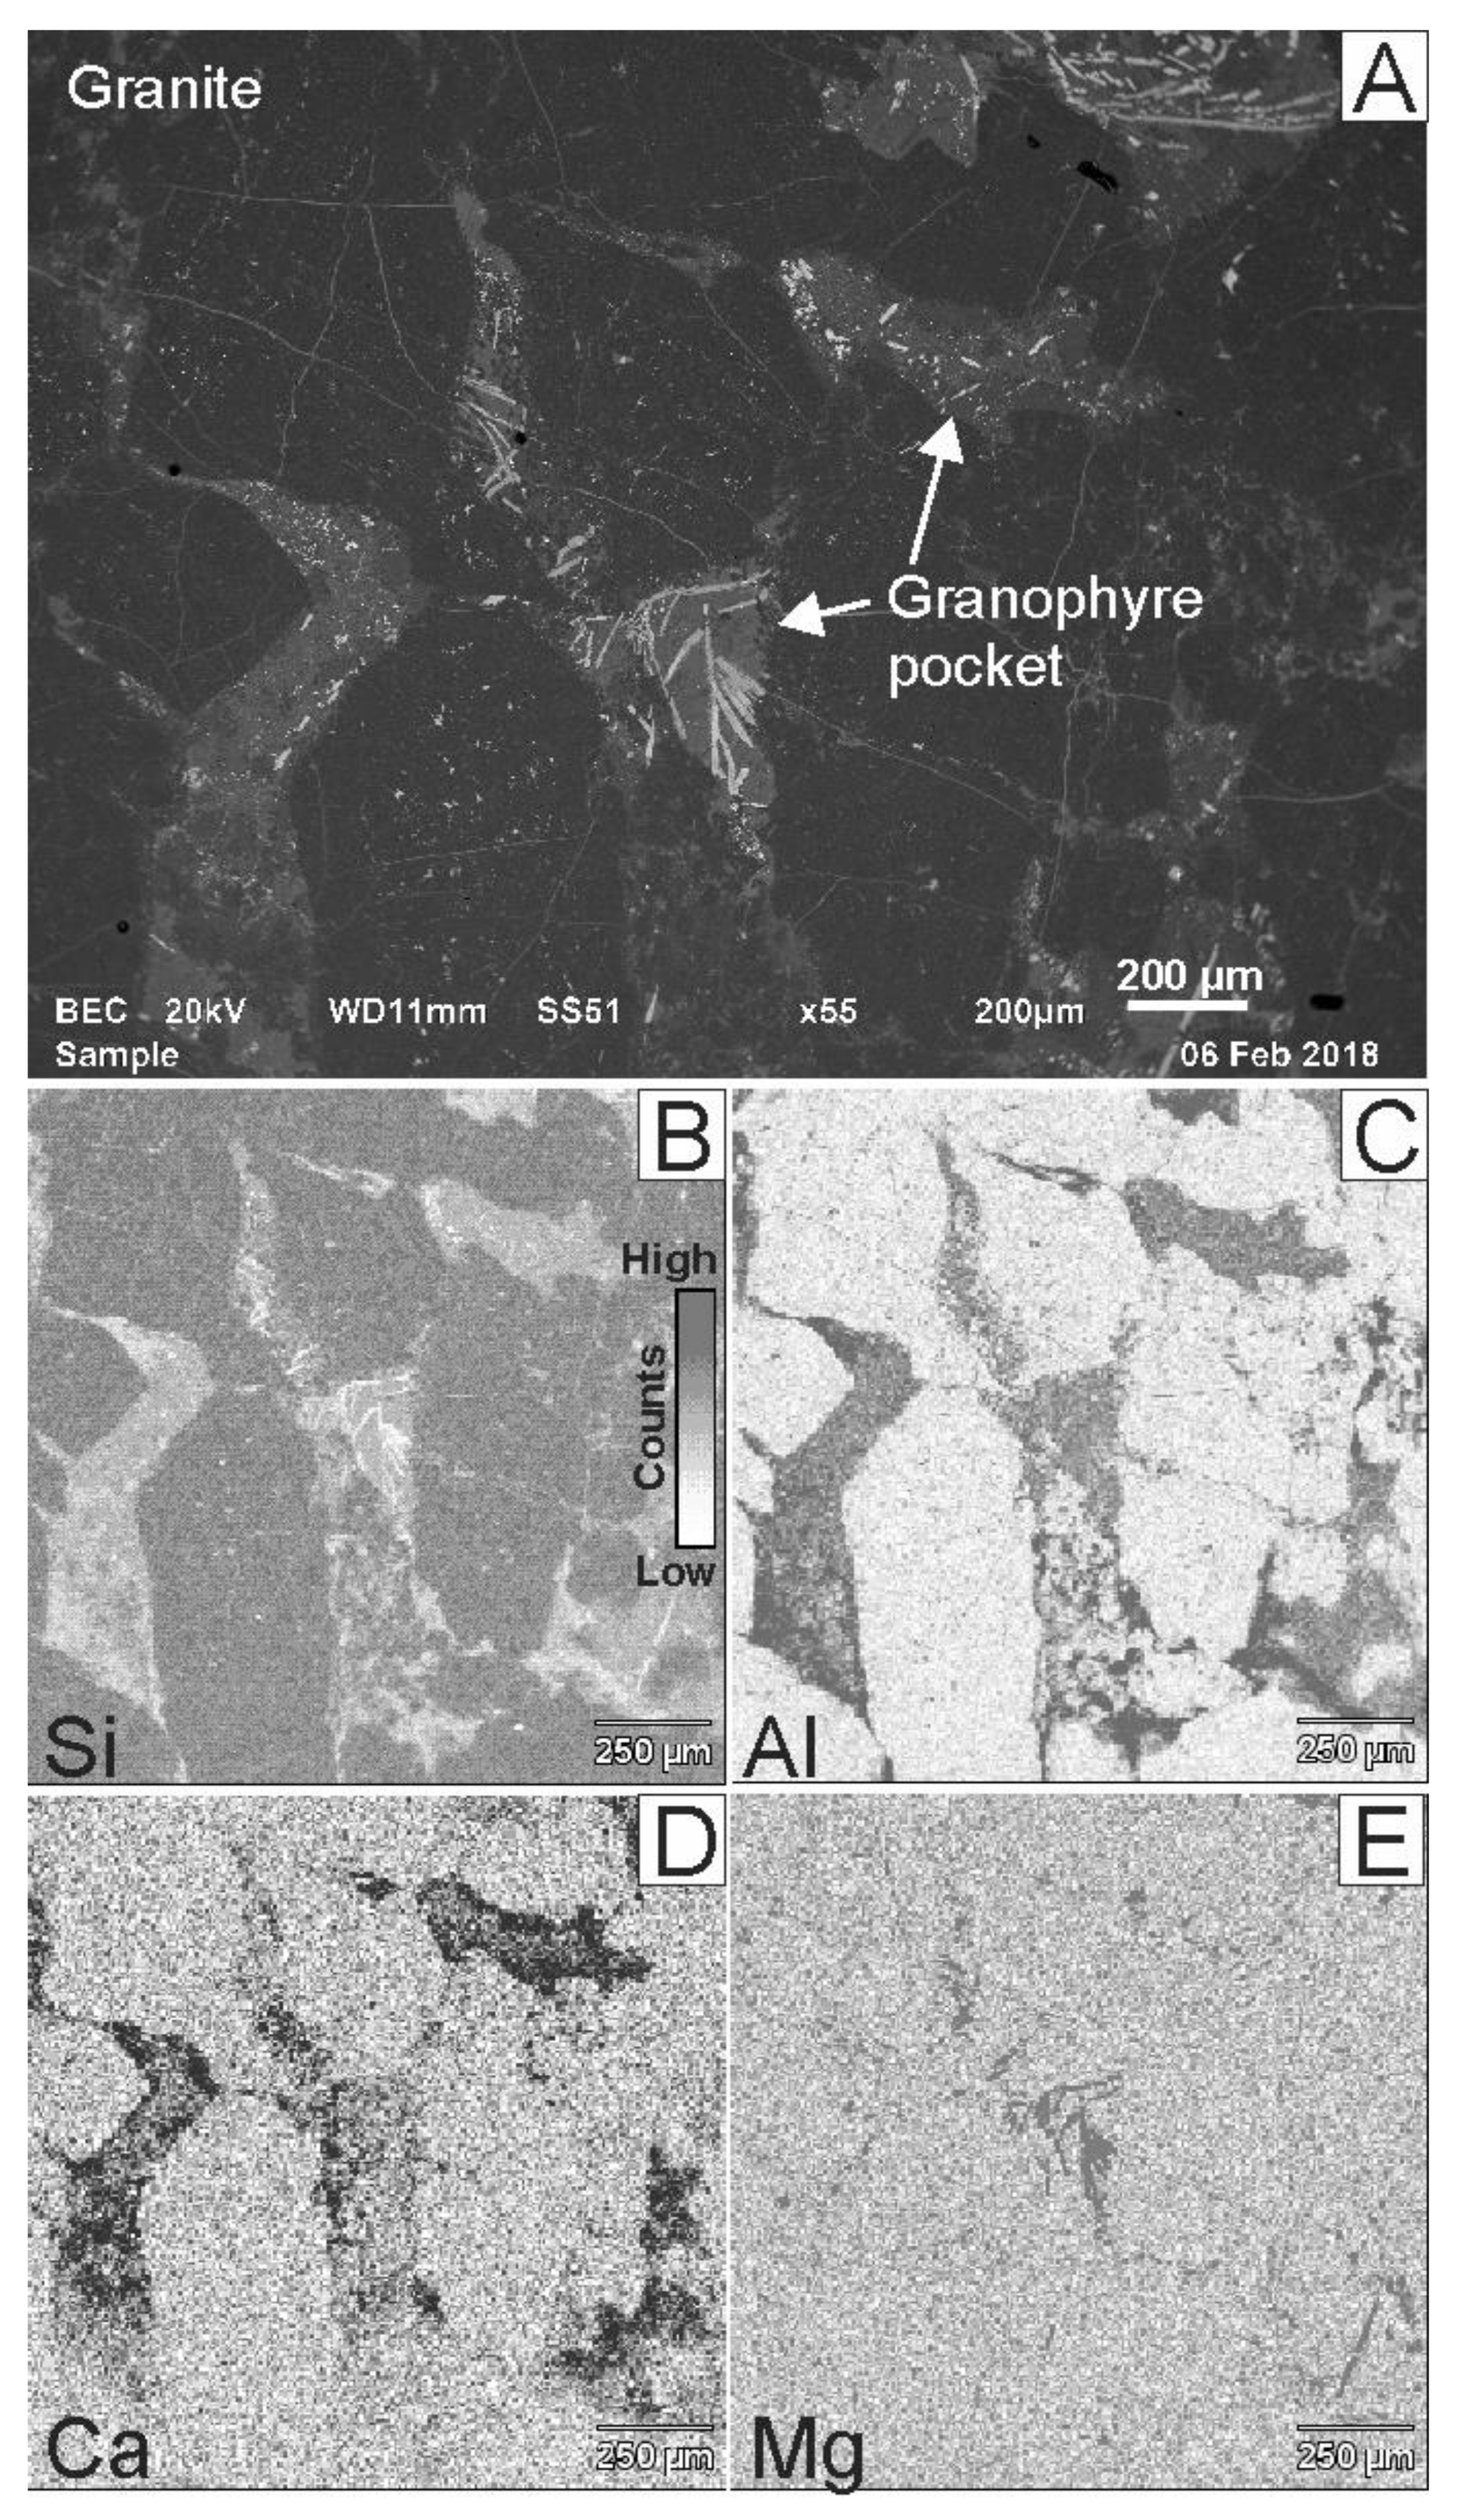
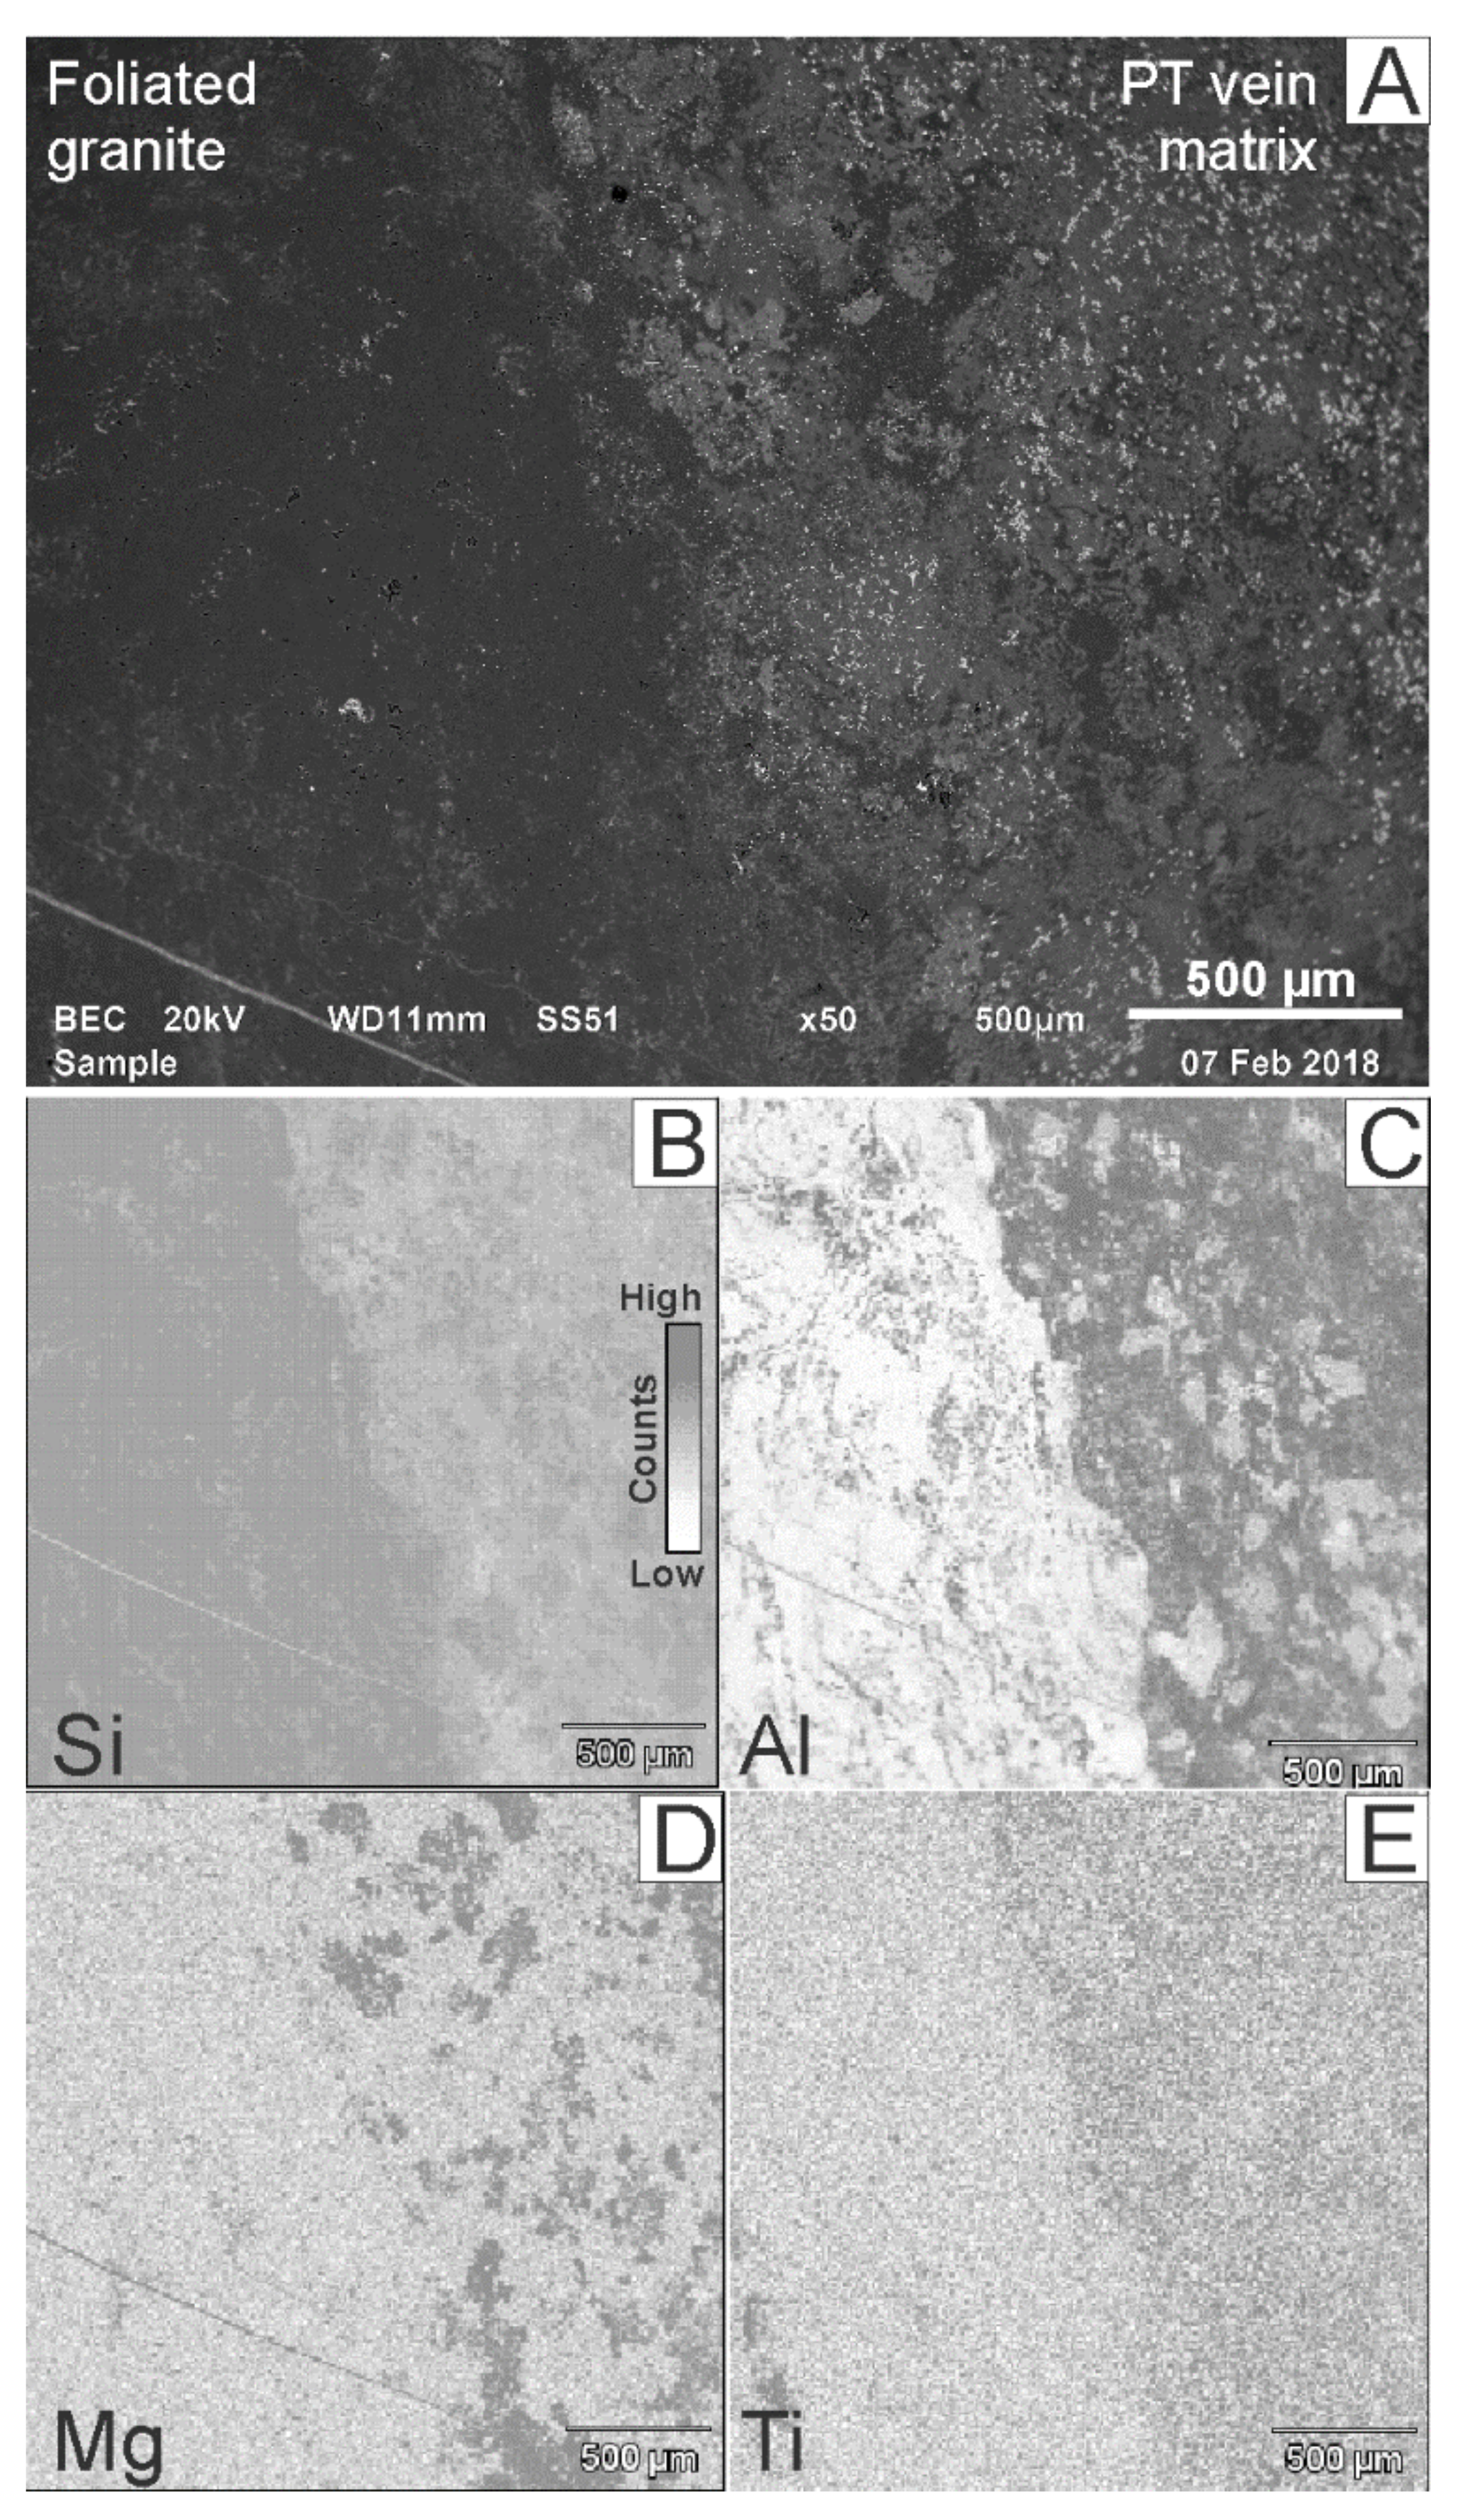
4.3. BSE Imaging and EDX Mapping

BSE images at the edge of the clast show fractured quartz grains with interstitial altered biotite, as well as pockets filled with granophyre (Figure 6A). According to the EDX mapping, granophyre is enriched in Al, Ca, Mg, Fe, and Ti, whereas granite is enriched in Si (Figure 6).
The PT vein in contact with foliated granite displays fine-grained BSE-bright skeletal phases (acicular crystals of ilmenite, isometric and elongated grains of sulphides, and poikilitic/skeletal spinel), which are surrounded by K-feldspar or quartz-rich matrix, with tabular crystals and needles of plagioclase (Figure 7A, Figure 8A, and Figure 9A). The PT vein’s matrix is depleted in Si with respect to the host foliated granite but enriched in Al, Mg, Fe, Ti, and Mn. Vein shows lobate contacts and chemically inhomogeneous matrix, where Al, Mg, Fe, K, and Na display a patchy distribution (Figure 7C,D and Figure 8B–E). K and Na are depleted in domains with Fe- and Mg-enrichment, and vice versa (Figure 8C–E), whereas the distribution of Al does not spatially correlate with other elements (Figure 7C and Figure 8B). Mg- and Fe-enriched domains are up to 300 µm in diameter, corresponding to the spherules/ring textures shown in Figure 3D.

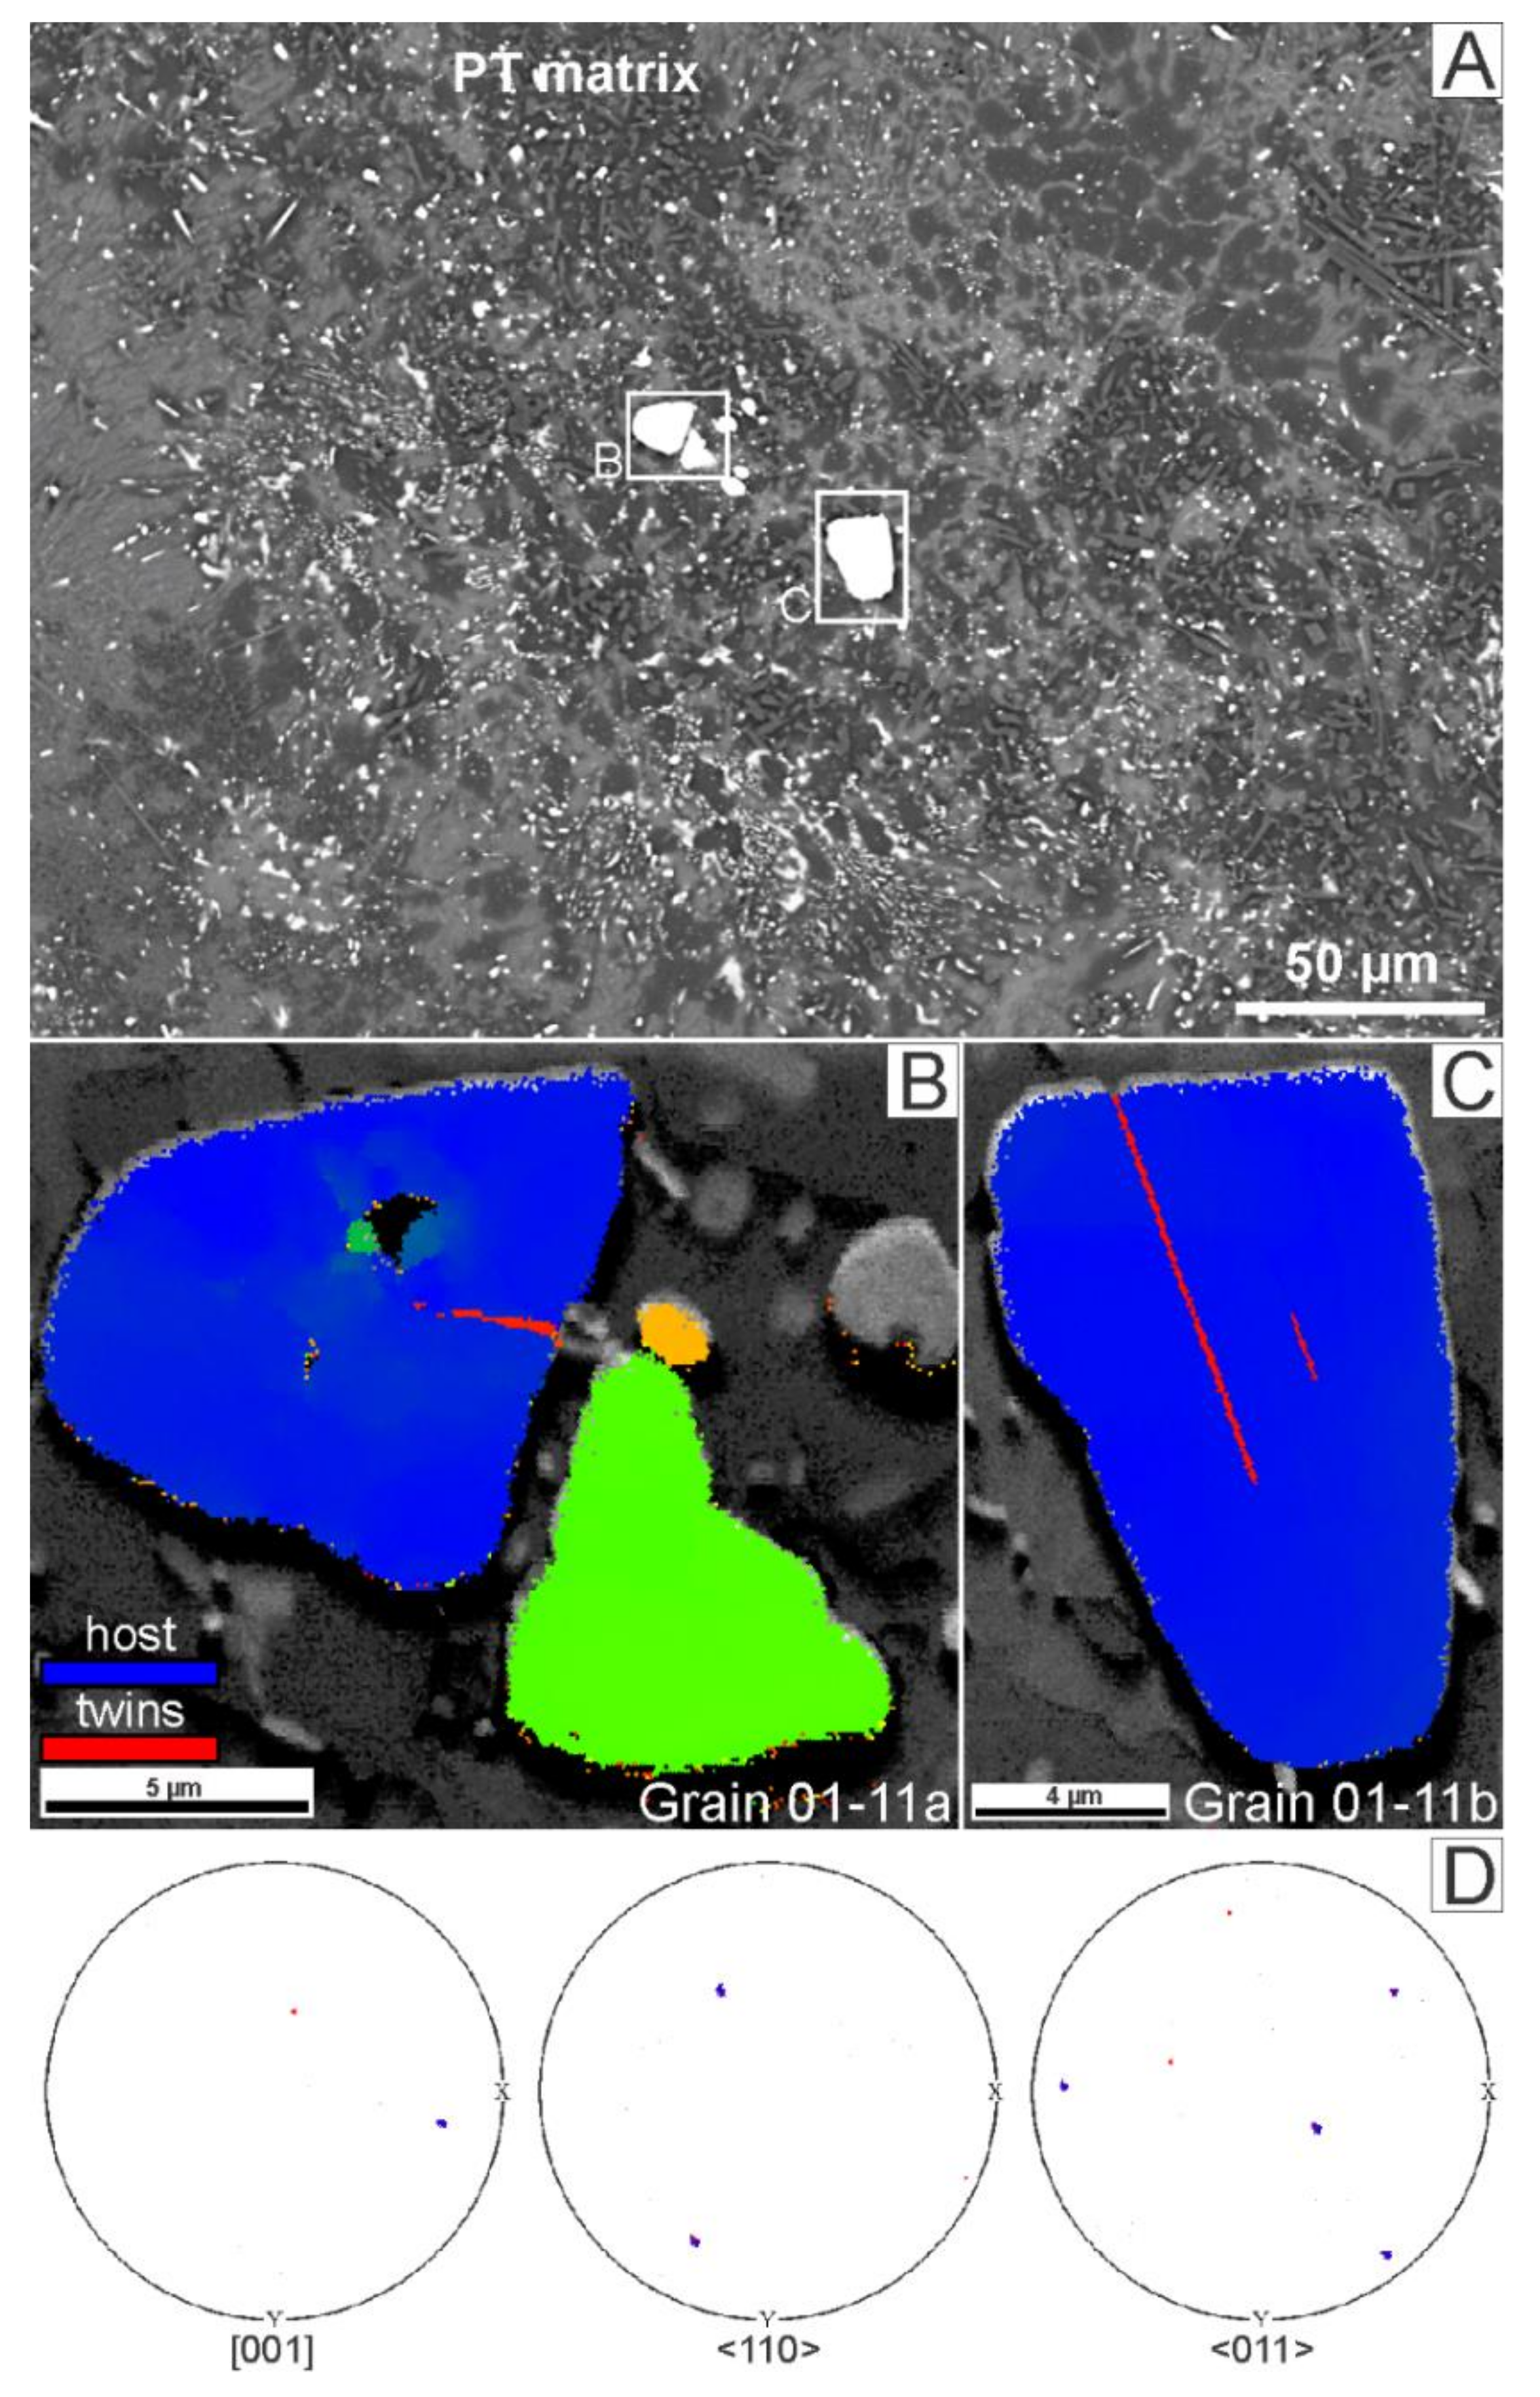
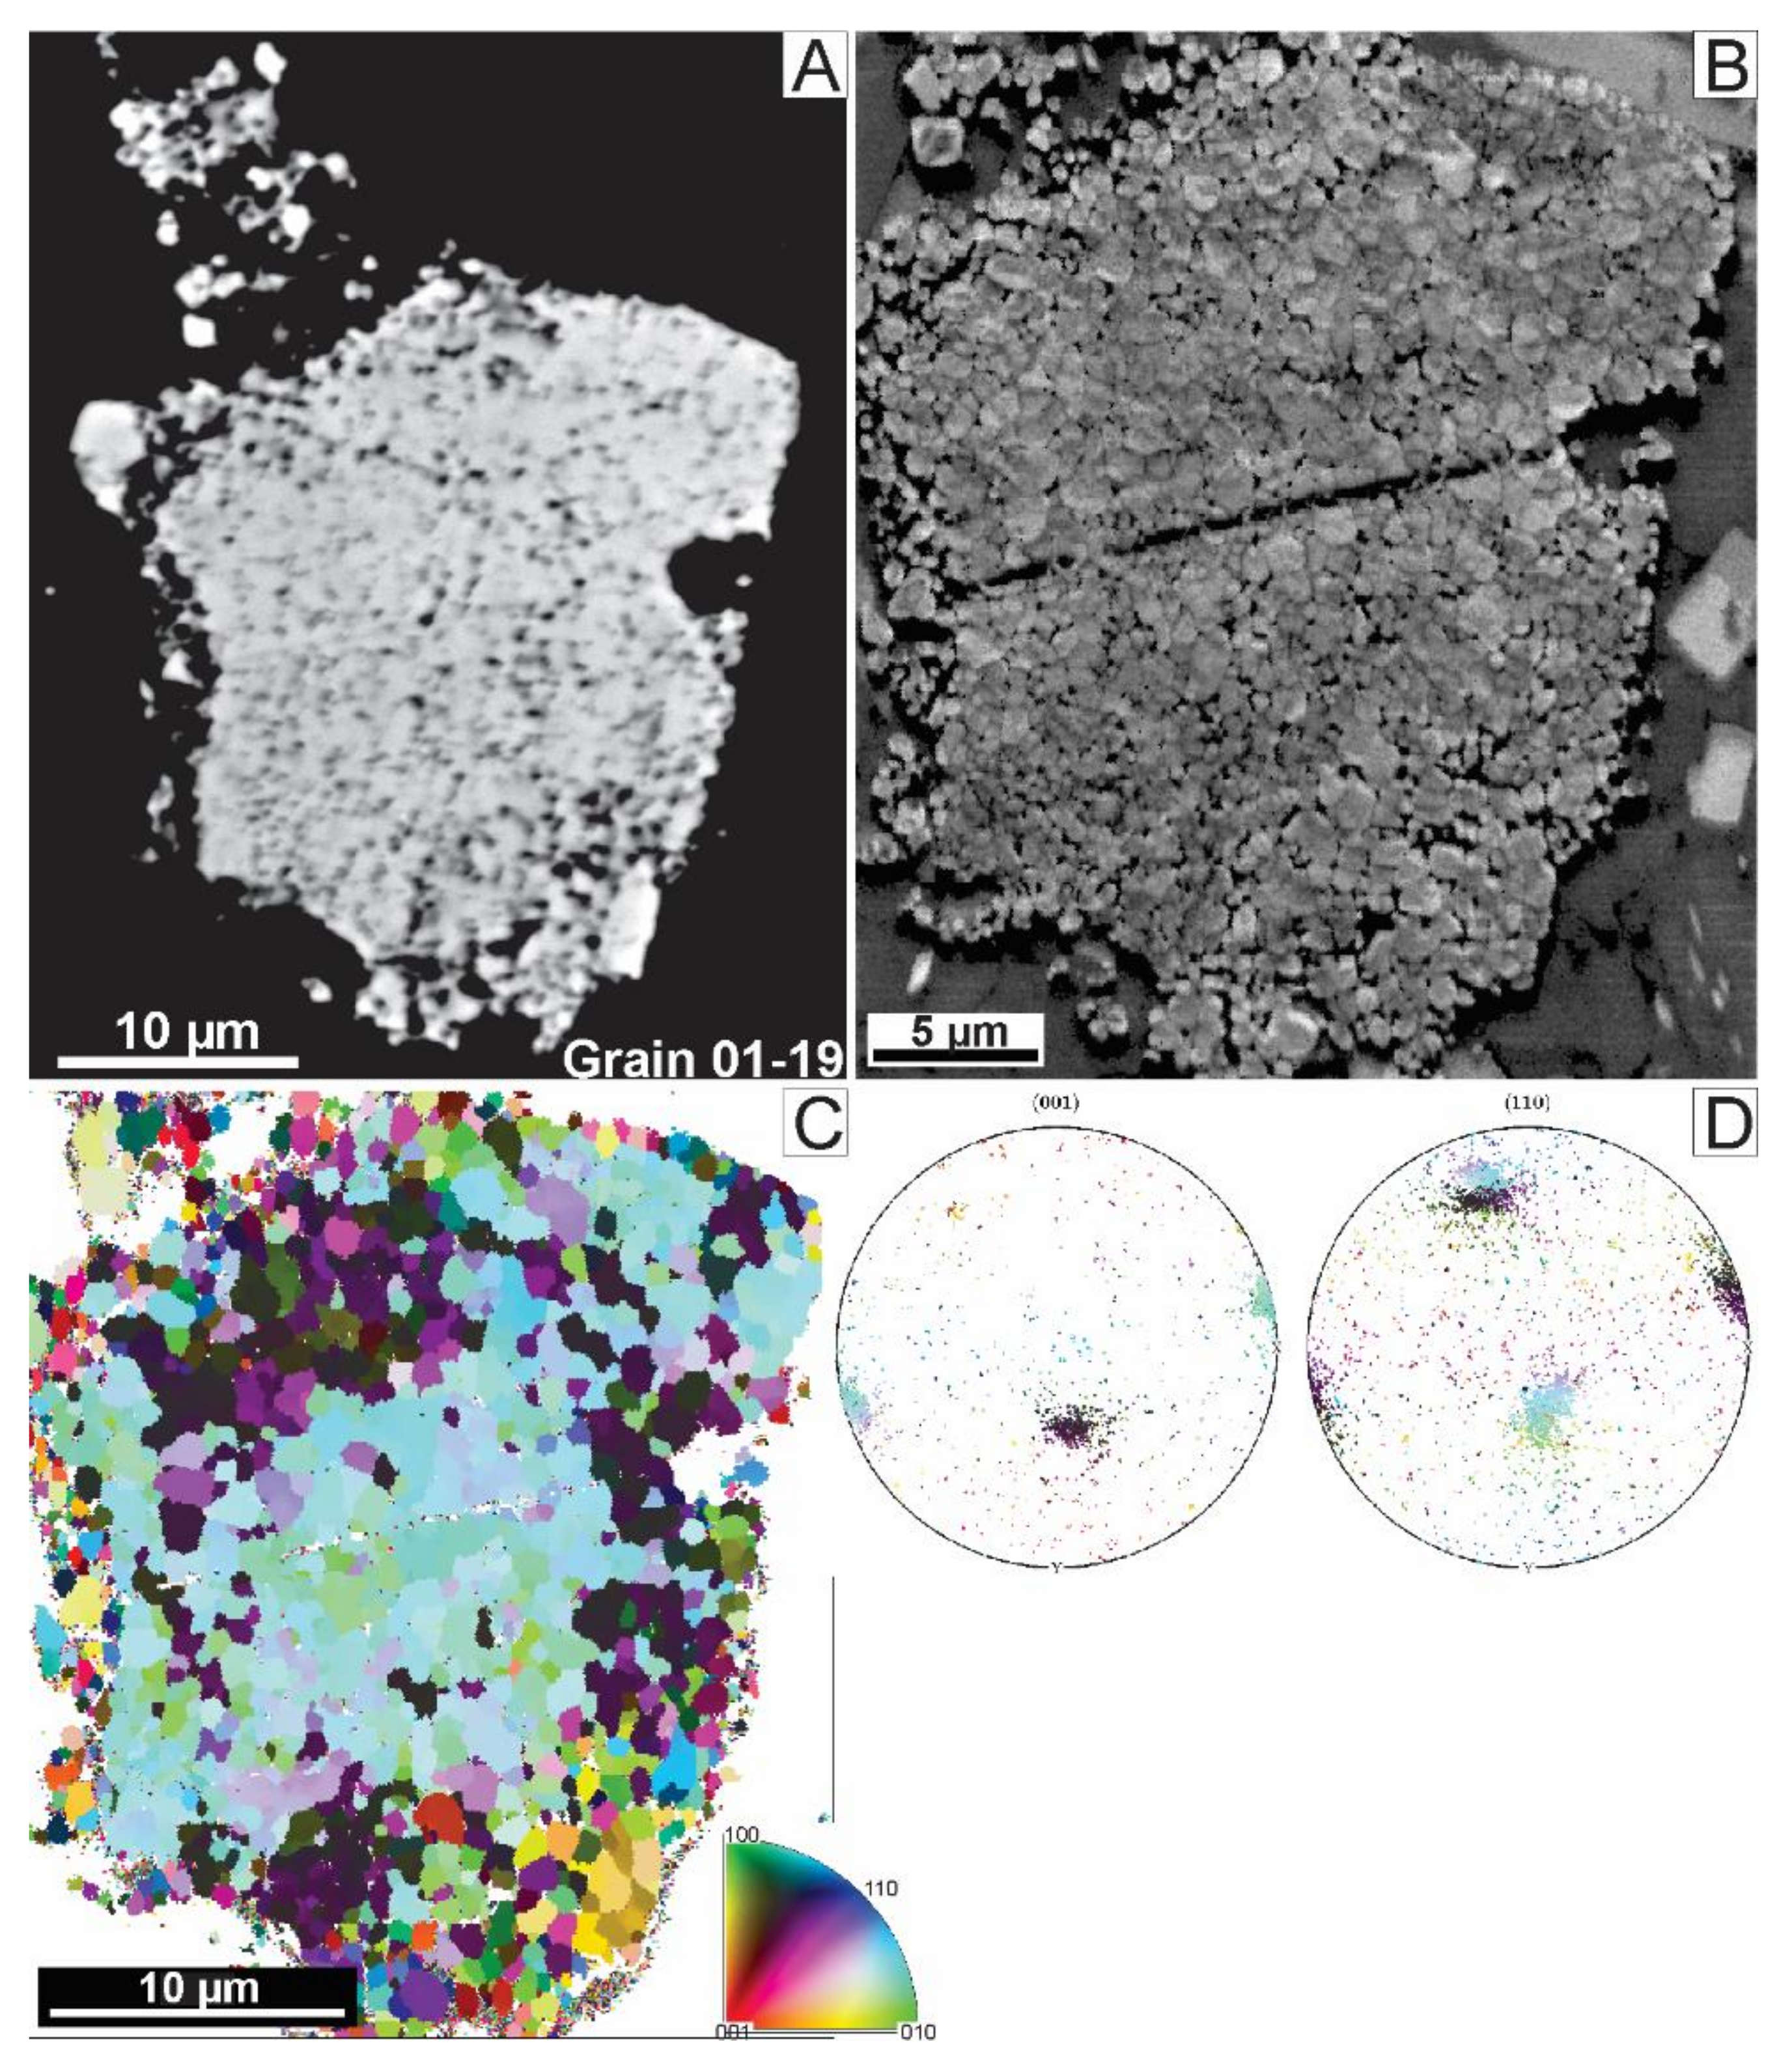
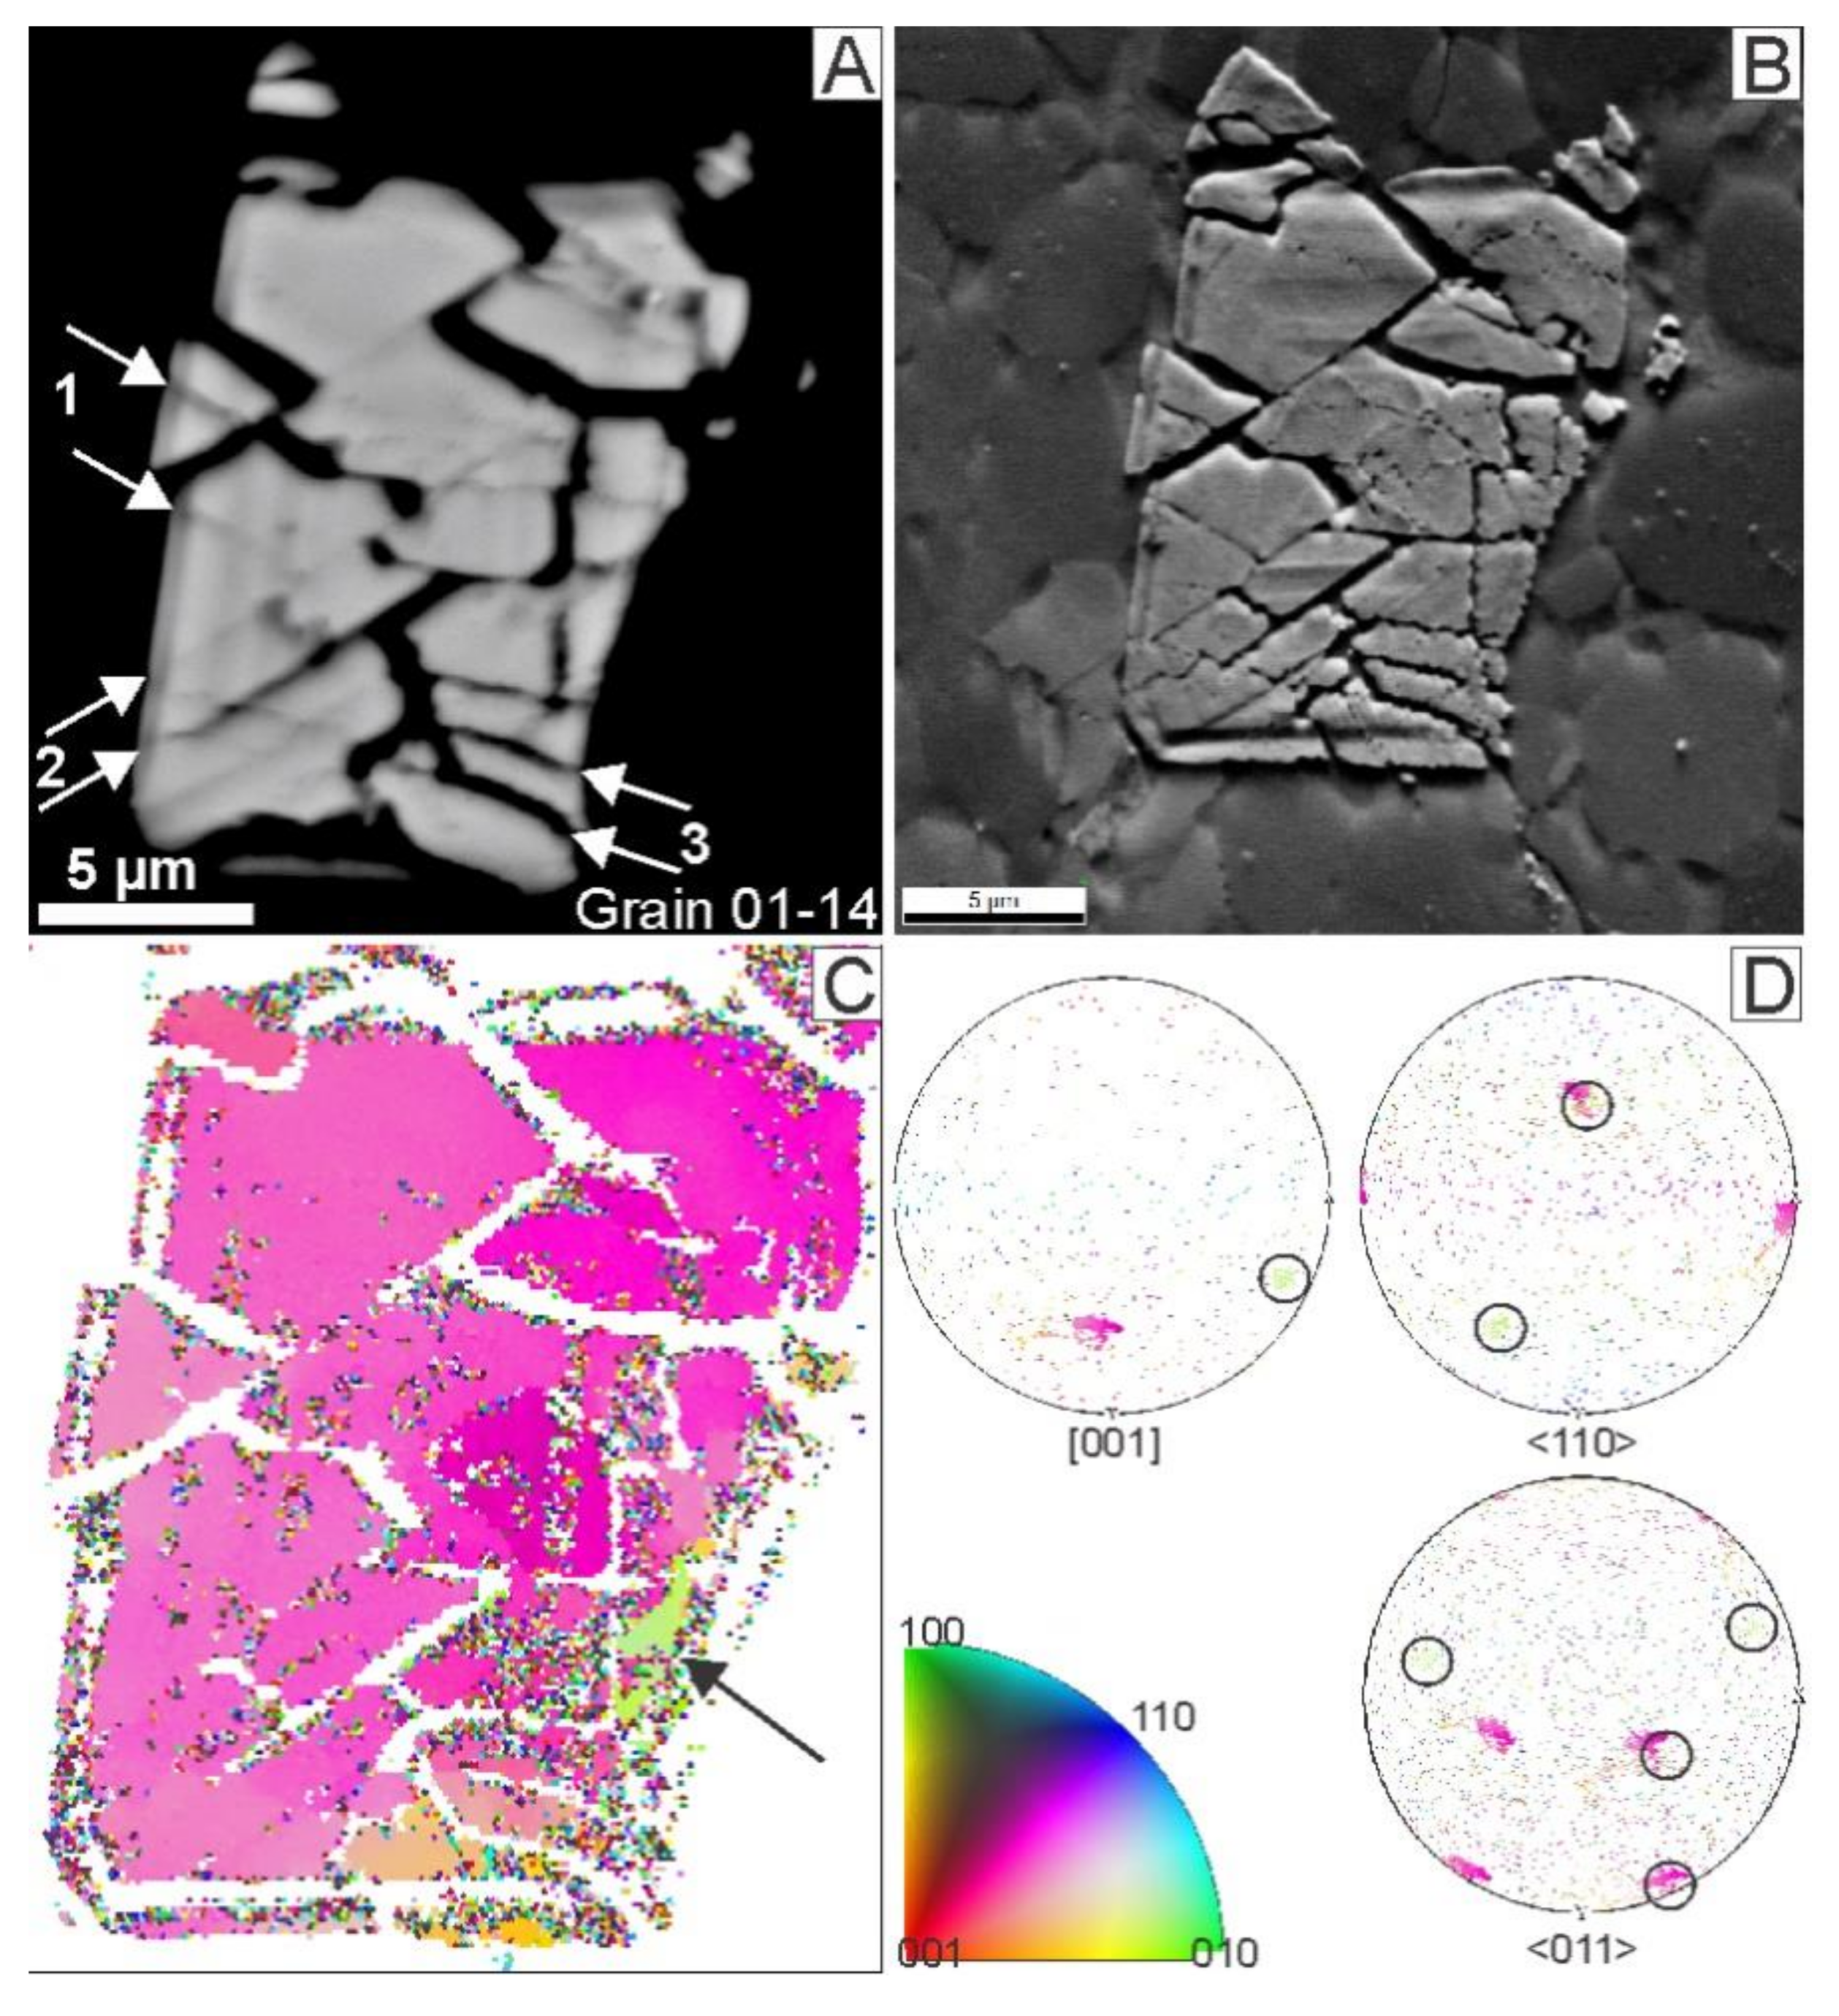
4.4. EBSD Mapping Data

Out of 67 zircon grains analyzed with the BSE and orientation contrast imaging, 20 (ca. 30%) display a granular texture; 8 (ca. 12%) exhibit planar fractures, of those, one revealed microtwins; 30 (ca. 45%) were found fractured or fragmented, of those, two have microtwins, and one has planar deformation bands (PDBs); 9 (ca. 13%) are only slightly deformed with crystal-plastic deformation or undeformed, of those, one has microtwins. Besides, we have examined five monazite grains, three of which are fractured, one is twinned, and one is undeformed (see below).
Zircon grains with shock microtwins (four in total) were found within the PT vein and at a distance of 6 and 7.5 mm from the PT vein. Within the PT vein and in the foliated granite around the vein, granular zircons are present, being spatially associated with the PT vein in thin sections (see also [19]). Farther away from the PT vein, at a distance greater than 3–6 mm, granular zircon is not found, but zircon with planar fractures (PFs) is abundant. At a distance greater than 12 mm, no distinct shock deformation features in zircon are observed [19].
In the PT vein’s matrix, fragmented zircon grains with shock microtwins were documented [29]. One of the grains with microtwins (Figure 9, Grain 01-11) is fragmented, with the fragments separated by up to ~50 µm within the PT matrix (Figure 9A). Two larger fragments contain an equivalent microtwin set (Figure 9B,C), showing that the grain was fractured across the length of a microtwin lamella. Shock microtwins typically form thin lamellae, which are rotated at 65° about the [110] axis of the host grain and occupy the {112} plane in the host grain [30]. Pole figures reveal accordingly that the [001] of the microtwin lamellae is rotated at about 65° with respect to the [001] axis of the host, and one of the <110> axes and two of the <011> axes coincide between the lamellae and the host (Figure 9D).
Grain 01-19 is located at a distance of ca. 2 mm from the PT vein and is composed of granules from <0.5 to 1 µm in size (Figure 10A–C). The grain is located within a fine-grained matrix and is resorbed at the edges (Figure 10A). The EBSD map (Figure 10C) shows well-indexed granules with different orientations. Pole figures show three main clusters of the [001] axes, which spatially coincide with the three clusters of <110> axes.
Grain 01-14 is located ~7.5 mm from the PT vein and is severely fractured. In the BSE image, at least three sets of PFs are observed (Figure 11A). In the EBSD map, two domains in the bottom right have different orientations than the host (color-coded orange and green). The orange domain is only slightly misaligned with respect to the main orientation of the grain and is consistent with the effects of moderate crystal-plastic deformation. The green domain has a characteristic orientation for shock microtwin lamellae, i.e., displays the rotation of [001] at about 65° with respect to the parent grain, one coincident <110> axis, and two coincident <011> axes (Figure 11D). The domain with microtwin-type orientation (color-coded green in Figure 11C) appears to be crosscut by PFs. White areas visible inside the grain in the EBSD map correspond to open fractures and the BSE-dark rim with the poor EBSD quality pattern (along the left margin and the top and bottom margins). This dark rim reflects the growth zoning of the grain.
Monazite grains are less abundant but also occur in the studied sample. Grains 01-16a and 01-16b are located at 0.5 mm from the PT vein; both grains have pores. The equidimensional euhedral grain 01-16b is undeformed, as visible in the orientation contract image (Figure 12A). Elongated subhedral grain 01-16a, located next to 01-16b, is deformed, exhibiting both subgrains and planar lamellae (Figure 12B,C). Three main orientation domains are distinguished from the EBSD maps and pole figures (Figure 12B–D). Domains 1 and 2 appear crystal-plastically deformed with internal misorientation/mosaic texture and moderate dispersion of crystallographic axes (“asterism”). Besides, domains 1 and 2 form mutually alternating planar lamellae, likely microtwins, which are sharply cut by domain 3. Domain 3 is undeformed, shows no dispersion of crystallographic axes (Figure 12D), and has an irregular shape. All three domains have a coincident orientation of their [010] axes, whereas domains 1 and 2 have the following twin relationships: 180°/[101].

5. Discussion

5.1. Origin of the PT Vein

In previous studies [20,21], concern was raised regarding the origin of the PT melt vein within the granitic clast. The presence of granular (polycrystalline) zircon grains and grains with shock microtwins and PFs, which have consistent spatial relationships with the PT melt vein, point to the impact-related origin of the PT vein. Granular neoblastic zircon with the systematic orientation of granules (Figure 10) has only been reported from shock metamorphism environments [31,32,33]. Zircon grains with PFs may occur in seismic zones [34,35] and under high crustal pressures [36] but are rather rare and more often reported from impactites [37,38,39,40,41]. Finally, zircons with polysynthetic microtwins have only been reported in nature from impact-related deposits [30,41,42].
The resorbed zircon with microtwin lamellae found in detached fragments, enclosed in the matrix of the PT vein, shows that the vein crystallized after the zircon was twinned and fragmented. Our data confirm the shock-related origin of the PT vein, with the following order of events, closely spaced in time:
(1)
The zircon was twinned (due to high shear stress during propagation of the rarefaction wave [43]);
(2)
The PT melt vein was formed (propagation of the rarefaction pressure wave or immediately after the propagation of the main pressure waves);
(3)
The zircon was fragmented, and fragments are separated within the PT melt (decompression—propagation of the rarefaction pressure wave or immediately after the propagation of the main pressure waves [44]);
(4)
The PT vein crystallized (post-impact with reduction of pressure and temperature);
(5)
The host granite was fragmented, and the fragments were incorporated into the impact melt (post-impact crater modification);
(6)
The impact melt was injected downwards, carrying the granite fragment, and formed the granophyre dyke (opening the deep fractures in the crust below the crater due to post-impact relaxation within the crust [15,45]).
Of these, (1) and (2) could be coincident with each other; however, the formation of the PT vein could have taken longer. This order of events, based on the crosscutting relationships, clearly points at the impact origin of the PT melt vein.

5.2. Geochemical Properties of Pseudotachylite

Although Kovaleva et al. (2018) semi-quantitatively demonstrated the general granitic affinity of the PT vein, most of the mapped elements display similar behavior within the vein and granophyre with respect to granite. Fe, Mg, Mn, Ti, Cr, S are enriched in both melt rocks compared to granite, whereas Si, Zn, Rb, Sr are enriched in granite compared to both granophyre and PT matrix. K and Na are equally distributed in all three rock phases.
Pronounced differences in composition between granite and granophyre are expected, as granophyre represents a fraction of the impact melt, formed as a result of the mixing of different target rocks, such as shale, quartzite, granite, lamprophyre, mafic lava, carbonate, etc., in various possible proportions [3,46]. On the other hand, the pseudotachylitic melt is advocated to form strictly in situ and correspond geochemically to its host rock [4,11]. Some pseudotachylites in granites were found to be slightly more mafic (i.e., enriched in Mg and Fe) than their host rocks [7,8] due to the initial melting of mafic and hydrous phases with lower fracture toughness in non-equilibrium conditions [47,48]. During the “flash” melting of granitic rocks, an excess of silica could survive as refractory quartz grains. In our sample, the occurrence of partially molten quartz aggregates (Figure 3A,B) is consistent with their leftover refractory character after partial melting.
In the present sample, pseudotachylite indeed appears to be more mafic than its host, which might be due to the initial preferential melting of mafic phases (e.g., dark micro-veins around the main PT vein are formed from mafic phases, Figure 2E–F). On the other hand, similar behavior of most mapped elements within the PT vein and granophyre with respect to granite could point to a contaminated/mixed composition of the PT vein. In the upper levels of the impact crater, elevated shock pressures could lead to more violent and chaotic processes than is observed at the lower levels exposed today. Melt-forming processes could be different in the upper levels of the impact structure than those observed deep below the eroded crater floor. For example, the formation of pseudotachylite may involve compositional mixing. Melt/clast transport to some distances and/or between different lithologies might have occurred [48].
Such melt mixing and migration can be greatly facilitated at the upper structural levels by the inevitable and large-scale movements of the rock blocks during the rarefaction pressure wave propagation, crater settling, post-shock seismic activity, etc. [44,49,50]. Such high-energy movements would be somewhat restricted at a depth of 8–10 km of the current erosional level due to the lithostatic pressure from the overlying masses of rock. Nevertheless, a degree of material mixing was observed even at the current erosional level [48]. A higher degree of melt mixing and melt transport at the upper levels might result in certain similarities between the impact melt (granophyre) and “in situ” melt (pseudotachylite), somewhat opposite to what was previously believed.
The possible similarity of the PT melt and granophyre is also supported by a “spherulitic” character of the PT vein’s matrix (Figure 7, Figure 8, and Figure 9A), similar to that of granophyre [1]. In granophyre, Mg- and Fe-rich crystals (orthopyroxene) are embedded in the Na- and K-rich matrix (spherules of feldspars). Similar patterns are observed within the matrix of the reported PT vein: Mg- and Fe-rich “spherules” are embedded in the K- and Na-rich matrix of the PT vein (Figure 3C,D, and Figure 8).

5.3. Association of the PT Vein with Shocked Accessory Minerals

In the present sample, shocked granular zircon within and around pseudotachylitic vein in a lithic clast in granophyre is observed [19]. The only granular zircon grain with fine granules (≤3 µm) reported from Vredefort (besides the zircons from a present sample) was found in heavy mineral separates from granophyre [39]. However, at that time, crystallographic orientations of granules were not confirmed due to the absence of a suitable technique. Zircons with comparatively large (~10–100 µm) granules from Vredefort were found in alluvial deposits of the Vaal River [42] and in the foliated norite (an impact-generated mafic melt found in the geographical center of the structure) [30]. There are no systematic crystallographic relationships observed between the large zircon granules, and their formation mechanism remains to be explained.
Thus, we report a rare occurrence of granular zircon with fine granules (≤3 µm) and systematic orientation of granules from the Vredefort impact structure. Moreover, the pseudotachylites formed close to the impacted surface reveal their spatial association with the granular neoblastic zircon grains and with zircon grains with planar fractures. This association is likely related to the inhomogeneous distribution of shock pressure, which is elevated along porous zones, mechanical discontinuities, fractures, or lithological boundaries [51,52] and is responsible for the shock recrystallization of zircon, at the same time facilitating the formation of in situ melts [9,10].
Zircon with PFs is also associated with the PT vein, occurring at a distance of 6–12 mm from the PT vein, where no granular zircon is found [19]. Zircon with polysynthetic microtwins occurs both within the PT vein (Figure 9; [29]), as well as at a distance of 6 and 7.5 mm from the PT vein, in the zone of zircon with PFs (Figure 11). There are only four grains with microtwins documented in two thin sections, and they appear to be spatially associated with the PT vein. The spatial association of zircon with PFs and microtwins with the melt veins was documented before and related to the high shear stress in the vicinity of the PT vein [52]. High shear stress after the shock wave propagation is suggested to initiate shock microtwins formation in zircon [43]. Moreover, micro-twinning in zircon occurred prior to the formation of PFs (Figure 11), which suggests that the shear stress necessary for mechanical twinning should be comparatively higher than that for planar fracturing.
In one of the previous studies, spatial relationships of shocked zircon and apatite grains with impact melt were observed [53]. Grains of these accessory minerals located closer to the impact melt were shown to be subject to higher shock levels of deformation/recrystallization, and thus they exhibit a high degree of isotopic age resetting, as opposed to grains that are located at a greater distance from impact melt [53]. In our sample, in contrast, shock effects in accessory minerals do not seem to spatially correlate with the proximity to the impact melt (i.e., to the granite clast margins), but are related to the PT vein. In our sample, zircon closer to the PT vein experienced a higher degree of shock recrystallization (i.e., acquired granular textures). We expect that the isotopic ages will also be reset in zircon grains located close to or within the PT vein, although further investigations are necessary.
Shocked monazite is also found in the vicinity of the PT melt vein and is composed of the twinned area (domains 1 and 2) and the re-crystallized area (domain 3). Impact-related mechanical twinning in monazite is not uncommon, with at least 12 distinct orientations of shock microtwins documented previously [54,55], with likely more twin orientations that are possible [48]. The twin orientation 180°/[101] is among the previously documented orientations [55]. The twinned area is crystal-plastically deformed, whereas the recrystallized area is undeformed and hence postdates plastic deformation. Thus, monazite grain 01-16a experienced post-shock crystal-plastic deformation in domains 1 and 2 and recrystallization in domain 3. Whereas post-shock crystal-plastic deformation of microtwin lamellae was observed in zircon as well [52], recrystallization of twinned domains in zircon has not been documented in Vredefort [30,42,52]. Thus, the recrystallization of twinned areas in monazite (Figure 12) demonstrates that monazite is less durable than zircon and may not retain shock deformation features throughout the geological history like zircon does [24,30].
The formation, deformation of polysynthetic microtwins, and subsequent recrystallization to strain-free neoblasts have been previously documented in titanite grains from a foliated pseudotachylite, Sudbury impact structure, and Archaean meta-granite from the core of the Vredefort impact structure [56]. The deformation of twins in titanite and their crystallization to strain-free neoblasts was explained by the effects of crater modification and heating due to the post-impact metamorphic evolution within large impact structures [56]. Post-shock heating could also explain crystal-plastic deformation and recrystallization to neoblasts observed in monazite from our sample. The post-shock heating of the studied clast was related to its involvement in the superheated impact melt [19].

6. Conclusions

We have studied the textural and compositional properties of a pseudotachylite vein hosted by a granite clast, which was transported from the uppermost levels of the Vredefort impact structure by a granophyre melt injected into the crater floor. The transport and preservation of such clasts facilitates the investigation of the eroded rocks and of the shock-related processes that occurred close to the impacted surface. With the help of crosscutting relationships, we have again confirmed the previously debated impact origin of the PT melt vein. The unknown properties of such “upper level” pseudotachylites have been suggested:
(1)
Possible contaminated/mixed composition of the pseudotachylites from the upper levels of the impact structure, which can be caused by the different mechanisms of pseudotachylite formation and development;
(2)
Spatial association of the shocked zircon with the PT vein, pointing at the elevated shock pressures/temperatures and high shear stresses in the vicinity of the PT melt vein (or vein’s formation site). Future studies should demonstrate the effect of the PT vein’s proximity on the isotopic age in zircon and monazite.
These properties might help in determining the origin of other pseudotachylite veins with unclear context and possibly in the identification of new impact structures. In the broader context, knowledge of the mechanisms and processes occurring at the upper levels of large impact basins might improve our understanding of impact processes and planetary evolution of the Earth, Moon, and other rocky bodies of the solar system.

Author Contributions

E.K. conducted optical and SEM microscopy, and EBSD analyses, conceptualized and designed the study, and drafted the manuscript. R.D. provided µ-XRF analyses and their interpretations. Both authors equally contributed to the discussion and editing of the manuscript. Note that by the moment of publication of this article, R.D. has passed away. E.K. has read and agreed to the published version of the manuscript.

Funding

The research was funded by the National Research Foundation (NRF), grant N 106511 “Freestanding Postdoctoral Fellowship (local)-2017/2018”, received by E.K. The work is produced within the frames of interdisciplinary project GRAVITAS (“Geological Research and Analysis of Vredefort Impact with Timely Anthropological Studies”), the grant received from the Directorate for Research Development, University of the Free State, 2019–2020.

Acknowledgments

We are grateful to C. van Rensburg and the deceased owner of Daskop 1103 farm, A.J. van Coller, for access to the granophyre outcrop. F. Roelofse and late M. Tredoux provided the sample for this study. G. Habler is acknowledged for assisting with EBSD data collection and processing.

Conflicts of Interest

The authors declare no conflict of interest. The funders had no role in the design of the study; in the collection, analyses, or interpretation of data; in the writing of the manuscript, or in the decision to publish the results.

References

  1. Therriault, A.M.; Reimold, W.U.; Reid, A.M. Field relations and petrography of the Vredefort Granophyre. S. Afr. J. Geol. 1996, 99, 1–21. [Google Scholar]
  2. Therriault, A.M.; Grieve, R.A.F.; Reimold, W.U. Original size of the Vredefort Structure: Implications for the geological evolution of the Witwatersrand Basin. Meteor. Planet. Sci. 1997, 32, 71–77. [Google Scholar] [CrossRef]
  3. Therriault, A.M.; Reimold, W.U.; Reid, A.M. Geochemistry and impact origin of the Vredefort Granophyre. S. Afr. J. Geol. 1997, 100, 115–122. [Google Scholar]
  4. Reimold, W.U.; Hauser, N.; Hansen, B.T.; Thirlwall, M.; Hoffmann, M. The impact pseudotachylitic breccia controversy: Insights from first isotope analysis of Vredefort impact-generated melt rocks. Geochim. Cosmochim. Acta 2017, 214, 266–281. [Google Scholar] [CrossRef]
  5. Fourie, F.; Huber, M.S.; Kovaleva, E. Geophysical characterization of the Daskop Granophyre Dyke and surrounding host rocks, Vredefort impact structure, South Africa. Meteorit. Planet. Sci. 2019, 54, 1579–1593. [Google Scholar] [CrossRef]
  6. Shand, S.J. The pseudotachylite of Parijs (Orange Free State), and its relation to “trap-shotten gneiss” and “flinty crus-rock”. Q. J. Geol. Soc. Lond. 1916, 72, 198–221. [Google Scholar] [CrossRef] [Green Version]
  7. Willemse, J. On the old granite of the Vredefort Region and some of its associated rocks. Trans. Geol. Soc. S. Afr. 1937, 40, 43–119. [Google Scholar]
  8. Wilshire, H.G. Pseudotachylite from the Vredefort Ring, South Africa. J. Geol. 1971, 79, 195–206. [Google Scholar] [CrossRef]
  9. Killick, A.M.; Reimold, W.U. Review of the pseudotachylites in and around the Vredefort “Dome”, South Africa. S. Afr. J. Geol. 1990, 93, 350–365. [Google Scholar]
  10. Reimold, W.U.; Colliston, W.P. Pseudotachylites of the Vredefort Dome and the surrounding Witwatersrand Basin, South Africa. In Large Meteorite Impacts and Planetary Evolution; Dressler, B.O., Grieve, R.A.F., Sharpton, V.L., Eds.; Special Paper of the Geological Society of America: Boulder, CO, USA, 1994; Volume 293, pp. 177–196. [Google Scholar] [CrossRef]
  11. Mohr-Westheide, T.; Reimold, W.U. Microchemical investigation of small-scale pseudotachylitic breccias from the Archaean gneiss of the Vredefort Dome, South Africa. In Large Meteorite Impacts and Planetary Evolution IV.; Gibson, R.L., Reimold, W.U., Eds.; Special Paper of the Geological Society of America: Boulder, CO, USA, 2010; Volume 465, pp. 619–643. [Google Scholar] [CrossRef]
  12. Lieger, D.; Riller, U.; Gibson, R.L. Petrographic and geochemical evidence for an allochthonous, possibly impact melt, origin of pseudotachylite from the Vredefort Dome, South Africa. Geochim. Cosmochim. Acta 2011, 75, 4490–4514. [Google Scholar] [CrossRef]
  13. Schreyer, W. Metamorphism and Fluid Inclusions in the Basement of the Vredefort Dome, South Africa: Guidelines to the Origin of the Structure. J. Petrol. 1983, 24, 26–47. [Google Scholar] [CrossRef]
  14. Henkel, H.; Reimold, W.U. Integrated geophysical modelling of a giant, complex impact structure: Anatomy of the Vredefort Structure, South Africa. Tectonophysics 1998, 287, 1–20. [Google Scholar] [CrossRef]
  15. Dietz, R.S. Vredefort ring structure: Meteorite impact scar? J. Geol. 1961, 69, 499–516. [Google Scholar] [CrossRef]
  16. Dence, M.R. Impact melts. J. Geophys. Res. 1971, 76, 5552–5565. [Google Scholar] [CrossRef]
  17. French, B.M.; Orth, C.J.; Quintana, L.R. Iridium in the Vredefort Bronzite Granophyre—Impact melting and limits on a possible extraterrestrial component. In Proceedings of the 19th Lunar and Planetary Science Conference, Houston, TX, USA, 14–18 March 1988; pp. 733–744. [Google Scholar]
  18. French, B.M.; Nielsen, R.L. Vredefort bronzite granophyre: Chemical evidence for origin as a meteorite impact melt. Tectonophysics 1990, 171, 119–138. [Google Scholar] [CrossRef]
  19. Kovaleva, E.; Zamyatin, D.; Habler, G. Granular zircon from Vredefort granophyre (South Africa) confirms the deep injection model for impact melt in large impact structures. Geology 2019, 47, 691–694. [Google Scholar] [CrossRef]
  20. Kovaleva, E.; Huber, M.; Roelofse, F.; Tredoux, M.; Praekelt, H. Pseudotachylite vein hosted by a clast in the Vredefort Granophyre: Characterization, origin and relevance. S. Afr. J. Geol. 2018, 121, 9–26. [Google Scholar] [CrossRef]
  21. Reimold, W.U. Comment on “Pseudotachylite vein hosted by a clast in the Vredefort Granophyre: Characterization, origin and relevance” by E. Kovaleva et al., South African Journal of Geology, 2018, doi:10.25131/sajg.121.0002. S. Afr. J. Geol. 2019, 122, 105–108. [Google Scholar] [CrossRef]
  22. Bisschoff, A.A. The history and origin of the Vredefort Dome. Suid-Afrikaanse Tydskrif Vir Wetenskap 1988, 84, 413–417. [Google Scholar]
  23. Ivanov, B.A. Numerical modeling of the largest terrestrial meteorite craters. Sol. Syst. Res. 2005, 39, 381–409. [Google Scholar] [CrossRef]
  24. Moser, D.E. Dating the shock wave and thermal imprint of the giant Vredefort impact, South Africa. Geology 1997, 25, 7–10. [Google Scholar] [CrossRef]
  25. Hart, R.J.; Andreoli, M.A.G.; Tredoux, M.; De Wit, M.J. Geochemistry across an exposed section of Archaean crust at Vredefort, South Africa: With implications for mid-crustal discontinuities. Chem. Geol. 1990, 82, 21–50. [Google Scholar] [CrossRef]
  26. Finch, R.J.; Hanchar, J.M.; Hoskin, P.W.O.; Burns, P.C. Rare-earth elements in synthetic zircon: Part 2. A single-crystal X-ray study of xenotime substitution. Am. Mineral. 2001, 86, 681–689. [Google Scholar] [CrossRef]
  27. Ni, Y.; Hughes, J.M.; Mariano, A.N. Crystal chemistry of the monazite and xenotime structures. Am. Mineral. 1995, 80, 21–26. [Google Scholar] [CrossRef]
  28. Bachmann, F.; Hielscher, R.; Schaeben, H. Texture analysis with MTEX—Free and open source software toolbox. Solid State Phenom. 2010, 160, 63–68. [Google Scholar]
  29. Kovaleva, E.; Huber, M.S.; Roelofse, F.; Tredoux, M.; Praekelt, H. Reply to the comment made by W.U. Reimold on “Pseudotachylite vein hosted by a clast in the Vredefort Granophyre: Characterization, origin and relevance” by E. Kovaleva et al., South African Journal of Geology, 2018, 121, 51–68, doi:10.25131/sajg.121.0002. S. Afr. J. Geol. 2019, 122, 109–115. [Google Scholar] [CrossRef]
  30. Moser, D.E.; Cupelli, C.L.; Barker, I.R.; Flowers, R.M.; Bowman, J.R.; Wooden, J.; Hart, J.R. New zircon shock phenomena and their use for dating and reconstruction of large impact structures revealed by electron nanobeam (EBSD, CL, EDS) and isotopic U-Pb and (U-Th)/He analysis of the Vredefort dome. Can. J. Earth Sci. 2011, 48, 117–139. [Google Scholar] [CrossRef]
  31. Erickson, T.M.; Pearce, M.A.; Reddy, S.M.; Timms, N.E.; Cavosie, A.J.; Bourdet, J.; Rickard, W.D.A.; Nemchin, A.A. Microstructural constraints on the mechanisms of the transformation to reidite in naturally shocked zircon. Contrib. Mineral. Petrol. 2017, 172, 6. [Google Scholar] [CrossRef]
  32. Cavosie, A.J.; Timms, N.E.; Ferrière, L.; Rochette, P. FRIGN zircon—The only terrestrial mineral diagnostic of high-pressure and high-temperature shock deformation. Geology 2018, 46, 891–894. [Google Scholar] [CrossRef]
  33. Kenny, G.G.; Schmieder, M.; Whitehouse, M.J.; Nemchin, A.A.; Morales, L.F.G.; Buchner, E.; Bellucci, J.J.; Snape, J.F. A new U-Pb age for shock-recrystallised zircon from the Lappajärvi impact crater, Finland, and implications for the accurate dating of impact events. Geochim. Cosmochim. Acta 2019, 245, 479–494. [Google Scholar] [CrossRef]
  34. Austrheim, H.; Corfu, F. Formation of planar deformation features (PDFs) in zircon during coseismic faulting and an evaluation of potential effects on U-Pb systematics. Chem. Geol. 2009, 261, 25–31. [Google Scholar] [CrossRef]
  35. Kovaleva, E.; Klötzli, U.; Habler, G.; Wheeler, J. (2015) Planar microstructures in zircon from paleo-seismic zones. Am. Mineral. 2009, 100, 1834–1847. [Google Scholar] [CrossRef]
  36. Schaltegger, U.; Ulianov, A.; Müntener, O.; Ovtcharova, M.; Peytcheva, I.; Vonlanthen, P.; Vennemann, T.; Antognini, M.; Girlanda, F. Megacrystic zircon with planar fractures in miaskite-type nepheline pegmatites formed at high pressures in the lower crust (Ivrea Zone, southern Alps, Switzerland). Am. Mineral. 2015, 100, 83–94. [Google Scholar] [CrossRef]
  37. Krogh, T.E.; Davis, D.W.; Corfu, F. Precise U-Pb zircon and baddeleyite ages for the Sudbury area. In The Geology and Ore Deposits of the Sudbury Structure; Pye, E.G., Naldrett, A.J., Gilbin, P.E., Eds.; Ontario Geological Survey: Ontario, Canada, 1984; Special Volume 1, pp. 431–446. [Google Scholar]
  38. Bohor, B.F.; Betterton, W.J.; Krogh, T.E. Impact-shocked zircons: Discovery of shock-induced textures reflecting increasing degrees of shock metamorphism. Earth Planet. Sci. Lett. 1993, 119, 419–424. [Google Scholar] [CrossRef]
  39. Kamo, S.L.; Reimold, W.U.; Krogh, T.E.; Colliston, W.P. A 2.023 Ga age for the Vredefort impact event and a first report of shock metamorphosed zircons in pseudotachylitic breccias and Granophyre. Earth Planet. Sci. Lett. 1996, 144, 369–387. [Google Scholar] [CrossRef]
  40. Cavosie, A.J.; Quintero, R.R.; Radovan, H.A.; Moser, D.E. A record of ancient cataclysm in modern sand: Shock microstructures in detrital minerals from the Vaal River, Vredefort Dome, South Africa. Geol. Soc. Am. Bull. 2010, 122, 1968–1980. [Google Scholar] [CrossRef]
  41. Erickson, T.M.; Cavosie, A.J.; Moser, D.E.; Barker, I.R.; Radovan, H.A. Correlating planar microstructures in shocked zircon from the Vredefort Dome at multiple scales: Crystallographic modeling, external and internal imaging, and EBSD structural analysis. Am. Mineral. 2013, 98, 53–65. [Google Scholar] [CrossRef]
  42. Cavosie, A.J.; Erickson, T.M.; Timms, N.E.; Reddy, S.M.; Talavera, C.; Montalvo, S.D.; Pincus, M.R.; Gibbon, R.J.; Moser, D. A terrestrial perspective on using ex situ shocked zircons to date lunar impacts. Geology 2015, 43, 999–1002. [Google Scholar] [CrossRef]
  43. Cox, M.A.; Cavosie, A.J.; Bland, P.A.; Miljković, K.; Wingate, M.T.D. Microstructural dynamics of central uplifts: Reidite offset by zircon twins at the Woodleigh impact structure, Australia. Geology 2018, 46, 983–986. [Google Scholar] [CrossRef]
  44. Melosh, H.J. Impact Cratering—A Geologic Process, 1st ed.; Oxford Monographs on Geology and Geophysics Number 11; Oxford University Press: Oxford, UK, 1989. [Google Scholar]
  45. Wüstemann, T.; Göllner, P.; Lightfoot, P.C.; Riller, U. Genetic relationship between postcratering dynamics and footwall deposit formation at Sudbury, Ontario, Canada: Importance for sulfide ore exploration. Econ. Geol. 2019, 114, 599–611. [Google Scholar] [CrossRef]
  46. Koeberl, C.; Reimold, W.U.; Shirey, S.B. A Re-Os isotope study of the Vredefort Granophyre: Clues to the origin of the Vredefort Structure, South Africa. Geology 1996, 24, 913–916. [Google Scholar] [CrossRef] [Green Version]
  47. Spray, J.G. Frictional melting processes in planetary materials: From hypervelocity impact to earthquakes. Annu. Rev. Earth Planet. Sci. 2010, 38, 221–254. [Google Scholar] [CrossRef] [Green Version]
  48. Kovaleva, E.; Huber, M.S.; Dixon, R. Material mixing in shock-induced pseudotachylites, Vredefort impact structure, South Africa. Lithos 2020, 370–371, 105621. [Google Scholar] [CrossRef]
  49. Riller, U.; Poelchau, M.H.; Rae, A.S.P.; Schulte, F.M.; Collins, G.S.; Melosh, H.J.; Grieve, R.A.F.; Morgan, J.V.; Gulick, S.P.S.; Lofi, J.; et al. IODP–ICDP Expedition 364 Science Party. Rock fluidization during peak-ring formation of large impact structures. Nature 2018, 562, 511–518. [Google Scholar] [CrossRef] [Green Version]
  50. Rae, A.S.P.; Collins, G.S.; Poelchau, M.; Riller, U.; Davidson, T.M.; Grieve, R.A.F.; Osinski, G.R.; Morgan, J.V.; IODP-ICDP Expedition 364 Science Party. Stress-strain evolution during peak-ring formation: A case study of the Chicxulub impact structure. J. Geophys. Res. Planets 2019, 124, 396–417. [Google Scholar] [CrossRef]
  51. Kenkmann, T.; Hornemann, U.; Stöffler, D. Experimental generation of shock-induced pseudotachylites along lithological interfaces. Meteor. Planet. Sci. 2000, 35, 1275–1290. [Google Scholar] [CrossRef]
  52. Kovaleva, E.; Habler, G. Spatial distribution of zircon with shock microtwins in pseudotachylite-bearing granite gneisses, Vredefort impact structure, South Africa. J. Struct. Geol. 2019, 129, 103890. [Google Scholar] [CrossRef]
  53. McGregor, M.; McFarlane, C.R.M.; Spray, J.G. In situ LA-ICP-MS apatite and zircon U-Pb geochronology of the Nicholson Lake impact structure, Canada: Shock and related thermal effects. Earth Planet. Sci. Lett. 2018, 504, 185–197. [Google Scholar] [CrossRef]
  54. Erickson, T.M.; Cavosie, A.J.; Pearce, M.A.; Timms, N.E.; Reddy, S.M. Empirical constraints on shock features in monazite using shocked zircon inclusions. Geology 2016, 44, 635–638. [Google Scholar] [CrossRef]
  55. Erickson, T.M.; Timms, N.E.; Kirkland, C.L.; Tohver, E.; Cavosie, A.J.; Pearce, M.A.; Reddy, S.M. Shocked monazite chronometry: Integrating microstructural and in situ isotopic age data for determining precise impact ages. Contrib. Mineral. Petrol. 2017, 172, 11. [Google Scholar] [CrossRef] [Green Version]
  56. Papapavlou, K.; Darling, J.R.; Moser, D.E.; Barker, I.R.; EIMF; White, L.F.; Lightfoot, P.C.; Storey, C.D.; Dunlop, J. U–Pb isotopic dating of titanite microstructures: Potential implications for the chronology and identification of large impact structures. Contrib. Mineral. Petrol. 2018, 173, 82. [Google Scholar] [CrossRef] [Green Version]
Figure 1. (A) Simplified geological map of the Vredefort impact structure, after [25]. (B) Field photograph of the sampled outcrop, after [20]. The granophyre matrix (brown) contains multiple lithic clasts (light-grey). The rectangle shows the sampled clast. (C) Thin section of the sampled clast with the pseudotachylite vein (dark grey) and its host meta-granite (light grey).
Minerals 10 01053 g001
Figure 2. Transmitted light images of the sample. (A) Domain with massive texture, away from the PT vein. Pockets of granophyre are locally observed (rectangle), plain-polarized light (PPL). (B) Same area as in (A), cross-polarized light (XPL). (C) Pocket filled with granophyre (dark), the enlarged area, as shown in (A). Orthopyroxene needles are notable (arrows), PPL. (D) Foliated domain, adjacent to PT vein (black in the upper part of the image), PPL. (E) Domain, adjacent to the PT vein, signs of partial melting of dark phases, PPL. (F) Same area as in (E), XPL. Quartz is polycrystalline (mosaic) and inter-fingers with dark veinlets.
Minerals 10 01053 g002
Figure 3. Transmitted light optical images of the PT vein. (A) Vein’s matrix (dark), with spherulitic texture and a plastically deformed fragment of quartz, PPT. (B) Same area as in (A), XPL. The deformed fragment exhibits mosaicism. (C) Matrix of PT vein, texturally inhomogeneous, with dark spherules 10–50 µm in diameter (arrow), PPL. (D) Matrix of PT vein, with dark spherules/rings 100–300 µm in diameter (arrows), PPL. Opaque needles are visible in (C,D).
Minerals 10 01053 g003
Figure 4. ED-µXRF maps of a selected area in the thin section. (A) Thin section photograph. The small rectangle shows the mapped area in (BF), where the clast is in contact with the host granophyre. The larger rectangle shows the mapped area in Figure 5, featuring the PT vein and adjacent granite. The horizontal length of the field of view is 35 mm. (B) Si intensity map, showing that the clast is more siliceous than granophyre. (C) Al intensity map, showing that Al distribution in the clast is inhomogeneous but roughly comparable with granophyre. (D) Ca intensity map, showing that granophyre is enriched in Ca compared to granite. (E) Mg intensity map, showing that the granophyre is enriched in Mg, especially within the orthopyroxene needles, compared to granite clast. (F) Ti intensity map, showing that granophyre’s matrix is enriched in Ti compared to granite, in which Ti is only locally elevated. The scale bar in (BF) is 1 mm.
Minerals 10 01053 g004
Figure 5. ED-µXRF maps of a selected area in the thin section, shown by a large rectangle in Figure 4A. (A) Composite intensity map of Mg (red), Al (blue), and Si (yellow), showing that the PT vein is enriched in Mg and Al and depleted in Si with respect to the host clast. (B) Fe intensity map, showing that the PT vein is enriched in Fe. (C) K intensity map, showing that K distribution in the PT vein and the clast is patchy/inhomogeneous but is more homogeneous in the foliated zone. (D) Ti intensity map, showing that the PT vein is rich in Ti compared to the host clast. (E) S intensity map, showing S concentrated in patches within and around the PT vein. (F) Ca intensity map, showing that Ca is equally depleted within the PT vein and the clast. Scale as in (A).
Minerals 10 01053 g005
Figure 6. BSE image and EDX maps of the granite clast with pockets of granophyre. (A) BSE image. (B) EDX intensity map of Si, showing that the granophyre is depleted in Si compared to the granite clast. (C) EDX intensity map of Al, showing that the granophyre is enriched in Al. (D) EDX intensity map of Ca, showing that the granophyre is enriched in Ca. (E) EDX intensity map of Mg, showing that the granophyre is enriched in Mg within the pyroxene needles.
Minerals 10 01053 g006
Figure 7. BSE image and EDX maps of the PT vein in contact with foliated granite. (A) BSE image. (B) EDX intensity map of Si, showing that the granite is enriched in Si compared to the PT vein. (C) EDX intensity map of Al, showing that the PT vein is enriched in Al and that Al is inhomogeneously distributed in the PT vein. (D) EDX intensity map of Mg, showing that the PT vein is enriched in Mg. (E) EDX intensity map of Ti, showing that the PT vein is enriched in Ti.
Minerals 10 01053 g007
Figure 8. BSE image and EDX maps of the PT vein’s matrix. (A) BSE image. (B) EDX intensity map of Al, showing its inhomogeneous distribution. (C) EDX intensity map of K, showing its patchy, inhomogeneous distribution. (D) EDX intensity map of Mg, showing its inhomogeneous distribution, negatively correlating with K. (E) EDX intensity map of Fe, showing its inhomogeneous distribution, positively correlating with Mg.
Minerals 10 01053 g008
Figure 9. Fragmented zircon grain 01-11 in the PT matrix. (A) BSE image, showing the fragmented grain at (B,C). (B) EBSD map of the upper left fragment (01-11a), color-coded according to the orientation: the host grain is colored blue, and the microtwin lamella, rotated at 65° to the host lattice about <110>, is colored red. (C) EBSD map of the lower right fragment (01-11b), color-coded according to the orientation: host grain is colored blue and microtwin lamellae, rotated at 65° to the host lattice about <110>, are colored red. The step size for both maps is 80 nm, plotted with the EDAX OIM v7.3 Analysis software. (D) Pole figures for grain 01-11b for [001], <110> and <011>, color-coded as in (C). Plotted with the MATLAB MTEX v5.1.1.
Minerals 10 01053 g009
Figure 10. Microstructural details of the granular zircon grain 01-19, located at ca. 2 mm from the PT vein. (A) BSE image, the granular texture, and resorbed margins are visible. (B) Orientation contrast (FSE) image. (C) EBSD map, color-coded in the inversed pole figure (IPF) colors along the [001] axis. Step size 80 nm. (D) Upper hemisphere equal angle projection pole figures for [001] and <110>, color-coded as in (C). Plotted with the MATLAB MTEX v5.1.1.
Minerals 10 01053 g010
Figure 11. Microstructural details of the zircon grain 01-14, located ~7.5 mm from the PT vein. The grain contains planar fractures (PFs), highlighted as 1-3. (A) BSE image, three sets of PFs are visible (arrows). (B) Orientation contrast (FSE) image. (C) EBSD map, color-coded in the IPF colors along the [001] axis. Step size 90 nm. Arrow points to the (sub)grain with a different orientation, highlighted with the circles in (D). (D) Upper hemisphere equal angle projection pole figures for [001], <110> and <011>, color-coded as in (C). Circles highlight the orientation of the green domain in (C). Plotted with the MATLAB MTEX v5.1.1.
Minerals 10 01053 g011
Figure 12. Microstructural details of the monazite grain 01-16a, located at 0.5 mm from the PT vein. (A) Orientation contrast (FSE) image, showing deformed (01-16a) and undeformed (01-16b) monazite grains. Box shows the area mapped in (B,C). (B) EBSD map, color-coded in the IPF colors. (C) EBSD map color-coded according to misorientation with respect to the user-selected reference point (+). Misorientation is shown from 0° (blue) to 180° (red). Step size 80 nm. (D) Upper hemisphere equal angle projection pole figures for [001], [100], [010], and <110> axes, color-coded as in (C). Plotted with the EDAX OIM v7.3 Analysis software.
Minerals 10 01053 g012
Publisher’s Note: MDPI stays neutral with regard to jurisdictional claims in published maps and institutional affiliations.

