Simulating Combined Self-Loading Truck and Semitrailer Truck Transport in the Wood Supply Chain


Institute of Production and Logistics, University of Natural Resources and Life Sciences, Vienna, Feistmantelstrasse 4, 1180 Vienna, Austria
*
Author to whom correspondence should be addressed.
Forests 2020, 11(12), 1245; https://doi.org/10.3390/f11121245
Submission received: 20 October 2020
/
Revised: 20 November 2020
/
Accepted: 23 November 2020
/
Published: 25 November 2020
(This article belongs to the Special Issue Forest Sustainability: Wood Harvest, Supply and Procurement Chain, and Wood Raw Material Properties)
Abstract
:Forestry faces frequent and severe natural calamities causing high amounts of salvage wood. Especially under mountainous conditions, regional available self-loading truck capacity is often the main limiting factor causing transport capacity bottlenecks. Therefore, innovative logistics strategies are needed to ensure quick transport of high amounts of salvage wood. Consequently, a multi-echelon unimodal transport concept, where timber is synchronously transshipped at a truck terminal with four transshipment lots from self-loading trucks to semitrailers, was modeled by means of a discrete event simulation. The simulation model calculates key performance indicators such as transshipped volumes and costs and support estimations of optimal truck fleet configuration. The results provide cost-optimal truck fleet configurations in terms of the number of self-loading trucks, semitrailers and prime mover trucks for varying transshipment volumes, delivery time to terminal and legal truck payload scenarios. Applying the truck terminal concept considerably decreases the number of self-loading trucks needed to transport the same volume when compared to unimodal wood transport, which is most common under mountainous conditions in Europe. In the majority of delivery time to terminal and terminal transshipment volume scenarios, the number of self-loading trucks was reduced by more than 50%. Increasing the legal gross vehicle weight for timber transport from 44 t up to 50 t reduces the number of self-loading trucks needed by 20% to 38%, depending on the scenario setting. Additionally, less self-loading trucks arriving at the terminal also cuts queuing times and system efficiency increases as transport cost/t is reduced by 6% to 11% depending on the scenario setting. Expanding the truck terminal concept by adding storage capacity as well as varying the number of transshipping lots and also including costs for terminal construction and operations in the economic analyses are promising topics for future studies.
1. Introduction
Self-loading trucks are the fundamental backbone of wood supply chains in Europe. In single echelon unimodal supply chains, self-loading trucks cover the entire transport of harvested and forwarded wood from forest landings to industrial plants. Self-loading trucks are also an essential means of transport in supply chains where wood is transshipped at terminals to semitrailers, large trailer-trucks for high-capacity transport (i.e., multi-echelon unimodal transport), train wagons or vessels (i.e., multimodal transport), as they are indispensable to transport wood from forest to terminal.
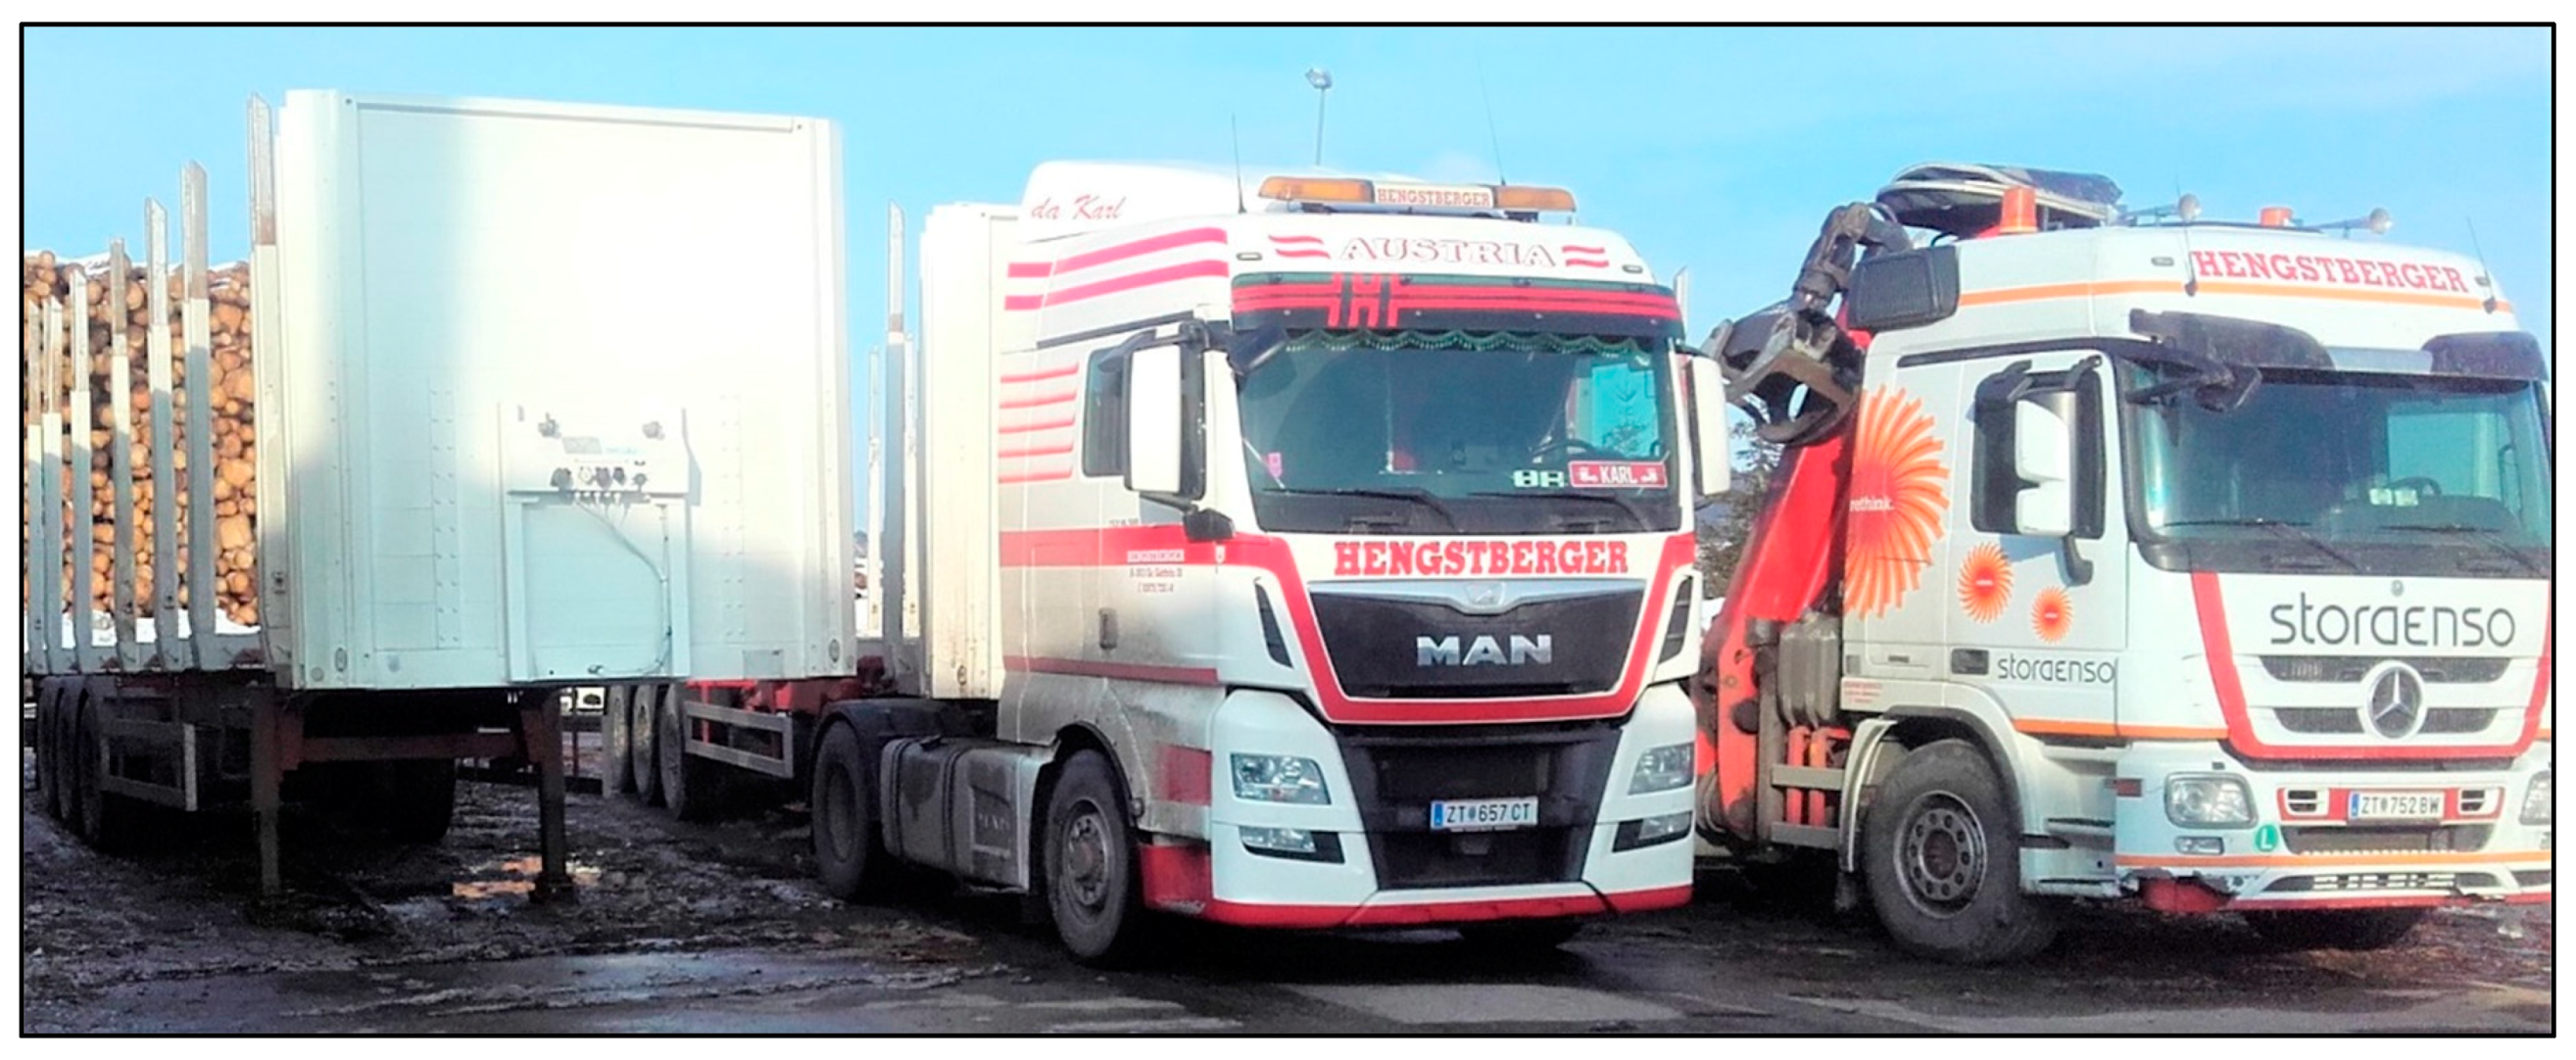
Depending on operating systems and available loading equipment at the terminal, self-loading trucks are also responsible for transshipping timber to the stockyard at the terminal or directly onto the next transport vehicle (e.g., semitrailer, train wagon, vessel). Consequently, the entire wood supply chain highly depends on self-loading truck performance and available capacity (Figure 1).
In mountainous regions, available self-loading truck capacity is often the main limiting factor causing transport bottlenecks. In particular, increasingly frequent and severe natural calamities such as storms and bark beetle infestations intensify this problem since high amounts of salvage wood have to be rapidly transported to limit further loss of value. Moreover, in other regions, trucking enterprises are under pressure [1,2]. Consequently, the existing self-loading truck transport capacities must be used as efficiently as possible. This can be achieved mainly by restricting their use to the unavoidable task of transporting wood from forest landings to nearby terminals instead of to faraway industries.
A review of operational, tactical and strategical operation research applications and problems for the wood supply chain was provided [3]. Other literature reviews covering the forest product industry highlighted the opportunities of simulation approaches to consider uncertainty [4] or focused on discrete event simulation (DES) applications [5], but mainly analyzed studies with unimodal wood transport. Additionally, first contributions for multimodal wood supply chains [6,7,8] were listed and analyzed in a literature review focusing on wood transport [9]. Recent works provide a detailed discrete event simulation (DES) model for small train terminals [10], enabling short-term contingency planning [11] as well as knowledge transfer in game-based workshop designs [12].
Current contributions of the sparsely existing literature on multi-echelon unimodal wood transport observed the integration of high-capacity trucks into the wood supply chain with DES and concluded that the economic performance of this transport system is dependent on balancing the number of high-capacity trucks and self-loading trucks feeding the terminals [13]. In addition, the influences of gross vehicle weight and transport delivery time on trucking performance was studied and highlighted the potential of high-capacity transport to decrease the truck density on roads, reduce exhaust emissions per transport volume and avoid a shortage of drivers for trucking timber [14]. Moreover, others [15,16,17] support high-capacity trucking and further related contributions include studies of fuel consumption [18,19,20].
Nevertheless, neither influences of higher transport payloads on self-loading trucks in multi-echelon unimodal wood supply chains nor optimal truck fleet configurations for small terminals, which are common for mountainous regions, were studied. Due to a lack of data-driven decision support and professional supply chain management, the logistical transport concept of transshipping wood from self-loading trucks to semitrailers at terminals is sparely used. In order to avoid a bottleneck in self-loading truck capacity threatened by more frequent natural calamities and a declining number of self-loading truck drivers, well-configurated multi-echelon unimodal wood supply chains can contribute to use the existing transport capacity more efficiently. Consequently, this research paper introduces a transport concept where the mode of transport remains the same (i.e., unimodal), but different vehicle types (i.e., multi-echelon) are used. Scenario analyses observe the impact of delivery time from forest to terminal, truck payload and transshipment volume on the optimal truck fleet configuration regarding the number of self-loading trucks, prime mover trucks and semitrailers.
The hypothesis states that unimodal multi-echelon wood transport including a synchronous transshipment of timber from self-loading trucks to semitrailers at small terminals with four transshipment lots can help to mitigate bottlenecks of self-loading truck drivers in mountainous regions. Moreover, this concept has the potential for cost-savings because semitrailer trucks offer higher transport capacities (i.e., no crane, no all-wheel drive) and less expensive operation costs (i.e., lower acquisition costs, lower maintenance costs, less skilled drivers). In spite of these potential benefits, the concept is only used by a limited amount of wood trucking enterprises. A reason for this is the complexity to design an efficient layout and plan a beneficial truck fleet configuration from scratch with limited scientific support.
Therefore, the DES method was applied to showcase an advanced analysis and planning method for the problem setting of a dynamic system with interacting queues to deliver optimal truck fleet configurations for practical applications and to answer the following research questions:
- Research question (RQ) 1: What is the optimal truck fleet configuration regarding the number of self-loading trucks, prime mover trucks and semitrailers for a multi-echelon unimodal wood supply chain including a terminal with four transshipment lots for short, medium and long delivery times to the terminal and low or high transshipment volumes?
- RQ 2: What is the savings potential in terms of self-loading trucks and working time of the multi-echelon unimodal transport concept in comparison with unimodal wood supply?
- RQ 3: What is the impact of increasing the maximum allowable truckload from 44 to 50 t on the system performance regarding costs, number of self-loading trucks and working time?
2. Method and Model
2.1. Discrete Event Simulation
Dynamic systems featuring non-linear behaviour, memory, non-intuitive influences between variables, time and causal dependencies, uncertainty and a large number of parameters define the limits of analytical solutions [21]. Here, the DES method steps in and allows, for instance, one to observe complex dynamic systems with interacting queues. Literature [22] emphasizes the benefit of DES for designing and testing new operating procedures and transportation systems without committing actual resources by performing bottleneck analysis and asking what-if questions. Consequently, this method was chosen to model a multi-echelon unimodal wood supply chain including interacting queues for self-loading trucks to load semitrailers and prime mover trucks to pick up fully loaded semitrailers, where the number of available semitrailers is dependent on their loading and processing status.
2.2. Process Flow
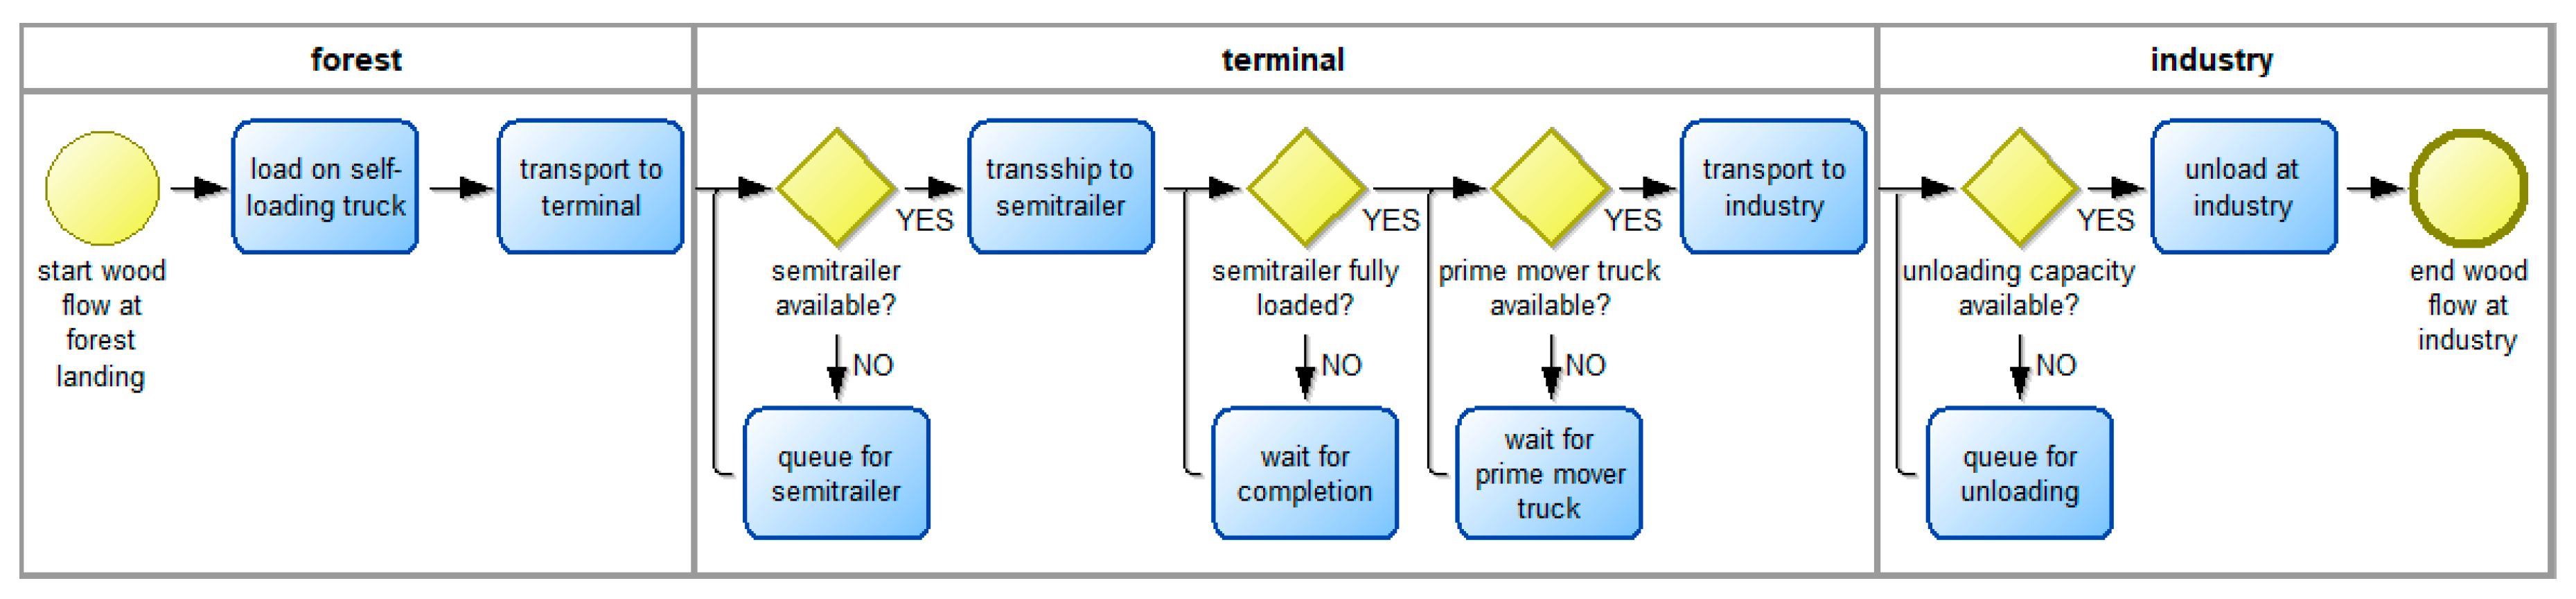
Wood flow (Figure 2) starts at forest landing, where timber is picked up by a self-loading truck and transported to a truck terminal. In case of an empty semitrailer available at a terminal transshipment lot, wood is transshipped to a semitrailer. If the semitrailer is fully loaded, an available prime mover truck couples to the semitrailer and transports the wood to industry, where it is unloaded.
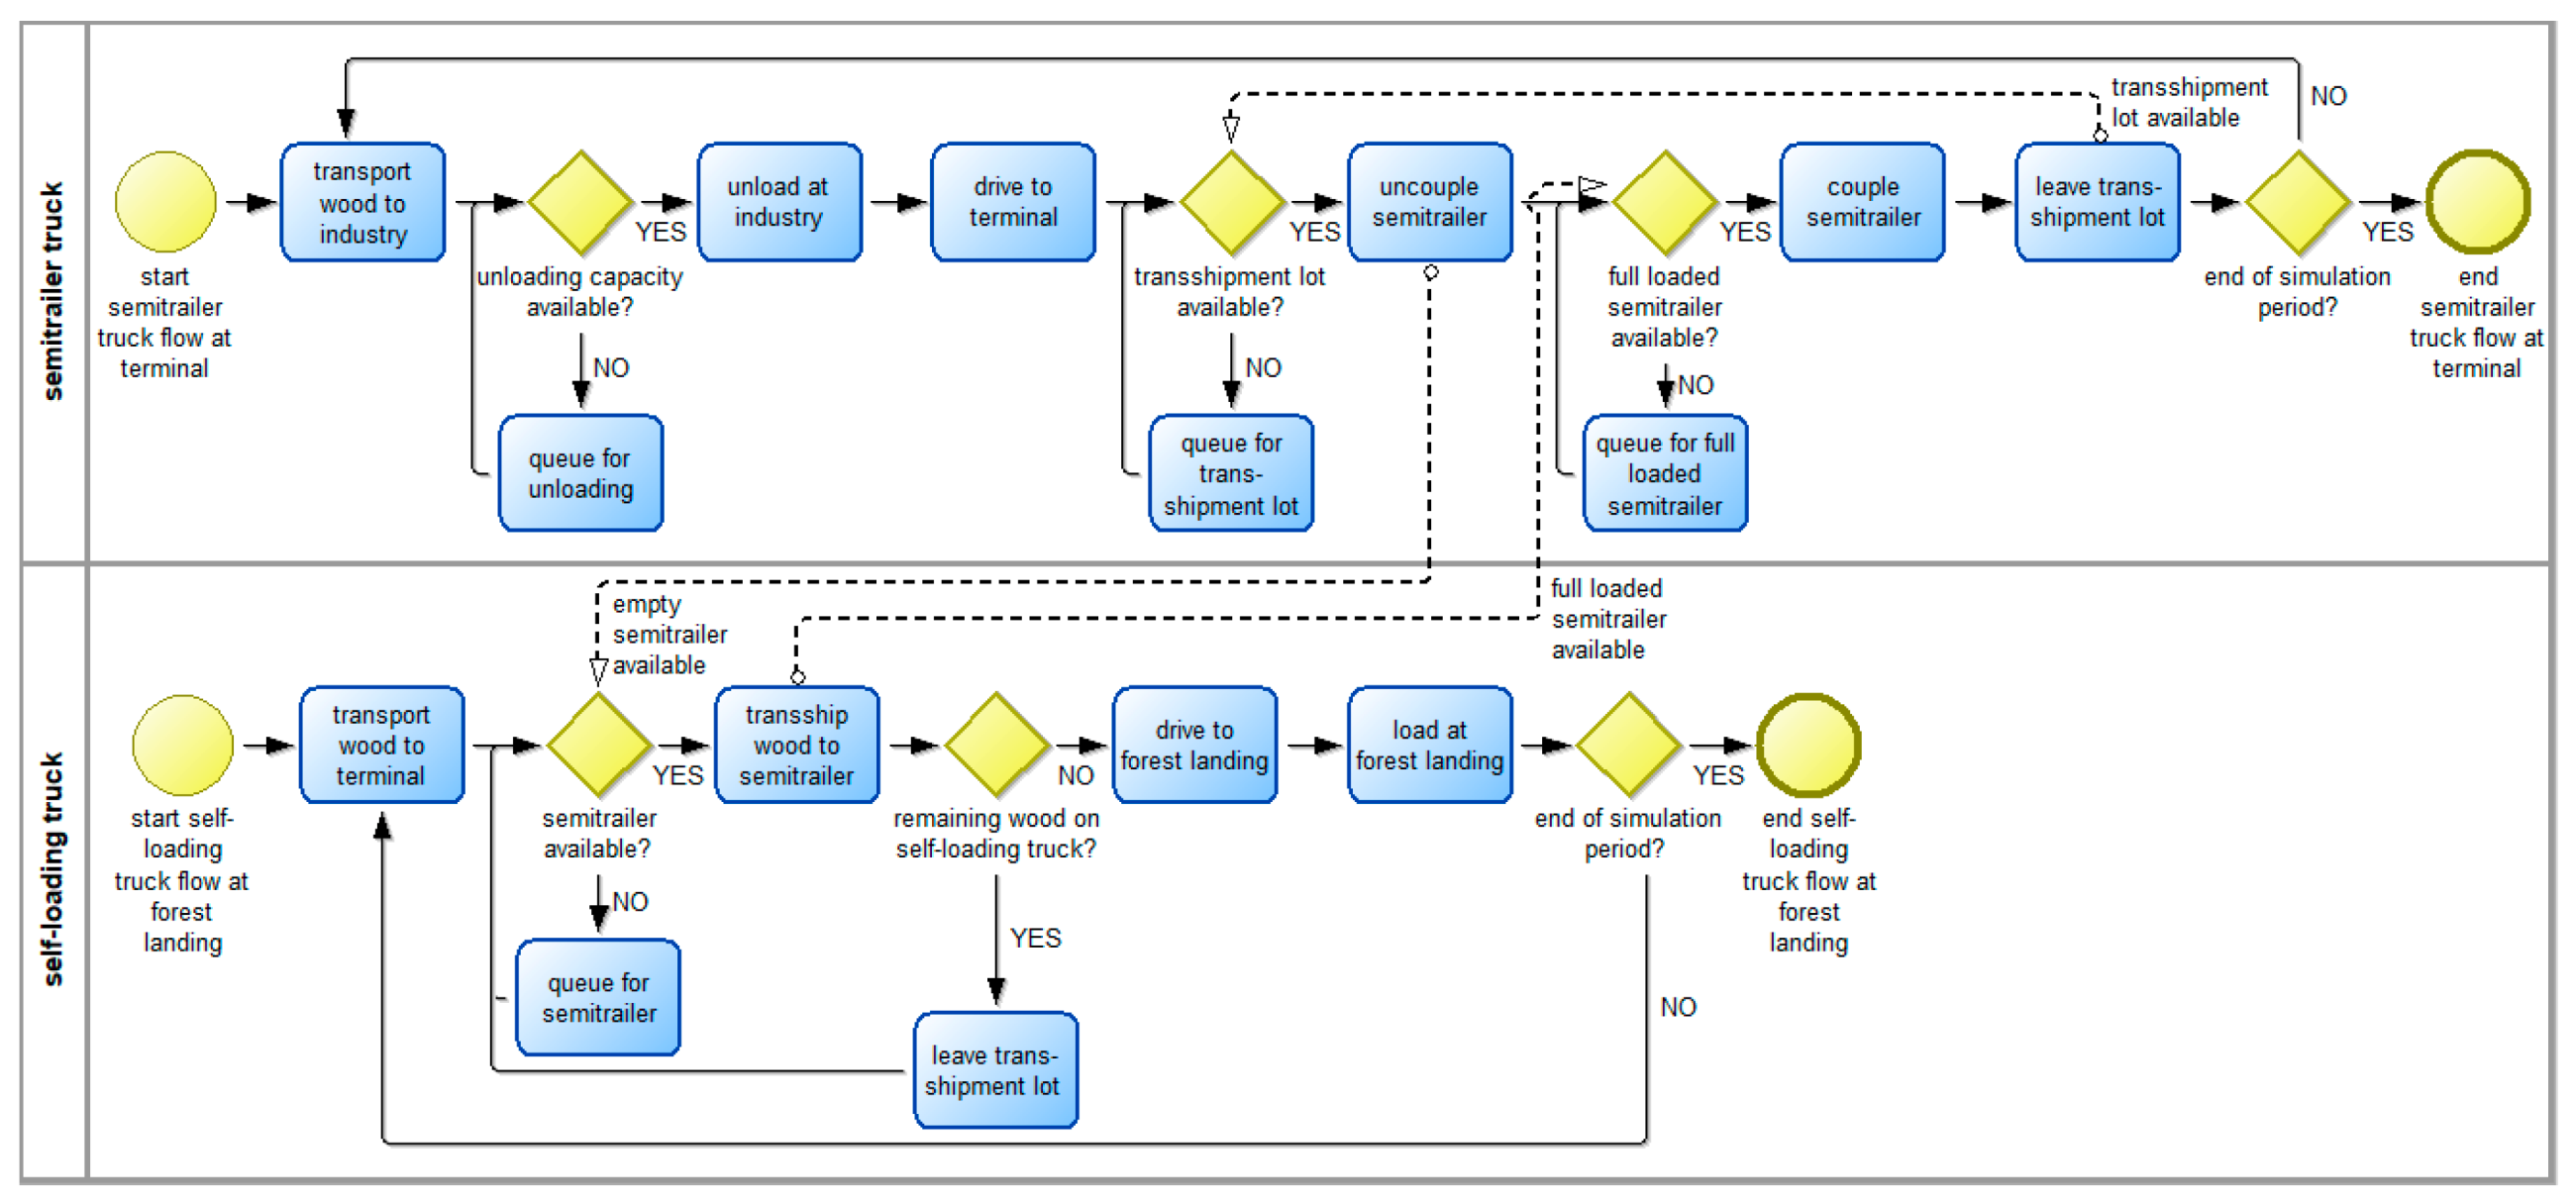
Transport processes (Figure 3) include interactions between self-loading trucks, prime mover trucks and semitrailers. Self-loading trucks transport timber from forest landings and transship it to semitrailers at the truck terminal. If empty or partly loaded semitrailers are not available for transshipment at a transshipment lot, the self-loading truck joins a queue at the terminal. In the model, there is no possibility to store timber at the terminal. A semitrailer can only be loaded by one self-loading truck at a time. If multiple semitrailers are available at the terminal, the self-loading truck transships to the semitrailer with the lowest residual loading capacity. A self-loading truck that has fully loaded a semitrailer, but still carries timber, drives to the next available semitrailer, or, if no semitrailer is available, queues at the terminal. Fully loaded semitrailers are picked up by prime mover trucks to be transported to industry, where they queue for unloading. The transport of timber to industrial locations is carried out exclusively with semitrailer trucks and not with self-loading trucks (i.e., the only exemption is the simple unimodal transport scenario to provide a benchmark to calculate resource and time savings). Semitrailer trucks are either on their way to the terminal with an empty semitrailer or on their way to industry with a fully loaded semitrailer. After dropping off an empty semitrailer at the terminal, prime mover trucks only leave the terminal coupled to a fully loaded semitrailer. If an empty semitrailer cannot be dropped off (i.e., because none of the four transshipment lots is available), the semitrailer truck queues at the terminal. The prime mover truck queues at the terminal, if no fully loaded semitrailer is available to be picked up. The resulting queues follow the first in first out principle.
2.3. Simulation Model
The DES model was created with the AnyLogic software (i.e., 8.5.2 University) and contains modules for forest, terminal and industry. It consists of 31 adjustable input parameters, 11 java functions, 31 global variables, 11 lists, 9 schedules and 34 database elements. A standard assortment of timber represents the transported good in solid cubic meters as well as in t with a parameterizable conversion factor. The parameterizable daily worktimes of semitrailer trucks and self-loading trucks are shifted by one hour so that the self-loading trucks start one hour earlier.
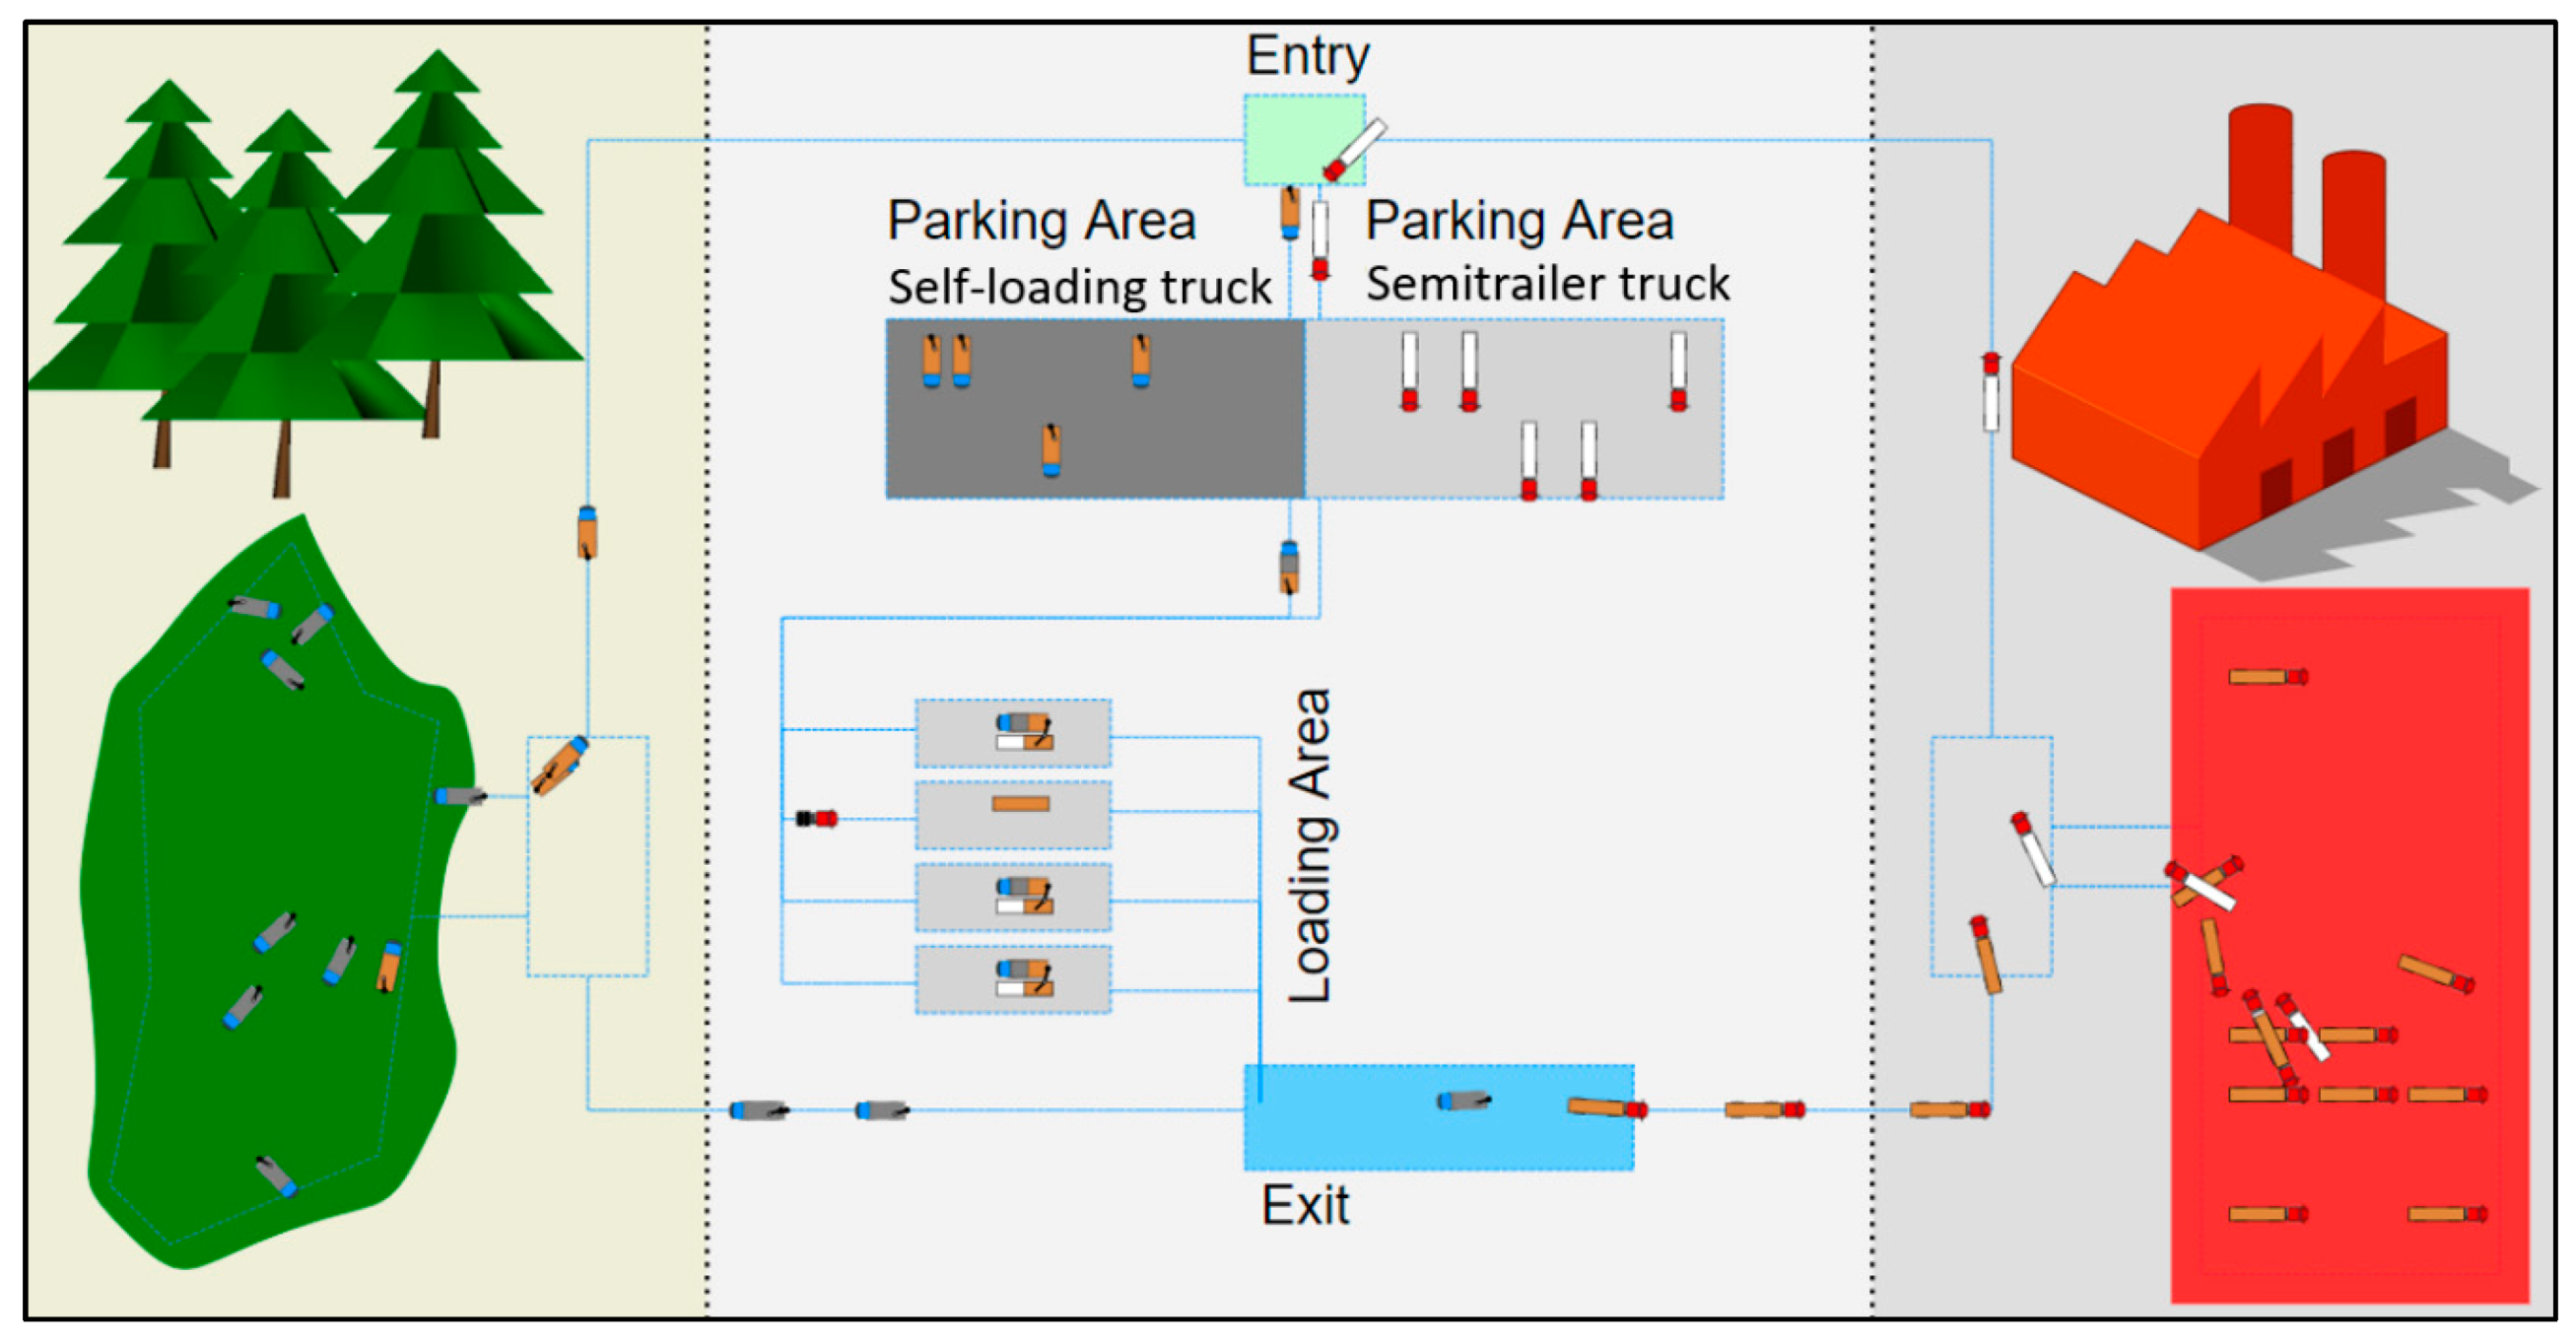
The multi-echelon unimodal wood supply chain includes a truck terminal with four transshipment lots at the loading area, but no stockyard. The animation view (Figure 4) shows the flow of timber and transport vehicles from the forest (green area) through the truck terminal (gray area) to the industry (red area). Self-loading trucks with a blue cab and black crane (empty with gray loading space, partially loaded with gray and brown loading space, and fully loaded with brown loading space) move between forest and terminal, where they queue at the parking area for self-loading trucks or transship timber to semitrailers at the transshipment lots. During transshipment, the color of semitrailers changes from white (empty) to white and brown (partially loaded) and finally to brown (fully loaded). Prime mover trucks with red cab queue at the parking area for trucks, pick up fully loaded semitrailers at the loading area or transport timber to the industrial location. After they return to the terminal with an empty semitrailer, they drop off empty semitrailers at available transshipment lots at the loading area or otherwise queue at the parking area for trucks.
In order to establish credibility for the truck terminal concept, great efforts were invested verifying the simulation model to deliver reliable results. This included a variety of recommended methods [9,23,24] such as structured programming, step-by-step walkthroughs, expert involvement, visualization and animation, statistical analysis and assumption documents. The java code, flow charts and animations were reviewed regularly and documented properly. Interim results were verified by manual calculations, component testing, trace-driven debugging and modular design. Extreme scenarios with very high and very low parameter setting were used as well as warming up periods and frequent reruns of experiments.
The truck terminal concept had to be validated like a new logistical system because the most reliable validation technique, the comparison of simulation results with real world data [23], could not be carried out. None of the few trucking enterprises in Austria applying this transport concept were willing to deliver data to validate the model, which nourishes at least the assumption that this logistical concept can be a competitive advantage. Furthermore, results could not be validated with other simulation models [24] as this work is a new concept for timber transport in mountainous regions. Nevertheless, different validation methods were successfully applied allowing the model to be considered valid within the study scope. This included conceptual validation and documentation of assumptions, structure, logic, causal relations, input data, graphs and charts of output data in regular meetings and discussions with experts [9,23,24]. Moreover, a single factorial design was chosen for sensitivity analysis, where only one input parameter was changed per run and inconsistent results were discussed with scientific and industry experts. Parameterization of sensitive parameters was undertaken with great care and resulted in different scenario settings for short, medium and long driving times from forest landings to truck terminal as well as two different payloads for self-loading trucks.
2.4. Parametrization
Parameters for process times, weights, costs and working times are based on literature [10,11], case studies, expert interviews as well as applicable European and Austrian laws. In order to focus on mountainous regions, where space is usually limited, a small terminal with four transshipping lots, but no stockyard area, was selected from both industry experts and scientists to study the design of an multi-echelon unimodal wood supply chain, find an optimal truck fleet configuration and observe its performance. The parameterizable conversion factor of 1.3 (volume in solid cubic meter per mass in t) was used to include an average moisture content to convert amounts of wood from the ton-based model in solid cubic meters, which is the commonly used unit along the Austrian wood supply chain.
According to European law, the maximum driving time per day in the model was set to nine hours for both self-loading truck and semitrailer truck drivers. The maximum working time for truck drivers in the model was set to 10.5 h to strictly implement the required 45 min break per 4.5 h driving time according to Austrian law (i.e., for simplification, the breaks reduced the maximum permitted working time from 12 h to 10.5 h). Work breaks were implemented between working days and on weekends.
Triangular distributions (minimum/mode/maximum) were used for loading, unloading, transshipping and driving times (Table 1) as their duration also varies in reality. The process time of self-loading trucks for loading wood at the forest (30/45/90 min) is wider spread than the transshipping time at the terminal (30/35/40 min) because, in mountainous regions, it is rather common that logs need to be picked up at various landings along forest roads to fully load a self-loading truck. Duration refers to the transshipping of an entire self-loading truck load of 24 t (i.e., 20 t tare weight and 44 t legal gross vehicle weight applicable within a 100 km linear distance from forest to destination). Transshipping time per t is calculated by dividing the average time for loading by the maximum amount of wood on a self-loading truck (e.g., 35/24 = 1.46 min/t). The total transshipping time is found by multiplying the transshipping time per t with the remaining tons of loaded timber on a self-loading truck. A triangular distribution for unloading at industrial locations considers time to fill out a delivery note and to unload the semitrailer as well as potential long queuing times at industrial plants during calamities. Moreover, supplying different industries in the region is abstracted by a triangular distribution for the driving time of semitrailer trucks between terminal and industry. The pick-up and drop-off times of semitrailers as well as the inbound drive time of semitrailer trucks in the terminal are very short and, therefore, do not noticeably influence results.
Operating costs including vehicle maintenance costs and wages for the drivers are listed in Table 2 for self-loading trucks, semitrailer trucks and semitrailers. Further studies considering costs for the terminal (i.e., construction and operations) are encouraged, since this early study includes no terminal costs as these highly depend on local conditions (e.g., land price) and availability of suitable areas (e.g., abandoned industry plant). Tare weight of a self-loading truck is higher compared to a semitrailer truck because of the additional weight for crane and all-wheel drive (Table 3).
Legal gross vehicle weight for trucks in Austria is 40 t, but exceptions allow higher weights (44 t) for self-loading trucks transporting timber within a 100 km distance from forest to final destination or to the next train terminal. Moreover, after natural calamities such as heavy windstorms and threatening bark beetle infestations, local authorities can temporarily raise this limit up to 50 t or extend the range limit of 100 km.
2.5. Scenario Design
Scenario design for extensive simulation experiments was developed by comprehensive sensitivity analysis and case studies. Therefore, observations focus on the impact of delivery time from forest to terminal, truck payloads and transshipment volume on the optimal truck fleet configuration regarding the number of self-loading trucks, prime mover trucks and semitrailers.
Based on data for an appropriate case study [11], three different triangular distributions for short, medium and long driving times of self-loading trucks from forest landings to the terminal were defined. Payload scenarios cover the most relevant transport weight limit for self-loading trucks in Austria (maximum weight: 44 t, tare weight 20 t, payload 24 t) as well as an exceptional weight limit (maximum weight 50 t, tare weight 20 t, payload 30 t) partly granted by local authorities as an exemption clause after, e.g., massive windthrow with bark beetle hazard (i.e., for 50 t the transshipping time at the terminal was proportionally adjusted). Sensitivity analyses of extensive preliminary simulation runs indicated that, beginning with 92% of the maximum terminal transshipment capacity, a strong flattening of increase in the amount of transported wood began. Consequently, this amount was used for the high transshipment volume scenario (92%) representing an efficient maximum utilization of a truck terminal (e.g., after windstorms or bark beetle infestations). For regular wood production in mountainous regions, a low transshipment volume scenario with 50% of the maximum terminal transshipment capacity was also considered. Moreover, unimodal truck transport set the benchmark to calculate resource and time savings of the innovative truck terminal concept. This scenario design leads to 12 scenario combinations (Table 4) covering various logistical cases and facilitating a robust evaluation of the truck terminal concept.
3. Results
3.1. Optimal Truck Fleet Configuration (RQ1)
Simulations were run on the basis of a full enumeration of potential fleet configurations (i.e., the number of self-loading trucks, prime mover trucks and semitrailers) to provide the optimal truck fleet configuration for the truck terminal concept. For each delivery time scenario from forest site to terminal (i.e., short, medium and long), all reasonable truck fleet configurations were simulated separately to set up an enumeration table showing the main key performance indicators (transshipped volume and cost/t) for each prime mover truck, semitrailer and self-loading truck combination.
Therefore, for a fixed number of self-loading trucks, the number of prime mover trucks and semitrailers in the system was steadily increased. The number of prime mover trucks was set to be the number of semitrailers plus one since, if these two numbers were equal, semitrailers would never be uncoupled and a semitrailer truck would wait in the terminal to be loaded. That would be a so-called hot chain. Here, a cold supply chain with uncoupled semitrailers, which are waiting to be loaded at the transshipping lot, was preferred, as a cold chain reduces coordination effort, increases the flexibility of involved carriers and also the first practical experiences with hot chains under Austrian conditions were underperforming [25].
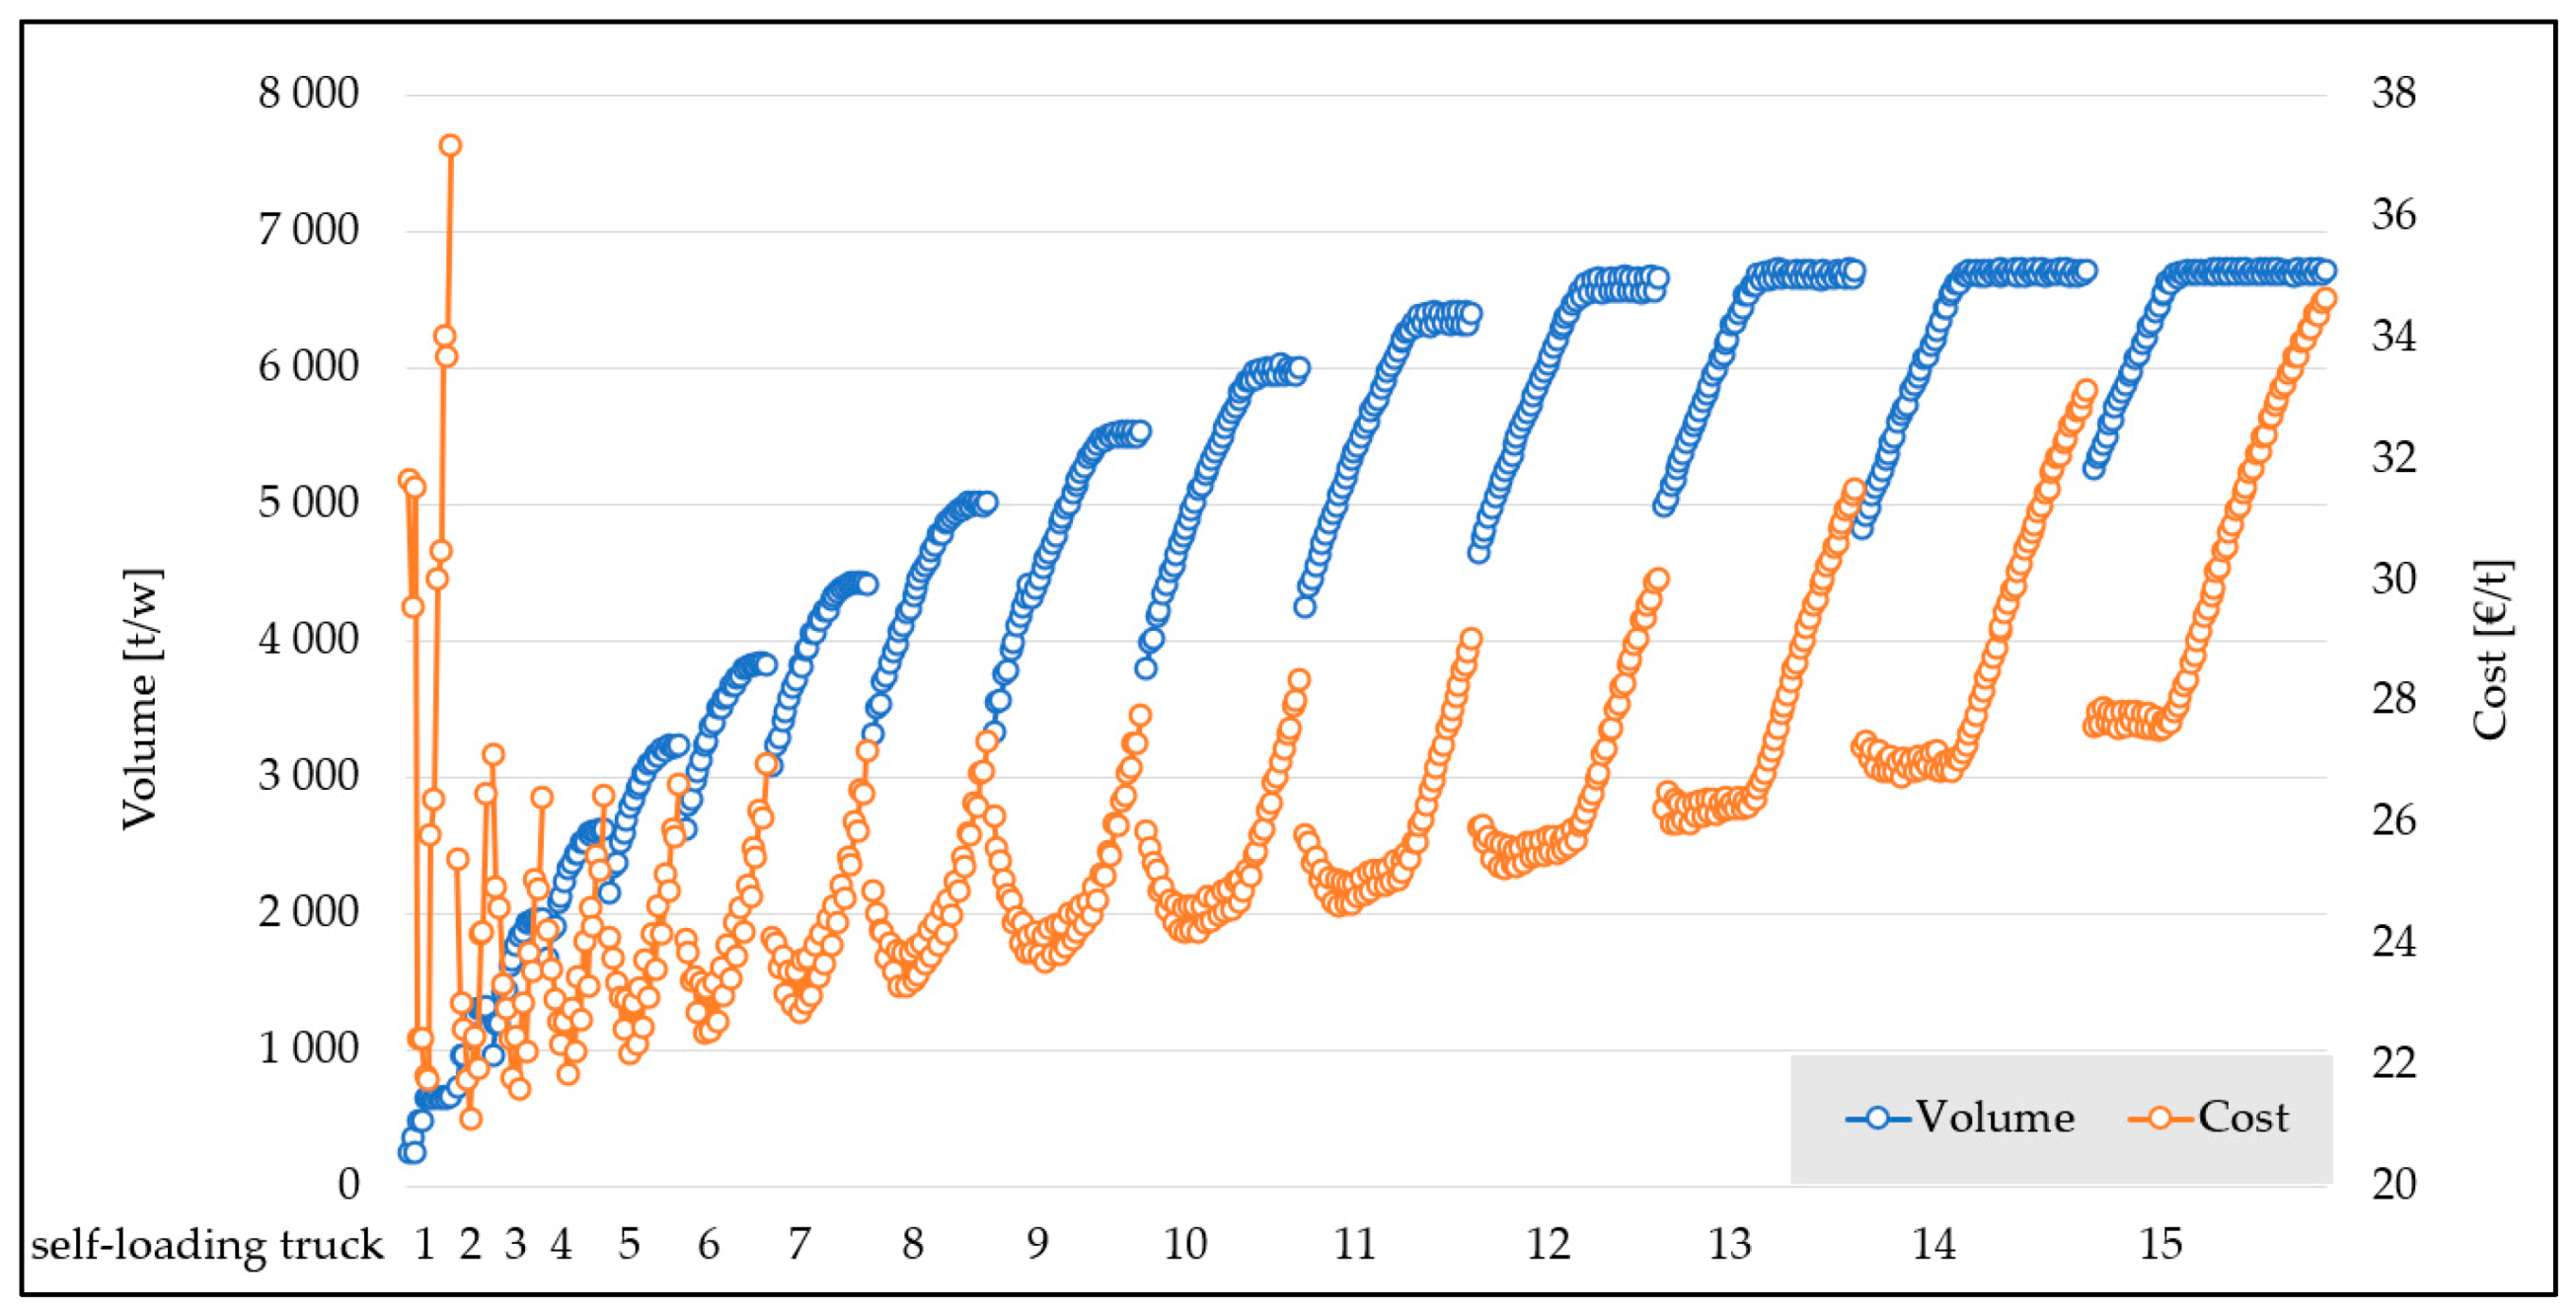
Reducing the results of the full enumeration by deleting worse performing combinations provides a better overview on well-performing truck fleet configurations (Figure 5). Increasing the number of prime mover trucks and semitrailers for a fixed number of self-loading trucks leads to a steady increase of transported volume until the maximum transshipment capacity is reached. From this point on, adding prime mover trucks and semitrailers only increases both queuing time and costs, but no additional volume can be transshipped. Raising the number of self-loading trucks boosts the transshipment capacity until the maximum terminal capacity is reached at 13 self-loading trucks (cf. Figure 5).
3.2. Savings Potentials of Self-Loading Trucks (RQ2)
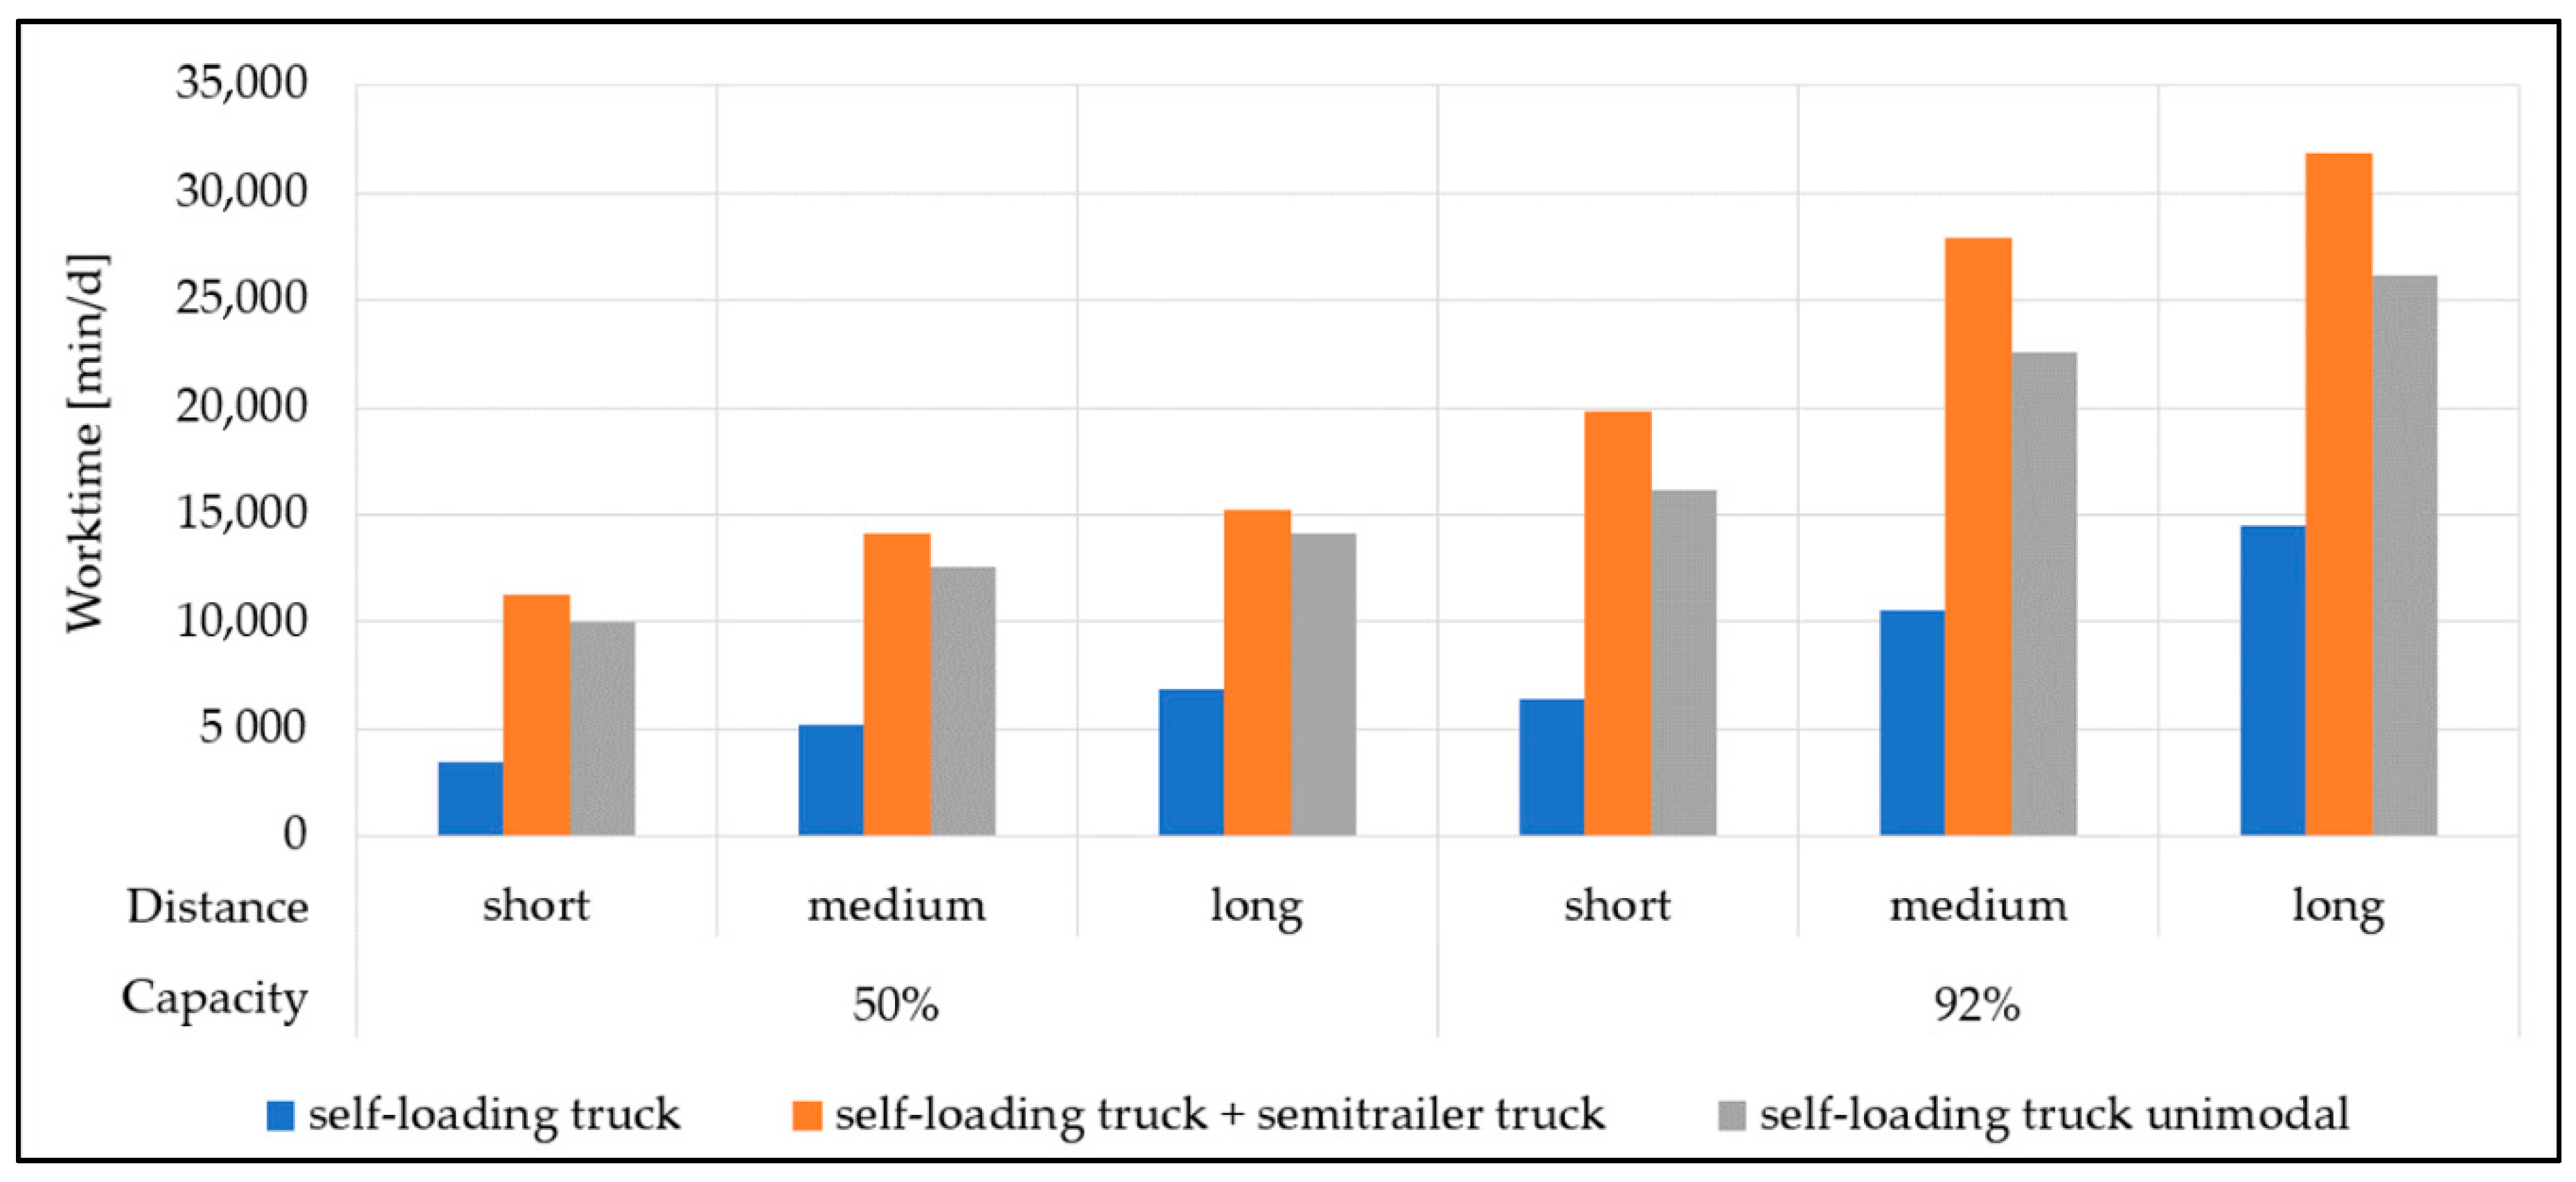
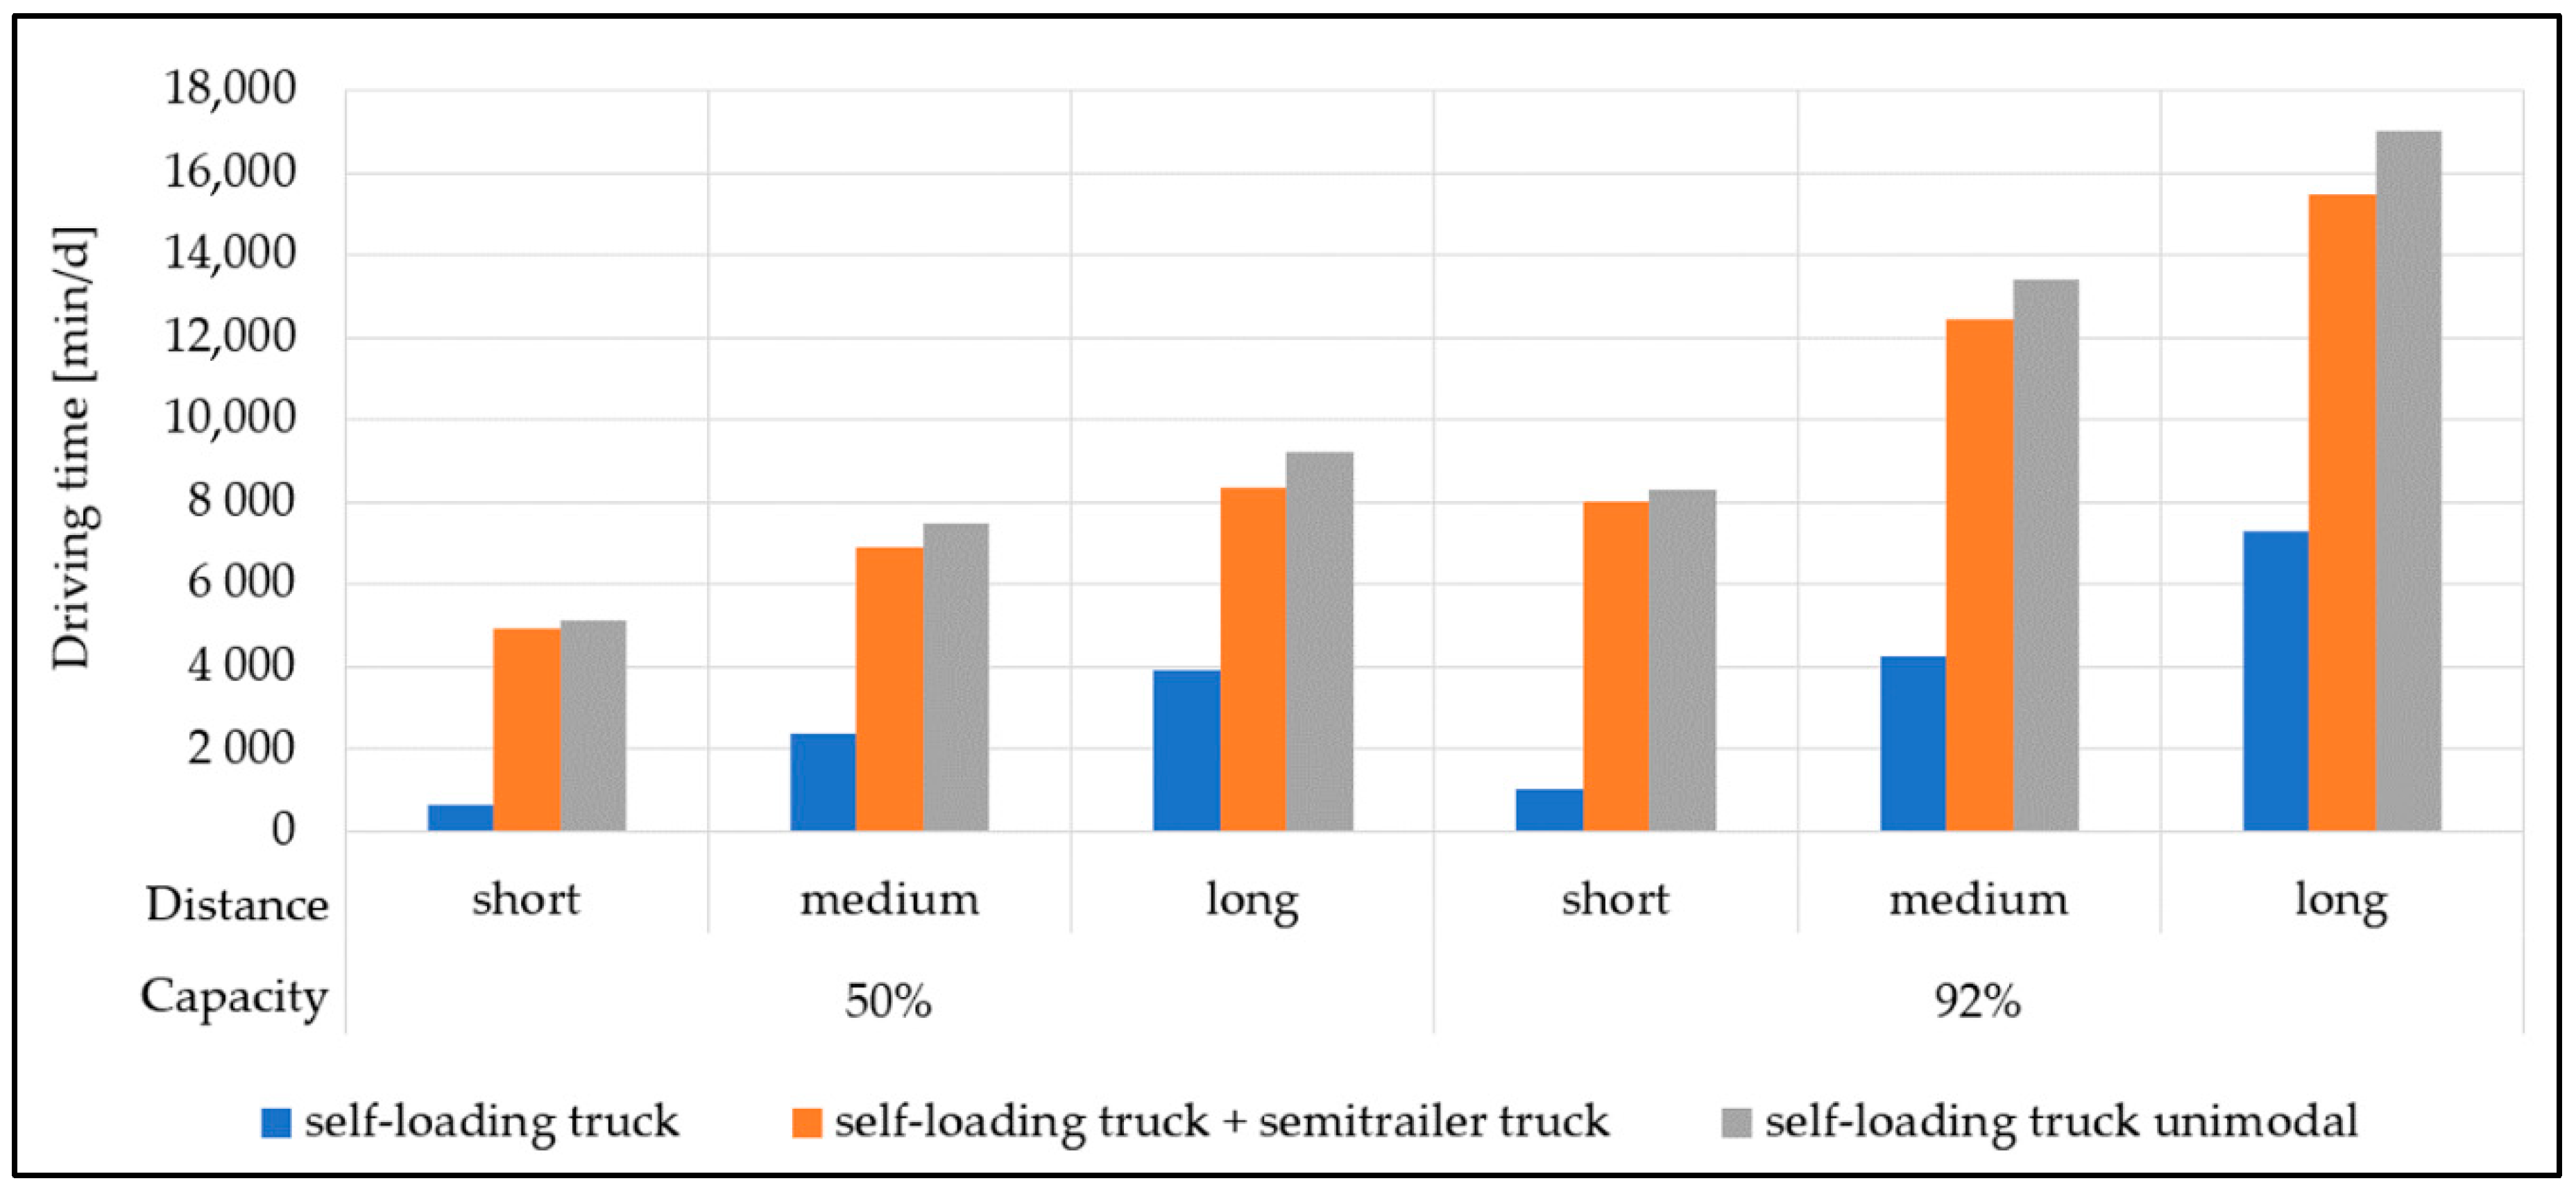
Total working time of the truck terminal concept comprises the sum of driving time (of self-loading trucks between forest and terminal and of semitrailer trucks between terminal and industrial plants) plus times for queuing in the terminal plus loading times in the forest and industrial plants and transshipment times at the terminal. For the unimodal supply chain, working time consists of loading times in the forest and the industrial plant plus driving times between the forest and the industry plant. Total working time and driving time are shown separately in the following figures (Figure 9 and Figure 10).
In all three delivery time scenarios, self-loading truck usage is less for the multi-echelon unimodal supply chain. Potential savings in terms of self-loading truck used were calculated based on savings in total work time (Table 5). Within the full enumeration of potential self-loading truck, semitrailer and prime mover truck configurations, the best-performing combinations in terms of cost/t were selected. The according optimal fleet configurations, for examples, provided in Figure 9 and Figure 10 can be found in Table 5.
3.3. Impacts of Increasing the Legal Truck Weight (RQ3)
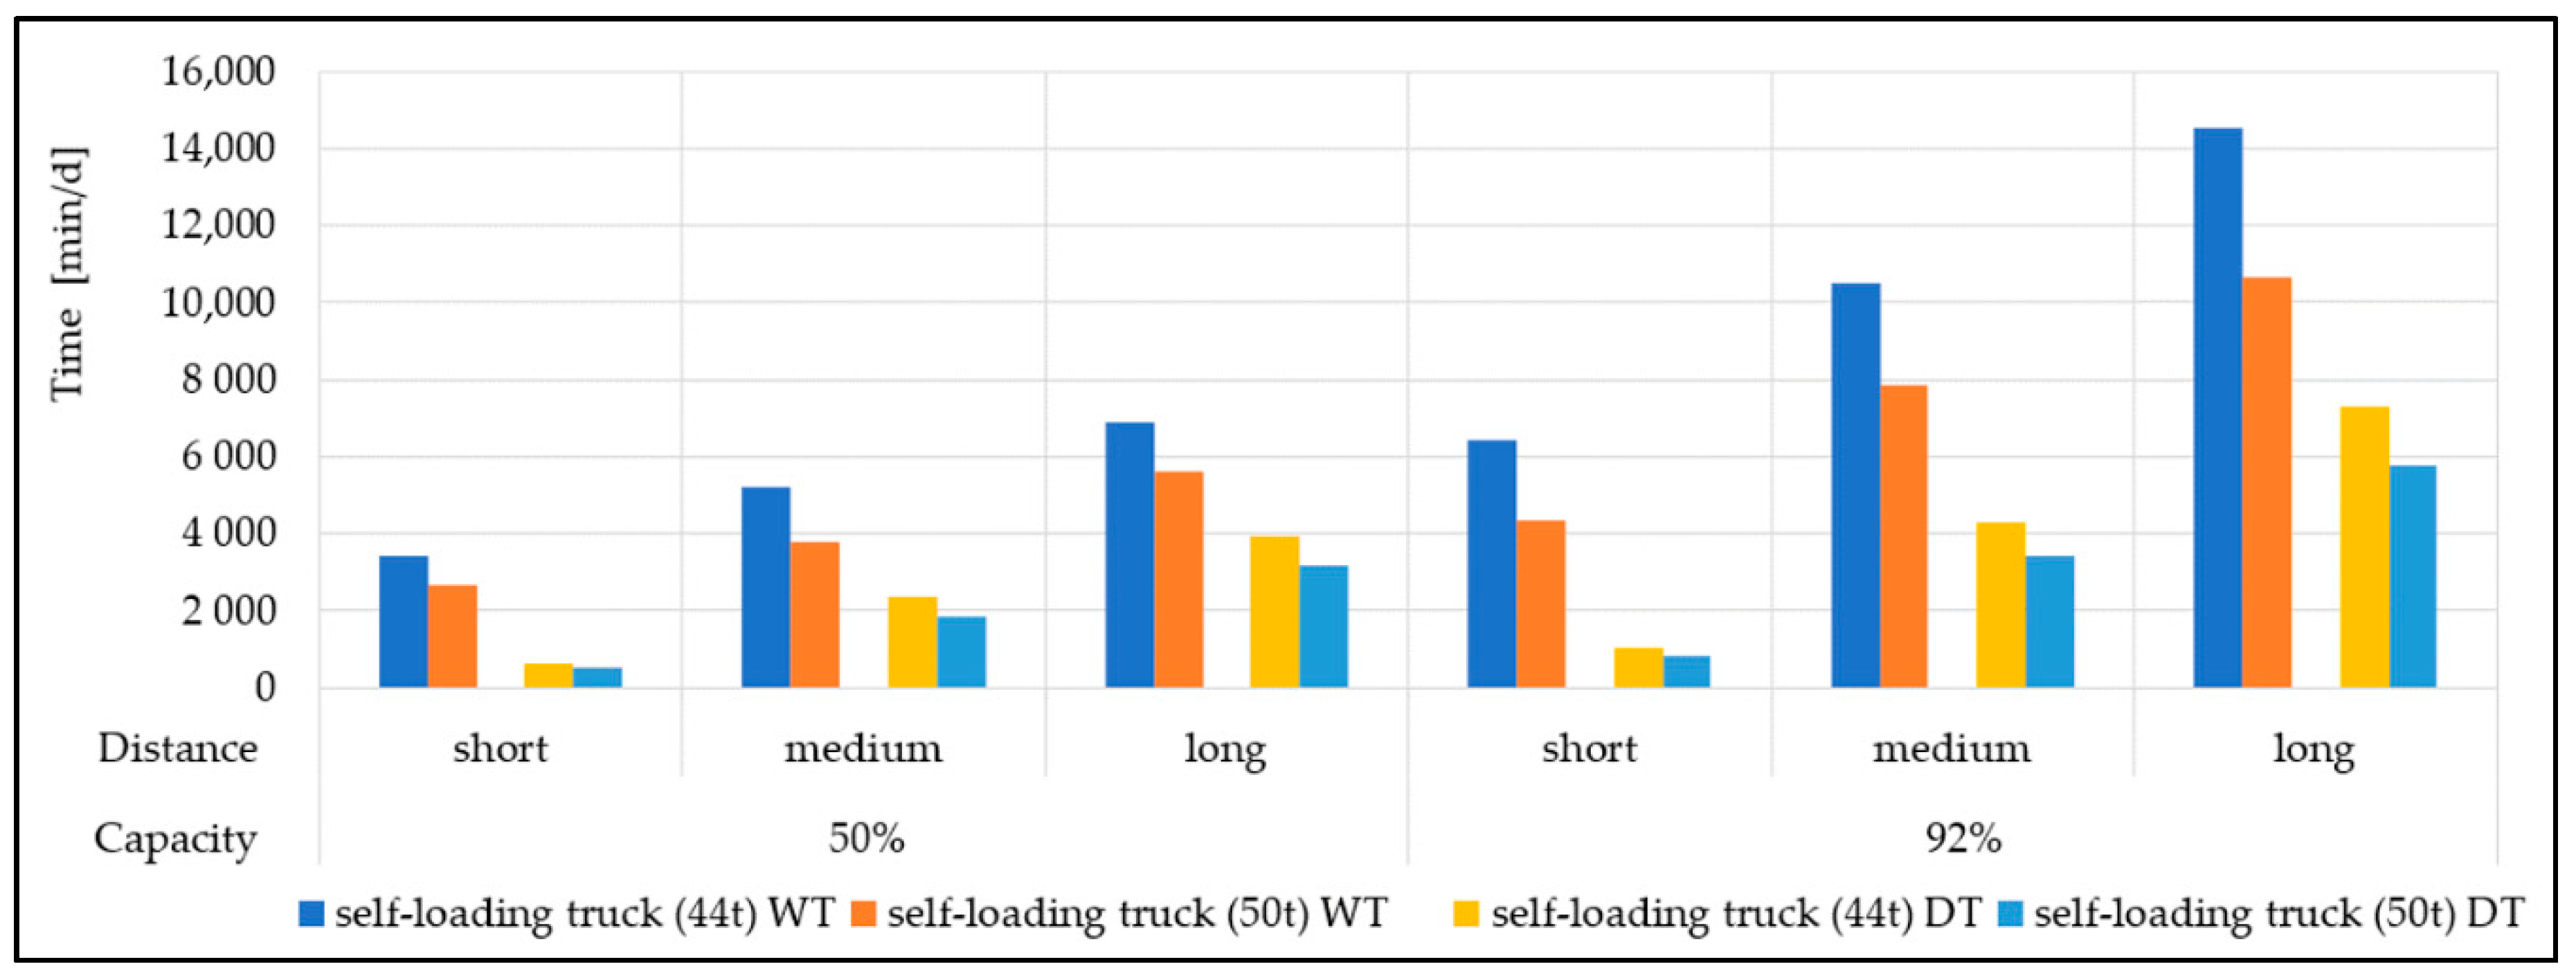
The impact of raising the legal truck weight from 44 to 50 t on the truck terminal performance was calculated by recording driving and total work times as well as costs in the simulation runs (Figure 11).
Based on the comparison of the two self-loading truck payload performances, potential savings of the high payload scenario (i.e., 50 t total truck weight) were calculated (Table 6). Within the full enumeration of potential self-loading truck, semitrailer and prime mover truck configurations, the best-performing combinations in terms of cost/t were selected.
4. Discussion
The results confirm that applying DES to wood supply chains facilitates sensitivity analyses and performance assessments of an innovative logistic concept, as has been shown before for high-capacity trucks [13,14] or train terminals [7,8]. Moreover, the results prove that the developed DES model is able to provide the optimal solution by running a full enumeration of reasonable truck fleet configurations for a defined terminal. Furthermore, next to the optimal solution, several other truck fleet configurations show near-optimal performance. Starting the truck fleet configuration of a truck terminal with a DES-derived optimal or a near-optimal solution provides several advantages such as skipping a costly trial and error phase for balancing transshipment volume and the number of used vehicles starting with a well-performing system that can be fine-tuned to local requirements and supporting investment decisions on terminal infrastructure or, e.g., the number of semitrailers to be bought. A real world truck terminal faces even more problems and uncertainties than those addressed in the proposed DES model, such as truck breakdown or weather conditions suddenly stopping trucking in forest areas (e.g., due to spring thaw or heavy snowfall). Furthermore, the DES model does not cover all measures and information flows available to management for overcoming ad hoc problems such as sudden adjustment of the truck fleet by calling truck drivers on the phone and directing them to new transport jobs.
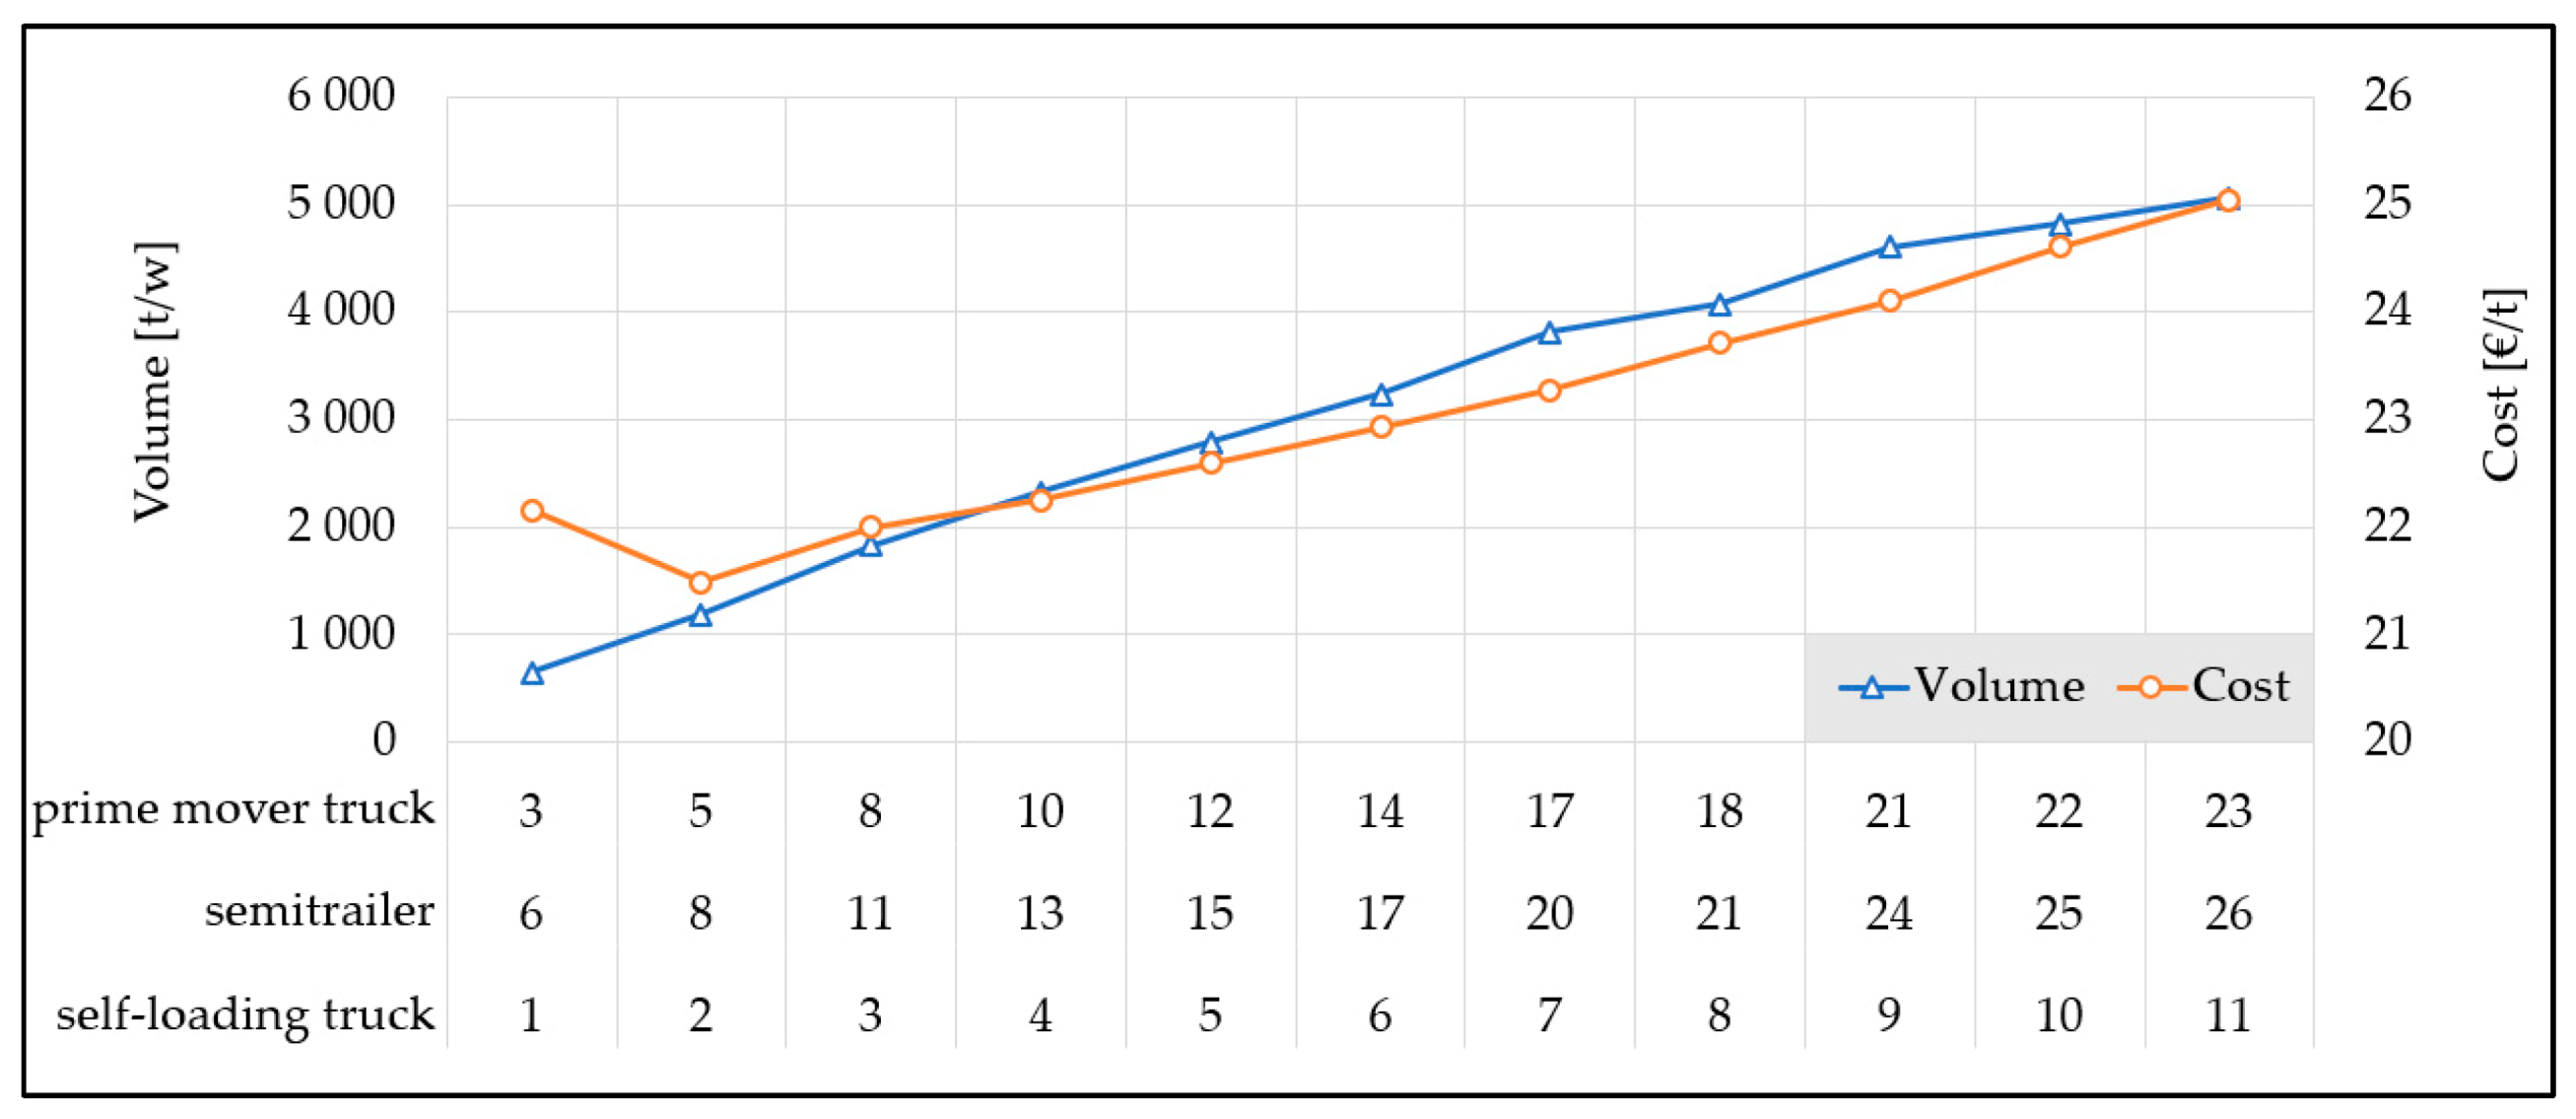
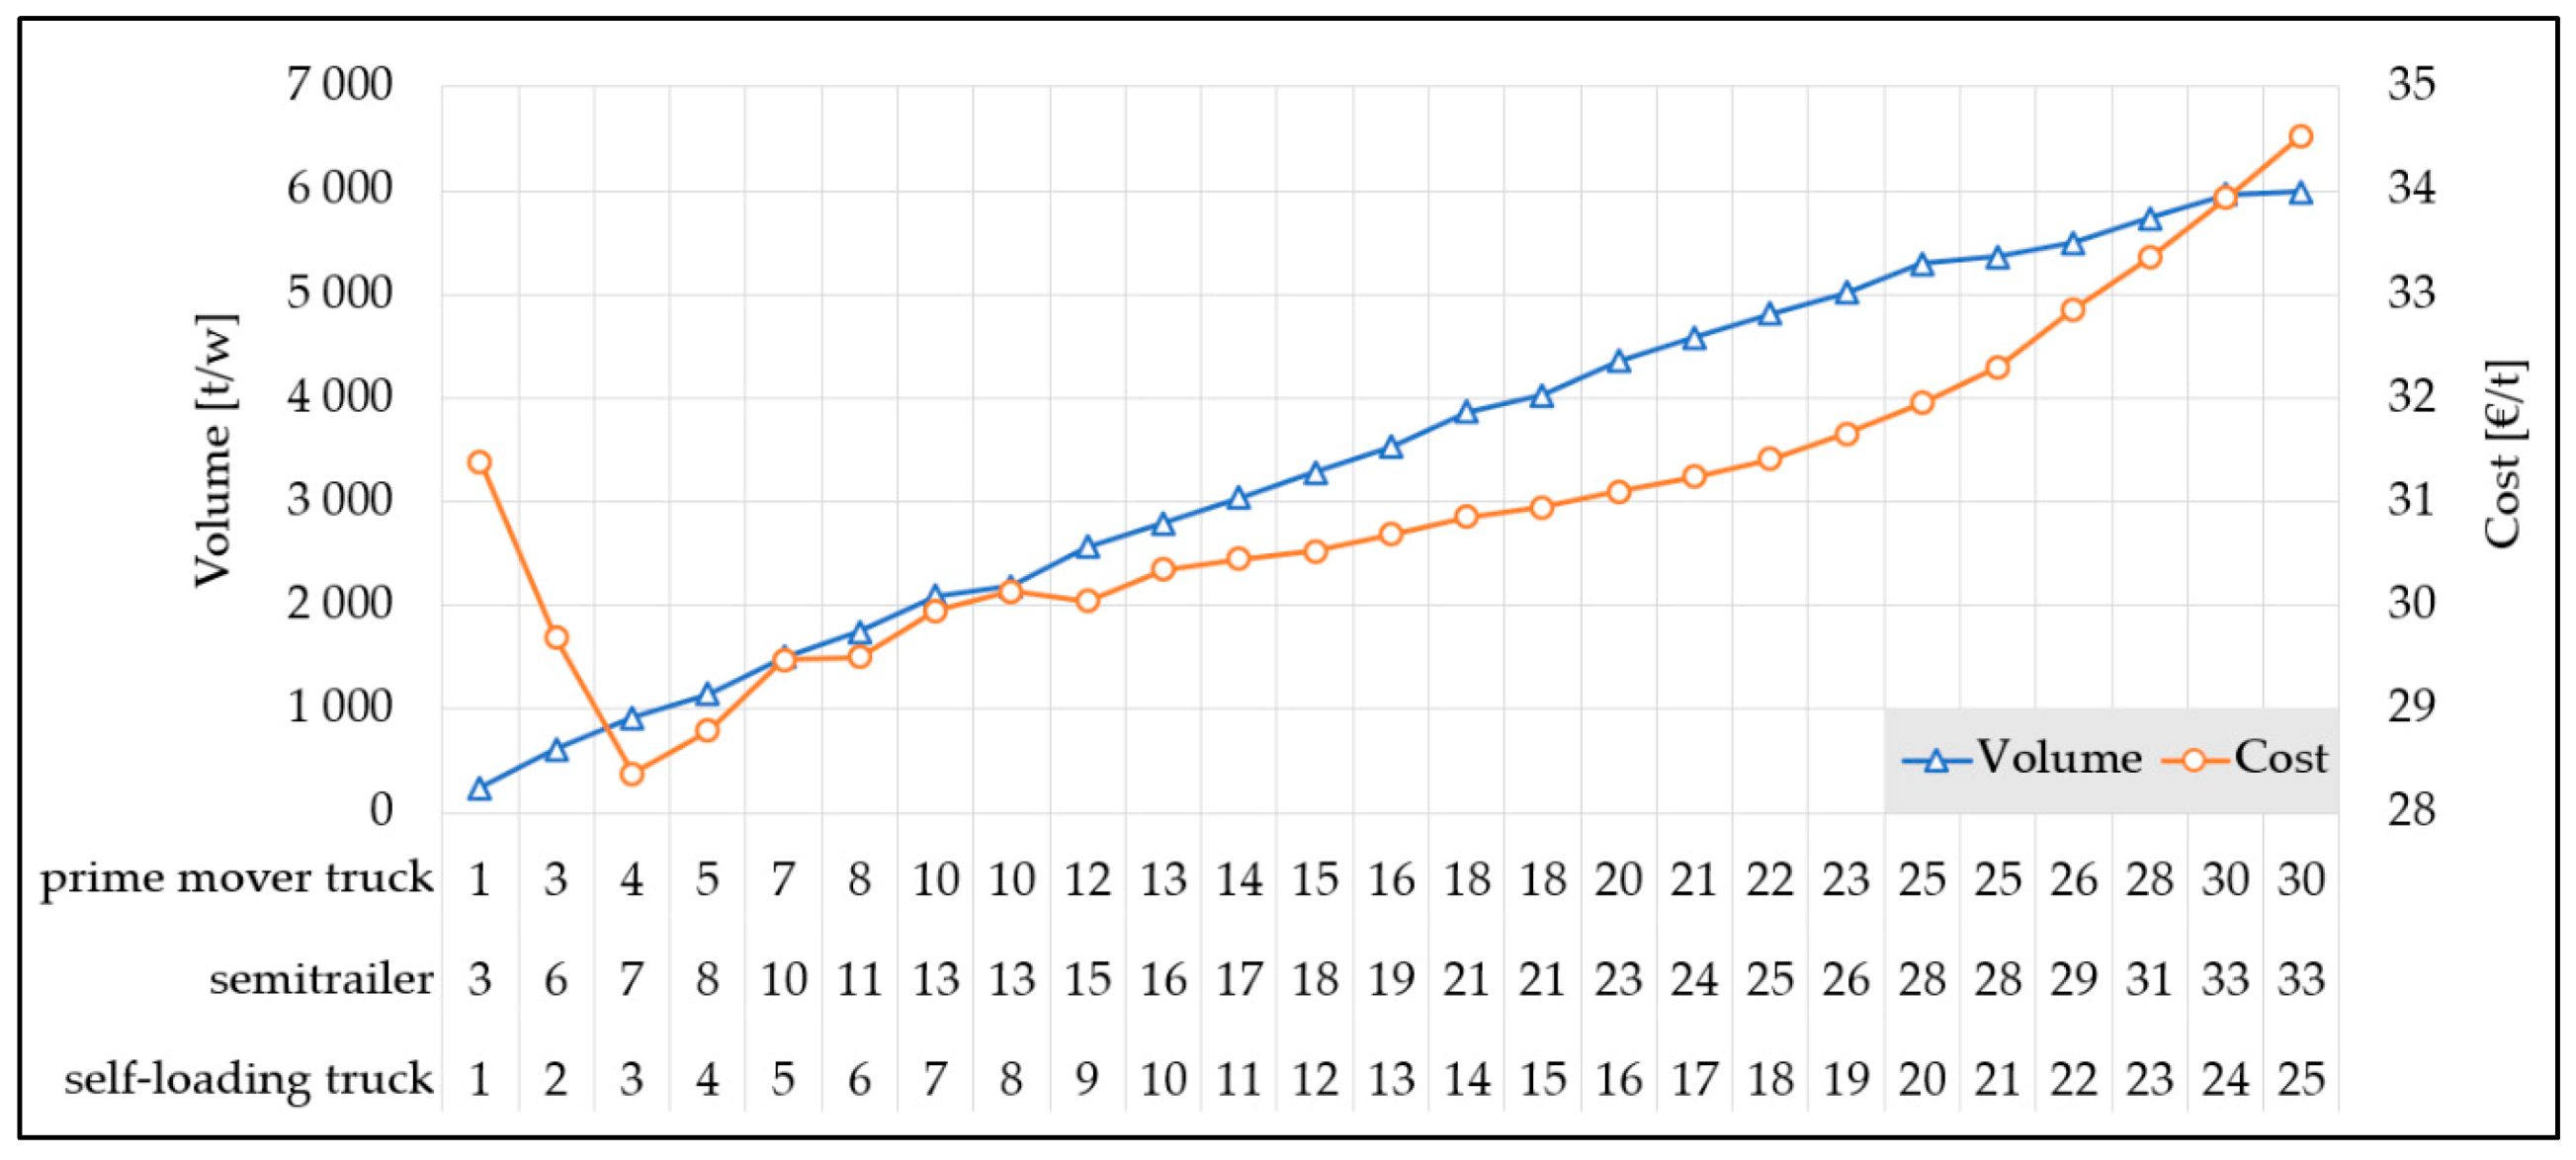
The simulation model proved to provide key performance indicators (e.g., cost and transshipped volume) for a plentitude of scenarios and, therefore, support insight analyses of the impact of different parameter settings. Cost curves show a typical pattern of, at first, increasing the number of self-loading trucks, semitrailers and prime mover trucks leads to a drop in cost until the fleet configuration with minimal cost is reached. Afterwards, adding transport capacity results in increased costs caused by steadily rising queuing times at the truck terminal. Increasing the truck fleet from the point of the optimal solution results in higher queuing times at the truck terminal and, therefore, higher costs that are not compensated by the higher transshipment volume. In contrast, transported volume increases rather constantly until terminal capacity limits further volume increase. From this point on, adding transport capacity in terms of increasing the number of self-loading trucks, prime mover trucks and semitrailers does not have an impact on transshipped volume at the terminal. This situation can be seen in Figure 8 at the very end of the volume curve. Of course, there is always one cost-optimal truck fleet combination, but with increasing the number of self-loading trucks in the system, the number of near-optimal solutions increases. For managerial implications, a wide range of near-optimal solutions means that several well-performing truck fleet configurations are available, increasing planning possibilities.
Applying the truck terminal concept considerably decreases the number of self-loading trucks needed to transport the same volume when compared to the simple unimodal wood transport by self-loading trucks, which is most common under mountainous conditions in Austria as well as in most other European countries. For most delivery time to terminal and terminal transshipment volume scenarios, the reduction is more than 50% (up to negative 63%). Only for the long delivery time scenarios the reduction is slightly lower with 48% for the 50% terminal transshipment volume scenario and 42% for the 92% terminal transshipment volume scenario.
The efficient maximum utilization level of 92% of the maximum terminal transshipment capacity for truck terminals is close to the value of 90%, which was indicated by sensitivity analyses for train terminals (i.e., BEST FIT strategy in [11]). Increasing the legal gross vehicle weight for timber transport from 44 t up to 50 t reduces the number of self-loading trucks needed in the truck terminal concept by 20% to 38%, depending on the scenario setting. For a comparable increase in legal gross vehicle weight in a multimodal wood supply chain, a reduction in truck trips of 17% was reported [11].
Additionally, less self-loading trucks arriving at the terminal also cuts queuing times and reduces transport cost/t by 6% to 11% depending on the scenario setting. A comparable range of cost reduction by increasing gross vehicle weights also was estimated by a DES model for Finnish timber trucks [14]. For a similar supply chain where pulpwood is transshipped at a terminal from forest trucks to high-capacity trucks with a default payload of 68 t, results of a dynamic simulation model indicate a potential for reducing both transport costs and traffic density [13]. Furthermore, increasing legal gross vehicle weight for self-loading trucks contributes to the reduction of the transport-induced emission of CO2, as increasing the load by 10% results in an increase in CO2 emissions of only 1% [18].
Despite all advantages, the truck terminal concept is rarely applied in central Europe, which is, according to trucking enterprises [26], mainly due to investment costs to set up a terminal, additional transshipment costs and the higher organizational complexity of the supply chain compared to the predominant unimodal truck transport.
5. Conclusions
The introduced DES model for unimodal multi-echelon wood transport covering a synchronous transshipment of timber from self-loading trucks to semitrailers at terminals with four transshipment lots was applied to answer three research questions (RQ1–3). The presented optimal truck fleet configurations (Table 5 and Table 6) for short, medium and long delivery time to terminal and low and high transshipment volume scenarios demonstrate the practical relevance and usefulness of the simulation approach. The savings potential of the truck terminal concept in comparison to unimodal transport were proven for working time as well as the number of self-loading trucks (decreased by 42–63%). An increase in the maximal allowable truckload from 44 to 50 t reduces the number of self-loading trucks needed by 20–38% and cuts cost/t by 6–11%, depending on the delivery time to the terminal and transshipping volume.
The truck terminal concept as a novelty for timber transport in mountainous regions proves to be a promising strategy to overcome the actual and ever-increasing bottleneck of self-loading truck drivers in the future. Reducing the number of self-loading truck drivers operating in a mountainous region also allows one to allocate transportation tasks mainly to drivers who know the local forest road network and conditions well, and, therefore, the amount of unproductive time (e.g., for searching wood piles in the forest) can be reduced. Consequently, the presented truck terminal concept combined with analyses for higher gross vehicles are highly promising to help implement infrastructure and logistics improvements (e.g., raise weight limits, improve accessibility to forests of mountainous regions, optimize transport distances) for a sustainable mobilization of wood in Europe [27].
Future research opportunities involve extensions of this study regarding different terminal layouts with a modified number of transshipment lots, available terminal stockyard area or terminal transshipment equipment, including the calculation of costs for terminal construction and operations. Moreover, a hot chain, where semitrailers are not uncoupled and directly loaded, may be of interest for different conditions. Analyzing a truck terminal concept combining multimodal and multi-echelon unimodal transport may be another promising topic for future timber supply chain simulation models.
Author Contributions
Conceptualization, C.K. and P.R.; methodology, C.K. and A.S.; software, A.S.; validation, C.K., P.R. and A.S.; formal analysis, A.S. and P.R.; investigation, C.K., P.R. and A.S.; resources, C.K. and A.S.; data curation, A.S.; writing—original draft preparation, C.K. and P.R.; writing—review and editing, C.K. and P.R.; visualization, C.K., P.R. and A.S.; supervision, C.K. and P.R.; project administration, C.K. and P.R.; funding acquisition, C.K. and P.R. All authors have read and agreed to the published version of the manuscript.
Funding
This research was funded within the collective research project Wood Supply Guidelines for Forest Based Industry (THEKLA) by the Austrian Research Promotion Agency (FFG Project 868013) and the forest, wood, and paper industry consortium (FHP). Open access funding was provided by the BOKU Vienna Open Access Publishing Fund.
Acknowledgments
The authors gratefully acknowledge the technical support regarding building the discrete event simulation model received by Martin Pernkopf.
Conflicts of Interest
The authors declare no conflict of interest.
References
- Palander, T.; Vainikka, M.; Yletyinen, A. Potential mechanisms for co-operation between transportation entrepreneurs and customers: A case study of regional entrepreneurship in Finland. Croat. J. For. Eng. 2012, 33, 89–103. [Google Scholar]
- Malinen, J.; Nousiainen, J.; Palojärvi, K.; Palander, T. Prospects and challenges of timber trucking in a changing operational environment in Finland. Croat. J. For. Eng. 2014, 35, 91–100. [Google Scholar]
- D’Amours, S.; Ronnqvist, M.; Weintraub, A. Using operational research for supply chain planning in the forest products industry. INFOR 2008, 46, 265–281. [Google Scholar] [CrossRef]
- Shahi, S.; Pulkki, R. Supply chain network optimization of the Canadian forest products industry: A critical review. AJIBM 2013, 3, 631–643. [Google Scholar] [CrossRef] [Green Version]
- Opacic, L.; Sowlati, T. Applications of discrete-event simulation in the forest products sector: A review. For. Prod. J. 2017, 67, 219–229. [Google Scholar] [CrossRef]
- Saranen, J.; Hilmola, O.-P. Evaluating the competitiveness of railways in timber transports with discrete-event simulation. World Rev. Intermod. Transp. Res. 2007, 1, 445–458. [Google Scholar] [CrossRef]
- Wolfsmayr, U.J.; Merenda, R.; Rauch, P.; Longo, F.; Gronalt, M. Evaluating primary forest fuel rail terminals with discrete event simulation: A case study from Austria. Ann. For. Res. 2016, 59, 145–164. [Google Scholar] [CrossRef]
- Gronalt, M.; Rauch, P. Analyzing railroad terminal performance in the timber industry supply chain—A simulation study. Int. J. For. Eng. 2018, 29, 162–170. [Google Scholar] [CrossRef]
- Kogler, C.; Rauch, P. Discrete event simulation of multimodal and unimodal transportation in the wood supply chain: A literature review. Silva Fenn. 2018, 52, 29. [Google Scholar] [CrossRef]
- Kogler, C.; Rauch, P. A discrete event simulation model to test multimodal strategies for a greener and more resilient wood supply. Can. J. For. Res. 2019, 49, 1298–1310. [Google Scholar] [CrossRef]
- Kogler, C.; Rauch, P. Contingency plans for the wood supply chain based on bottleneck and queuing time analyses of a discrete event simulation. Forests 2020, 11, 396. [Google Scholar] [CrossRef] [Green Version]
- Kogler, C.; Rauch, P. Game-based workshops for the wood supply chain facilitate knowledge transfer. Int. J. Sim. Mod. 2020, 19, 446–457. [Google Scholar] [CrossRef]
- Korpinen, O.-J.; Aalto, M.; Venäläinen, P.; Ranta, T. Impacts of a high-capacity truck transportation system on the economy and traffic intensity of pulpwood supply in Southeast Finland. Croat. J. For. Eng. 2019, 40, 89–105. [Google Scholar]
- Väätäinen, K.; Laitila, J.; Anttila, P.; Kilpeläinen, A.; Asikainen, A. The influence of gross vehicle weight (GVW) and transport distance on timber trucking performance indicators—Discrete event simulation case study in Central Finland. Int. J. For. Eng. 2020, 31, 156–170. [Google Scholar] [CrossRef]
- Kyster-Hansen, H.; Sjögren, J. Swedish roadmap for high capacity transport (HCT). In Towards Innovative Freight and Logistics, 2nd ed.; Blanquart, C., Clausen, U., Jacob, B., Eds.; John Wiley & Sons: Hoboken, NJ, USA, 2016; pp. 89–104. [Google Scholar] [CrossRef]
- Laitila, J.; Asikainen, A.; Ranta, T. Cost analysis of transporting forest chips and forest industry by-products with large truck-trailers in Finland. Biomass Bioenergy 2016, 90, 252–261. [Google Scholar] [CrossRef]
- Prinz, R.; Väätäinen, K.; Laitila, J.; Sikanen, L.; Asikainen, A. Analysis of energy efficiency of forest chip supply systems using discrete-event simulation. Appl. Energy. 2018, 235, 1369–1380. [Google Scholar] [CrossRef]
- Klvač, R.; Kolařík, J.; Volná, M.; Drápela, K. Fuel consumption in timber haulage. Croat. J. For. Eng. 2013, 34, 229–240. [Google Scholar]
- Holzleitner, F.; Kanzian, C.; Stampfer, K. Analyzing time and fuel consumption in road transport of round wood with an onboard fleet manager. Eur. J. For. Res. 2011, 130, 293–301. [Google Scholar] [CrossRef]
- Ghaffariyan, M.; Barrier, C.; Brown, M.; Kuehmaier, M.; Acuna, M. A short review of timber truck fuel consumption studies. Ind. Bull. 2018, 21, 1–6. Available online: https://pdfs.semanticscholar.org/6cdd/beff69c68e1c0540608cf7ba68d5393f0c17.pdf (accessed on 12 October 2020).
- Borshchev, A.; Grigoryev, I. The Big Book of Simulation Modeling—Multimethod Modeling with AnyLogic 8. Available online: https://www.anylogic.com/resources/books/big-book-of-simulation-modeling/ (accessed on 12 October 2020).
- Banks, J.; Carson, J.S.; Nelson, B.L.; Nicol, D.M. Discrete-Event System Simulation, 4th ed.; Pearson: Delhi, India, 2004. [Google Scholar]
- Kleijnen, J.P.C. Verification and validation of simulation models. Eur. J. Oper. Res. 1995, 82, 145–162. [Google Scholar] [CrossRef] [Green Version]
- Sargent, R.G. Verification and validation of simulation models. J. Simul. 2013, 7, 12–24. [Google Scholar] [CrossRef] [Green Version]
- Holzer, W.; (Austrian Federal Forests, Purkersdorf, Austria). Personal communication, 2020.
- Hengstberger, W.; (Hengstberger Transport GmbH, Großweißenbach, Austria). Personal communication, 2019.
- Good Practice Guidance on the Sustainable Mobilisation of Wood in Europe. Available online: https://www.unece.org/fileadmin/DAM/timber/publications/wood-mobilization-good-practice-guidance.pdf (accessed on 12 October 2020).
Figure 1.
On the picture from left to right: empty semitrailer, semitrailer truck (prime mover truck coupled to a semitrailer) and self-loading truck.
Figure 1.
On the picture from left to right: empty semitrailer, semitrailer truck (prime mover truck coupled to a semitrailer) and self-loading truck.

Figure 2.
Wood flow from forest via truck terminal to industry.

Figure 3.
Transport processes of self-loading trucks, prime mover trucks and semitrailers.

Figure 4.
Animation view with prime mover trucks (red cab with black hitch), fully loaded (brown loading space) or partially loaded (gray and brown loading space) semitrailer trucks (red cab) and empty (gray loading space) self-loading trucks (blue cab with black crane on the loading space) as well as fully loaded (brown loading space), partially loaded (white and brown loading space) and empty (white loading space) semitrailers.

Figure 5.
Selection of well-performing truck fleet configurations (t/w: tons per week).

Figure 6.
Cost-optimal fleet configuration for short delivery time (t/w: tons per week).

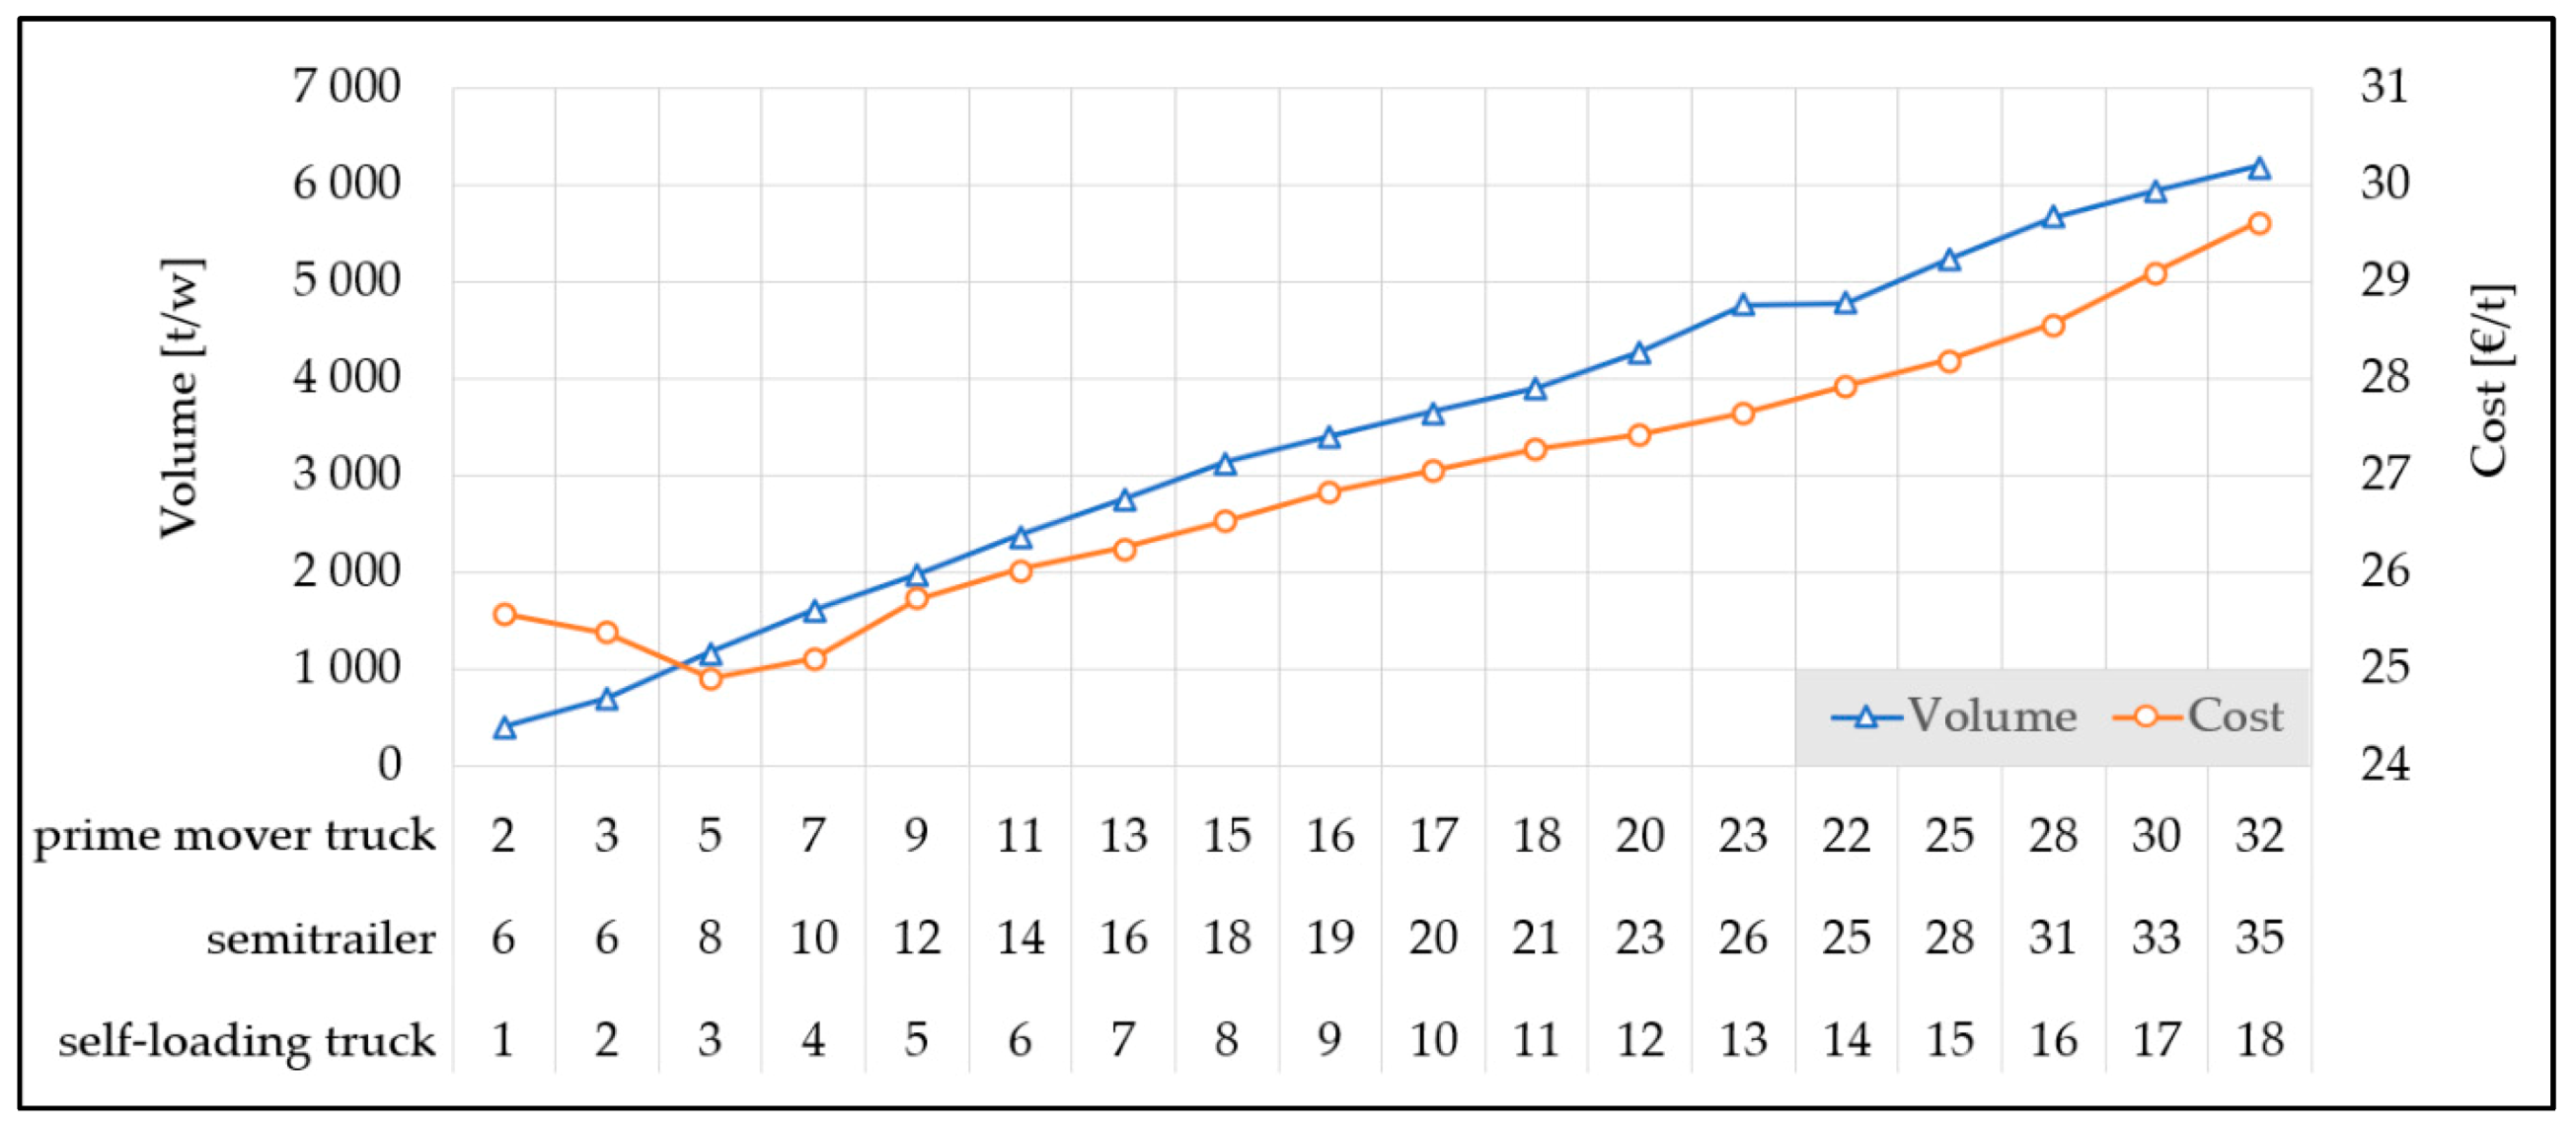
Figure 7.
Cost-optimal fleet configuration for medium delivery time (t/w: tons per week).

Figure 8.
Cost-optimal fleet configuration for long delivery time (t/w: tons per week).

Figure 9.
Total worktime for the terminal concept (self-loading truck + semitrailer truck) with explicit self-loading truck share (self-loading truck) and for the unimodal supply chain (self-loading truck unimodal) for the short, medium and long delivery time scenario and two (50% and 92% of the maximum terminal capacity) transshipment volume scenarios (min/d: minutes per day).

Figure 10.
Driving time for the terminal concept (self-loading truck + semitrailer truck) with explicit self-loading truck share (self-loading truck) and for the unimodal supply chain (self-loading truck unimodal) for the short, medium and long delivery time scenario and two (50% and 92% of the maximum terminal capacity) transshipment volume scenarios (min/d: minutes per day).

Figure 11.
Driving time (DT) and total work time (WT) of self-loading trucks with 44 and 50 t gross vehicle weight for the short, medium and long delivery time scenario and two (50% and 92% of the maximum terminal capacity) transshipment volume scenarios (min/d: minutes per day).
Figure 11.
Driving time (DT) and total work time (WT) of self-loading trucks with 44 and 50 t gross vehicle weight for the short, medium and long delivery time scenario and two (50% and 92% of the maximum terminal capacity) transshipment volume scenarios (min/d: minutes per day).


Table 1.
Processing times of self-loading trucks (SLT) and semitrailer trucks (ST).
| Vehicles | Processes | Process Times in Minutes |
|---|---|---|
| SLT | Load wood at forest | MIN 30/MODE 45/MAX 90 |
| SLT | Transship wood at terminal | MIN 30/MODE 35/MAX 40 |
| ST | Unload at industry | MIN 60/MODE 105/MAX 150 |
| ST | Drive between terminal and industry | MIN 60/MODE 70/MAX 100 |
| ST | Pick-up/drop-off semitrailer | 2 |
| ST | Inbound drive at terminal | 1 |
Table 2.
Costs of self-loading trucks (SLT), semitrailer trucks (ST) and semitrailers (S).
| Vehicle | Unit | Value |
|---|---|---|
| SLT | €/h | 87 |
| ST | €/h | 69 |
| S | €/t | 0.4 |
Table 3.
Weights of self-loading trucks (SLT) and semitrailer trucks (ST).
| Vehicle | Unit | Value |
|---|---|---|
| SLT | tare weight in t | 20 |
| ST | tare weight in t | 16.5 |
| ST | maximum weight in t | 40 |
Table 4.
Twelve scenario settings for the simulation experiments.
| Delivery Time (D) | ||||||
|---|---|---|---|---|---|---|
| 50% Transshipment Volume (V1) | 92% Transshipment Volume (V2) | |||||
| Payload (P) | D1V1P1 | D2V1P1 | D3V1P1 | D1V2P1 | D2V2P1 | D3V2P1 |
| D1V1P2 | D2V1P2 | D3V1P2 | D1V2P2 | D2V2P2 | D3V2P2 | |
Delivery time to terminal: D1 = short (MIN = 5 min/MODE = 10 min/MAX = 15 min), D2 = medium (35/40/45), D3 = long (65/70/75); Transshipment volume: V1 = 50% of maximum transshipment volume, V2 = 92% of maximum transshipment volume; Payload of self-loading trucks: P1 = 24 t, P2 = 30 t.
Table 5.
Cost-optimal fleet configuration with the gross vehicle weight of a self-loading truck of 44 t and potential savings of the terminal concept in terms of work time and the number of self-loading trucks used in comparison to unimodal truck transport.
Table 5.
Cost-optimal fleet configuration with the gross vehicle weight of a self-loading truck of 44 t and potential savings of the terminal concept in terms of work time and the number of self-loading trucks used in comparison to unimodal truck transport.
| Time Forest–Terminal | Relative Volume [% of Max.] | Self-Loading Truck | Semi-Trailer | Prime Mover Truck | Cost [€/t] | Savings in Work Time [min/w] | Savings in Self-Loading Trucks [#] |
|---|---|---|---|---|---|---|---|
| Short | 50 | 6 | 17 | 14 | 23.08 | 32,610 | 10 |
| 92 | 11 | 27 | 24 | 25.02 | 48,520 | 15 | |
| Medium | 50 | 9 | 19 | 16 | 27.29 | 36,930 | 11 |
| 92 | 18 | 34 | 31 | 30.07 | 60,160 | 19 | |
| Long | 50 | 12 | 18 | 15 | 30.91 | 36,300 | 11 |
| 92 | 25 | 34 | 31 | 34.92 | 58,130 | 18 |
Table 6.
Cost-optimal fleet configuration with self-loading truck gross vehicle weight of 50 t and savings by increasing the legal gross vehicle weight for timber transport from 44 to 50 t.
Table 6.
Cost-optimal fleet configuration with self-loading truck gross vehicle weight of 50 t and savings by increasing the legal gross vehicle weight for timber transport from 44 to 50 t.
| Time Forest–Terminal | Relative Volume [% of Max.] | Self-Loading Truck | Semi- Trailer | Prime Mover Truck | Cost [€/t] | Savings in Work Time [min/w] | Savings in Self-Loading Trucks [#] |
|---|---|---|---|---|---|---|---|
| Short | 50 | 5 | 17 | 14 | 21.75 | 3760 | 1 |
| 92 | 8 | 27 | 24 | 23.24 | 10,250 | 3 | |
| Medium | 50 | 7 | 19 | 16 | 25.4 | 7060 | 2 |
| 92 | 14 | 34 | 31 | 27.4 | 13,390 | 4 | |
| Long | 50 | 10 | 18 | 15 | 28.23 | 6450 | 2 |
| 92 | 19 | 34 | 31 | 30.94 | 19,200 | 6 |
Publisher’s Note: MDPI stays neutral with regard to jurisdictional claims in published maps and institutional affiliations. |
© 2020 by the authors. Licensee MDPI, Basel, Switzerland. This article is an open access article distributed under the terms and conditions of the Creative Commons Attribution (CC BY) license (http://creativecommons.org/licenses/by/4.0/).
Share and Cite
MDPI and ACS Style
Kogler, C.; Stenitzer, A.; Rauch, P. Simulating Combined Self-Loading Truck and Semitrailer Truck Transport in the Wood Supply Chain. Forests 2020, 11, 1245. https://doi.org/10.3390/f11121245
AMA Style
Kogler C, Stenitzer A, Rauch P. Simulating Combined Self-Loading Truck and Semitrailer Truck Transport in the Wood Supply Chain. Forests. 2020; 11(12):1245. https://doi.org/10.3390/f11121245
Chicago/Turabian StyleKogler, Christoph, Alexander Stenitzer, and Peter Rauch. 2020. "Simulating Combined Self-Loading Truck and Semitrailer Truck Transport in the Wood Supply Chain" Forests 11, no. 12: 1245. https://doi.org/10.3390/f11121245
Note that from the first issue of 2016, this journal uses article numbers instead of page numbers. See further details here.