Frictional Behaviour, Wear and Comminution of Synthetic Porous Geomaterials
 Amy Hughes1*
  Jackie E. Kendrick1,2
  Anthony Lamur1
  Fabian B. Wadsworth3
  Paul A. Wallace1,4
  Giulio Di Toro5
  Yan Lavallée1
- 1Department of Earth, Ocean and Ecological Sciences, University of Liverpool, Liverpool, United Kingdom
- 2School of Geosciences, University of Edinburgh, Edinburgh, United Kingdom
- 3Department of Earth Sciences, University of Durham, Durham, United Kingdom
- 4Department of Geosciences, Environment and Society, Université Libre de Bruxelles, Brussels, Belgium
- 5Department of Geoscience, University of Padova, Padova, Italy
During shearing in geological environments, frictional processes, including the wear of sliding rock surfaces, control the nature of the slip events. Multiple studies focusing on natural samples have investigated the frictional behaviour of a large suite of geological materials. However, due to the varied and heterogeneous nature of geomaterials, the individual controls of material properties on friction and wear remain unconstrained. Here, we use variably porous synthetic glass samples (8, 19 and 30% porosity) to explore the frictional behaviour and development of wear in geomaterials at low normal stresses (≤1 MPa). We propose that porosity provides an inherent roughness to material which wear and abrasion cannot smooth, allowing material at the pore margins to interact with the slip surface. This results in an increase in measured friction coefficient from <0.4 for 8% porosity, to <0.55 for 19% porosity and 0.6–0.8 for 30% porosity for the slip rates evaluated. For a given porosity, wear rate reduces with slip rate due to less asperity interaction time. At higher slip rates, samples also exhibit slip weakening behaviour, either due to evolution of the slipping zone or by the activation of temperature-dependent microphysical processes. However, heating rate and peak temperature may be reduced by rapid wear rates as frictional heating and wear compete. The higher wear rates and reduced heating rates of porous rocks during slip may delay the onset of thermally triggered dynamic weakening mechanisms such as flash heating, frictional melting and thermal pressurisation. Hence porosity, and the resultant friction coefficient, work, heating rate and wear rate, of materials can influence the dynamics of slip during such events as shallow crustal faulting or mass movements.
Introduction
A spectrum of geohazards and anthropogenic processes are associated with shear, rupture and slip on faults or other slip surfaces. These include earthquakes, volcanic activity, landslides, glacier flow and induced seismicity. Hence, an understanding of the frictional behaviour of geomaterials is essential to resolve the development of faulting events in a variety of environments. Geomaterials vary greatly in their mineralogy and texture, which range from sedimentary and volcaniclastic rocks formed by the deposition, compaction and cementation of grains or fragments during lithification (Lewis, 1984), to igneous rocks formed through cooling with variable degrees of crystallisation and vitrification, causing a range of textures with diverse glass, crystal and bubble contents (e.g., Le Bas and Streckeisen, 1991), and metamorphic rocks formed through recrystallisation (e.g., Schumacher, 1999). This textural and chemical variety leads to differing mechanical properties of rocks as each of the constituent phases have different strength and fracture toughness, dictating the rocks’ mechanical response to slip and comminution (Spray, 1992; Spray, 2010). It is therefore difficult to determine the control each of these variables exerts onto the frictional response of the material. Furthermore, fault slip can generate a substantial amount of frictional heating (Carslaw and Jaeger, 1959). The thermal conductivities and, where relevant, decomposition, breakdown or melting temperatures of each constituent phase of the material also determine the progression of frictional heating during sliding (e.g., Spray, 2010; Wallace et al., 2019a). It is the pairing of comminution with the production and conduction of frictional heat away from the slip interface, determined by the nature of the material, that acts to dissipate the energy of slip events (e.g., Lavallée and Kendrick, 2020 and references therein).
The frictional behaviour of rocks has been studied extensively using field observations (e.g., Sibson, 1994; Di Toro et al., 2005; Di Toro and Pennacchioni, 2005; Mitchell et al., 2016; Hughes et al., 2020), controlled laboratory experiments (e.g., Byerlee, 1978; Marone, 1998; Scholz, 1998; Hirose and Shimamoto, 2005a; Hirose and Shimamoto, 2005b; Di Toro et al., 2006; Di Toro et al., 2011; Kendrick et al., 2014; Hornby et al., 2015; Wallace et al., 2019a), and modelling (e.g., Nielsen et al., 2008; Weng and Yang, 2018). In an early attempt to reconcile laboratory data, Byerlee (1978) advanced that at low slip velocities and shallow crustal conditions (<200 MPa normal stress), the shear resistance (τ) of rocks during slip is proportional to the normal stress (σn), such that:
where µ is the coefficient of friction. At low normal stresses (<200 MPa), coefficients of friction vary around 0.85 with very large scatter (e.g., 0.3 < µ < 3.0 at σn = 5 MPa) and high dependence on surface roughness (Byerlee, 1978). With higher normal stresses (>200 MPa), the friction coefficients of rocks decrease to approximately 0.6 with lower scatter (e.g., 0.57 < µ < 0.62; Byerlee, 1978), unless the rocks are clay-rich, in which case µ may be significantly lower (e.g., Collettini et al., 2009; Ikari et al., 2009; Collettini et al., 2019). Yet, faulting events are dynamic, and as such friction is often expressed via the rate-and-state friction constitutive law, which includes consideration of time, slip velocity and displacement (Dieterich, 1979; Ruina, 1983). This description is particularly important at velocities associated with seismic events, as a rate weakening response has been observed in a variety of rock types. In some instances, high slip rates may promote frictional coefficients even lower than 0.1 (Di Toro et al., 2011). Such occurrences have been attributed to a range of physical and chemical processes that are dependent on both rock type and slip conditions, including: thermal pressurisation of pore fluids (e.g., Sibson, 1973; Rice, 2006); flash heating (e.g., Rice, 2006); chemical decomposition (e.g., Han et al., 2007); production of gouge by material wear, abrasion and comminution (e.g., Matsu’ura et al., 1992); formation of silica gel (from water quartz interaction; e.g., Di Toro et al., 2004); and frictional melting (Hirose and Shimamoto, 2005b; Di Toro et al., 2006). These processes are determined primarily by the nature and evolution of the contact surface of the slip interface. Within geomaterials, widely ranging fractions of void space in the form of pores (vesicles) and fractures (cracks) concentrate stress and localise fracture nucleation, ultimately reducing the strength (Al-Harthi et al., 1999; Heap et al., 2014; Vasseur et al., 2015; Bubeck et al., 2017). The presence of pores and fractures in contact with the slip interface acts to increase the roughness of the surface and reduce the potential contact area (e.g., Rapetto et al., 2009), which results in locally higher stresses that concentrate the mechanical wear and frictional heating to a smaller surface area (Engelder and Scholz, 1976; Scholz and Engelder, 1976; Bhushan, 1998). Greater normal stresses increase the geometric interaction of rough surfaces by asperity deformation (Bhushan, 1998; Bowden and Tabor, 2001).
Fracturing and wear of slip surfaces can create a cataclastic gouge layer with diminishing grain size upon attrition (Engelder, 1974; Mair and Abe, 2011), and generally, gouge zone thickness increases with increasing slip distance (Scholz, 1987). The generation of gouge influences the frictional behaviour by the removal of surface asperities (Matsu’ura et al., 1992) and the introduction of a layer of particles with differing frictional behaviour (Sibson, 1994; Niemeijer et al., 2010; Lavallée et al., 2014). Field and structural observations of natural faults exhibiting large amounts of gouge and cataclasite often indicate lower apparent frictional coefficients than those with rock-rock contact surfaces (Sibson, 1994; Townend, 2006), which is supported by experimental investigations of gouge samples (Ikari et al., 2009; Niemeijer et al., 2010; Lavallée et al., 2014; Faulkner et al., 2018). There are many examples of the products of frictional sliding preserved in the rock record, the nature of which are determined by the lithologies involved and the conditions at which slip occurred. In the brittle regime in near surface shear zones, gouge and cataclasite layers and zones are preserved (Engelder, 1974; Sibson, 1977; Wallace et al., 2019b). At greater pressures, ductile mylonites are formed (Sibson, 1977) and in cases of extreme heating during slip, pseudotachylytes, solidified frictional melts, occur (Sibson, 1977; Di Toro et al., 2011; Kendrick et al., 2012; Mitchell et al., 2016) and are often used as evidence for the occurrence of coseismic slip (Sibson, 1975; Cowan, 1999), though they have also been recorded in mass movements (e.g., Masch et al., 1985; Grunewald et al., 2000; Hacker et al., 2014; Hughes et al., 2020).
Although friction coefficient is relatively easy to calculate from experiments and model from natural faults, explaining the active mechanisms, their temporal occurrence, competing influence and evolution is more difficult (e.g., Rutter et al., 2001). Transience of multiple conditions such as cohesion, composition, interface geometry (roughness), loading, saturation and the presence of lubricating layers (such as melt, gouge, nanoparticles or silica gel) ultimately determine the evolution of slip behaviour (Scholz, 2019). Friction and wear are considered linked processes in tribology and are often studied in conjunction with one another as they can elucidate temporal transitions (Yoshioka, 1986; Wang and Scholz, 1994; Hirose et al., 2012; Boneh et al., 2013; Boneh and Reches, 2018). Wear is largely controlled by the failure of asperity contacts (Archard, 1953; Rabinowicz, 1965; Bowden and Tabor, 2001) and results from a mix of complex mechanisms: adhesive, effective at asperity contacts (Archard, 1953); abrasive, from asperity ploughing (Moore and King, 1980); delamination, where damage occurs away from the sliding surface (Fleming and Suh, 1977); fatigue, from repeating events (Rozeanu, 1963); and corrosive due to chemical weakening (Watson et al., 1995). Archard (1953) studied the global wear of faults and introduced Archard’s equation. This is given as:
where the cumulative wear volume (G) from two surfaces with a given normal stress (σn) is calculated after a given slip distance (D), considering the wear coefficient (K) in units of m2, and the hardness of the softer of the two materials in contact (H). However, it was later noted that this only considers steady state wear, whereas experimental data also suggests an initial transient running-in phase, with elevated wear rates (Queener et al., 1965). The transient running-in phase is linked with initial asperity removal, whilst steady state wear rates are associated with the continued removal of material at the surface (Wang and Scholz, 1994). Additionally, Archard’s model fails to consider the effect of slip velocity, which has been shown to have a large impact on wear rates (Hirose et al., 2012; Boneh et al., 2013). Boneh and Reches (2018) found wear rate to increase with slowness (inverse slip velocity) for a range of lithologies (sandstones, granites and carbonates) tested, a phenomena also noted in ceramics at slip velocities up to 1 m s−1 (Conway et al., 1988; Al-Qutub et al., 2008).
As asperities and roughness on slip surface interfaces have a key control on wear, friction and on the nucleation of seismic ruptures (i.e., relations between critical slip distance and asperity size; e.g., Dieterich, 1979), numerous geophysical/geological studies have investigated roughness and evolution of roughness along sliding surfaces with increasing cumulative slip (Scholz, 1987; Power et al., 1988; Sagy et al., 2007; Candela et al., 2012; Brodsky et al., 2016). Investigations have found that fault surfaces are fractal in nature, being self-similar to self-affine (Power et al., 1988; Sagy et al., 2007), with roughness evolving to smoother forms with increasing slip via abrasion and fracturing, forming fault rock products such as gouge (Sagy et al., 2007). During experimentation the scale of investigation is often limited due to experimental geometric constraints, where roughness of samples cannot replicate the fractal nature of large fault surfaces observed in nature. As a result, natural faults have been shown to exhibit a broader range of wear rates during slip than their experimental counterparts (Scholz, 1987; Boneh et al., 2013; Boneh and Reches, 2018).
Multiple studies have used natural or synthetic gouge samples to investigate the frictional properties of gouge layers during slip events (e.g., Numelin et al., 2007; Lavallée et al., 2014; Togo et al., 2016). However, such studies do not quantify the early comminution of material at the onset of slip and the formation of a layer of cataclasite or gouge. During the onset of slip, frictional sliding is dominated by the interaction of asperities (controlled by normal stress and slip rate) so that roughness is a key parameter, as opposed to in the presence of a gouge layer, which produces a three-body system consisting of two wall rock surfaces and a granular layer (Matsu’ura et al., 1992; Sagy et al., 2007).
Due to the complex and heterogeneous nature of natural rock samples, it is difficult to compare the influence of individual variables on the wear and frictional responses of rocks. As such, the use of synthetic proxies for geomaterials, specifically variably indurated glass beads, may be used to systematically and independently vary properties such as porosity in order to determine their role (Wadsworth et al., 2016; Ryan et al., 2019).
Methods and Materials
In order to test the influence of porosity on frictional behaviour, wear and comminution, we elected to use glass beads sintered to three target porosities (8, 19 and 30%). These porosities were chosen because they represent realistic values for a range of natural geomaterials found in shallow, structurally active settings (e.g., Wheaton, 2016). During sintering above the glass transition temperature (Tg), porosity of the viscous droplets (glass beads) reduces according to a characteristic timeframe, driven by surface tension (Wadsworth et al., 2016). The porosity reduction is repeatable and predictable for a given temperature, thus by controlling temperature and dwell time, the target porosity can be achieved. We used soda lime silica glass spheres (Spheriglass® A-glass Solid Glass Microspheres, product number 1922, Potters Industries Inc.) as a starting material which has well constrained properties, including a known Tg value of 824 K (551°C; at 10°C min−1). Product 1922 has a bead size range of 45–90 µm with a particle size distribution mean between 60 and 70 µm, as used in Wadsworth et al. (2016). Samples with 6–11 and 28–32% porosities (hereafter known as 8 and 30% porosity sample sets) were made at Ludwig-Maximilians-Universität, where microspheres were loosely packed into ceramic trays with dimensions 20 cm by 15 cm and 5 cm deep and heated to 663°C for 2.5 or 13 h (respectively for the 30 and 8% porosity samples), with a heating and cooling rate of 10°C min−1, following existing protocols and models (Wadsworth et al., 2016; Wadsworth et al., 2017). The slow heating and cooling rate minimised thermal gradients across the sample, and the relatively low temperature (relative to Tg) ensured that the sintering was slow, minimising the possibility for local heterogeneities. The trays were rotated 180° halfway through the heating process to eliminate any effect of temperature gradients within the furnace. The low depth of the tray ensured that sintering occurred in the scale-independent surface-tension dominated regime, and not the pressure-sintering regime which could induce basal compaction due to overburden (Wadsworth et al., 2019). This process created bricks of sintered material with only slight porosity gradients and packing inconsistencies and a 3–4% porosity variability (at the sample scale) across the slabs; this gradient was negligible in the direction of coring from the side of the sample block and therefore did not affect individual samples.
The 19% porosity samples were made at the University of Liverpool to obtain a sample set between the other two porosity ranges. Beads were loaded into cylindrical ceramic crucibles 5 cm in height and heated to 725°C and dwelled for 25 min with a heating and cooling rate of 10°C min−1 (total time during which sintering was active above Tg was 60 min). Single samples were then cored from each crucible and the porosity was found to be repeatable using this method, although slight, repeatable gradients existed from top (denser) to bottom, likely due to slight temperature gradients. It was ensured that the slip surface for the test was cut at the same height within each sample where the porosity was 18–20% porosity (hereafter called the 19% porosity sample set).
Porosities of all samples were determined by constraining the sample density (ρs):
where m is mass (in kg), h is height and r is radius (both in m) for each core. Then, determining the solid phase density (ρ0) of the sample by measuring the inaccessible volume of each core in an AccuPyc II 1340 helium pycnometer from Micromeritics, so that porosity (φ) can be estimated by:
A total of 44 friction experiments were performed on a 2nd generation low to high velocity rotary shear apparatus (LHVR) from Marui instruments at the University of Liverpool, a successor to the 1st generation apparatus designed and described by Shimamoto and Tsutsumi (1994). The LHVR uses a concentric sample geometry and is capable of a rotational speed range of one rotation per year to a maximum of 1,500 rotations per minute (rpm) and normal force (axial load) of up to 10 kN as described in Ma et al. (2014). Hollow samples with 25.0 mm outer diameter and 8.5 mm inner diameters were cored from each of the three porosity sample groups (8, 19 and 30%), resulting in an 8.25 mm wide annular slip surface. The axial load was applied using a gas actuator controlling the position of, and stress exerted by, the lower column. Three normal stresses of 0.25, 0.5 and 1 MPa were applied to the specimens, with normal stress (MPa) calculated by dividing applied force (kN) by the slip surface area. During each experiment torque was used to calculate shear stress (τ, see details in Hirose and Shimamoto, 2005b) and an LVDT attached to the lower column recorded the axial shortening, used here as a measure of wear.
To examine the effects of slip rate on frictional behaviour, wear and comminution, we used a range of constant slip rates. Tests were conducted at 0.1, 0.2, 0.3, 0.4 and 0.5 m s−1 at each of the normal stresses; 0.25, 0.5 and 1 MPa. Additional 1.0 m s−1 tests were also conducted at 1 MPa for each of the sample sets. Due to variations in angular velocity across the slip surface, an equivalent slip rate (V) was calculated after Hirose and Shimamoto (2005b), assuming constant shear stress across the slip surface:
where R is the revolution rate of the motor, r1 is outer radius and r2 is inner radius.
Cumulative rotations recorded via a tachometer on the rotating upper column were used to calculate cumulative and total slip distance (hereafter termed displacement) of the experiments using the equivalent slip rate (V in m s−1). Most experiments were performed to displacements of 9–10 m with the exception of samples that failed, and samples with very high wear rates that were halted once wear rates and shear stresses had stabilised. All data for each test (torque, normal stress, rpm and axial shortening) was recorded at 100 Hz.
For each test friction coefficient (μ) was calculated from normal stress (σn in MPa) and shear stress (τ in MPa) using:
Work per unit area (W in MJ m−2) of the slip surface was calculated by the integration of the experimentally generated shear stress curve (after Abercrombie and Rice, 2005; Di Toro et al., 2012; Kanamori and Rivera, 2013). In order to compare this to both wear and heating rates, the work during steady state slip (Wss in MJ m−2) was calculated and divided by the displacement over which steady state conditions were measured (Dss; see Table 1) to produce the work per metre slip during the steady state period (WM in MJ m−2 m−1).
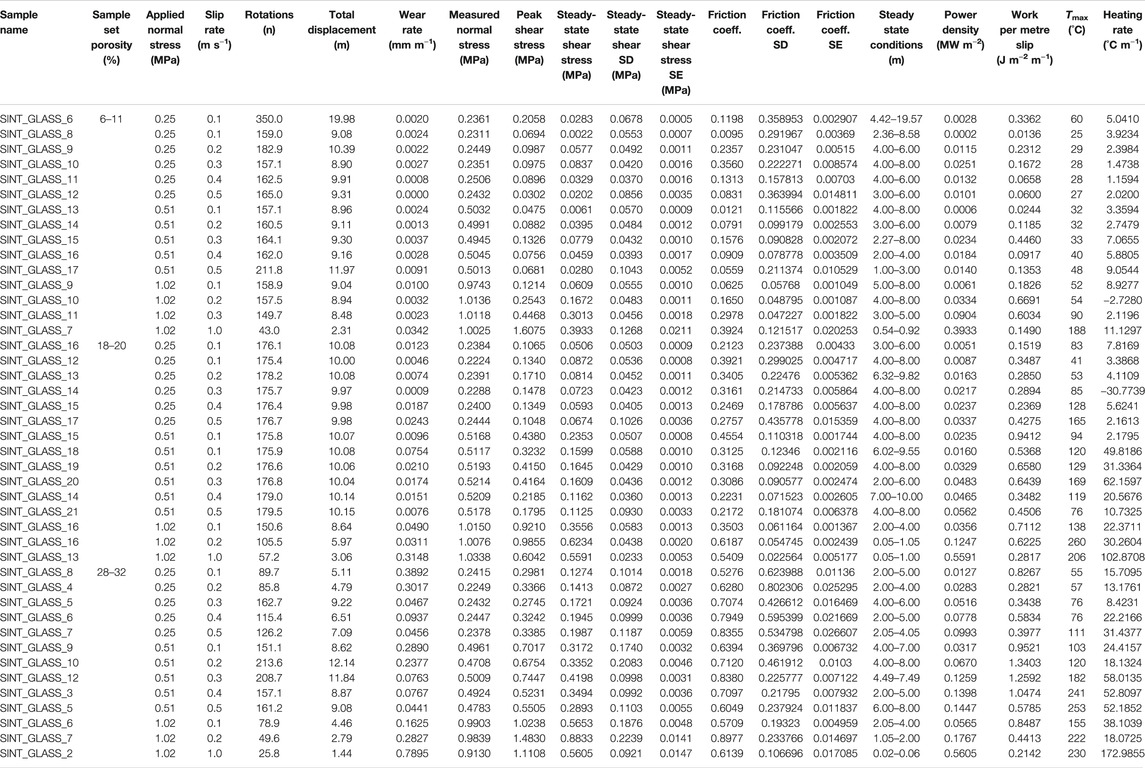
TABLE 1. Mechanical and temperature data for all experiments.
In order to evaluate the combined effect of slip rate and normal stress, the mean power density per unit area (PD in MW m−2) of the slip surface was calculated for all tests for the period of steady state shear stress (τss) and wear to describe the energy dissipation rate at the slip surface, via:
where τss is the mean shear stress during the period of steady state sliding (from which shortening rates and heating rates were also calculated).
All experiments were recorded using a FLIR X6000sc thermographic infrared camera at 20 Hz. The camera was placed at a distance of 70 cm to monitor sample surface temperature of the slip zone and adjacent wall material due to frictional heating at a pixel size of approximately 0.15 mm. The data was analysed with the FLIR IR Max software.
A thermomechanical analyser (TMA) 402F1 Hyperion (Netzsch GmbH) was used to measure the coefficient of thermal expansion of the three glasses with different porosities. The analysis was performed on 6 mm diameter cores, 5 mm in height and at a heating rate of 10°C min−1 with a constant normal force of 0.5 N. To accurately determine the expansion coefficient of our samples, a cylinder of standard alumina, of equal dimension to our porous glasses, was first heated using the pre-determined temperature and loading profile to obtain a baseline of sample assembly expansivity; length changes are monitored at a resolution of 0.125 nm. Once completed, the same temperature and loading profile was applied to the porous glass samples, and the thermal expansion constrained in the baseline run was subtracted to the sample run to accurately determine the expansion coefficient (with trivial measurement errors of <0.2%).
The thermal expansivity determination, combined with the thermographic data, was used to model the effect of thermal expansion on the monitored axial displacement during frictional sliding, and to correct the axial shortening data, used to calculate wear accurately. Thermal expansion was identified during frictional testing by a phenomenon where some experiments showed net lengthening of the sample despite wear products being observed (due to the expansion outweighing comminution). To correct the length change for thermal expansion, first the temperature of each 0.15 mm pixel along a profile of the sample, perpendicular to the slip zone was measured for each frame of thermal data. Then, the net expansion of the sample was calculated by determining the length change experienced along this profile by summing the individual expansions according to the temperature in each pixel (obtained from the thermal expansion profiles of the materials measured using the TMA). The net expansion was then subtracted from the measured shortening throughout the test to identify the true shortening (wear) and rate of wear (Supplementary Figure S1). As the thermographic data used in this correction was measured from the outer surface of the sample it is a minimum estimate of slip zone temperature (due to not accounting for potentially higher temperatures within the sample). Therefore, despite the high accuracy of samples’ thermal expansivity determined by TMA (i.e., <0.2%), the modelled thermal expansivity at any point during slip is likely underestimated due to underestimation of the slip zone temperature caused by surface monitoring (to date, no direct slip zone temperature measurements are possible).
Following the experiments, selected samples were dissected and analysis of microstructures was conducted on a benchtop Hitachi TM3000 scanning electron microscope (SEM) with a 15 kV accelerating voltage and a 10 mm working distance. Images were acquired using the Bruker Quantax 70 software.
Results
During rotary shear experiments at different slip rate and normal stress conditions the shear resistance of variably porous synthetic rock analogues varied, and consequently the friction coefficient, wear rate and frictional heating differed. These three phenomena are explored via a) evolution during slip, b) the influence of normal stress, and c) the effect of slip rate, each as a function of porosity. Mechanical and thermal data for all experiments are displayed in Table 1 along with the SD and SE analysis of the mechanical data.
Frictional Behaviour
When slip on a plane initiated, we immediately observed a rapid increase in shear stress for all tests, which was followed by a subsequent reduction in shear stress with increasing displacement (slip distance). This often plateaued at lower shear stress values, referred to as steady state (τss) conditions, after 0.5–2.0 m and remained steady throughout the duration of slip (Figure 1A; Supplementary Figures S2–S4). In conjunction with the initial stress peak, wear rate was elevated. The rapid initial wear rate during the running-in phase decreased to a constant lower rate as shear stresses reduced to steady state conditions. The rate of evolution of both the shear stress and the wear rate was variable between sample porosities and slip conditions. The lowest porosity samples (8%) evolved from initial peak friction and wear rates to steady state in the shortest slip distance whereas the 30% porosity samples took longer to reach steady state, and, in many cases, the interpreted steady state areas were punctuated by multiple shear stress peaks occurring throughout the test, a phenomenon that was less commonly observed at lower porosity. Peaks in shear stress were often accompanied by changes in wear rates and temperature increases. At lower normal stress (i.e., 0.25 MPa), the reduction in shear stress and wear rate to steady state occurs over a longer distance than at higher normal stresses and at lower slip rates this distance also appears to be longer. In most experiments, shear stress response follows a similar pattern as presented in Figure 1A (Supplementary Figures S2–S4), where increasingly higher porosities exhibit higher shear stresses and wear (Figure 1A) for a given slip condition. Higher temperatures are also achieved in the higher porosity samples. Temperature profiles for the tests show that heating rates for all samples have an initial rapid increase in temperature. Both 8 and 19% porosity samples then achieved a relatively stable slow rate of increase, or temperature stabilised entirely. However, the highest porosity samples (30%) typically maintained higher rates of heating throughout slip (Figure 1A; Supplementary Figures S2–S4).
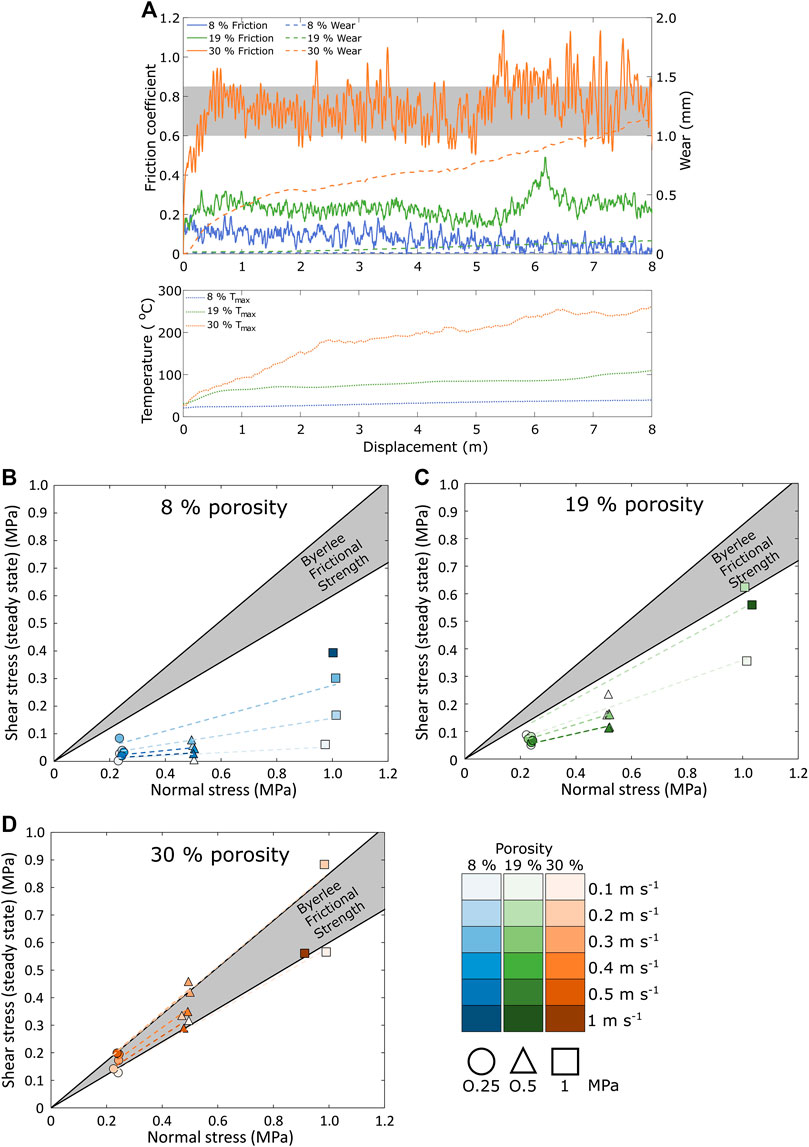
FIGURE 1. Mechanical data for glass analogues with different porosities. (A) Example evolution of friction coefficient, shortening (wear) and temperature for slip parameters 0.4 m s−1 and 0.5 MPa for the suite of porosities tested (8% blue, 19% green and 30% orange). Tmax is the peak temperature measured by the thermographic camera in any given frame. Note initially heightened friction coefficients and faster wear at the initiation of slip and subsequent reduction to steady state conditions after approximately 0.5–2.0 m of slip. (B–D) Average steady state shear stress (τss) plotted against normal stress for (B) 8%, (C) 19% and (D) 30% porosity—see Supplementary Table S1 for slip distances over which this was measured. The Byerlee friction range 0.6–0.85 is highlighted in grey for reference. Darker colour shades indicate increasing slip rate and shape indicates normal stress. The 30% porosity sample approximates Byerlee frictional behaviour, and with decreasing porosity the samples’ response deviates further.
To better compare the influence of normal stress and slip rate on frictional behaviour, steady state shear stress (τss) can be plotted against normal stress (σn; Figures 1B–D). The gradients of the plots represent the friction coefficient and show the dependence of shear resistance on normal stress. For each given porosity, shear stress increases with normal stress. However, 8% porosity samples showed a lower sensitivity to normal stress increase, especially from 0.25 to 0.5 MPa (Figure 1B) and had a lower rate of increase to 1 MPa than the other, higher porosity suites (Figures 1C,D). The most porous samples (30%) had the highest dependence of shear stress on normal stress (Figure 1D).
Correspondingly, the lowest porosity glass samples (8%) had the lowest shear resistance and associated frictional coefficients for all conditions tested ranging from 0.05 to 0.40 (Figure 1B), reaching a maximum at 0.3 m s−1, which is in the lower end of the friction coefficient values expected for geomaterials at low normal stresses (<5 MPa; Figure 3 in Byerlee, 1978). At intermediate porosity (19%) the friction coefficients were slightly higher, ranging from 0.23 to 0.54 (Figure 1C). At the highest porosity (30%), the steady state friction coefficient of the samples ranged from 0.57 to 0.81 (calculated from the linear fit of the steady state shear stress), which are typical Byerlee’s friction values for rocks (Figure 1D). Experiments conducted at 1 MPa and at 0.4 and 0.5 m s−1 for all samples, and at 0.3 m s−1 for the 8 and 19% porosity samples produced a shear stress that exceeded the strength of all the three porosity sample sets and the samples failed, resulting in no test data for these conditions.
Shear stress, and hence friction coefficients show a dependence on slip rate (Figures 1B–D). Friction coefficients initially increase with higher slip rates (at low slip rates) but switch to decreasing friction coefficients at faster slip rates, shown in Figure 2 (which plots friction coefficients calculated for each slip rate using the gradients in Figures 1B–D). In detail, samples exhibit velocity strengthening up to 0.2–0.3 m s−1, followed by the onset of velocity weakening behaviour at around 0.3–0.4 m s−1 for all porosities tested, resulting in lower frictional coefficients until 0.5 m s−1. Results for high-velocity tests of 1 m s−1 for each porosity sample set show another increase in friction coefficient for 8 and 19% porosity samples, and stabilisation for the 30% porosity sample (Figure 2), though it should be noted that 1 m s−1 tests were only conducted at 1 MPa.
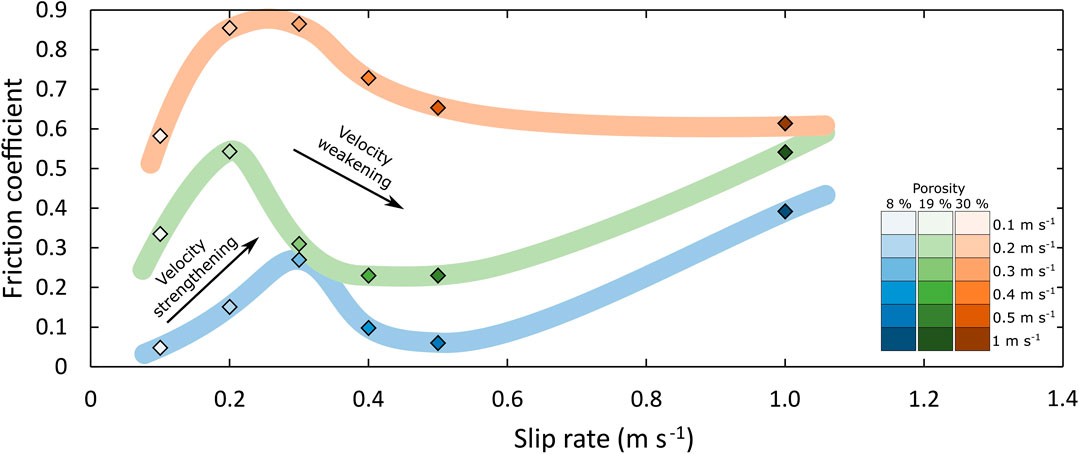
FIGURE 2. Friction coefficient for each porosity material (8, 19 and 30%) calculated from data displayed in Figures 1B–D and plotted against slip rate for all porosities (colour denotes porosity, shade is slip rate from 0.1 to 1.0 m s−1). Note that friction coefficients increase at rates up to 0.3 m s−1 and decrease with increasingly higher slip rates as marked with sketch lines.
Wear Rate
The initiation of slip and the early slip phase are associated with initially high wear rate that gradually decreases to a steady rate over a period of running in described above (Figure 1A; Supplementary Figures S2–S4). Once steady state wear rate is achieved, it is greater for higher porosity samples for each given slip rate and normal stress (Figure 3). Both 8 and 19% porosity samples show much lower wear rates than 30% porosity samples at the same conditions (Figure 3). The 30% porosity samples have more variable wear rates throughout slip, though an overall reduction in rate to a steady state value is still observed (Figure 1A) and perturbations in wear rate often coincide with variations (peaks) in shear stress (Figure 1A; Supplementary Figures S2–S4).
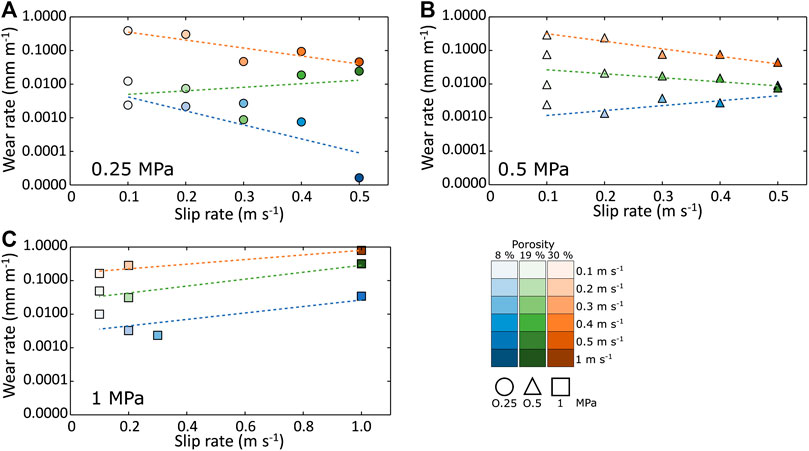
FIGURE 3. Wear rate as a function of slip rate for samples of each porosity (8, 19 and 30%), at (A) 0.25 MPa, (B) 0.5 MPa and (C) 1.0 MPa normal stress. Wear rates generally increase with increasing axial load and are highest for the 30%, followed by 19% and finally 8% porosity samples. At normal stresses of 0.25 and 0.5 MPa the 30% porosity samples show a reduction in wear rate with higher slip rates, with a reversed trend at 1.0 MPa. The 8 and 19% porosity exhibit negligible wear rates at 0.25 and 0.5 MPa (Figure 1B). The 1 m s−1 test show much higher wear rates than low slip rate experiments. All wear rates have been corrected for thermal expansion using coefficient of expansion and thermal data recorded during tests.
In order to compare wear across different slip conditions we define wear rate during the steady state period of slip as wear per unit slip distance (mm m−1). Comparing these wear rates (Figure 3), we observe that at all conditions (of normal stress and slip rate) wear rate is highest in the most porous samples (30%), intermediate in the mid-porosity samples (19%) and lowest in the low porosity samples (8%). Additionally, we note that wear rate varies with normal stress (Figure 3). Wear rate is negligible (i.e., <0.04 mm m−1) at low porosity across all normal stresses tested (0.25, 0.5 and 1.0 MPa), but is still slightly dependent on normal stress, being greater at higher normal stresses for a given slip rate for both the 8 and 19% samples, especially at low slip rates. Conversely, 30% samples exhibited comparable or slightly lower wear rates at higher normal stresses (Figure 3).
In comparing wear rates for each porosity at differing slip rates, we note that the effect is dissimilar at different normal stresses. Wear rate generally reduces with higher slip rates at 0.25 and 0.5 MPa normal stress for all porosities with one exception, the 19% porosity sample at 0.25 MPa (Figure 3). This observation is supported by visual inspection of the amount of material ejected from the slip surface during experiments, which was seen to be lower for tests with higher slip rates. The largest reduction in steady state wear rates occurs between 0.2 and 0.3 m s−1 (Figures 3A,B), most notably for the 30% porosity sample experiments. Beyond 0.3–0.4 m s−1 slip rate, the wear rate stabilises or increases slightly. At 1 MPa, we similarly see that wear rates reduce with increasing slip rates for the lower porosity samples (8 and 19%) at low velocity (<0.3 m s−1), yet the 30% sample shows a reverse trend (it should be noted that these samples experienced very high shear stresses and were stopped prematurely due to accumulating damage). For all porosities the high slip rate tests conducted at 1 m s−1 (at 1.0 MPa) show much greater wear rates for all porosities than at any other condition, indicating (as at the lower normal stresses) a reversal in the trend of reducing wear rate with increasing slip rate above ∼0.3 m s−1 (Figure 3C).
To further investigate the factors controlling wear rate, we evaluate it as a function of friction coefficient, work per metre slip (WM) and power density (PD) in Figure 4. Both WM and PD are used to evaluate the energy at the slip surface over displacement and time respectively. We note a systematic positive correlation between friction coefficient and wear rate across all sample suites and normal stresses, with each sample suite plotting distinctly but contributing to the larger trend (Figure 4A). This positive correlation is also noted between work per metre slip and wear rate; WM is seen to be greater for tests with higher normal stress, producing greater wear rates; WM is typically greater for higher porosity, also resulting in higher wear rates, though the effect of velocity is variable. Overall, wear rate is higher for higher porosity samples for a given WM (Figure 4B). We note a weaker positive correlation between power density and wear rate for the full experimental suite, but note that each porosity sample set plots with their own distinct trend and that the highest wear rates for each porosity correspond with the highest PD. Moreover, we note that for the same PD, wear rates are higher in the most porous samples (Figure 4C). Experiments with negligible wear rates (typically low porosity, low slip rates and low normal stresses) had the lowest power density, work per metre slip and friction coefficients (Figure 4).
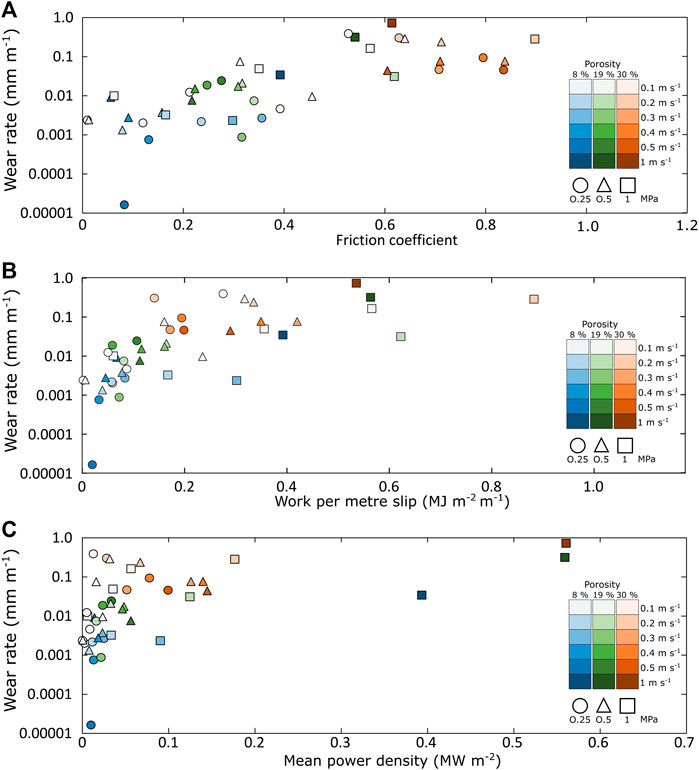
FIGURE 4. (A) Wear rate related to friction coefficient for all tests. High porosity results in higher frictional coefficients and higher wear rates. (B) Wear rate as a function of work per metre slip (WM). (C) Wear rate as a function of power density (PD). Higher WM and PD associated with higher porosities and higher wear rates. All wear rates have been corrected for thermal expansion using coefficient of expansion and thermal data recorded during tests.
Frictional Heating
Sample surface temperature was monitored continuously using a thermographic camera during experiments. Similar to wear rates, the initiation of slip and running-in period generates a high initial rate of frictional heating which then often decreases to a lower rate of heating after approximately 0.5–3.0 m (Figure 1A; Supplementary Figures S2–S4). The plateau in temperature was achieved later for the higher porosity sample, in which steady state temperature was occasionally not reached in the slip distance tested. For each given experimental condition (slip rate and normal stress) temperatures on the slip surface at any point during slip were typically highest in the most porous samples (30%), intermediate in the mid-porosity samples (19%) and lowest in the low porosity samples (8%; Figures 5A–C), though in just over half the conditions tested at the onset of slip (<3 m) temperature generation in the 19% sample exceeded the more porous sample, and in a few cases temperature remained higher throughout (Figure 1A; Supplementary Figures S2–S4). Variations in heating rate correlate with fluctuations in friction coefficient, though excursions in temperature are typically shorter-lived. As most experiments were halted at a similar slip distance (8–10 m) and because peak temperatures often plateaued, we defined the maximum temperature for each experiment (Tmax) as a means to systematically compare the effect of each variable (normal stress, slip rate, porosity) on frictional heating (we acknowledge that this approach provides only an indication of the energy dissipated by frictional heating, and provide the details of all temperature data in the Supplementary Material). Tmax shows correlation with normal stress, porosity and slip rate (Figure 5): for a given porosity and slip rate, maximum temperature increases with normal stress (Figures 5D–F); and for a given porosity and normal stress, temperature increases with slip rate (Figures 5A–C). The latter being minor in the lowest porosity samples (8%) at lowest load (0.25 MPa), which show little variation in temperature with increasing slip rate (Figures 5A,B), whereas the 19 and 30% porosity samples show a systematic positive trend of greater frictional heating with increasing slip rate at all loads tested (Figures 5D–F). As also seen in the temperature profiles, Tmax in the 19% porosity samples sometimes exceed those in the 30% porosity samples (Figure 5), though it should be noted that tests were stopped after shorter slip distances for the more porous samples due to excessive wear (reaching the apparatus limit; see Table 1; Supplementary Figures S2–S4).
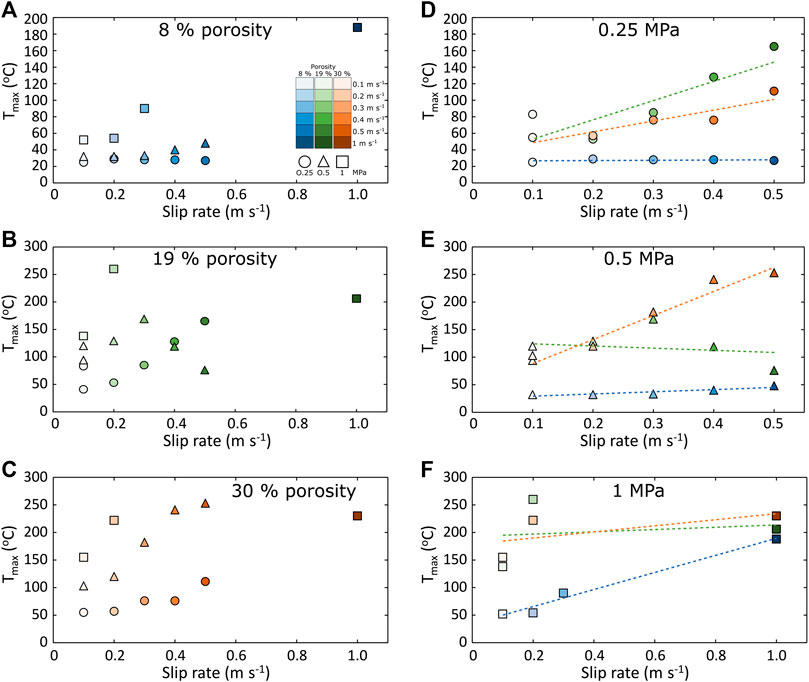
FIGURE 5. Maximum temperature (Tmax) achieved during slip as a function of slip rate. (A–C) The effect of normal stress (0.25, 0.5 and 1.0 MPa) for each of the sample porosities tested, showing higher Tmax at higher slip rate and at higher normal stress. (D–F) The effect of porosity (8, 19 and 30%) at each of the normal stresses, showing increasing Tmax with increasing slip rate for all porosities, but a complex impact of porosity on Tmax, where 19% porosity samples result in higher maximum temperatures than 30% porosity. Note that Tmax may occur at different slip distance for each test, a complete temperature record of all experiments is provided in the Supplementary Material.
To further explore the controls on frictional heating we calculated the heating rate per meter of slip during the steady state slip period (the change in peak temperature during
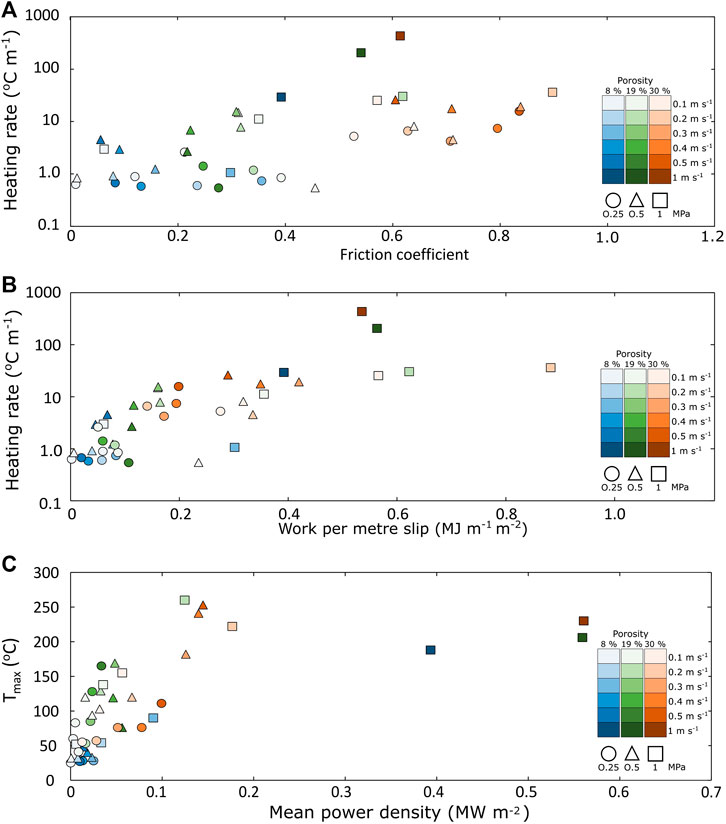
FIGURE 6. Mechanical controls on frictional heat achieved during slip. (A) Heating rate plotted against friction coefficient for all tests, showing positive correlation. (B) Heating rate plotted against work per metre slip also showing positive correlation, with more work produced per metre of slip resulting in greater heating rates. (C)Tmax plotted against mean power density. Note that Tmax may occur at different slip distances for each test. A complete temperature record of all experiments is provided in the Supplementary Material.
Comminution and Wear Mechanisms
Visual inspection of samples after testing revealed notable differences in the damage associated with mechanical wear for each porosity (for original pore structures see Figures 7A–C). Samples that experienced slip at similar conditions (8 and 19% samples at 0.1 m s−1 at 1 MPa and a 30% sample at 0.2 m s−1 at 1 MPa) were selected and cut perpendicular to the slip direction to expose the damage zone for SEM analysis (Figures 7D–G; for thin section orientation in relation to the experimental set up see Figure 7H). Due to the slight differences in slip rate of the samples, the damage zones were only analysed qualitatively for fracturing style.
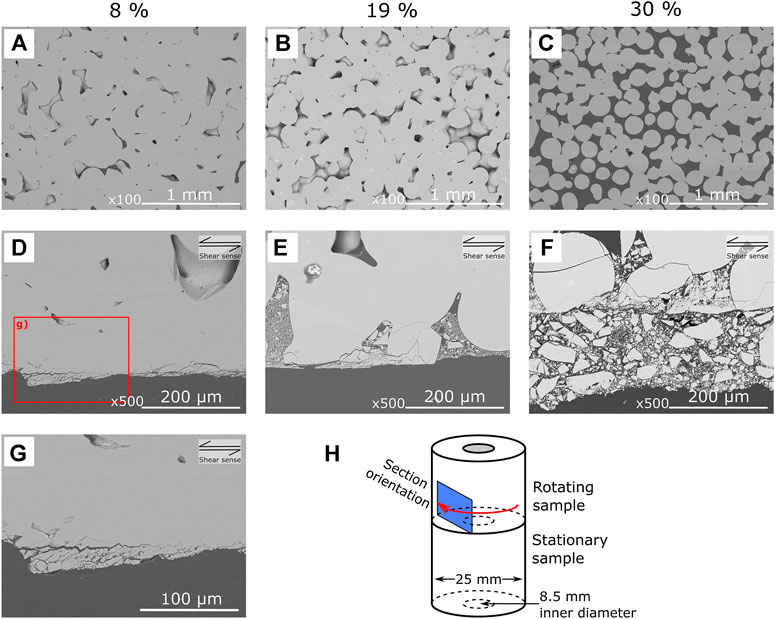
FIGURE 7. Backscattered electron (BSE) images of samples with different porosity. Texture of the sintered glass samples highlighting pore structure prior to testing for (A) 8%, (B) 19% and (C) 30% porosity samples. (D) Damage zone of an 8% porosity sample that experience 9.04 m of slip at 1 MPa at 0.1 m s−1 showing minimal penetration of damage (<50 µm) and Riedel shearing. (E) Damage zone of a 19% porosity sample that experienced 8.64 m of slip at 1 MPa at 0.1 m s−1 with more fracturing at pore edges and accumulation of fine-grained (maximum 50 µm to smaller than 1 µm) gouge material within pores. (F) Damage zone and gouge of a 30% porosity sample that experience 2.79 m of slip at 1 MPa at 0.2 m s−1 with large fragments up to 100 µm in size in a gouge layer up to 350 µm thick. (G) Zoomed area of panel D (shown by the red inset box) at higher magnification to highlight Riedel structures and the absence of gouge. (H) A schematic of thin section orientation (same for all samples) within the sample assembly. Shear for panels D–G is left-lateral (sinistral) as indicated by the schematic.
Increasing the porosity of materials slipping along a fault plane results in a larger zone of damage. The 8% porosity samples exhibit only a narrow area of damage <50 µm (Figures 7D,G). Damage presents as Riedel (R) fractures at ∼15°–30° to the slip surface. These fractures splay into en-echelon R shears and higher angle R′ shear fractures propagating into the glass. Where the observed damage zone is thicker, duplexing of R shear fracturing occurs, bounding highly fractured material. On the interior edge of the damage zone, fracturing decreases to single discrete R′ fracture sets extending 10–15 µm into the solid glass material (Figure 7G).
The 19% porosity samples exhibit a similar style of Riedel shear fracturing, though with a thicker damage zone of up to 100 µm is present, with longer fractures (Figure 7E). Unlike the 8% samples, 19% samples had multiple pore spaces that interacted with the slip surface and damage zone. Gouge particles were preserved in these pores, with particle sizes ranging from <1 µm up to 40–50 µm angular fragments (Figure 7E). High angle R′ fractures extend further into the glass, especially around pores; Figure 7E shows a fracture extending ∼100 µm into the glass from the trailing edge of the pore relative to slip direction and several in-place angular fragments of ∼10 µm.
The most porous sample (30%) has the largest gouge layer and damage zone, comprising a 200–300 µm thick layer of gouge with a range of fragment sizes from <1 µm up to the largest observed fragments at around 90 µm in size (Figure 7F). Fracturing within the grains in the gouge layer indicates that the fragment size is reduced during comminution with a reduction of angularity. The structure of the glass material at 30% porosity shows the original glass bead shape with necking where grains were in contact during sintering (Figures 7C,F). Fractures in the damaged zone of sintered glass are observed at these necks between grains, as well as across the grains at their widest point and as chips off the side of the grains.
Discussion
By combining analysis of friction coefficient, work and power density with wear rates, temperature monitoring and microstructural data, we can make many observations regarding the interplay between material properties and the tribological responses of variably porous media. Inferences can then be made on the role of porosity in slip behaviour of natural geomaterials in frictional regimes.
The results of the frictional investigation show that porosity has a significant control on fault slip. We show that the 30% porosity sintered glass samples abide by Byerlee’s law, and that with decreasing porosity the reduction in shear resistance means friction coefficients approach the lower end of the expected variability in friction coefficient values for geomaterials at low normal stresses (Byerlee, 1978; Figures 1B–D). This suggests that most natural geomaterials, which are texturally heterogeneous and fully crystalline, behave differently during frictional sliding to amorphous glass samples of the same porosity. Differences in mineral strength and the addition of heterogeneous stress distributions from textural features such as crystal boundaries, cleavage planes and differences in cementation in granular material (e.g., Saadati et al., 2018) promote stress concentrations and weaknesses that alter the strength and as a consequence, frictional behaviour. Yet understanding the response of glassy materials to fault slip is vital to numerous settings, including volcanic environments that include glass-bearing lavas and ignimbrites, and which are prone to faulting and gravitational instabilities (Elsworth et al., 2007; Hacker et al., 2014; Lavallée et al., 2015).
The low porosity glass samples lack the textural heterogeneity to experience comminution and wear, as evidenced by the lack of fault gouge (Figure 7). With increasing porosity there was an increase in ability to comminute, such that steady state shear stress and frictional coefficients approached more typical values that were predicted by Byerlee, with the 30% porosity samples behaving in a similar manner to the majority of natural geomaterials. Increasing roughness is shown to increase friction (Byerlee, 1978) as asperities interact on the surfaces. We interpret that at higher porosity the presence of pores at the slip surface provides a surface roughness, enhancing interactions between the surfaces and localising stress concentrations. Additionally, porosity has been shown to reduce material strength across a range of lithologies (e.g., Dunn et al., 1973; Al-Harthi et al., 1999; Rajabzadeh et al., 2012; Bubeck et al., 2017; Coats et al., 2018) and porous glasses alike (Vasseur et al., 2013). This enables fractures to more readily propagate into the material, increasing damage and wear of the surfaces.
The granular texture of the more porous material allows more material removal from the host due to each fracture, as evidenced by the SEM analysis (Figure 7) which shows larger fractures and larger clasts in the cataclasite and variable, higher friction coefficients throughout the experiments (Figure 1A; Supplementary Material). In contrast, the 8% samples that had very few pores intersecting with the slip surface had less concentration of stress on discrete points and so fractures are distributed along the surface in Riedel patterns that produce only a thin damage zone (50 µm thick) and very little fragmented material is incorporated into the slip zone between the wall rock interfaces. Not only is more volume of material removed in more porous samples, but also larger fragments that are subsequently comminuted in the gouge layer. These larger fracturing events are observed as shear stress peaks and slip zone dilation in the axial displacement of the samples during the tests. Some large fragments are preserved in the damage zone and gouge layer of the 30% porosity sample slip surfaces (Figure 7F) and can be compared to the smaller grain sizes preserved in the pores on the surface of the 19% porosity samples (Figure 7E). This style of fracturing and gouge layer formation would not be possible with the smaller fractures in the damage zone observed with the 8% porosity samples. This variation in wear mechanism, from small scale damage zones to larger fracturing events (Figure 7), also causes the differences in run-in time for the materials to achieve steady state sliding. High initial wear rates observed during early phases of slip (Figure 1A) are caused by the initial failure of asperities, smoothing of the surface and, in the more porous samples, the production of a gouge layer. The higher porosity samples experienced longer running-in phases due to the higher roughness caused by pore-surface interaction, and they had to generate thick gouge layers to achieve quasi-stable slip (Figure 7). As several studies have previously noted, a continuous gouge layer can dramatically reduce shear stress by halting rock-on-rock, two-body system behaviour in favour of a three-body system with granular medium with the capability of adopting a shear weakening rheology (e.g., Ikari et al., 2009; Niemeijer et al., 2010).
Natural fractures and slip surfaces have a fractal roughness, self-similar across a range of scales (Power et al., 1988); these rough slip surfaces tend towards smoother profiles across scales (self-affine) with increasing slip due to the fracturing and comminution of asperities and other slip surface features (Brodsky et al., 2016). However, where roughness is induced by porosity on a planar surface, this is not the case because as the surface material is removed due to wear, additional pores are uncovered at increasing distance from the original slip plane. As a result, roughness at the scale of porosity (micron to cm) cannot reduce effectively leading to large amounts of interlocking asperity contacts beyond the initial running in period. The roughness at the scale of the porosity is therefore a property of the material itself, an inherent roughness, that cannot be smoothed by abrasion, though it may be buffered by the presence of a gouge layer, with gouge also infilling pores at the surface. This would suggest that for a given normal stress, faults in more porous materials maintain higher roughness as well as having higher wear rates and potentially higher friction coefficients for longer slip displacements, which may prevent attainment of stable slip conditions (Figures 3, 4).
An increase in normal stress results in higher shear stresses. As normal stress is increased, so too does the geometric interaction of roughness and this results in higher shear resistance along the slip surface. The shear resistance to normal stress relationships define the friction coefficient for each given slip velocity (Figures 1B–D). In this study, we observed that the highest porosity sample exhibits the highest friction coefficient, as locally increased normal stress (at the points of contact) has the largest impact on promoting geometric interaction for the most porous sample (i.e., shear stress has the highest dependence on normal stress; Figures 1B–D) due to deformation, either elastic or plastic of the asperities on the slip surface (Bhushan, 1998; Bowden and Tabor, 2001). Meanwhile, for the lowest porosity samples (8% porosity), little surface roughness exists due to the lack of pores and material heterogeneity and therefore the increase in normal stress does not so dramatically increase asperity interactions, and the additional normal stress is distributed over a larger area instead of at discrete asperity contact points. In detail, for low porosity samples (8 and 19% porosity), at a given slip rate, an increase in normal stress is associated with higher wear resulting from a greater amount of fracturing and damage. Shorter running-in periods to the attainment of steady sliding are also noted at higher normal stresses due to the enhanced wear rates and early asperity removal (Supplementary Figures S2–S4). At 30% porosity, the effect of an increase in normal stress is not simple (Figure 3). The generation of thicker gouge layers may be the cause of a lower sensitivity of wear rate to normal stress, since gouge has differing frictional behaviour to rock-rock contacts (Matsu’ura et al., 1992; Sibson, 1994; Sagy et al., 2007; Niemeijer et al., 2010). SEM analysis of the 30% porosity sample slip zone showed a relatively thick (200–300 µm) layer of cataclasite, which kept the sample interfaces separated during sliding (Figure 7F).
Steady state friction coefficients increase and subsequently decrease with increasing slip rates (Figure 2). This suggests an initial velocity strengthening behaviour transitioning to velocity weakening behaviour (m decreases with increasing V) at higher slip rates. This transition occurs for all porosities tested at around 0.2–0.4 m s−1 (Figure 2). A weakening mechanism is therefore triggered after an increase in slip rate, across all porosities tested, and independent of normal stress, which has been attributed to the time-dependent interaction of the surfaces (Dieterich, 1979; Ruina, 1983). The restrengthening observed at 1 m s−1 for the 8 and 19% samples may be related to partial welding of the slip surface which is supported by a black/brown material observed on the slip surface after these experiments. Fault healing (welding due to viscous remobilization of glass (or glass-rich rocks) causes higher frictional coefficients (due to strengthening e.g., Lamur et al., 2019) and instability during slip (Lavallée et al., 2015). The 30% porosity sample did not exhibit the increased friction or darkening of the slip surface prior to failure, and a correspondingly lower Tmax was recorded. In most cases wear rate also decreases with increasing slip velocity during the initial velocity strengthening portion up to around 0.3 m s−1 and then achieves a plateau during the faster slip rates where materials are velocity weakening. This reliance of wear rate on slip rate disagrees with Archard’s original law (Archard, 1953) that states that wear rate increases with increasing normal stress, but fails to include response to slip rates. However, such reliance on slip rate has been noted by numerous studies on natural rock samples (Hirose et al., 2012; Boneh et al., 2013; Boneh and Reches, 2018) and ceramics (Conway et al., 1988; Al-Qutub et al., 2008).
There is an overall positive correlation across all experiments between friction coefficient and wear rate, with each porosity clustering (largely due to the distinct ranges of friction coefficients for each porosity material) but contributing to the overall trend (Figure 4A) indicating that wear rate may be determined from friction coefficients without further knowledge about the fault rock porosity. Negligible wear rates also correspond to the lowest work per metre slip values and power densities (Figures 4B,C), suggesting there was not enough energy per unit slip distance or unit time to damage the samples surfaces in order to produce wear products. Interestingly, the relationship between wear rate and WM and by extension, PD is porosity-specific, which indicates that lower energy during slip is required to induce damage in the (weaker) more porous samples. Thus porosity may be a contributing factor in the observation that whilst damage zone thickness scales with slip displacement, it varies by over three orders of magnitude for given displacement when considering different geomaterials and settings (Shipton et al., 2006).
The normal stress also controls the generation of frictional heat during sliding; at higher normal stress the heat generated is greater for a given slip rate for materials of each porosity (Figures 5A–C). Maximum surface temperatures observed generally (but with exceptions) increase with porosity for a given slip rate and normal stress (Figure 5). In the more porous materials, the roughness caused by porosity more effectively enhance stress concentration, increasing the shear resistance and work done at the slip surface, leading to a greater amount of energy dissipated as heat. Thus, higher porosities generally result in higher friction coefficients, wider damage zones, enhanced wear and more temperature release compared to the less porous counterparts (Figures 1–4, 7). Higher slip rates also resulted in higher temperatures (Figure 5) and heating rates (Figures 6A,B) with the exception of experiments on the 19% porosity samples at 0.5 MPa at 0.4 and 0.5 m s−1 (Figures 5B,E) where Tmax was lower than that of tests at lower slip rates. We attribute this to the observed lack of initial peak in shear stress data recorded (Figure 1A; Supplementary Figures S3E,F), perhaps due to the initial heterogeneous surface conditions that resulted in less initial work, which retarded heating and reduced the maximum temperature reached (though heating rate during the steady state period followed the expected trend). The increase in heating rates with slip rates corresponds with greater WM (Figure 6B) implying greater mechanical energy dissipation per unit of displacement. This is mirrored in the correlation of Tmax with PD (Figure 6C) with greater energy per unit time due to increased displacement experienced per second of slip acting to increase temperatures at the slip surface due to faster mechanical energy dissipation than the wall rock material capability to conduct or radiate heat away.
Wear rate and temperature may be sensitive to slip velocity for the same reason as friction coefficient, as asperities have less time to interact when slip is more rapid. Boneh and Reches (2018) relate wear rate to the mechanical impulse, derived from asperity contact period which is proportional to slip rate and describes the relationship between contact time and asperity failure; at higher slip rates, individual asperities spend less time interacting, hence less shear stress is generated and the likelihood of fracture or failure is reduced. An implication of this could be that faults that maintain higher friction coefficients due to the persistent roughness imposed by the presence of high porosity, could overcome the high friction conditions if slip rate becomes rapid enough to reduce interaction time of each point of stress concentration, lowering shear resistance. However, as asperities interact at greater and greater slip rates they have higher impact energy and thus increased power density and energy for heating, and thus frictional heat may still increase with slip rate even when friction coefficient and wear rate do not increase, as is observed here above ∼0.3 m s−1 (Figure 6).
Thermal weakening of the surface material may also act to reduce the strength of asperities (e.g., Sleep, 2019), a mechanism that would be material-dependent between different rocks and mineral assemblages with varying strengths. It must be noted that wear rates also influence the temperatures achieved at the slip surface (Figures 4, 6; Supplementary Figure S5); when wear rates are high, this may counteract the attainment of high temperatures. Specifically, for low porosity samples with low wear rates heating is in competition with heat dissipation away from the slip zone yet heat generated largely remains on the slip surface. However, the most porous samples (30%) with highest shortening rates have lower early slip zone temperatures and, in some experiments, lower temperatures throughout than the intermediate porosity samples, an effect which may be due to a combination of: 1) introduction of cooler (distal) material along the slip zone due wear and removal of (proximal) material originally along the slip plane; 2) more energy consumed during fracturing (due to surface area creation); 3) more effective heat dissipation to the atmosphere from the porous media; and 4) loss of hot particles from the slip zone during rapid wear and comminution as heated fractured material is expelled. So, it may be that these processes hamper heat generation as well as the ability to accumulate heat in the slip zone. Where wear rates are more rapid, the heated zone around the slip surface is narrower as wear rate exceeds the rate of conduction of heat away from the slip zone.
As the rates of heating on slip surfaces control the timing of various weakening mechanisms in natural faults, the data here would suggest that slip surfaces with high wear rates may not necessarily heat substantially as abundant fracturing and pervasive damage zones may be favoured instead. This could potentially delay the onset of thermal weakening mechanisms such as flash heating, thermal pressurisation and frictional melting that are methods of lubricating faults and allowing slip to occur with low friction coefficient. In nature, the addition of pore fluids in an interconnected porosity may also act to reduce normal stress and remove heat from the slip surface, further decreasing the opportunity for thermal weakening compared to denser materials (all else being equal). It is worth noting however that mature faults contain substantial gouge, which shows that fragmental products can accumulate in the slip zone. In these cases of confined slip planes, ejection of material would be less than that observed in the unconfined experiments in this study, and hot, comminuted fragments that are trapped may continue heating, contributing to thermal weakening. In nature, the addition of a through-going and perpetuating gouge layer prevents the direct interaction of slip surfaces, after which the friction (and wear) in the fault core would not be related to asperity wear from direct surface interaction but the properties of the gouge itself (e.g., Niemeijer et al., 2010). As such, wear rate during direct interaction of shear surfaces may only be comparable to new ruptures, where gouge layers are yet to be formed and developed (Sagy et al., 2007).
An example in which interaction of shear surfaces is maintained is during landslides or sector collapses. These events are controlled, especially in the early phases, by the initial wear and friction parameters, impacting the extent of initial collapse controlling the velocity of the mass movement (e.g., Legros, 2002) and the runout distance (often greater than predicted by simple friction models; e.g., Scheidegger, 1973). Such large displacement events often juxtapose lithologies of differing porosities, in which case predominant damage and wear of the more porous rocks contributes to cataclasis and material entrainment, potentially leading to a reduction in basal friction (Hughes et al., 2020).
A distinction between laboratory experiments and natural faults is the fractal nature of natural fault roughness. Here we examine inherent roughness in the form of porosity, yet the surface roughness of samples cannot replicate the fractal nature of natural fault surfaces and as a result, wear rate in natural faults demonstrably varies by more than their experimental counterparts (Scholz, 1987; Boneh et al., 2013; Boneh and Reches, 2018), as such the differences in wear rate as a function of porosity observed here may be exaggerated in a natural faulting environment. It must also be noted here that these experiments are conducted at low normal stresses and are unconfined. As such, they elucidate conditions in events occurring at upper crustal conditions (e.g., mass movements and landslides, glacier abrasion, volcanic edifice collapses and volcanic spine extrusion). To investigate lower crustal conditions, confinement of the sample would be necessary to test samples at higher normal stresses without failure. In these deeper conditions the natural porosity range may also be smaller due to greater lithostatic pressures preventing the existence of high porosity rocks.
Conclusion
Here we report on controlled experiments to study the impact of porosity on slip behaviour, wear and heat generation. Porosity in geomaterials acts to form an inherent roughness that cannot be removed by mechanical wear with accumulated slip. The roughness formed where pore margins interact with planar slip surfaces acts to increase shear resistance and friction coefficient. Porous samples also have higher wear rates compared to low porosity samples due to the increased asperity removal, producing higher levels of fractured material. Normal stress serves to promote asperity interaction, increasing shear resistance, wear rate and temperature.
The glass samples used have frictional coefficients in the lower range of Byerlee’s frictional behaviour expected for natural geomaterials at low normal stresses, especially at lower porosity, due to a lack of compositional and textural heterogeneity. This highlights the importance of other variables such as varying crystal strength and textural weaknesses along crystal and grain boundaries but allows for the isolation of the role of porosity on the frictional and tribological behaviour of geomaterials.
Friction coefficient and wear rate increase with increasing slip rate, then decrease beyond a velocity of ∼0.3 m s−1. The observed change in behaviour to slip weakening at higher slip rates may be a result of reduced asperity interaction times or of thermally activated weakening mechanism. It is likely this relates to the work per metre slip at the slip surface, defining a specific energy required for activation.
We observe a reduction in maximum recorded temperatures produced by frictional heating in some experiments with high wear rates (i.e., high porosity), which we attribute to an increased proportion of energy consumed in fracturing, enhanced heat dissipation from porous material and the removal of heated material from the slip zone due to wear and ejection. The interplay of frictional coefficient, work per metre slip, power density, wear rate and heating rate suggest that in some natural conditions (e.g., at shallow crustal depths), such as in porous host rocks, the onset of thermally activated weakening mechanisms may be delayed due to reduced frictional heating rates in the slip zone undergoing wear.
Data Availability Statement
The raw data supporting the conclusions of this article will be made available by the authors, without undue reservation.
Author Contributions
AH, JK and YL designed the concept and experiment plan, AH and FW prepared the samples, AH and JK collected the mechanical and thermal data, PW collected the thermal expansion data, AL modelled the thermal expansion during wear, AH took lead in data processing and manuscript preparation with input from all authors.
Acknowledgments
This study was supported by the Natural Environment Research Council (NERC) EAO Doctoral Training Partnership (Grant No. NE/L002469/1). This research was further funded by a Starting Grant from the European Research Council (ERC) to YL on Strain Localisation in Magma (SLiM, No. 306488), an Early Career Fellowship of the Leverhulme Trust Granted to JK (ECF-2016-325) and Research Fellowship of the Leverhulme Trust Granted to YL (RF-2019-526\4). We thank Hyun Na Kim and Jianye Chen for their well-thought, precise and constructive comments during the review process.
Conflict of Interest
The authors declare that the research was conducted in the absence of any commercial or financial relationships that could be construed as a potential conflict of interest.
Supplementary Material
The Supplementary Material for this article can be found online at: https://www.frontiersin.org/articles/10.3389/feart.2020.562548/full#supplementary-material
References
Abercrombie, R. E., and Rice, J. R. (2005). Can observations of earthquake scaling constrain slip weakening? Geophys. J. Int. 162, 406–424. doi:10.1111/j.1365-246x.2005.02579.x
Al-Harthi, A. A., Al-Amri, R. M., and Shehata, W. M. (1999). The porosity and engineering properties of vesicular basalt in Saudi Arabia. Eng. Geol. 54, 313–320. doi:10.1016/s0013-7952(99)00050-2
Al-Qutub, A. M., Allam, I. M., and Abdul Samad, M. A. (2008). Wear and friction of Al-Al2O3 composites at various sliding speeds. J. Mater. Sci. 43, 5797–5803. doi:10.1007/s10853-008-2867-8
Archard, J. F. (1953). Contact and rubbing of flat surfaces. J. Appl. Phys. 24, 981–988. doi:10.1063/1.1721448
Bhushan, B. (1998). Contact mechanics of rough surfaces in tribology: multiple asperity contact. Tribol. Lett. 4, 1–35. doi:10.1023/A:1019186601445
Boneh, Y., and Reches, Z. E. (2018). Geotribology—friction, wear, and lubrication of faults. Tectonophysics. 733, 171–181. doi:10.1016/j.tecto.2017.11.022
Boneh, Y., Sagy, A., and Reches, Z. (2013). Frictional strength and wear-rate of carbonate faults during high-velocity, steady-state sliding. Earth Planet. Sci. Lett. 381, 127–137. doi:10.1016/j.epsl.2013.08.050
Bowden, F. P., and Tabor, D. (2001). The friction and lubrication of solids, international series of monographs on physics. Oxford: Clarendon Press.
Brodsky, E. E., Kirkpatrick, J. D., and Candela, T. (2016). Constraints from fault roughness on the scale-dependent strength of rocks. Geology. 44, 19–22. doi:10.1130/g37206.1
Bubeck, A., Walker, R. J., Healy, D., Dobbs, M., and Holwell, D. A. (2017). Pore geometry as a control on rock strength. Earth Planet. Sci. Lett. 457, 38–48. doi:10.1016/j.epsl.2016.09.050
Candela, T., Renard, F., Klinger, Y., Mair, K., Schmittbuhl, J., and Brodsky, E. E. (2012). Roughness of fault surfaces over nine decades of length scales. J. Geophys. Res. Solid Earth. 117, 284–292. doi:10.1029/2011jb009041
Coats, R., Kendrick, J. E., Wallace, P. A., Miwa, T., Hornby, A. J., Ashworth, J. D., et al. (2018). Failure criteria for porous dome rocks and lavas: a study of Mt. Unzen, Japan. Solid Earth. 9, 1299–1328. doi:10.5194/se-9-1299-2018
Collettini, C., Niemeijer, A., Viti, C., and Marone, C. (2009). Fault zone fabric and fault weakness. Nature. 462, 907–910. doi:10.1038/nature08585
Collettini, C., Tesei, T., Scuderi, M. M., Carpenter, B. M., and Viti, C. (2019). Beyond Byerlee friction, weak faults and implications for slip behavior. Earth Planet. Sci. Lett. 519, 245–263. doi:10.1016/j.epsl.2019.05.011
Conway, J. C., Pangborn, R. N., Cohen, P. H., and Love, D. A. (1988). Dry sliding wear behavior of an Si-Al-O-N ceramic. Wear. 126, 79–90. doi:10.1016/0043-1648(88)90110-x
Cowan, D. S. (1999). Do faults preserve a record of seismic slip? A field geologist’s opinion. J. Struct. Geol. 21, 995–1001. doi:10.1016/s0191-8141(99)00046-2
Di Toro, G., Goldsby, D. L., and Tullis, T. E. (2004). Friction falls towards zero in quartz rock as slip velocity approaches seismic rates. Nature. 427, 436–439. doi:10.1038/nature02249
Di Toro, G., Han, R., Hirose, T., De Paola, N., Nielsen, S., Mizoguchi, K., et al. (2011). Fault lubrication during earthquakes. Nature. 471, 494–498. doi:10.1038/nature09838
Di Toro, G., Hirose, T., Nielsen, S., Pennacchioni, G., and Shimamoto, T. (2006). Natural and experimental evidence of melt lubrication of faults during earthquakes. Science. 311, 647–649. doi:10.1126/science.1121012
Di Toro, G., Mittempergher, S., Ferri, F., Mitchell, T. M., and Pennacchioni, G. (2012). The contribution of structural geology, experimental rock deformation and numerical modelling to an improved understanding of the seismic cycle. J. Struct. Geol. 38, 3–10. doi:10.1016/j.jsg.2012.01.025
Di Toro, G., Nielsen, S., and Pennacchioni, G. (2005). Earthquake rupture dynamics frozen in exhumed ancient faults. Nature. 436, 1009–1012. doi:10.1038/nature03910
Di Toro, G., and Pennacchioni, G. (2005). Fault plane processes and mesoscopic structure of a strong-type seismogenic fault in tonalites (Adamello batholith, Southern Alps). Tectonophysics. 402, 55–80. doi:10.1016/j.tecto.2004.12.036
Dieterich, J. H. (1979). Modeling of rock friction: 1. Experimental results and constitutive equations. J. Geophys. Res. 84, 2161–2168. doi:10.1029/jb084ib05p02161
Dunn, D. E., LaFountain, L. J., and Jackson, R. E. (1973). Porosity dependence and mechanism of brittle fracture in sandstones. J. Geophys. Res. 78, 2403–2417. doi:10.1029/jb078i014p02403
Elsworth, D., Voight, B., and Taron, J. (2007). Contemporary views of slope instability on active volcanoes, volcanic rocks. London: Taylor & Francis.
Engelder, J. T. (1974). Cataclasis and the generation of fault gouge. Geol. Soc. Am. Bull. 85, 1515–1522. doi:10.1130/0016-7606(1974)85<1515:catgof>2.0.co;2
Engelder, J. T., and Scholz, C. H. (1976). The role of asperity indentation and ploughing in rock friction-II. Int. J. Rock Mech. Min. Sci. Geomech. Abst. 13, 155–163. doi:10.1016/0148-9062(76)90820-2
Faulkner, D. R., Sanchez-Roa, C., Boulton, C., and den Hartog, S. A. M. (2018). Pore fluid pressure development in compacting fault gouge in theory, experiments, and nature. J. Geophys. Res. Solid Earth. 123, 226–241. doi:10.1002/2017jb015130
Fleming, J. R., and Suh, N. P. (1977). Mechanics of crack propagation in delamination wear. Wear. 44, 39–56. doi:10.1016/0043-1648(77)90083-7
Grunewald, U., Sparks, R. S. J., Kearns, S., and Komorowski, J. C. (2000). Friction marks on blocks from pyroclastic flows at the Soufriere Hills volcano, Montserrat: implications for flow mechanisms. Geology. 28, 827–830. doi:10.1130/0091-7613(2000)028<0827:fmobfp>2.3.co;2
Hacker, D. B., Biek, R. F., and Rowley, P. D. (2014). Catastrophic emplacement of the gigantic Markagunt gravity slide, southwest Utah (USA): implications for hazards associated with sector collapse of volcanic fields. Geology. 42, 943–946. doi:10.1130/g35896.1
Han, R., Shimamoto, T., Hirose, T., Ree, J.-H., and Ando, J.-I. (2007). Ultralow friction of carbonate faults caused by thermal decomposition. Science. 316, 878. doi:10.1126/science.1139763
Heap, M. J., Xu, T., and Chen, C. (2014). The influence of porosity and vesicle size on the brittle strength of volcanic rocks and magma. Bull. Volcanol. 76, 856. doi:10.1007/s00445-014-0856-0
Hirose, T., Mizoguchi, K., and Shimamoto, T. (2012). Wear processes in rocks at slow to high slip rates. J. Struct. Geol. 38, 102–116. doi:10.1016/j.jsg.2011.12.007
Hirose, T., and Shimamoto, T. (2005a). Growth of molten zone as a mechanism of slip weakening of simulated faults in gabbro during frictional melting. J. Geophys. Res. 110, B05202. doi:10.1029/2004jb003207
Hirose, T., and Shimamoto, T. (2005b). Slip-weakening distance of faults during frictional melting as inferred from experimental and natural pseudotachylytes. Bull. Seismol. Soc. Am. 95, 1666–1673. doi:10.1785/0120040131
Hornby, A. J., Kendrick, J. E., Lamb, O. D., Hirose, T., De Angelis, S., von Aulock, F. W., et al. (2015). Spine growth and seismogenic faulting at Mt. Unzen, Japan. J. Geophys. Res. Solid Earth. 126, 4034–4054. doi:10.1002/2014JB011660
Hughes, A., Kendrick, J. E., Salas, G., Wallace, P. A., Legros, F., Di Toro, G., et al. (2020). Shear localisation, strain partitioning and frictional melting in a debris avalanche generated by volcanic flank collapse. J. Struct. Geol. 140, 104132. doi:10.1016/j.jsg.2020.104132
Ikari, M. J., Saffer, D. M., and Marone, C. (2009). Frictional and hydrologic properties of clay-rich fault gouge. J. Geophys. Res. Solid Earth. 114, 634–678. doi:10.1029/2008jb006089
Kanamori, H., and Rivera, L. (2013). “Energy partitioning during an earthquake,” in Earthquakes: radiated energy and the physics of faulting. Washington, DC: American Geophysical Union, 3–13.
Kendrick, J. E., Lavallée, Y., Ferk, A., Perugini, D., Leonhardt, R., and Dingwell, D. B. (2012). Extreme frictional processes in the volcanic conduit of Mount St. Helens (USA) during the 2004–2008 eruption. J. Struct. Geol. 38, 61–76. doi:10.1016/j.jsg.2011.10.003
Kendrick, J. E., Lavallée, Y., Hirose, T., Di Toro, G., Hornby, A. J., De Angelis, S., et al. (2014). Volcanic drumbeat seismicity caused by stick-slip motion and magmatic frictional melting. Nat. Geosci. 7, 438–442. doi:10.1038/ngeo2146
Lamur, A., Kendrick, J. E., Wadsworth, F. B., and Lavallée, Y. (2019). Fracture healing and strength recovery in magmatic liquids. Geology. 47, 195–198. doi:10.1130/g45512.1
Lavallée, Y., Hirose, T., Kendrick, J. E., De Angelis, S., Petrakova, L., Hornby, A. J., et al. (2014). A frictional law for volcanic ash gouge. Earth Planet. Sci. Lett. 400, 177–183. doi:10.1016/j.epsl.2014.05.023
Lavallée, Y., Hirose, T., Kendrick, J. E., Hess, K.-U., and Dingwell, D. B. (2015). Fault rheology beyond frictional melting. Proc. Natl. Acad. Sci. U.S.A. 112, 9276–9280. doi:10.1073/pnas.1413608112
Lavallée, Y., and Kendrick, J. (2020). “A review of the physical and mechanical properties of volcanic rocks and magmas in the brittle and ductile fields,” in Forecasting and planning for volcanic hazards, risks, and disasters. Editors P. Papale, and J. F. Shroder, (Amsterdam: Elsevier Hazards and Disasters Series), 214.
Le Bas, M. J., and Streckeisen, A. L. (1991). The IUGS systematics of igneous rocks. J. Geol. Soc. 148, 825–833. doi:10.1144/gsjgs.148.5.0825
Legros, F. (2002). The mobility of long-runout landslides. Eng. Geol. 63, 301–331. doi:10.1016/S0013-7952(01)00090-4
Ma, S., Shimamoto, T., Yao, L., Togo, T., and Kitajima, H. (2014). A rotary-shear low to high-velocity friction apparatus in Beijing to study rock friction at plate to seismic slip rates. Earthq. Sci. 27, 469–497. doi:10.1007/s11589-014-0097-5
Mair, K., and Abe, S. (2011). Breaking up: comminution mechanisms in sheared simulated fault gouge. Pure Appl. Geophys. 168, 2277–2288. doi:10.1007/s00024-011-0266-6
Marone, C. (1998). Laboratory-derived friction laws and their application to seismic faulting. Annu. Rev. Earth Planet. Sci. 26, 643–696. doi:10.1146/annurev.earth.26.1.643
Masch, L., Wenk, H. R., and Preuss, E. (1985). Electron microscopy study of hyalomylonites-evidence for frictional melting in landslides. Tectonophysics. 115, 131–160. doi:10.1016/0040-1951(85)90103-9
Matsu’ura, M., Kataoka, H., and Shibazaki, B. (1992). Slip-dependent friction law and nucleation processes in earthquake rupture. Tectonophysics. 211, 135–148. doi:10.1016/0040-1951(92)90056-C
Mitchell, T. M., Toy, V., Di Toro, G., Renner, J., and Sibson, R. H. (2016). Fault welding by pseudotachylyte formation. Geology. 44, 1059–1062. doi:10.1130/g38373.1
Moore, M. A., and King, F. S. (1980). Abrasive wear of brittle solids. Wear. 60, 123–140. doi:10.1016/0043-1648(80)90253-7
Nielsen, S., Di Toro, G., Hirose, T., and Shimamoto, T. (2008). Frictional melt and seismic slip. J. Geophys. Res. 113, B01308. doi:10.1029/2007jb005122
Niemeijer, A., Marone, C., and Elsworth, D. (2010). Frictional strength and strain weakening in simulated fault gouge: competition between geometrical weakening and chemical strengthening. J. Geophys. Res. Solid Earth. 115, B10207. doi:10.1029/2009jb000838
Numelin, T., Marone, C., and Kirby, E. (2007). Frictional properties of natural fault gouge from a low-angle normal fault, Panamint Valley, California. Tectonics. 26, 124–132. doi:10.1029/2005tc001916
Power, W. L., Tullis, T. E., and Weeks, J. D. (1988). Roughness and wear during brittle faulting. J. Geophys. Res. 93, 15268–15278. doi:10.1029/jb093ib12p15268
Queener, C. A., Smith, T. C., and Mitchell, W. L. (1965). Transient wear of machine parts. Wear. 8, 391–400. doi:10.1016/0043-1648(65)90170-5
Rajabzadeh, M. A., Moosavinasab, Z., and Rakhshandehroo, G. (2012). Effects of rock classes and porosity on the relation between uniaxial compressive strength and some rock properties for carbonate rocks. Rock Mech. Rock Eng. 45, 113–122. doi:10.1007/s00603-011-0169-y
Rapetto, M. P., Almqvist, A., Larsson, R., and Lugt, P. M. (2009). On the influence of surface roughness on real area of contact in normal, dry, friction free, rough contact by using a neural network. Wear. 266, 592–595. doi:10.1016/j.wear.2008.04.059
Rice, J. R. (2006). Heating and weakening of faults during earthquake slip. J. Geophys. Res. Solid Earth. 111, 392–424. doi:10.1029/2005jb004006
Rozeanu, L. (1963). Fatigue wear as a rate process. Wear. 6, 337–340. doi:10.1016/0043-1648(63)90201-1
Ruina, A. (1983). Slip instability and state variable friction laws. J. Geophys. Res. 88, 10359–10370. doi:10.1029/jb088ib12p10359
Rutter, E. H., Holdsworth, R. E., and Knipe, R. J. (2001). The nature and tectonic significance of fault-zone weakening: an introduction. Geol. Soc. Lond. Special Publ. 186, 1–11. doi:10.1144/gsl.sp.2001.186.01.01
Ryan, A. G., Kolzenburg, S., Vona, A., Heap, M. J., Russell, J. K., and Badger, S. (2019). A proxy for magmatic foams: FOAMGLAS, a closed-cell glass insulation. J. Non-Cryst. Solids: X. 1, 100001. doi:10.1016/j.nocx.2018.100001
Saadati, M., Forquin, P., Weddfelt, K., Larsson, P., and Hild, F. (2018). On the mechanical behavior of granite material with particular emphasis on the influence from pre-existing cracks and defects. J. Test. Eval. 46, 33–45. doi:10.1520/JTE20160072
Sagy, A., Brodsky, E. E., and Axen, G. J. (2007). Evolution of fault-surface roughness with slip. Geology. 35, 283–286. doi:10.1130/g23235a.1
Scheidegger, A. E. (1973). On the prediction of the reach and velocity of catastrophic landslides. Rock Mech. 5, 231–236. doi:10.1007/bf01301796
Scholz, C. H. (1987). Wear and gouge formation in brittle faulting. Geology. 15, 493–495. doi:10.1130/0091-7613(1987)15<493:wagfib>2.0.co;2
Scholz, C. H. (2019). The mechanics of earthquakes and faulting. Cambridge: Cambridge University Press.
Scholz, C. H., and Engelder, J. T. (1976). The role of asperity indentation and ploughing in rock friction—I. Int. J. Rock Mech. Min. Sci. Geomech. Abst. 13, 149–154. doi:10.1016/0148-9062(76)90819-6
Schumacher, J. C. (1999). Introduction to metamorphic textures. 2nd Edn. Editor A. J. Barker, (Cheltenham: Stanley Thornes), 264. ISBN 0748739858. Paperback £29.95.
Shimamoto, T., and Tsutsumi, A. (1994). A new rotary-shear high-speed frictional testing machine: its basic design and scope of research. J. Tect. Res. Group Jpn. 39, 65–78. doi:10.1007/s11589-014-0097-5
Shipton, Z. K., Soden, A. M., Kirkpatrick, J. D., Bright, A. M., and Lunn, R. J. (2006). “How thick is a fault? Fault displacement-thickness scaling revisited,” in Earthquakes: radiated energy and the physics of faulting, Geophysical Monograph Series. Editor R. Abercrombie, (Hoboken: AGU).
Sibson, R. H. (1973). Interactions between temperature and pore-fluid pressure during earthquake faulting and a mechanism for partial or total stress relief. Nat. Phys. Sci. 243, 66–68. doi:10.1038/physci243066a0
Sibson, R. H. (1975). Generation of pseudotachylyte by ancient seismic faulting. Geophys. J. Int. 43, 775–794. doi:10.1111/j.1365-246x.1975.tb06195.x
Sibson, R. H. (1977). Fault rocks and fault mechanisms. J. Geol. Soc. 133, 191–213. doi:10.1144/gsjgs.133.3.0191
Sibson, R. H. (1994). An assessment of field evidence for? Byerlee? friction. Pure Appl. Geophys. 142, 645–662. doi:10.1007/bf00876058
Sleep, N. H. (2019). Thermal weakening of asperity tips on fault planes at high sliding velocities. Geochem. Geophys. Geosyst. 20, 1164–1188. doi:10.1029/2018gc008062
Spray, J. G. (1992). A physical basis for the frictional melting of some rock-forming minerals. Tectonophysics. 204, 205–221. doi:10.1016/0040-1951(92)90308-s
Spray, J. G. (2010). Frictional melting processes in planetary materials: from hypervelocity impact to earthquakes. Annu. Rev. Earth Planet. Sci. 38, 221–254. doi:10.1146/annurev.earth.031208.100045
Togo, T., Yao, L., Ma, S., and Shimamoto, T. (2016). High-velocity frictional strength of Longmenshan fault gouge and its comparison with an estimate of friction from the temperature anomaly in WFSD-1 drill hole. J. Geophys. Res. Solid Earth. 121, 5328–5348. doi:10.1002/2016JB012880
Townend, J. (2006). “What do faults feel? Observational constraints on the stresses acting on seismogenic faults,” in Earthquakes: radiated energy and the physics of faulting. R. Editors Abercrombie, A. McGarr, G. Di Toro, and H. Kanamori, (Washington, DC: American Geophysical Union), 313–327.
Vasseur, J., Wadsworth, F. B., Lavallée, Y., Bell, A. F., Main, I. G., and Dingwell, D. B. (2015). Heterogeneity: the key to failure forecasting. Sci. Rep. 5, 13259. doi:10.1038/srep13259
Vasseur, J., Wadsworth, F. B., Lavallée, Y., Hess, K. U., and Dingwell, D. B. (2013). Volcanic sintering: timescales of viscous densification and strength recovery. Geophys. Res. Lett. 40, 5658–5664. doi:10.1002/2013gl058105
Wadsworth, F. B., Vasseur, J., Llewellin, E. W., Dobson, K. J., Colombier, M., von Aulock, F. W., et al. (2017). Topological inversions in coalescing granular media control fluid-flow regimes. Phys. Rev. E. 96, 33113. doi:10.1103/physreve.96.033113
Wadsworth, F. B., Vasseur, J., Llewellin, E. W., Schauroth, J., Dobson, K. J., Scheu, B., et al. (2016). Sintering of viscous droplets under surface tension. Proc. Math. Phys. Eng. Sci. 472: 20150780. doi:10.1098/rspa.2015.0780
Wadsworth, F. B., Vasseur, J., Schauroth, J., Llewellin, E. W., Dobson, K. J., Havard, T., et al. (2019). A general model for welding of ash particles in volcanic systems validated using in situ X-ray tomography. Earth Planet. Sci. Lett. 525, 115726. doi:10.1016/j.epsl.2019.115726
Wallace, P. A., De Angelis, S. H., Hornby, A. J., Kendrick, J. E., Clesham, S., von Aulock, F. W., et al. (2019a). Frictional melt homogenisation during fault slip: geochemical, textural and rheological fingerprints. Geochim. Cosmochim. Acta. 255, 265–288. doi:10.1016/j.gca.2019.04.010
Wallace, P. A., Kendrick, J. E., Miwa, T., Ashworth, J. D., Coats, R., Utley, J. E. P., et al. (2019b). Petrological architecture of a magmatic shear zone: a multidisciplinary investigation of strain localisation during magma ascent at Unzen volcano, Japan. J. Petrol. 60, 791–826. doi:10.1093/petrology/egz016
Wang, W., and Scholz, C. H. (1994). Wear processes during frictional sliding of rock: a theoretical and experimental study. J. Geophys. Res. 99, 6789–6799. doi:10.1029/93jb02875
Watson, S. W., Friedersdorf, F. J., Madsen, B. W., and Cramer, S. D. (1995). Methods of measuring wear-corrosion synergism. Wear. 181–183, 476–484. doi:10.1016/0043-1648(95)90161-2
Weng, H., and Yang, H. (2018). Constraining frictional properties on fault by dynamic rupture simulations and near-field observations. J. Geophys. Res. Solid Earth. 123, 6658–6670. doi:10.1029/2017JB015414
Wheaton, R. (2016). “Chapter 2—basic rock and fluid properties,” in Fundamentals of applied reservoir engineering. Editor R. Wheaton, (Houston, TX: Gulf Professional Publishing), 5–57. doi:10.1016/B978-0-08-101019-8.00002-8
Keywords: porosity, tribology, frictional heating, glass, slip weakening, comminution, gouge
Citation: Hughes A, Kendrick JE, Lamur A, Wadsworth FB, Wallace PA, Di Toro G and Lavallée Y (2020) Frictional Behaviour, Wear and Comminution of Synthetic Porous Geomaterials. Front. Earth Sci. 8:562548. doi: 10.3389/feart.2020.562548
Received: 15 May 2020; Accepted: 29 September 2020;
Published: 24 November 2020.
Edited by:
Sung Keun Lee, Seoul National University, South KoreaReviewed by:
Hyun Na Kim, Kongju National University, South KoreaJianye Chen, Utrecht University, Netherlands
Copyright © 2020 Hughes, Kendrick, Lamur, Wadsworth, Wallace, Di Toro and Lavallée. This is an open-access article distributed under the terms of the Creative Commons Attribution License (CC BY). The use, distribution or reproduction in other forums is permitted, provided the original author(s) and the copyright owner(s) are credited and that the original publication in this journal is cited, in accordance with accepted academic practice. No use, distribution or reproduction is permitted which does not comply with these terms.
*Correspondence: Amy Hughes, ah391@liv.ac.uk