Article

Hydroclimatic Extremes in the Limpopo River Basin, South Africa, under Changing Climate

by
Christina M. Botai
1,*,
Joel O. Botai
1,2,3,4,
Nosipho N. Zwane
1,
Patrick Hayombe
5,
Eric K. Wamiti
5,
Thabo Makgoale
1,
Miriam D. Murambadoro
1,6,
Abiodun M. Adeola
1,7,
Katlego P. Ncongwane
1,8,
Jaco P. de Wit
1,
Michael G. Mengistu
1,4 and
Henerica Tazvinga
1
1
South African Weather Service, Private Bag X097, Pretoria 0001, South Africa
2
Department of Geography, Geoinformatics and Meteorology, University of Pretoria, Private Bag X20, Hatfield Pretoria 0028, South Africa
3
Department of Information Technology, Central University of Technology, Free State Private Bag X20539, Bloemfontein 9300, South Africa
4
School of Agricultural Earth and Environmental Sciences, University of KwaZulu-Natal, Durban 4041, South Africa
5
Kenya Water Institute, P.O. Box 60013–00200, Nairobi, Kenya
6
Global Change Institute, University of the Witwatersrand, Private Bag 3, Wits 2050, Johannesburg, South Africa
7
School of Health Systems and Public Health, Faculty of Health Sciences, University of Pretoria, Private Bag X20, Hatfield Pretoria 0028, South Africa
8
School of Geography and Environmental Science, University of KwaZulu-Natal, Durban 4041, South Africa
*
Author to whom correspondence should be addressed.
Water 2020, 12(12), 3299; https://doi.org/10.3390/w12123299
Submission received: 16 October 2020 / Revised: 14 November 2020 / Accepted: 18 November 2020 / Published: 24 November 2020
(This article belongs to the Section Hydrology)

Abstract

:
This research study evaluated the projected future climate and anticipated impacts on water-linked sectors on the transboundary Limpopo River Basin (LRB) with a focus on South Africa. Streamflow was simulated from two CORDEX-Africa regional climate models (RCMs) forced by the 5th phase of the Coupled Model Inter-Comparison Project (CMIP5) Global Climate Models (GCMs), namely, the CanESM2m and IPSL-CM5A-MR climate models. Three climate projection time intervals were considered spanning from 2006 to 2099 and delineated as follows: current climatology (2006–2035), near future (2036–2065) and end of century future projection (2070–2099). Statistical metrics derived from the projected streamflow were used to assess the impacts of the changing climate on water-linked sectors. These metrics included streamflow trends, low and high flow quantile probabilities, the Standardized Streamflow Index (SSI) trends and the proportion (%) of dry and wet years, as well as drought monitoring indicators. Based on the Mann-Kendall (MK) trend test, the LRB is projected to experience reduced streamflow in both the near and the distant future. The basin is projected to experience frequent dry and wet conditions that can translate to drought and flash floods, respectively. In particular, a high proportion of dry and a few incidences of wet years are expected in the basin in the future. In general, the findings of this research study will inform and enhance climate change adaptation and mitigation policy decisions and implementation thereof, to sustain the livelihoods of vulnerable communities.

1. Introduction

Adverse repercussions attributed to climate change and variability on socio-economic sectors, such as water resources, energy, agriculture, health and ecosystem services, are gradually becoming a major concern to various communities, locally, nationally, regionally and even globally [1]. Consequently, there are growing calls for government institutions to revise and enhance the existing mitigation and adaptation planning strategies, to prepare the most vulnerable communities exposed to stressors of climate change [1]. Hydrological extremes such as floods and drought cause more increased havoc yearly—these impacts include loss of life and agricultural produce as well as the destruction of infrastructure at various spatial and temporal scales [2]. Such extremes are also attributed to the vulnerability of groundwater resource systems as well as the sensitivity of such systems to natural disasters through impacts on the changes in climatic variables such as precipitation, evapotranspiration and streamflow [3,4]. Groundwater systems form part of the hydrological cycle and are too affected by climate change and variability, coupled with socio-economic activities [5,6]. For instance, variations in rainfall patterns coupled with land-use change effects can intensify soil erosion affecting renewable groundwater resources. Such variations can have an impact on groundwater-surface systems, including wetlands and other groundwater dependent ecosystems. Consequently, groundwater systems are essential for effective monitoring, planning and management of water resources, under the changing climate [3,4].
Several research studies suggest that the observed historical trends in the frequency of heavy to extreme hydrological events are associated with extreme precipitation events [7], increases in global average air, ocean and near-surface temperatures, widespread melting of snow and ice, as well as rising global average sea level [1,8,9,10,11,12,13]. Furthermore, future climate projections have indicated a decrease in groundwater recharge by the 2050s, considered as a limiting factor for the sustainable use of groundwater [14], and increase in most climatic variables (e.g., global mean temperature [15,16,17], heat stress and frequent and prolonged heat waves [18,19] and highly variable precipitation [17]) in most parts of Africa. Such changes in projected climate variables are likely to exacerbate the frequent occurrences of hydrological extremes thereby elevating the strain on the already stressed water resources for agriculture, industry and households, thus resulting in a significant impact on local populations, as well as their livelihoods [20].
The unprecedented upsurge of climate change impacts calls for continuous monitoring and appraisal of metrics of climate change across all climate-sensitive sectors. This includes the monitoring of climatological variables such as precipitation, evaporation and air temperature, among others, as well as hydrometric variables such as streamflow (discharge). There are various ways in which climatological and hydrometric variables can be monitored. These include the use of integrated models to model interactions between natural and human processes [3], the assessment of trends in hydrological statistical parameters (e.g., annual mean, median, minimum and maximum) of the climate variables [21,22,23,24], General Extreme Value (GEV) analysis to determine the probability distribution and return periods of extreme events [25,26] and drought monitoring based on drought indices and drought monitoring indicators [27,28,29,30,31]. Research studies on monitoring of hydroclimatic variables are an essential supportive tool for policy makers in disaster preparedness, particularly in the most vulnerable communities, who are anticipated to always respond in earnest and continuously propose climate-related policies that support societal well-being, protection of infrastructure and all sectors of the economy.
In general, research studies in the monitoring of hydroclimatic variables and inherent extremes at catchment, national regional and global levels are well documented in the literature. However, there have been insufficient studies of future projections of hydroclimatic extremes, particularly in South Africa, more so at the catchment level, despite the country’s vulnerability to climate change. Given that the socio-economic impacts of weather and climate extremes are likely to increase as the extremes become more frequent [20], simulations of reliable future climate changes will aid our understanding of the projected climate and the inherent impacts on water-linked sectors. In this regard, this study aims to evaluate the projected future climate and anticipated impacts on water-linked sectors in the Limpopo River Basin (LRB) with a focus on South Africa. To achieve this, streamflow simulated from the Coordinated Regional Downscaling Experiment (CORDEX) model projections are assessed at three different time intervals. Statistical metrics such as trends in projected streamflow, the Standardized Streamflow Index (SSI), the proportion of dry and wet years and drought monitoring indicators are used to assess the impacts of future climate on water-linked sectors in the LRB.

2. Study Area, Materials and Methods
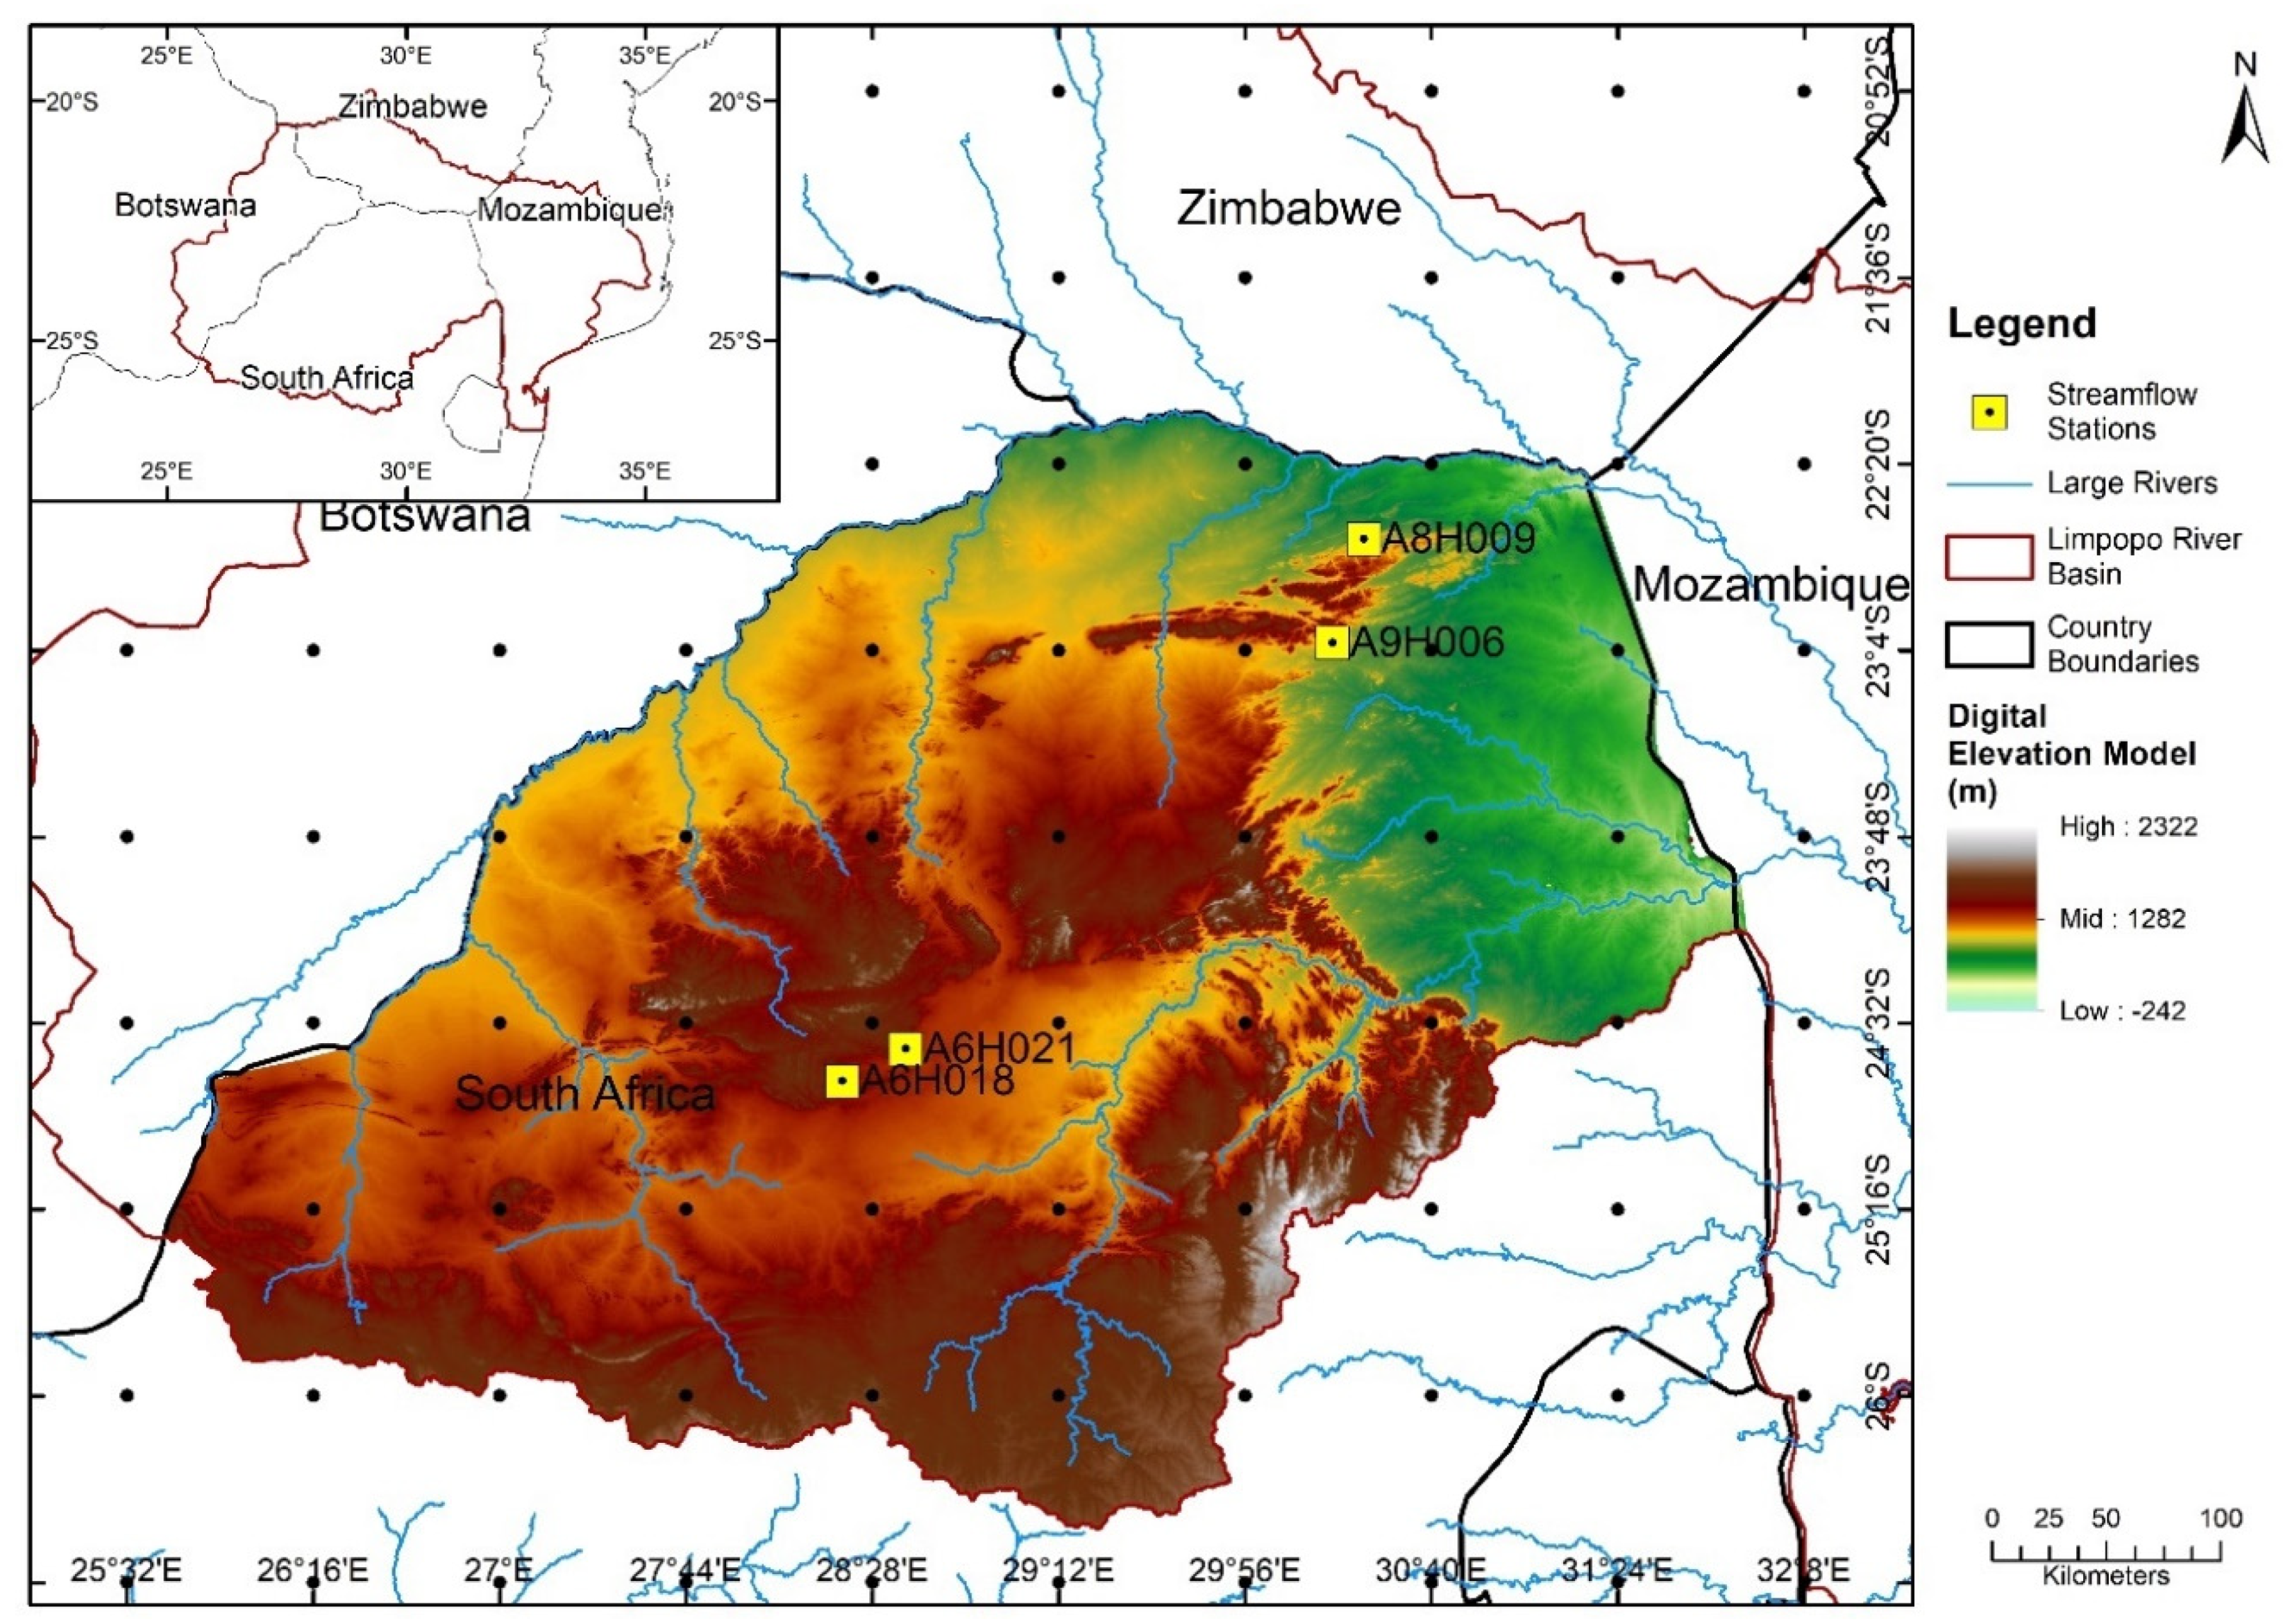
2.1. Study Area

The LRB, shown in Figure 1, is the fourth largest transboundary river basin in Southern Africa spanning over 416,296 km². The basin spreads over four countries and flows from the border between South Africa and Botswana, through South Africa and Zimbabwe and into Mozambique where it enters the Indian Ocean at Zongoene [32]. There are about 14 million people who are supported by the basin and slightly over 50% of the population is rural, however, the rate of urbanization in the basin has also increased over time [33]. A significant proportion of the rural population is involved in rainfed agriculture to sustain their livelihoods [34]. The basin has a wide range of wildlife and biodiversity which sustains tourism in the region. Currently, almost all the water in the upper LRB is allocated to different water users in the social and economic sectors such as agriculture, industry, power stations and municipalities [35].
The climate in the LRB is generally subtropical dry savannah with highly variable rainfall across the basin, ranging between 200 mm/year in the western drier parts of the basin and 600 mm/year in the eastern parts close to the Indian Ocean. The south middle parts of the catchment receive above 1500 mm/year, and more than 90% of the rain is received between October and April [32]. The LRB is also prone to extreme weather events such as floods and droughts, highlighting the need for disaster preparedness and efficient early warning systems [33]. The climate is influenced by, among other things, the continental tropical, equatorial convergence zone and moist, marine, subtropical eastern and marine western Mediterranean air masses [36]. On the one hand, the lower Limpopo River for example from Chokwe to the Guija district to the Mozambican coast at Xai Xai are low lying areas of the floodplain that have rich soils but are more susceptible to flooding and loss of agricultural produce and other assets as a result of high rainfall and tropical cyclones in the area as well as the upper catchments [33]. Consequently, despite the rich soils, poverty, loss of biodiversity, huge sediment load and food and water insecurity are some of the persistent challenges faced by communities in these parts of the basin.

2.2. Data

2.2.1. Observational Datasets

Monthly observed rainfall and minimum and maximum temperature data were obtained from the Hadley Center Climate Research Unit (CRU) TS2.0 monthly 50 km resolution observed dataset [37]. Daily streamflow observational data for the study site was obtained from the Department of Water and Sanitation of South Africa. Four downstream streamflow gauge stations were selected for the study. The selected stations have been operational for over three decades; hence, they provide reliable and continuous datasets. Two of the downstream streamflow stations were selected for the period, spanning from 1976 to 2005. The averaged streamflow data from the selected stations were utilized to bias correct the simulated streamflow across the four analyzed periods.

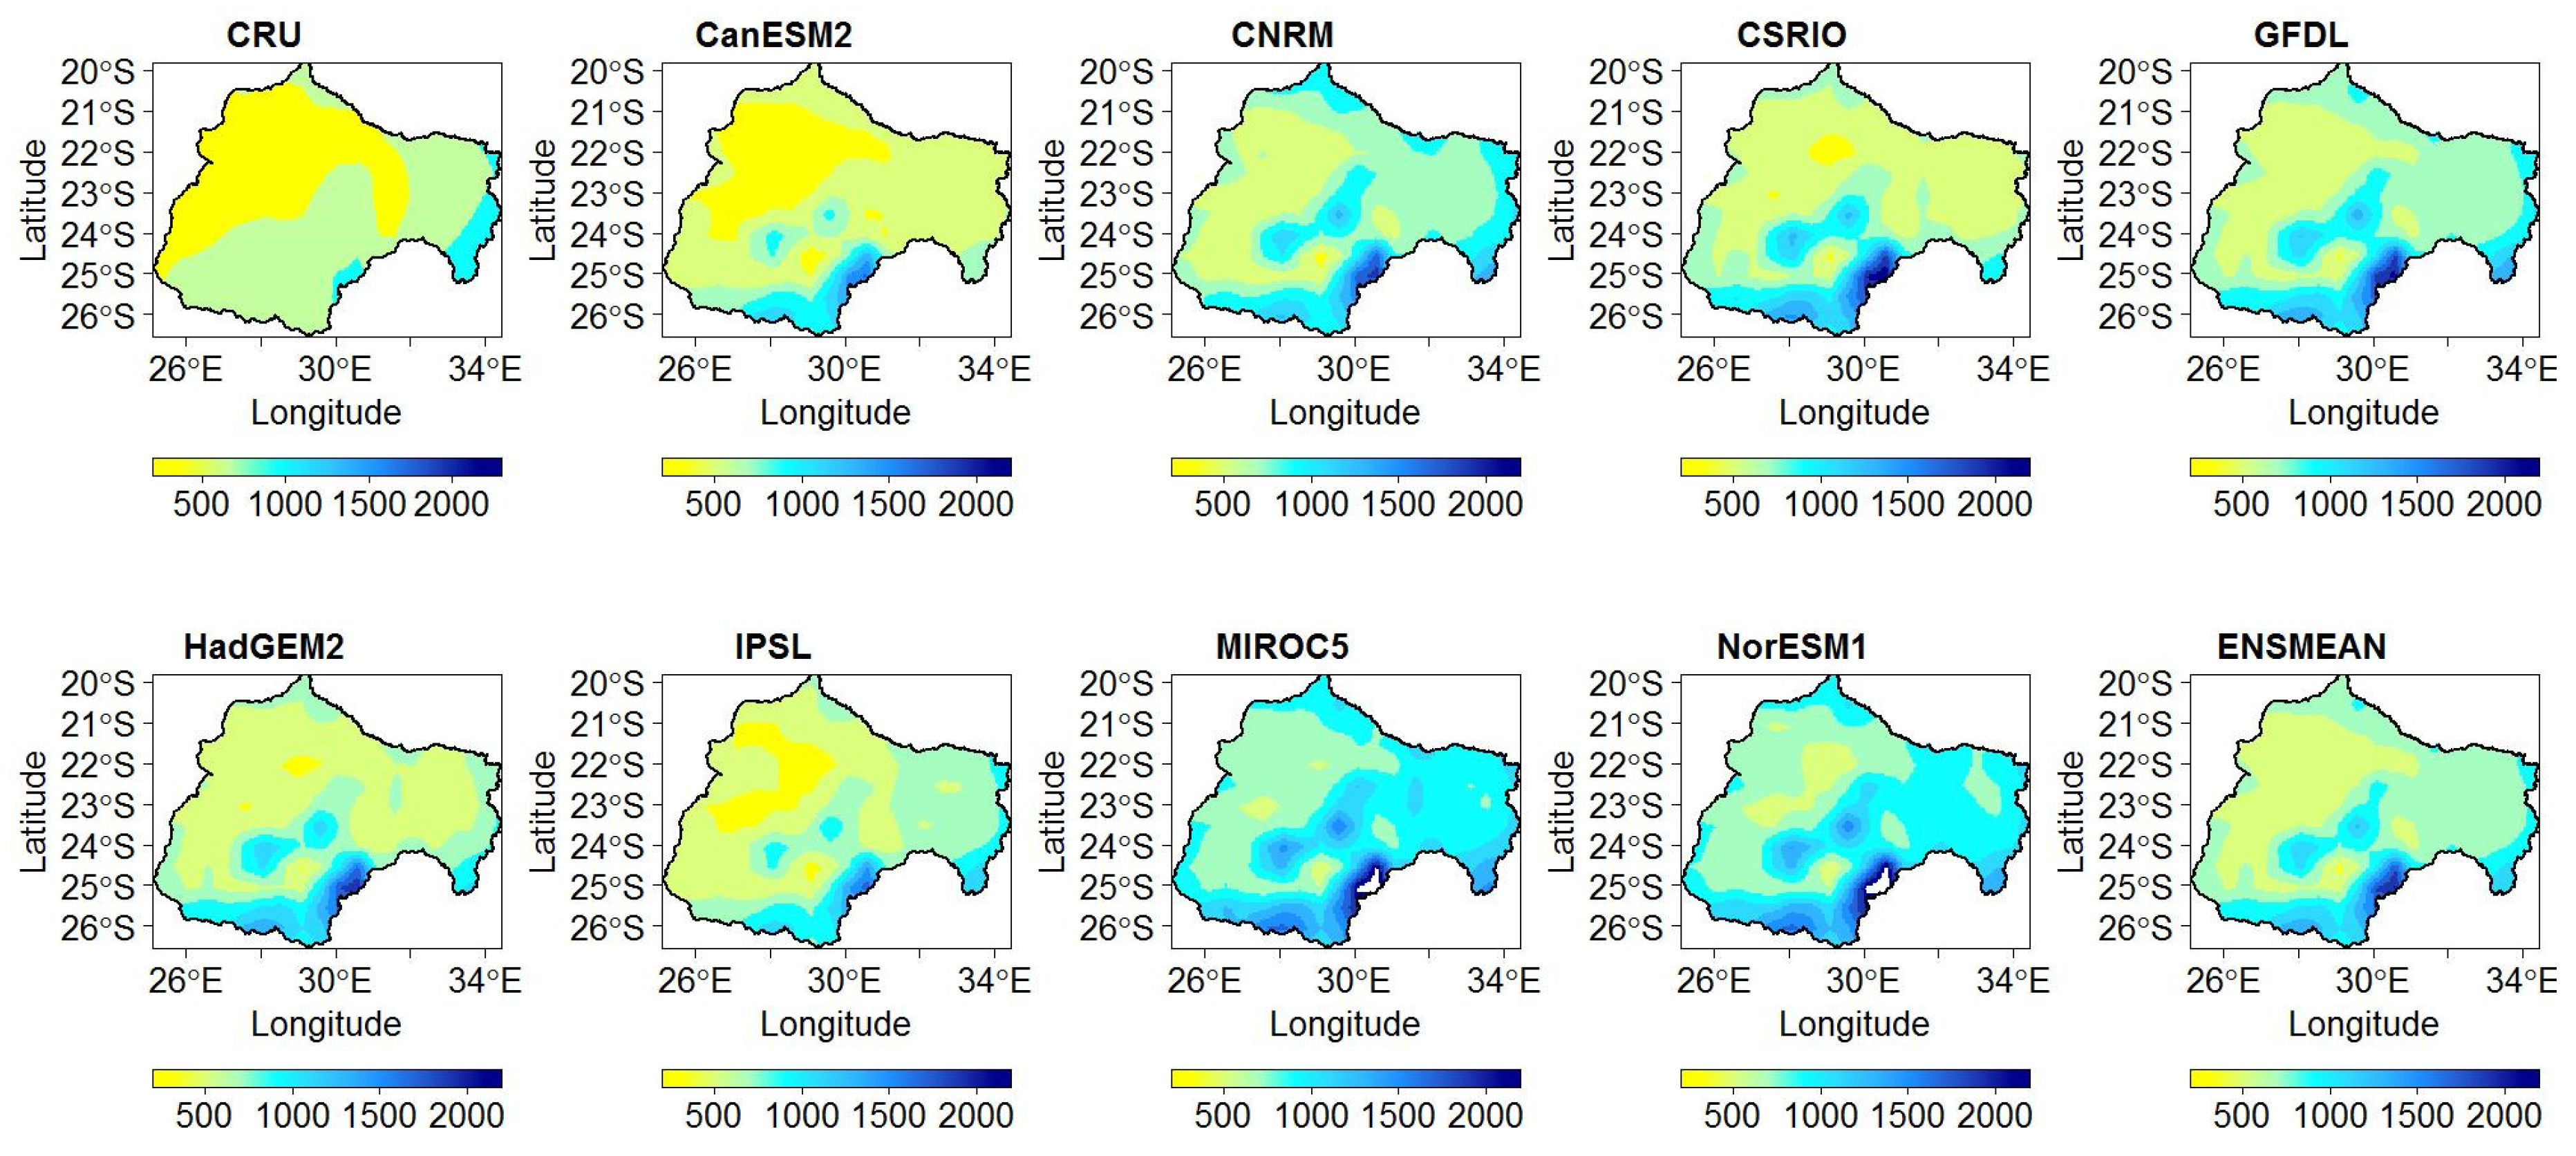
2.2.2. CORDEX Models and Sensitivity Analysis

The present research study used the CORDEX-Africa daily climate simulation data at a spatial resolution of 50 km to force an Agricultural Catchment Research Unit (ACRU) hydrological model. The CORDEX-Africa simulations were obtained from the CORDEX Rossby Centre regional model (RCA4), e.g., the Regional Climate Models (RCMs) downscaled using a dynamic downscaling approach. In this technique, climate data from Global Climate Models (GCMs) are used as the main inputs that drive the RCMs. In the current analysis, the CORDEX climate simulation data from the RCA4 RCMs were driven by nine GCMs of the 5th phase of the Coupled Model Inter-Comparison Project (CMIP5) [38] at the boundary of the African domain. In particular, the historical CORDEX RCA4 RCMs (spanning from 1976 to 2005) were forced by nine CMIP5 historical GCMs. Similarly, RCA4 RCMs climate projections were forced by the corresponding CMPI5 GCMs projections under two different Representative Concentration Pathways (RCP4.5 and RCP8.5 scenarios). These climate projections, spanning from 2006 to 2099, were delineated into the present climatology (2006–2035), the near-future (2036–2065) and the end of the century (2070–2099). The nine selected forcing GCMs include the three state-of-the-art Earth System Models, viz CanESM2m, NorESMI-M and GFDL-ESM2M; the National Centre for Meteorological Research model (CNRM-CM5); the Institut Pierre Simon Laplace model, IPSL-CM5A-MR; the Hadley Centre Global Environment Model version 2 (HadGEM2); the Centre National de Recherches Meteorologiques (CNRM) model; the Model for Interdisciplinary Research on Climate, version 5 (MIROC5) and the Commonwealth Scientific and Industrial Research Organisation (CSIRO) climate model.
The nine GCMs were first assessed through sensitivity analysis. The purpose of sensitivity analysis was to select the best model, that is, the model that was able to simulate the climate conditions in the LRB. Finding a model that reproduces the general features of the catchment’s climate correctly is always a challenge due to various factors, which include model parametrization, the spatial resolution of the models and topographic features, including land-surface heterogeneities. Given that rainfall is the main driver of streamflow, RCMs’ simulated rainfall was evaluated against the observations. Models that performed well in simulating spatial distribution of annual rainfall were chosen to drive the hydrology model. As shown in Figure 2, the spatial distribution of annual rainfall totals is well captured by CanESM2 and IPSL-CM5A-MR RCMs. In the basin, many of areas in the western part receive a relatively low annual rainfall (about 500–600 mm/year), and rainfall increases towards the eastern part with some areas reaching a maximum of 1000–1500 mm/year. The two models were therefore selected and utilized to assess the historical and projected streamflow in the LRB and the inherent impacts on water-linked sectors. The ensemble model calculated from six GCMs was also included in the analysis. Results from the two models and the ensemble were compared with the aim of assessing the importance of using a correct model, particularly at a regional level, where the resolution of the models is always problematic.

2.2.3. Hydrological Model

The ACRU model, developed at the former School of Bioresources Engineering and Environmental Hydrology of the University of KwaZulu-Natal, South Africa [39], was used in this study to simulate streamflow across the selected CORDEX models and time intervals. This hydrological model is a multi-purpose and integrated multi-soil-layered agro-hydrological modelling system, which runs on a daily time-step. ACRU is configured to be hydrologically sensitive to catchment land uses and the corresponding changes, hence, it has the ability to simulate catchment hydrological responses relating to land management, including the impacts of land-cover/land-use changes on water flows [39,40]. The model requirements include inputs of known and measurable spatio-temporal variable factors that characterize the watershed. The minimum catchment information required to operate ACRU is the daily precipitation as well as daily maximum and minimum temperature datasets. Output information derived from ACRU include daily streamflow, separated into stormflow and baseflow, peak discharge, reservoir status, recharge to groundwater, irrigation water supply and demand, crop yields and sediment yield. The ACRU model has been widely used in various hydrological studies across Southern Africa [41,42,43] as well as in other parts globally, including Canada [44], New Zealand [45] and Ghana [46], among others. For a detailed description and theoretical background of the ACRU model, the reader is referred to [39]. In this study, ACRU was used in a lumped mode to simulate streamflow for four different time intervals, namely, the historical (1976–2005), present (2006–2035), near future (2036–2065) and distant future (2070–2099).

2.3. Methods

2.3.1. Streamflow Simulations

In this study, the impacts of climate change in the LRB were based on the analysis of streamflow simulated from CORDEX-Africa, forced by two CMIP5 GCMs under the RCP4.5 and RCP8.5 scenarios. In this regard, changes in the streamflow were analyzed based on 30-year future projection periods, arbitrarily delineated in a specific time scale, from near (present), mid-century and distant future periods. Changes in the streamflow under the classified periods were compared with a 30-year reference (historical) period [47,48], which in this study was set from 1976 to 2005. The assessment of the impacts of climate change on water resources and water-linked sectors in the LRB was based on the evaluation of streamflow trends of the annual mean, minimum and maximum hydrological statistical parameters. The low-, mid- and high-flow (quantiles) characteristics were evaluated given that they relate to dry, normal and wet conditions, respectively. In addition, the trends in the drought duration and severity, calculated from the SSI, were analyzed across different periods.

2.3.2. Mann-Kendall Trend

The Mann-Kendall (MK) test, also considered as the original form of the MK test [49,50], was applied to the streamflow and SSI time series across the study periods to examine and detect if there is a monotonic increasing or decreasing linear or non-linear trend of the variables over time. The MK test is non-parametric in nature and is considered as a suitable method to detect shifts and trends of climatic variables [51]. Consequently, the MK trend has been widely used to detect trends of climatic variables in meteorology, hydrology and climatology research fields [52,53,54]. The test is robust against non-normal distribution datasets and it is suitable for data with missing values. Other modified MK tests reported in the literature, e.g., the modified MK test with trend-free pre-whitening [55], the modified MK test that considers the presence of autocorrelation structures in a time series [56] and the modified MK test that addresses the effects of the presence of trends and persistence, cover both the short- and long-term persistence in the trends [57]. In this study, statistically significant trends were computed for the 95% confidence level, thus, the null hypothesis (stating that there is no significant trend in the assessed time series) was rejected for every p-value less than 0.05.

2.3.3. Extreme Value Analysis of Streamflow

The GEV distribution, characterized by three parameters, namely, the location, scale and the shape, was utilized in this study to assess the features of simulated streamflow across the CORDEX models, RCPs and timescales. Daily simulated streamflow was aggregated into yearly maximum time series for each RCP scenario and timescale. The yearly maximum streamflow time series was fitted to the GEV distribution, resulting in an estimation of the location, scale and shape parameters that are suitable to explain the probability distribution of streamflow extremes. The estimated parameters were assessed based on the three classes of the GEV family of distribution, namely, the Gumbel, Frechet and Weibull (also referred to as type I, type II and type III extreme value distributions, respectively) [26]. The differences between these families of distributions depend on the value of the shape parameter. In particular, the GEV distribution corresponds to type I, type II and type III extreme value distributions, when a shape parameter is equal to zero, greater than zero or less than zero, respectively. Consequently, the shape parameter was used in this study to identify the extreme value distribution that best fits/describes streamflow extremes in the LRB across all the projected timescales.

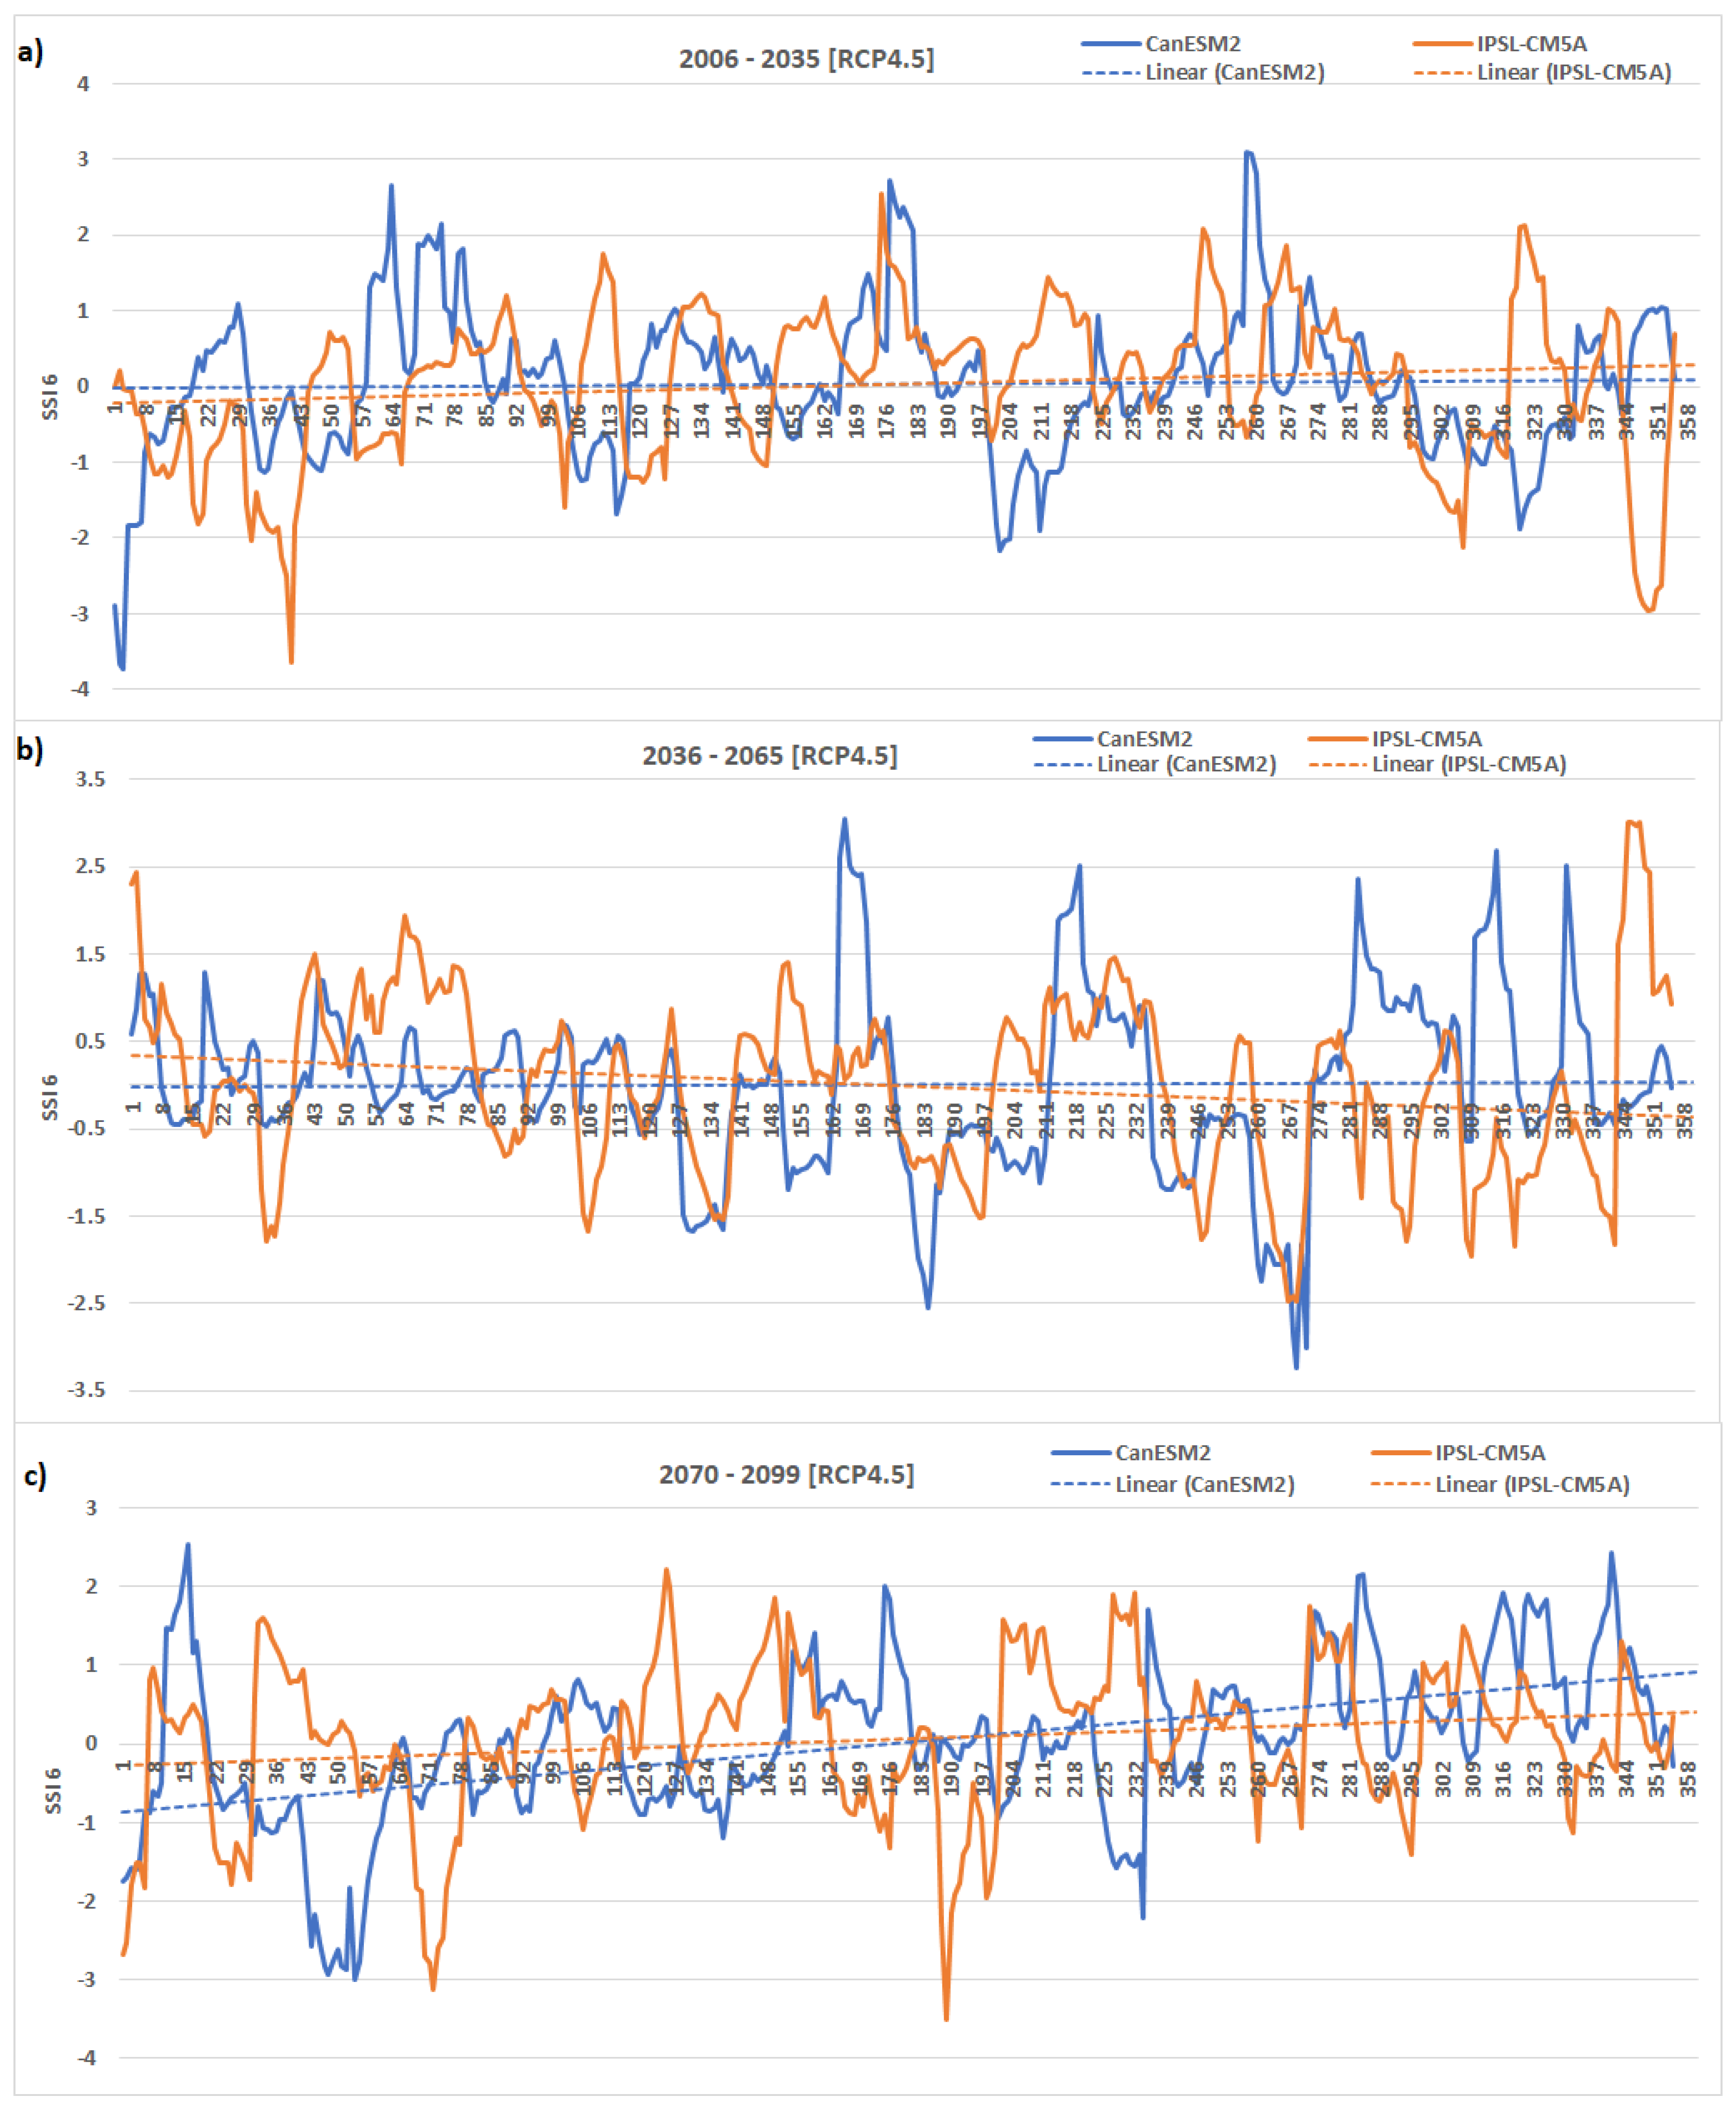
2.3.4. Standardized Streamflow Index

This study adopted the principle of the Standardized Precipitation Index (SPI) [58] for the calculation of the SSI at two selected accumulation periods, with particular interest to the periods relating to hydrological drought. In this regard, simulated streamflow was aggregated into monthly streamflow data over 6- and 12-month accumulation periods. The gamma probability distribution (mostly recommended for SPI calculation) was utilized to fit the aggregated monthly streamflow time series [59]. The SSI was calculated across the selected models and the study periods, and results were interpreted based on the classification scheme of SPI, according to the World Meteorological Organization standards [60]. The resulting SSI time series was used to calculate drought characteristics, e.g., the frequency of dry/wet years, drought duration and severity (Drought Monitoring Indicators, DMIs) and the corresponding trends based on the MK trend test.

3. Results

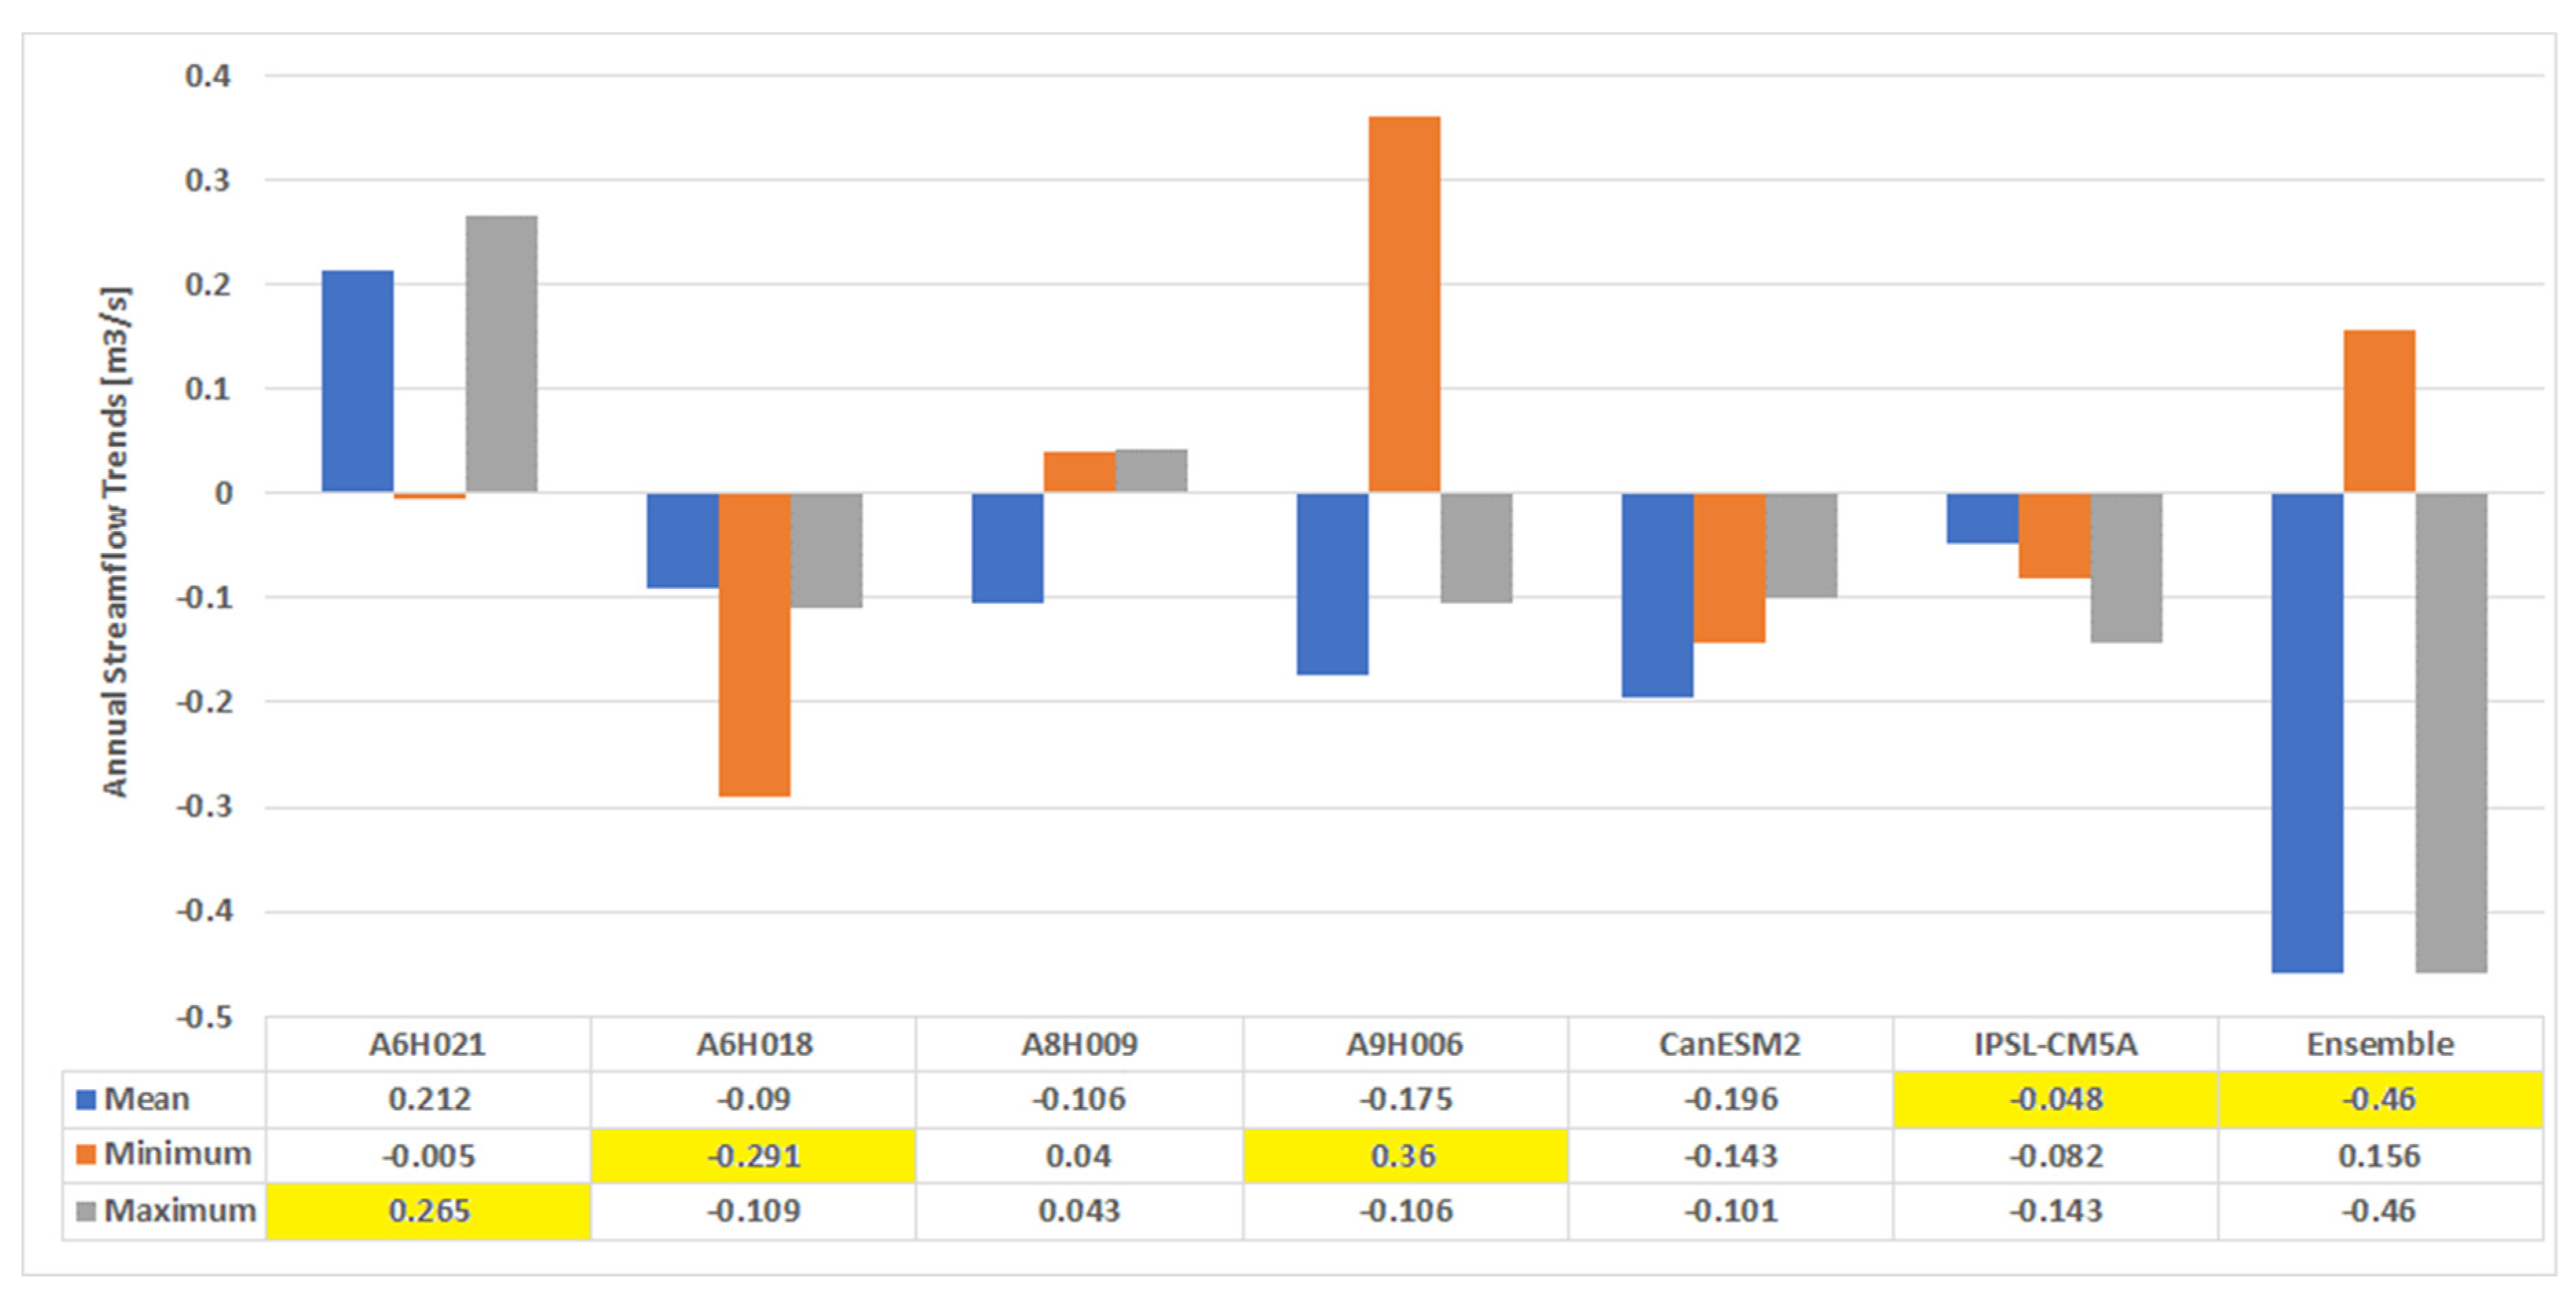
3.1. Trends in Historical Streamflow

The impacts of climate change on water resources in the LRB were investigated based on the assessment of trends using three hydrological statistical parameters, namely, the annual mean, annual minima and annual maximum of streamflow, computed from the observed and simulated streamflow from the ACRU hydrological model based on the CORDEX models, viz, CanESM2, IPSL-CM5A and Ensemble. The resulting MK trends in the selected hydrological statistical parameters are shown in Figure 3, which shows a comparable trend pattern between the observations and model simulations. In particular, a significant matching pattern is observed in the annual mean and annual maximum trends, where trends in annual streamflow across all observed (with exception to stream gauge station A6H021) and simulated streamflow depicts a negative trend in the annual mean and maximum streamflow. On the other hand, two stream gauge stations and the ensemble model depict positive trends in the annual minima, while the rest of the stations and CORDEX models exhibit negative trends, although in some cases, such trends are extremely minimal for the observed streamflow time series. Statistically significant trends at a 95% significance level are indicated in yellow. In general, trends across the hydrological statistical parameters and across the flow gauge stations and model simulations suggest that the LRB experienced reduced streamflow between 1976 and 2005.

3.2. Trends in Projected Streamflow

Impacts of projected future climate on water resources in the LRB were based on trends analysis of projected streamflow simulated from the CORDEX models under RCP8.5 and RCP4.5. The results of the selected hydrological statistical parameters are shown in Table 1 for three different time intervals, namely, the present period (defined here as the period from 2006 to 2035), near future, spanning 2036–2065 and the distant future covering the 2070–2099 period. In this study, both the historical (1976–2005) and present climate are considered as baselines to assess the impacts on the future climate on water security in the LRB. The RCP8.5 scenario, also referred to as “business as usual”, relates to the expected outcome of climate impacts in a case where no efforts are made to reduce greenhouse gas emissions. The results presented in Table 1 depict negative trends across the three selected hydrological statistical parameters and periods under the RCP8.5 scenario, although most of the observed trends are not statistically significant at a 95% significance level. Consequently, there is a decrease in streamflow during 2006–2035, and such a pattern is likely to continue in both the near and distant future under the “business as usual” scenario. The RCP4.5 is a long-term stabilization scenario that considers the global emissions of greenhouse gases and land-use-land-cover in a global economic framework, with the assumption of enforcing emissions mitigation policies [61,62]. This scenario covers almost all the sectors of the economy, including agriculture and land-use emissions [61]. The added features of the RCP4.5 scenario result in a slight change in trends of projected streamflow in the LRB. In particular, trends in the annual mean and annual minimum and maximum of the projected streamflow exhibit an increasing pattern across the three time intervals considered in the current research study.
Flow quantiles are essential in hydrological studies as they relate to conditions of water resources and, more generally, provide information on the potential status of hydrological extremes such as drought and floods. In the current study, trends in the 0.1, 0.5 and 0.9 flow quantiles were calculated across the CORDEX models and periods of analysis, with results given in Table 2. The 0.1, 0.5 and 0.9 quantiles relate to dry, normal and wet conditions, respectively. Persistent dry and wet conditions over time are likely to lead to drought and floods (flash floods), respectively. The results in Table 2 show a decreasing trend in the low, medium and high quantiles across the CORDEX GCMs under the RCP8.5 scenario and the projected time intervals (with exceptions to the distant future projections). On the contrary, an increasing pattern in the low, medium and high quantiles is observed for model simulations under the RCP4.5 emission scenario for the 2006–2035 projected period. The near-future projections (2036–2065) depict negative trends in low, medium and high flow quantiles across the CORDEX models under the RCP4.5 emission scenarios. For the distant future, low flow is projected to decrease under the RCP4.5 scenario, whereas high flow is projected to increase under the same emission scenario. In general, the results suggest that while the LRB is likely to experience frequent dry conditions that can translate to drought, the region is also likely to experience wet conditions that can result in (flash) floods.

3.3. Hydrological Extremes

3.3.1. Extreme Value Analysis

Results for the GEV distribution analysis are given in Table 3, with the respective estimated parameters, viz, the location, scale and shape, across the models and timescales. The location parameter of streamflow extremes ranges between 4.5 to 13.7 and 6.1 to 11.9 for model simulations under the RCP8.5 and RCP4.5 scenarios, respectively. The scale ranges from the lowest, 3.9, to the highest, 15.2, whereas the shape parameter of streamflow extremes is between 0.8 and 1.9 across the RCP scenarios and the time intervals. Comparison of the values of the shape parameter with the classes of GEV family of distributions suggests that the simulated streamflow extremes across the CORDEX models under both the RCPs and timescales are best described by the Fréchet type II extreme value distribution.

3.3.2. Assessment of Hydrological Drought in the Limpopo River Basin

The SSI is used in this study to evaluate projected hydrological drought conditions in the LRB. The study considered only 6- and 12-month accumulation periods, since these periods are related to hydrological drought, with inherent impacts manifested in water reservoirs. The results (only for SSI-6 are presented) for the three CORDEX models under the RCP8.5 and RCP4.5 scenarios are presented in Figure 4 and Figure 5, respectively. In each figure, the positive SSI values correspond to wetter conditions, whereas negative values represent drier conditions. The overall interpretation of the SSI values is similar to the SPI [60]. The figures depict the frequency of occurrence of projected dry and wet conditions in months within the LRB. The SSI-6 under both RCP scenarios demonstrates a significant variation in seasonal to annual streamflow, which fluctuates between wet and dry months. Drought events are likely to be more frequent, but in most cases at shorter time scales. Furthermore, the LRB is projected to experience intra-annual moderate to very wet conditions that are expected to last for shorter periods. In general, the SSI-6 computed from the CORDEX model simulations under the “business as usual” scenario indicates that the LRB is likely to experience reduced streamflow in the near future as well as moving into the distant future. Furthermore, the region is likely to experience significant wet conditions, categorized as ranging from moderate to very wet. Such wet conditions are expected to make the LRB susceptible to flash flooding.

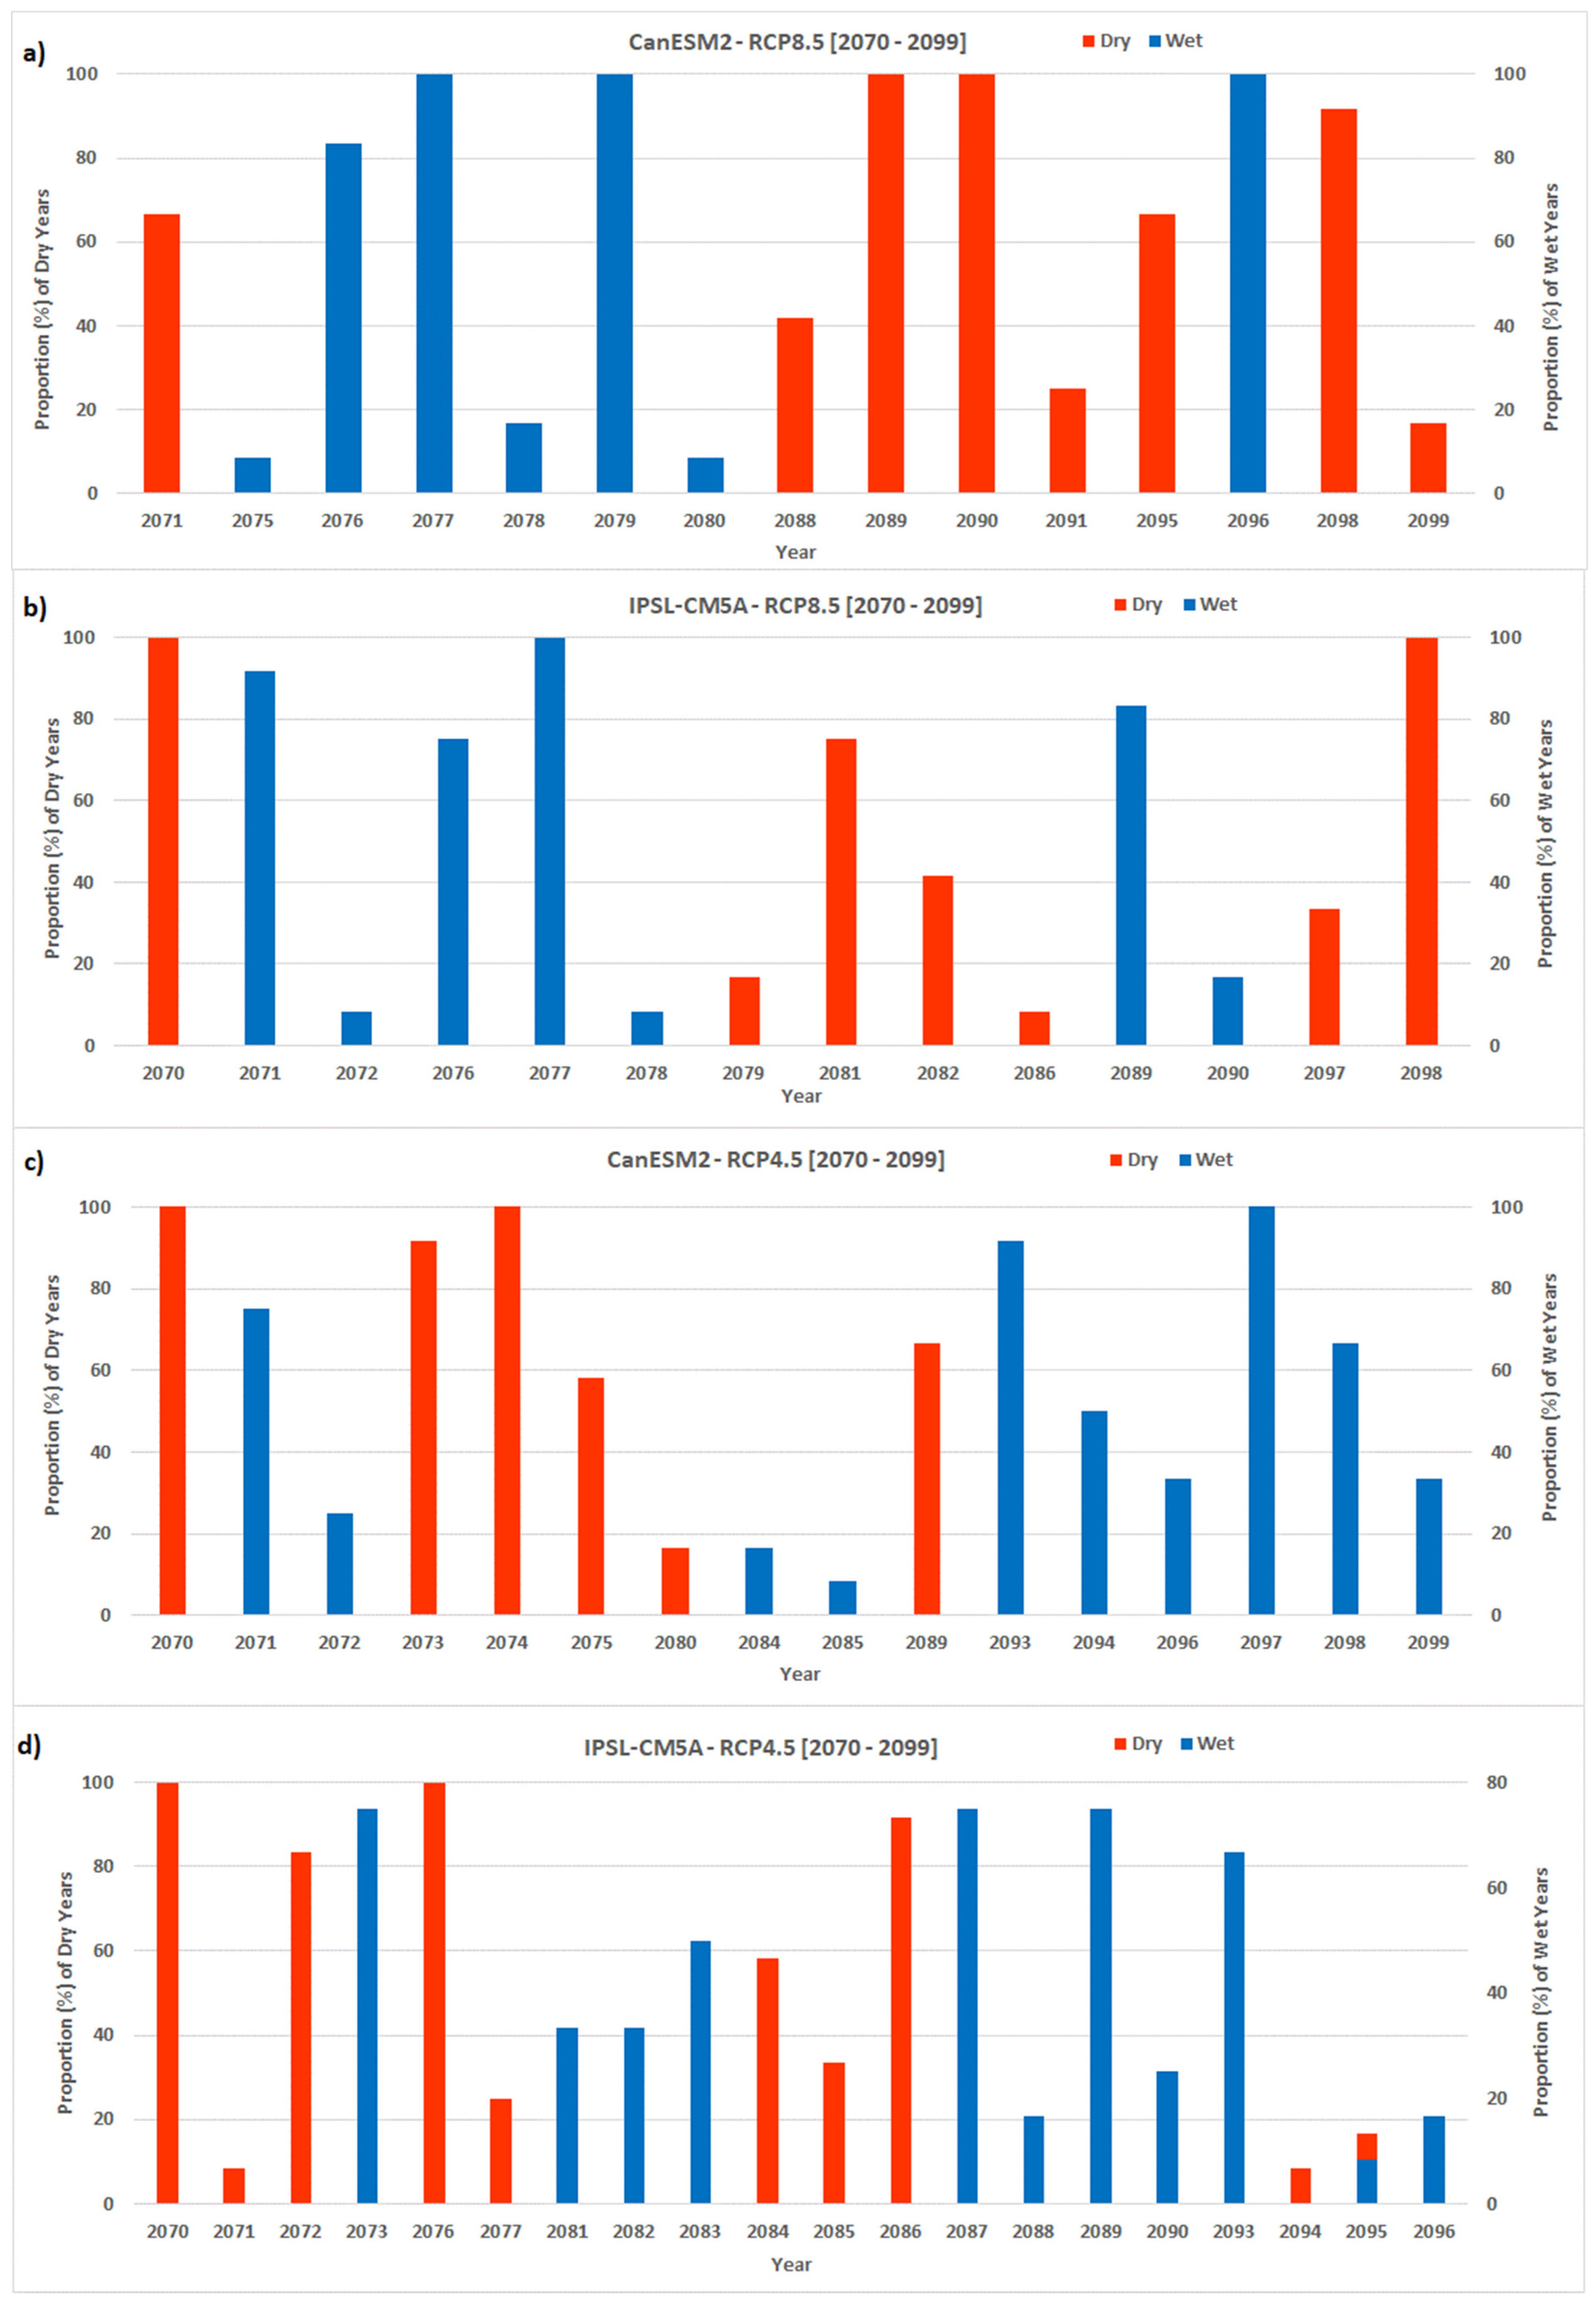
3.3.3. Proportion of Projected Dry/Wet Years

The SSI-12 time series computed from the CORDEX models under RCP8.5 and the stabilized RCP4.5 scenarios were used to assess the proportion of projected dry (drought) and wet (excess rainfall) years in the study area, focusing on the near and distant future periods. There is no universally scientifically accepted definition of either a dry year or a wet year. Subsequently, this study adopted definitions set by [63] whereby a drought year was defined as a year exhibiting an SSI value less than −1.00, whereas a wet year was defined as one having an SSI value of greater than 1.00. Any other years outside these definition terms (e.g., SSI ranging between −0.99 and 0.99) were classified as years exhibiting near-normal conditions. Furthermore, in the present study, the dry/wet episodes in a year are determined as a percentage of counts of the respective dry and wet occurrences (as per the SSI thresholds stated in the foregoing) over a 12-month accumulation period. The results of this analysis are illustrated in Figure 6 and Figure 7 for the near- and distance-future time intervals, respectively. Based on model simulations under the RCP8.5 scenario, given in Figure 6a,b, on average, nine years are projected to experience dry episodes in the near future, with 2036 exhibiting the maximum proportion (100%), followed by 2050, 2063 and 2064 (only for IPSL-CM5A) with 92%, and 2054 and 2061 with 83% and 67%. Similarly, six years, on average are projected to experience wet episodes during the 2036–2065 study period. Years projected to have a high proportion of wet episodes are 2047 (92%), 2062 (100%) and 2057 (75%) based on the CANESM2 model and 2046 (83%) and 2052 (92%) under the IPSL-CM5A model simulations.
Similarly, the RCP4.5 scenario simulations project an average of 12 years of dry episodes in the near-future epoch. The following years are projected to experience a high proportion of dry episodes based on the CANESM2 model simulations: 2047 (92%), 2051 and 2056 (58%), 2053 (75%) and 2058 (92%). Furthermore, IPSL-CM5A model simulations project high proportion of dry episodes in 2047 (58%), 2052 (100%), 2058 (75%), 2062 (67%), 2063 and 2064 (both with 50%). On the other hand, on average, 8 years are projected to experience wet episodes, with high proportions projected in 2050 (92%), 2054, 2060 and 2062 (all with 83%) under CANESM2 model simulations and 2036 (100%), 2041 (75%), 2042, 2055 and 2065, all with 92% proportion.
More dry and wet years are projected in the LRB as we move into the distant future (Figure 7). For instance, about eight years are projected to experience dry conditions, under the RCP8.5 scenario. Simulations based on the CANESM2 model project high proportions in dry episodes in 2071 (67%), 2089, 2090 (100%,), 2095 (67%) and 2098 (92%). A high proportion of dry episodes are also projected in 2070 (100%), 2081 (75%) and 2098 (100%), when IPSL-CM5A model simulations are considered. On the other hand, on average, seven years are projected to experience wet episodes in the LRB, with 2076 (83%), 2077, 2079 and 2096 (100%) under CANESM2 and 2071 (92%), 2076 (75%), 2077 (100%) and 2089 (83%) under IPSL-CM5A model simulations projected to experience high dry episodes.
Similarly, about nine years are projected to experience dry conditions in the distant future under the RCP4.5 stabilized scenario simulations. The driest years based on CANESM2 model simulations are 2070, 2073, 2074, 2075 and 2089, exhibiting 100%, 92%, 100%, 58% and 67%, drought proportions, respectively. The IPSL-CM5A model simulations project high dry episodes in 2070 and 2076 (100%), 2072 (83), 2084 (58%) and 2086 (92%). Furthermore, the LRB is projected to experience 10 years of wet episodes in the distant future. The wettest years are projected in 2071 (75%), 2093 (92%), 2094 (50%), 2097 (100%) and 2098 (67%), considering CANESM2 model simulations, under the RCP4.5 stabilized scenario. Similarly, the LRB is projected to experience most wet episodes in 2073 (75%), 2083 (50%), 2087, 2089 (75%) and 2093 (67%).

3.3.4. Trends in Drought Monitoring Indicators

Drought monitoring indicators—the drought duration and drought severity, were computed using the SSI-6 and -12 time series across the CORDEX models under the RCP8.5 and RCP4.5 scenarios. The DMIs’ trends across the models, RCP scenarios and study periods are presented in Table 4. While simulations under the RCP8.5 scenario depict zero trends in drought duration (DD), for SSI-6, across the models and study time intervals, negative and positive trends are observed under the RCP4.5 scenario, for the near and distant future, respectively. Moreover, negative trends in the drought severity are observed across the models, RCPs and periods of study, with exceptions for simulations under the RCP4.5 stabilized scenario, for the distant future. Furthermore, negative trends in DD (SSI-12) are observed for the near-future epoch and no trends for the distant future under both RCP scenarios. A similar trend pattern is observed for drought severity (DS) across the RCPs with the exception of the distant future, which shows positive trends in DS. Only a few of the observed positive (negative) trends are statistically significant at a 95% significance level (see the trends in boldface). In general, drought conditions are projected to persist in the LRB during the entire period, (near to distant), as confirmed by the drought episodes in Figure 4 and Figure 5, although such conditions are likely to be less severe.

4. Discussion

The LRB has, in the past, attracted interest from various stakeholders, e.g., from the science community, in-country and transboundary hydro-governance structures and institutions, as well as the general society. Such interests are attributed to, among other things, the significant socio-economic role the basin plays, e.g., to sustain the livelihoods of the 14 million people across the four co-riparian states of Botswana, Mozambique, South Africa and Zimbabwe. Despite its critical importance, the LRB is considered as an arid to semi-arid region and one of the most stressed water basins in Africa [64]. Consequently, water resources are a limiting factor for development in the region, and this is exacerbated by climate change and variability. Water demand for South Africa from the LRB is currently in the order of 3000 Mm3/year [64], of which irrigation uses the most water, followed by urban supply, mining and power production. The impacts of climate change and variability, coupled with other factors, such as population growth, urbanization, industrial development and increasing agricultural activities [65], are likely to exacerbate the strain on water resources in the basin, with variable impacts on different water-linked sectors, as well as on socially and economically disadvantaged groups, who depend directly on these resources for their livelihoods. Climate change is expected to bring changing rainfall patterns for the LRB, resulting in more frequent droughts and floods, which will impact agriculture, food security and other water-linked sectors.
The results reported in this study show that water resources in the LRB are already stressed, as supported by the observed decreasing trends in historical streamflow from 1976 and 2005, which are in accordance with studies reported by [66] on annual variations of rainfall, minimum and maximum temperature climate variables and [67,68,69] on the frequent occurrences of drought over Southern Africa. Such trends are likely to continue considerably in the future, as a result of the projected high variability of rainfall patterns and increases in hydro-climatic extremes within the region. These changes are expected to reduce the water available for irrigation (which is already in high demand) and dryland farming in the basin, with impacts on food security, decrease in crop yields, the shift in planting dates and cropping patterns, changes in the suitability of crops and crop varieties, loss of wildlife, livestock and income. To alleviate future climate impacts on agricultural systems, there is a need to consider an integrated approach of managing the groundwater and surface water systems, as an alternative option to managing water resources under the changing climate [4].
Based on climate projection models, the LRB is likely to continue to experience reduced streamflow in the near and distant future projected periods; these findings corroborate the results of [70], although the projections were made up to 2030. In particular, projected hydroclimatic extremes reported in this study, e.g., reduced streamflow, observed low and high flow patterns, sporadic dry/wet episodes in the region, as well as the general persistence of drought (the duration and severity), will have more pronounced impacts on the different water-linked sectors of the economy, in the near future. The sporadic wet episodes will lead to flash floods especially in flood-prone areas such as the lower Limpopo River floodplain, and this is a challenge in itself because the most vulnerable often resist relocation due to their dependency on agricultural activities along the floodplain. Unless efficient early warning systems are put in place to support a timely response to impending floods, the most vulnerable communities will continue to suffer from the harshness of climate change and variability.
The likelihood of occurrences of floods in the LRB will also increase the incidence of vector-borne disease, which affects both humans and animals. Furthermore, the projected dry episodes under climate change in the LRB will exacerbate the frequent occurrences of drought. It is well known that malaria is prevalent in the LRB, and it is characterized by diverse malaria transmission stabilities where the highland regions have no malaria transmission, the downstream to midland regions have unstable transmission and the downstream to lowland regions have stable malaria transmission [71]. Consequently, the projected dry episodes will lead to a geographical shift of malaria within the different regions of the basin, whereas flash floods will increase the risk of malaria [72], cholera, diarrhea and bilharzia diseases, which are a notable concern in the LRB [33]. Moreover, projected hydroclimatic extremes in the LRB will lead to ill-health related diseases, such as nutrition-related, water-related, airborne and dust-related and vector-borne diseases and mental health disorders, among others [73]. Furthermore, the projected dry episodes under climate change in the LRB will exacerbate the water demand for power generation, taking into account that the already existing coal-based power plants in the Limpopo Province require a considerable amount of water. The use of renewable sources such as solar photovoltaic systems that require very minimal amounts of water may be beneficial for the LRB under changing climatic conditions.

5. Conclusions

This contribution has used CORDEX-Africa model simulations to assess the impacts of future climate change on water-linked sectors in the LRB of South Africa. Based on the analysis of projected streamflow statistical metrics, the findings of the study can be summarized as follows:
  • The LRB is experiencing frequent dry conditions (decrease in streamflow) under the current climatology. The conditions are projected to continue in both the near future and towards the end of the century time intervals. Prolonged dry conditions can translate to drought in the basin.
  • The region is also likely to experience wet conditions at an average that can result in (flash) floods.
  • Significant dry and wet years are projected in the LRB in the near future and as we move into the distant future. The CORDEX model analysis under the RCP8.5 and RCP4.5 scenarios project that the LRB will experience, on average, 64% (46%) and 45% (55%) of dry (wet) years, respectively in the near future. As we move towards the end of the century period, the basin is projected to experience an average of 48% (52%) and 55% (45%) of dry (wet) years when considering GCM simulations under the RCP8.5 and RCP4.5 scenarios, respectively.
  • The hydrological extremes are best represented by the Fréchet generalized extreme value distribution over the LRBs. This GEV family could be ideal for calculating the return periods of extreme events in the LRB.
The findings from this study can be used to support water resource management, agricultural planning and effective decision making to attain sustainable practices regarding water resources in the LRB. The results contribute towards enhancing the ability of farmers, catchment management agencies and extension services within the basin to develop sustainable adaptation strategies that can be used to alleviate the impacts of climate change.

Author Contributions

C.M.B. conceptualized, wrote the original draft and finalized the manuscript; J.O.B. conceptualized, provided the scripts, supervised, edited and approved the manuscript; N.N.Z., methodology, discussion and editing; P.H. and E.K.W., review and editing of the final manuscript; T.M., model data preparation; M.D.M., methodology, discussion and editing; A.M.A., discussion, abstract and editing; K.P.N., discussion and editing; J.P.d.W., study area map and editing; M.G.M., discussion and editing; H.T., discussion and editing. All authors have read and agreed to the published version of the manuscript.

Funding

This research is part of the on-going project no. C2019/2020-00017, titled “Climate Change and Water Security: Developmental Perspectives for Water-Linked Sectors in a Future Climate for Africa”, funded by the Water Research Commission (WRC) of South Africa.

Acknowledgments

The authors wish to thank the editor and three anonymous reviewers for comprehensive feedback, which assisted in improving the quality of the manuscript.

Conflicts of Interest

The authors declare no conflict of interest.

References

  1. IPCC. Working Group I Contribution to the IPCC Fifth Assessment Report, Climate Change 2013: The Physical Science Basis; IPCC: Geneva, Switzerland, 2013. [Google Scholar]
  2. Junk, W.J.; Bayley, P.B.; Sparks, R.E. The flood-pulse concept in river-floodplain systems. Can. Spec. Publ. Fish. Aquat. Sci. 1989, 106, 110–127. [Google Scholar]
  3. Giuliani, M.; Li, Y.; Castelletti, A.; Gandolfi, C. A coupled human-natural systems analysis of irrigated agriculture under changing climate. Water Resour. Res. 2016, 52, 6928–6947. [Google Scholar] [CrossRef]
  4. Oberto, G.; Li, Y.; Alberti, L.; Colombo, L.; Soncini-Sessa, R. Coupled irrigation-system/groundwater flow modelling for groundwater resource assessment in agricultural areas: A case study in northern Italy. Rend. Online Soc. Geol. Ital. 2018, 46, 94–100. [Google Scholar] [CrossRef]
  5. Petheram, C.; Walker, G.; Grayson, R.; Thierfelder, T.; Zhang, L. Towards a framework for predicting impacts of land use on recharge: 1. a review of recharge studies in Australia. Aust. J. Soil Res. 2002, 40, 397–417. [Google Scholar] [CrossRef]
  6. Chen, Z.H.; Grasby, S.E.; Osadetz, K.G. Predicting average annual groundwater levels from climatic variables: An empirical model. J. Hydrol. 2002, 260, 102–117. [Google Scholar] [CrossRef]
  7. Kanae, S.; Oki, T.; Kashida, A. Changes in hourly heavy precipitation at Tokyo from 1890 to 1999. J. Meteorol. Soc. Jpn. 2004, 89, 241–247. [Google Scholar] [CrossRef] [Green Version]
  8. IPCC. Climate change 2007: Impacts, Adaptations, and Vulnerability. Contribution of Working Group Fourth Assessment Report of the IPCC; Parry, M.L., Canziani, O.F., Palutikof, J.P., van der Linden, P.J., Hanson, C.E., Eds.; Cambridge University Press: Cambridge, UK, 2007. [Google Scholar]
  9. Kruger, A.C.; Shongwe, S. Temperature trends in South Africa: 1960–2003. Int. J. Climatol. 2004, 24, 1929–1945. [Google Scholar] [CrossRef]
  10. Mohamed, A.B. Climate change risks in Sahelian Africa. Reg. Environ. Chang. 2011, 11, 109–117. [Google Scholar] [CrossRef]
  11. Collins, J.M. Temperature variability over Africa. J. Clim. 2011, 24, 3649–3666. [Google Scholar] [CrossRef] [Green Version]
  12. Nicholson, S.E.; Nash, D.J.; Chase, B.M.; Grab, S.W.; Shanahan, T.M.; Verschuren, D.; Asrat, A.; Lézine, A.M.; Umer, M. Temperature variability over Africa during the last 2000 years. Holocene 2013, 23, 1085–1094. [Google Scholar] [CrossRef] [Green Version]
  13. Stern, D.I.; Gething, P.W.; Kabaria, C.W.; Temperley, W.H.; Noor, A.M.; Okiro, E.A.; Shanks, G.D.; Snow, R.W.; Hay, S.I. Temperature and malaria trends in highland East Africa. PLoS ONE 2011, 6, e24524. [Google Scholar] [CrossRef] [PubMed] [Green Version]
  14. Döll, P.; Flörke, M. Global-Scale Estimation of Diffuse Groundwater Recharge; Frankfurt Hydrology Paper 3; Institute of Physical Geography, Frankfurt University: Frankfurt am Main, Germany, 2005. [Google Scholar]
  15. Almazroui, M.; Saeed, S.; Islam, M.N.; Khalid, M.S.; Alkhalaf, A.K.; Dambul, R. Assessment of uncertainties in projected temperature and precipitation over the Arabian Peninsula: A comparison between different categories of CMIP3 models. Earth Syst. Environ. 2017, 1, 23. [Google Scholar] [CrossRef] [Green Version]
  16. Bucchignani, E.; Mercogliano, P.; Panitz, H.-J.; Montesarchio, M. Climate change projections for the Middle East-North Africa domain with COSMO-CLM at different spatial resolutions. Adv. Clim. Chang. Res. 2018, 9, 66–80. [Google Scholar] [CrossRef]
  17. Niang, I.; Ruppel, O.C.; Abdrabo, M.; Ama, E.; Lennard, C.; Padgham, J.; Urquhart, P.; Adelekan, I.O.; Archibald, S.; Balinga, M.; et al. Chapter 22 Africa. In Climate Change 2014: Impacts, Adaptation, and Vulnerability. Part B: Regional Aspects. Contribution of Working Group II to the Fifth Assessment Report of the Intergovernmental Panel on Climate Change; Cambridge University Press: Cambridge, UK, 2015; pp. 1199–1266. [Google Scholar]
  18. Diedhiou, A.; Bichet, A.; Wartenburger, R.; Seneviratne, S.I.; Rowell, D.P.; Sylla, M.B.; Diallo, I.; Todzo, S.; N’datchoh, E.T.; Camara, M.; et al. Changes in climate extremes over West and Central Africa at 1.5 °C and 2 °C global warming. Environ. Res. Lett. 2018, 13, 065020. [Google Scholar] [CrossRef]
  19. Sylla, M.B.; Giorgi, F.; Coppola, E.; Mariotti, L. Uncertainties in daily rainfall over Africa: Assessment of gridded observation products and evaluation of a regional climate model simulation. Int. J. Climatol. 2013, 33, 1805–1817. [Google Scholar] [CrossRef]
  20. IPCC. Impacts, Adaptation and Vulnerability, Part B: Regional Aspects Working Group II Contribution to the IPCC Fifth Assessment Report; Cambridge University Press: Cambridge, UK, 2014. [Google Scholar] [CrossRef] [Green Version]
  21. Zhang, X.; Harvey, K.D.; Hogg, W.D.; Yuzyk, T.R. Trends in Canadian streamflow. Water Resour. Res. 2001, 37, 987–998. [Google Scholar] [CrossRef]
  22. Brabets, T.P.; Walvoord, M.A. Trends in streamflow in the Yukon River Basin from 1944 to 2005 and the influence of the Pacific Decadal Oscillation. J. Hydrol. 2009, 371, 108–119. [Google Scholar] [CrossRef]
  23. Love, D.; Uhlenbrook, S.; Twomlow, S.; van der Zaag, P. Changing hydroclimatic and discharge patterns in the northern Limpopo Basin, Zimbabwe. Water SA 2010, 36, 1–14. [Google Scholar]
  24. Kruger, A.C.; Nxumalo, M.P. Historical rainfall trends in South Africa: 1921–2015. Water SA 2017, 43, 285–297. [Google Scholar] [CrossRef] [Green Version]
  25. Muchuru, S.; Botai, C.M.; Botai, J.O.; Adeola, A.M. The hydrometeorology of the Kariba Catchment Area based on the Probability distributions. Earth Interact. 2015, 19, 1–18. [Google Scholar] [CrossRef] [Green Version]
  26. Arreyndip, N.A.; Joseph, E. Generalized extreme value distribution models for the assessment of seasonal wind energy potential of Debuncha, Cameroon. J. Renew. Energy 2016. [Google Scholar] [CrossRef] [Green Version]
  27. Botai, C.M.; Botai, J.O.; Adeola, A.M.; de Wit, J.P.; Ncongwane, K.P.; Zwane, N.N. Drought risk assessment in the Eastern Cape Province of South Africa. The copulas lens. Water 2020, 12, 1938. [Google Scholar] [CrossRef]
  28. Botai, C.M.; Botai, J.O.; Dlamini, L.; Zwane, N.; Phaduli, E. Characteristics of Droughts in South Africa: A Case Study of Free State and North West Provinces. Water 2016, 8, 439. [Google Scholar] [CrossRef]
  29. Botai, C.M.; Botai, J.O.; de Wit, J.C.; Ncongwane, K.P.; Adeola, A.M. Drought characteristics over the Western Cape Province, South Africa. Water 2017, 9, 876. [Google Scholar] [CrossRef] [Green Version]
  30. Botai, C.M.; Botai, J.O.; Adeola, A.M. Spatial distribution of temporal precipitation contrasts in South Africa. S. Afr. J. Sci. 2018, 114, 70–78. [Google Scholar] [CrossRef]
  31. Rouault, M.; Richard, Y. Intensity and spatial extent of drought in southern Africa. Geophys. Res. Lett. 2005, 32, 1–4. [Google Scholar] [CrossRef]
  32. WMO. Limpopo River Basin. In A Proposal to Improve the Flood Forecacting and Early Warning Systems; World Meteorological Organization: Geneva, Switzerland, 2012. [Google Scholar]
  33. Petrie, B.; Chapman, A.; Midgley, A.; Parker, R. Risk, Vulnerability and Resilience in the Limpopo River Basin System: Climate Change, Water and Biodiversity—A Synthesis. For the USAID Southern Africa “Resilience in the Limpopo River Basin” (RESILIM) Program; One World Sustainable Investments: Cape Town, South Africa, 2015. [Google Scholar]
  34. Earle, A.; Goldin, J.; Machiridza, R.; Malzbender, D.; Manzungu, E.; Mpho, T. Indigenous and Institutional Profile: Limpopo River Basin; IWMI Working Paper 112; International Water Management Institute: Colombo, Sri Lanka, 2006; p. 65. [Google Scholar]
  35. Mwenge Kahinda, J.-M.; Kapangazawiri, E.; Engelbrecht, F.; Meissner, R. Implementing Integrated Catchment Management in the upper Limpopo River basin: A situational assessment. Phys. Chem. Earth 2016, 93, 104–118. [Google Scholar] [CrossRef]
  36. FAO. Drought Impact Mitigation and Prevention in the Limpopo River Basin: A Situation Analysis; Land and Water Discussion Paper; Food and Agricultural Organization: Rome, Italy, 2004. [Google Scholar]
  37. Hulme, M.; Barrow, E.M.; Arnell, N.W.; Harrison, P.A.; Johns, T.C.; Downing, T.E. Relative impacts of human-induced climate change and natural climate variability. Nature 1999, 397, 688–691. [Google Scholar] [CrossRef]
  38. Taylor, K.E.; Stouffer, R.J.; Meehl, G.A. An overview of CMIP5 and the experiment design. Bull. Am. Meteorol. Soc. 2011, 93, 485–498. [Google Scholar] [CrossRef] [Green Version]
  39. Schulze, R.E. Hydrology and Agrohydrology: A Text to Accompany the ACRU Agrohydrological Modelling System; Technology Transfer Report TT 69/95; Water Research Commission: Pretoria, South Africa, 1995; p. 552. [Google Scholar]
  40. Schulze, R.E.; Perks, L.A. Assessment of the Impacts of Climate Change On Hydrology and Water Resources in South Africa; Report to SA Country Study for Climate Change Programme; School of Bioresources Engineering and Environmental Hydrology, University of Natal: Pietermaritzburg, South Africa, 2000; p. 118. [Google Scholar]
  41. Jewitt, G.P.W.; Schulze, R.E. Verification of the ACRU model for forest hydrology applications. Water SA 1999, 25, 483–489. [Google Scholar]
  42. Warburton, M.L.; Schulze, R.E.; Jewitt, G.P.W. Confirmation of ACRU model results for applications in land use and climate change studies. Hydrol. Earth Syst. Sci. 2010, 14, 2399–2414. [Google Scholar] [CrossRef] [Green Version]
  43. Mugabe, F.T.; Chitata, T.; Kashaigili, J.; Chagonda, I. Modelling the effect of rainfall variability, land use change and increased reservoir abstraction on surface water resources in semi-arid southern Zimbabwe. Phys. Chem. Earth, Parts A/B/C 2011, 36, 1025–1032. [Google Scholar] [CrossRef]
  44. Kienzle, S.W.; Nemeth, M.W.; Byrne, J.M.; MacDonald, R.J. Simulating the hydrological impacts of climate change in the upper North Saskatchewan River basin, Alberta, Canada. J. Hydrol. 2012, 412–413, 76–89. [Google Scholar] [CrossRef]
  45. Schmidt, J.; Kienze, S.W.; Srinivasan, M.S. Estimating increased evapotranspiration losses caused by irrigated agriculture as part of the water balance of the Orari catchment, Canterbury, New Zealand. J. Hydrol. 2009, 48, 73–94. [Google Scholar]
  46. Aduah, M.S.; Jewitt, G.P.W.; Warburton, M.L. Assessing suitability of the ACRU hydrological model in a rainforest catchment in Ghana, West Africa. Water Sci. 2017, 31, 198–214. [Google Scholar] [CrossRef] [Green Version]
  47. Bae, D.H.; Jung, I.W.; Lettenmaier, D.P. Hydrologic Uncertainties in Climate Change from IPCC AR4 GCM Simulation of the Chungju Basin, Korea. J. Hydrol. 2011, 401, 90–105. [Google Scholar] [CrossRef]
  48. Jung, I.W.; Bae, D.H.; Lee, B.J. Possible change in Korean streamflow seasonality based on multi-model climate projections. Hydrol. Process. 2013, 27, 1033–1045. [Google Scholar] [CrossRef]
  49. Mann, H.B. Nonparametric tests against trend. Econom. J. Econom. Soc. 1945, 13, 245–259. [Google Scholar] [CrossRef]
  50. Kendall, M.G. Rank Correlation Methods; Charles Griffin: London, UK, 1975. [Google Scholar]
  51. Villarini, G.; Serinaldi, F.; Smith, J.A.; Krajewski, W.F. On the stationarity of annual flood peaks in the continental United States during the 20th century. Water Resour. Res. 2009, 45, W08417. [Google Scholar] [CrossRef]
  52. Liang, L.; Li, L.; Liu, Q. Temporal variation of reference evapotranspiration during 1961–2005 in the Taoer River basin of Northeast China. Agric. Forest Meteorol. 2010, 150, 298–306. [Google Scholar] [CrossRef]
  53. Ahn, K.H.; Merwade, V. Quantifying the relative impact of climate and human activities on streamflow. J. Hydrol. 2014, 515, 257–266. [Google Scholar] [CrossRef]
  54. Wang, X.; He, K.; Dong, Z. Effects of climate change and human activities on runoff in the Beichuan River Basin in the northeastern Tibetan Plateau, China. Catena 2019, 176, 81–93. [Google Scholar] [CrossRef]
  55. Yue, S.; Pilon, P.; Phinney, B.; Cavadias, G. The influence of autocorrelation on the ability to detect trend in hydrological series. Hydrol. Process. 2002, 16, 18071829. [Google Scholar] [CrossRef]
  56. Hamed, K.H.; Rao, A.R. A modified Mann–Kendall trend test for autocorrelated data. J. Hydrol. 1998, 204, 182–196. [Google Scholar] [CrossRef]
  57. Kumar, S.; Merwade, V.; Kam, J.; Thurner, K. Streamflow trends in Indiana: Effects of long term persistence, precipitation and subsurface drains. J. Hydrol. 2009, 374, 171–183. [Google Scholar] [CrossRef]
  58. McKee, T.B.; Doesken, N.J.; Kleist, J. The relationship of drought frequency and duration to time scales. In Proceedings of the 8th Conference on Applied Climatology, Anaheim, CA, USA, 17–22 January 1993; American Meteorological Society: Boston, MA, USA, 1993; pp. 179–183. [Google Scholar]
  59. Vicente-Serrano, S.M.; Lopez-Moremo, J.I.; Begueria, S.; Lorenzo-Lacruz, J.; Azorin-Molina, C.; Moran-Tejeda, E. Accurate computation of a streamflow drought index. J. Hydrol. Eng. 2011, 7, 318–332. [Google Scholar] [CrossRef] [Green Version]
  60. WMO. Standardized Precipitation Index User Guide; Svoboda, M., Hayes, M., Wood, D., Eds.; WMO-No. 1090; WMO: Geneva, Switzerland, 2012. [Google Scholar]
  61. Moss, R.H.; Edmonds, J.A.; Hibbard, K.A.; Mannings, M.R.; Rose, S.K.; van Vuuren, D.P.; Carter, T.R.; Emori, S.; Kainuma, M.; Kram, T.; et al. The next generation of scenarios for climate research and assessment. Nature 2010, 463, 747–756. [Google Scholar] [CrossRef]
  62. Thomson, A.M.; Calvin, K.V.; Smith, S.J.; Kyle, G.P.; Volke, A.; Patel, P.; Delgado-Arias, S.; Bond-Lamberty, B.; Wise, M.A.; Clarke, L.E.; et al. RCP4.5: A pathway for stabilization of radiative forcing by 2100. Clim. Chang. 2011, 109, 77–94. [Google Scholar] [CrossRef] [Green Version]
  63. Nkiaka, E.; Nawaz, N.R.; Lovett, J.C. Using standardized indicators to analyse dry/wet conditions and their applications for monitoring drought/floods: A study in the Logone catchment, Lake Chad Basin. Hydrol. Sci. J. 2017, 62, 2720–2736. [Google Scholar] [CrossRef]
  64. Limpopo Basin Permanent Technical Committee (LBPTC). Joint Limpopo River Study Scoping Phase Final Report; BIGCON Consortium: Maputo, Mozambique, 2010. [Google Scholar]
  65. Van der Zaag, P.; Juizo, D.; Vilanculos, A.; Bolding, A.; Uiterweer, N.P. Does the Limpopo River Basin have sufficient water for massive irrigation development in the plains of Mozambique? Phys. Chem. Earth Parts A/B/C. 2010, 35, 832–837. [Google Scholar] [CrossRef]
  66. Mosase, E.; Ahiablame, L. Rainfall and temperature in the Limpopo River Basin, southern Africa: Means variations and trends from 1979 to 2013. Water 2018, 10, 364. [Google Scholar] [CrossRef] [Green Version]
  67. Thomson, M.C.; Abayomi, K.; Barnston, A.G.; Levy, M.; Dilley, M. El Niño and drought in Southern Africa. Lancet 2003, 361, 437–438. [Google Scholar] [CrossRef]
  68. Ujeneza, E.L.; Abiodun, B.J. Drought regimes in Southern Africa and how well GCMs simulate them. Clim. Dyn. 2015, 44, 1595–1609. [Google Scholar] [CrossRef]
  69. Gebre, S.L.; Getahun, Y.S. Analysis of Climate Variability and Drought Frequency Events on Limpopo River Basin, South Africa. Hydrol. Curr. Res. 2016, 7, 249. [Google Scholar]
  70. Zhu, T.; Ringler, C. Climate Change Implications for Water Resources in the Limpopo River Basin. Technical Report April; IFPRI: Washington, DC, USA, 2010. [Google Scholar]
  71. Adeola, A.M.; Makgoale, T.E.; Abiodun, G.J.; Ncongwane, K.P.; Botai, J.O.; Rautenbach, H.; Adisa, O.M.; Botai, C.M. Rainfall trends and malaria occurrence in Limpopo Province, South Africa. Int. J. Environ. Res. Public Health 2019, 24, 5156. [Google Scholar] [CrossRef] [Green Version]
  72. International Water Management Institute. Water Policy Brief Dams and Malaria in Africa: Time for Action; Based on externally peer-reviewed published material; International Water Management Institute: Colombo, Sri Lanka, 2018. [Google Scholar]
  73. Stanke, C.; Kerac, M.; Prudhomme, C.; Medlock, J.; Murray, V. Health Effects of Drought: A systematic review of the evidence. PLoS Curr. 2013. [Google Scholar] [CrossRef] [Green Version]
Figure 1. The Limpopo River Basin and its attributes. The dots represent the grid centers of the Coordinated Regional Downscaling Experiment (CORDEX) models at 50 km spatial resolution.
Water 12 03299 g001
Figure 2. Total annual rainfall (mm year−1) from the Hadley Center Climate Research Unit (CRU) (top right), compared to associated annual rainfall (mm year-1) as simulated by Rossby Centre (RCA4) Regional Climate Models (RCMs) forced by Coupled Model Inter-Comparison Project (CMIP5) Global Climate Models (GCMs) and multi-model ensemble mean of RCMs (bottom left) for period 1976–2005.
Water 12 03299 g002
Figure 3. Historical streamflow trends (m3 s−1) based on selected statistical parameters (annual mean, annual minimum and annual maximum) across the observations and CORDEX models. Yellow indicates statistically significant trends at 95% significance level.
Water 12 03299 g003
Figure 4. Standardized streamflow index 6-month time series corresponding to (a) 2006–2035, (b) 2036–2065 and (c) 2070–2099 time intervals and CORDEX models under the representative concentration pathway 8.5 scenario.
Water 12 03299 g004
Figure 5. Standardized streamflow index 6-month time series corresponding to (a) 2006–2035, (b) 2036–2065 and (c) 2070–2099 time intervals and CORDEX models under the representative concentration pathway 4.5 scenario.
Water 12 03299 g005
Figure 6. Distribution of proportion (%) of projected dry and wet years in the Limpopo River Basin, where (a) and (b) correspond to model simulations under the RCP8.5 scenario, while (c) and (d) relate to simulations for the RCP4.5 scenario for the near-future period, respectively.
Water 12 03299 g006
Figure 7. Same as Figure 6, where (a) and (b) correspond to model simulations under the RCP8.5 scenario, while (c) and (d) relate to simulations for the RCP4.5 scenario for the distant future, respectively.
Water 12 03299 g007
Table 1. Trends in projected streamflow based on selected statistical parameters (annual mean, annual minimum and annual maximum) under the representative concentration pathways 8.5 and 4.5; bold indicates statistically significant trends at 95% confidence level.
2006–20352036–20652070–2099
CORDEX ModelRCP8.5 [RCP4.5]RCP8.5 [RCP4.5]RCP8.5 [RCP4.5]
MeanMinMaxMeanMinMaxMeanMinMax
CanESM2−0.13 [−0.05]−0.16 [−0.02]−0.06 [0.06]−0.16 [0.05]−0.32 [0.04]−0.06 [0.16]−0.27 [0.45]−0.21 [0.55]−0.09 [0.29]
IPSL-CM5A−0.08 [0.16]−0.11 [0.19]−0.12 [0.14]−0.10 [−0.16]0.04 [0.33]−0.01 [0.06]−0.17 [0.10]−0.15 [0.02]−0.10 [0.17]
Ensemble−0.21 [0.15]−0.23 [0.09]−0.2 [0.18]−0.11 [0.03]0.09 [−0.17]0.05 [0.18]−0.29 [0.23]0.09 [0.07]−0.18 [0.03]
Table 2. Trends (m s−1) in flow quantiles (low = Q0.1; medium = Q0.5 and high = Q0.9) under the representative concentration pathways 8.5 and 4.5; bold indicates statistically significant trends.
2006–2035 Simulations
CORDEX ModelRCP8.5RCP4.5
Q0.1Q0.5Q0.9Q0.1Q0.5Q0.9
CanESM2−0.191−0.088−0.0930.052−0.041−0.062
IPSL-CM5A−0.048−0.030−0.0620.2540.0520.144
Ensemble−0.2300.037−0.0200.0170.0150.174
2036–2065 Simulations
CanESM2−0.303−0.114−0.200−0.006−0.050−0.110
IPSL-CM5A−0.033−0.088−0.103−0.320−0.196−0.239
Ensemble0.1190.002−0.127−0.182−0.101−0.060
2070–2099 Simulations
CanESM2−0.146−0.228−0.2170.4750.3760.406
IPSL-CM5A0.009−0.149−0.095−0.0250.0500.142
Ensemble0.090−0.276−0.234−0.0510.1910.131
Table 3. Parameters (location, scale and shape) of the generalized extreme value distribution, across the timescales and CORDEX models under the representative concentration pathways 8.5 and 4.5.
2006–2035 Simulations
CORDEX ModelRCP8.5RCP4.5
LocationScaleShapeLocationScaleShape
CanESM29.1010.381.489.1410.651.43
IPSL-CM5A7.308.031.129.649.841.10
Ensemble13.6715.241.2910.729.611.48
2036–2065 Simulations
CanESM26.306.451.436.715.491.40
IPSL-CM5A5.455.070.826.194.221.45
Ensemble9.068.861.2910.919.191.25
2070–2099 Simulations
CanESM24.543.891.908.8711.281.52
IPSL-CM5A7.518.750.967.657.321.37
Ensemble6.807.831.9411.8814.211.52
Table 4. Trends in drought monitoring indicators based on standardized streamflow index 6 and standardized streamflow index 12; bold represents statistically significant trends at 95% confidence level. DD—drought duration, DS—drought severity.
2006–2035 Simulations
CORDEX
Model
SSI-6SSI-12
RCP8.5RCP4.5RCP8.5RCP4.5
DDDSDDDSDDDSDDDS
CanESM20.000−0.0670.0000.0230.083−0.0400.0450.009
IPSL-CM5A−0.0560.014−0.050−0.0100.000−0.0910.000−0.018
Ensemble0.000−0.0610.000−0.0400.071−0.0170.0950.057
2036–2065 Simulations
CanESM20.000−0.111−0.091−0.114−0.043−0.053−0.091−0.082
IPSL-CM5A0.0000.018−0.0400.007−0.077−0.0240.0000.003
Ensemble0.000−0.0870.000−0.0210.1580.064−0.111−0.126
2070–2099 Simulations
CanESM20.000−0.1500.0000.0930.000−0.1300.0000.045
IPSL-CM5A0.000−0.0200.0910.0380.0000.0190.0000.083
Ensemble0.000−0.0430.0500.0540.000−0.0520.0000.084
Publisher’s Note: MDPI stays neutral with regard to jurisdictional claims in published maps and institutional affiliations.

