1. Introduction
Over 5000 years ago, human societies gradually transitioned from the Stone Age to the Metal Age and began to develop and utilize metallic mineral resources (e.g., gold, copper, and iron). Particularly, the inhabitants of the Aegean region and China discovered and started to use copper and bronze in 3200 BC [
1,
2]. Large-scale development and the use of various metallic mineral resources ensued. Especially, outcropping ores were primarily developed and mined, and they remained dominant metallic mineral sources [
3]. However, with continuous economic and social development, particularly since the beginning of the third industrial revolution, there has been an increasing demand for metallic mineral resources. This situation is met with the dilemma that all the outcropping ores have basically been exhausted.
Against this background, theoretical prediction methods and prospecting techniques for concealed ore deposits and ore bodies have become a focal but challenging topic of prospecting research. This research is focused primarily on the application of various deep-penetrating survey techniques, including fundamental geological, geochemical, and geophysical techniques, to the exploration of concealed ores [
4,
5,
6]. In particular, geophysical survey techniques have played a tremendous role. On the basis of the research results and metallogenic theories, numerous concealed metallic ore deposits [
7,
8,
9] have been discovered, such as the world-class pebble porphyry deposit in Alaska (USA), the Olympic Dam copper-gold-uranium-rare-earth element (Cu-Au-U-REE) deposit and the Ernest Henry copper-gold deposit in Australia, and the Nihe and Luohe iron deposits in Anhui (China) [
10,
11,
12]. All the above research results concern the detection and discovery of concealed metallic ore deposits of a certain scale in large areas using geophysical methods. By contrast, the application of geophysical survey techniques to the class of concealed ore bodies in the existing metallic ore deposits has been rarely investigated. In fact, as a result of many years of continuous mining, many metal mines are becoming exhausted as their proven resources are depleting, whereas the concealed resources in the deep and surrounding areas of these mines have yet to be effectively detected and evaluated. This phenomenon is most common for iron, the metal with the longest mining history, particularly banded iron formation (BIF)-type iron deposits.
BIF-type iron mines, characterized by large-scale, as well as easy mining and beneficiation, are the most important iron ore resources in the world. High-grade iron ores in BIF-type iron mines constitute 70% of the world’s high-grade iron ore reserves, and BIF-type iron mines produce over 90% of the world’s iron ores [
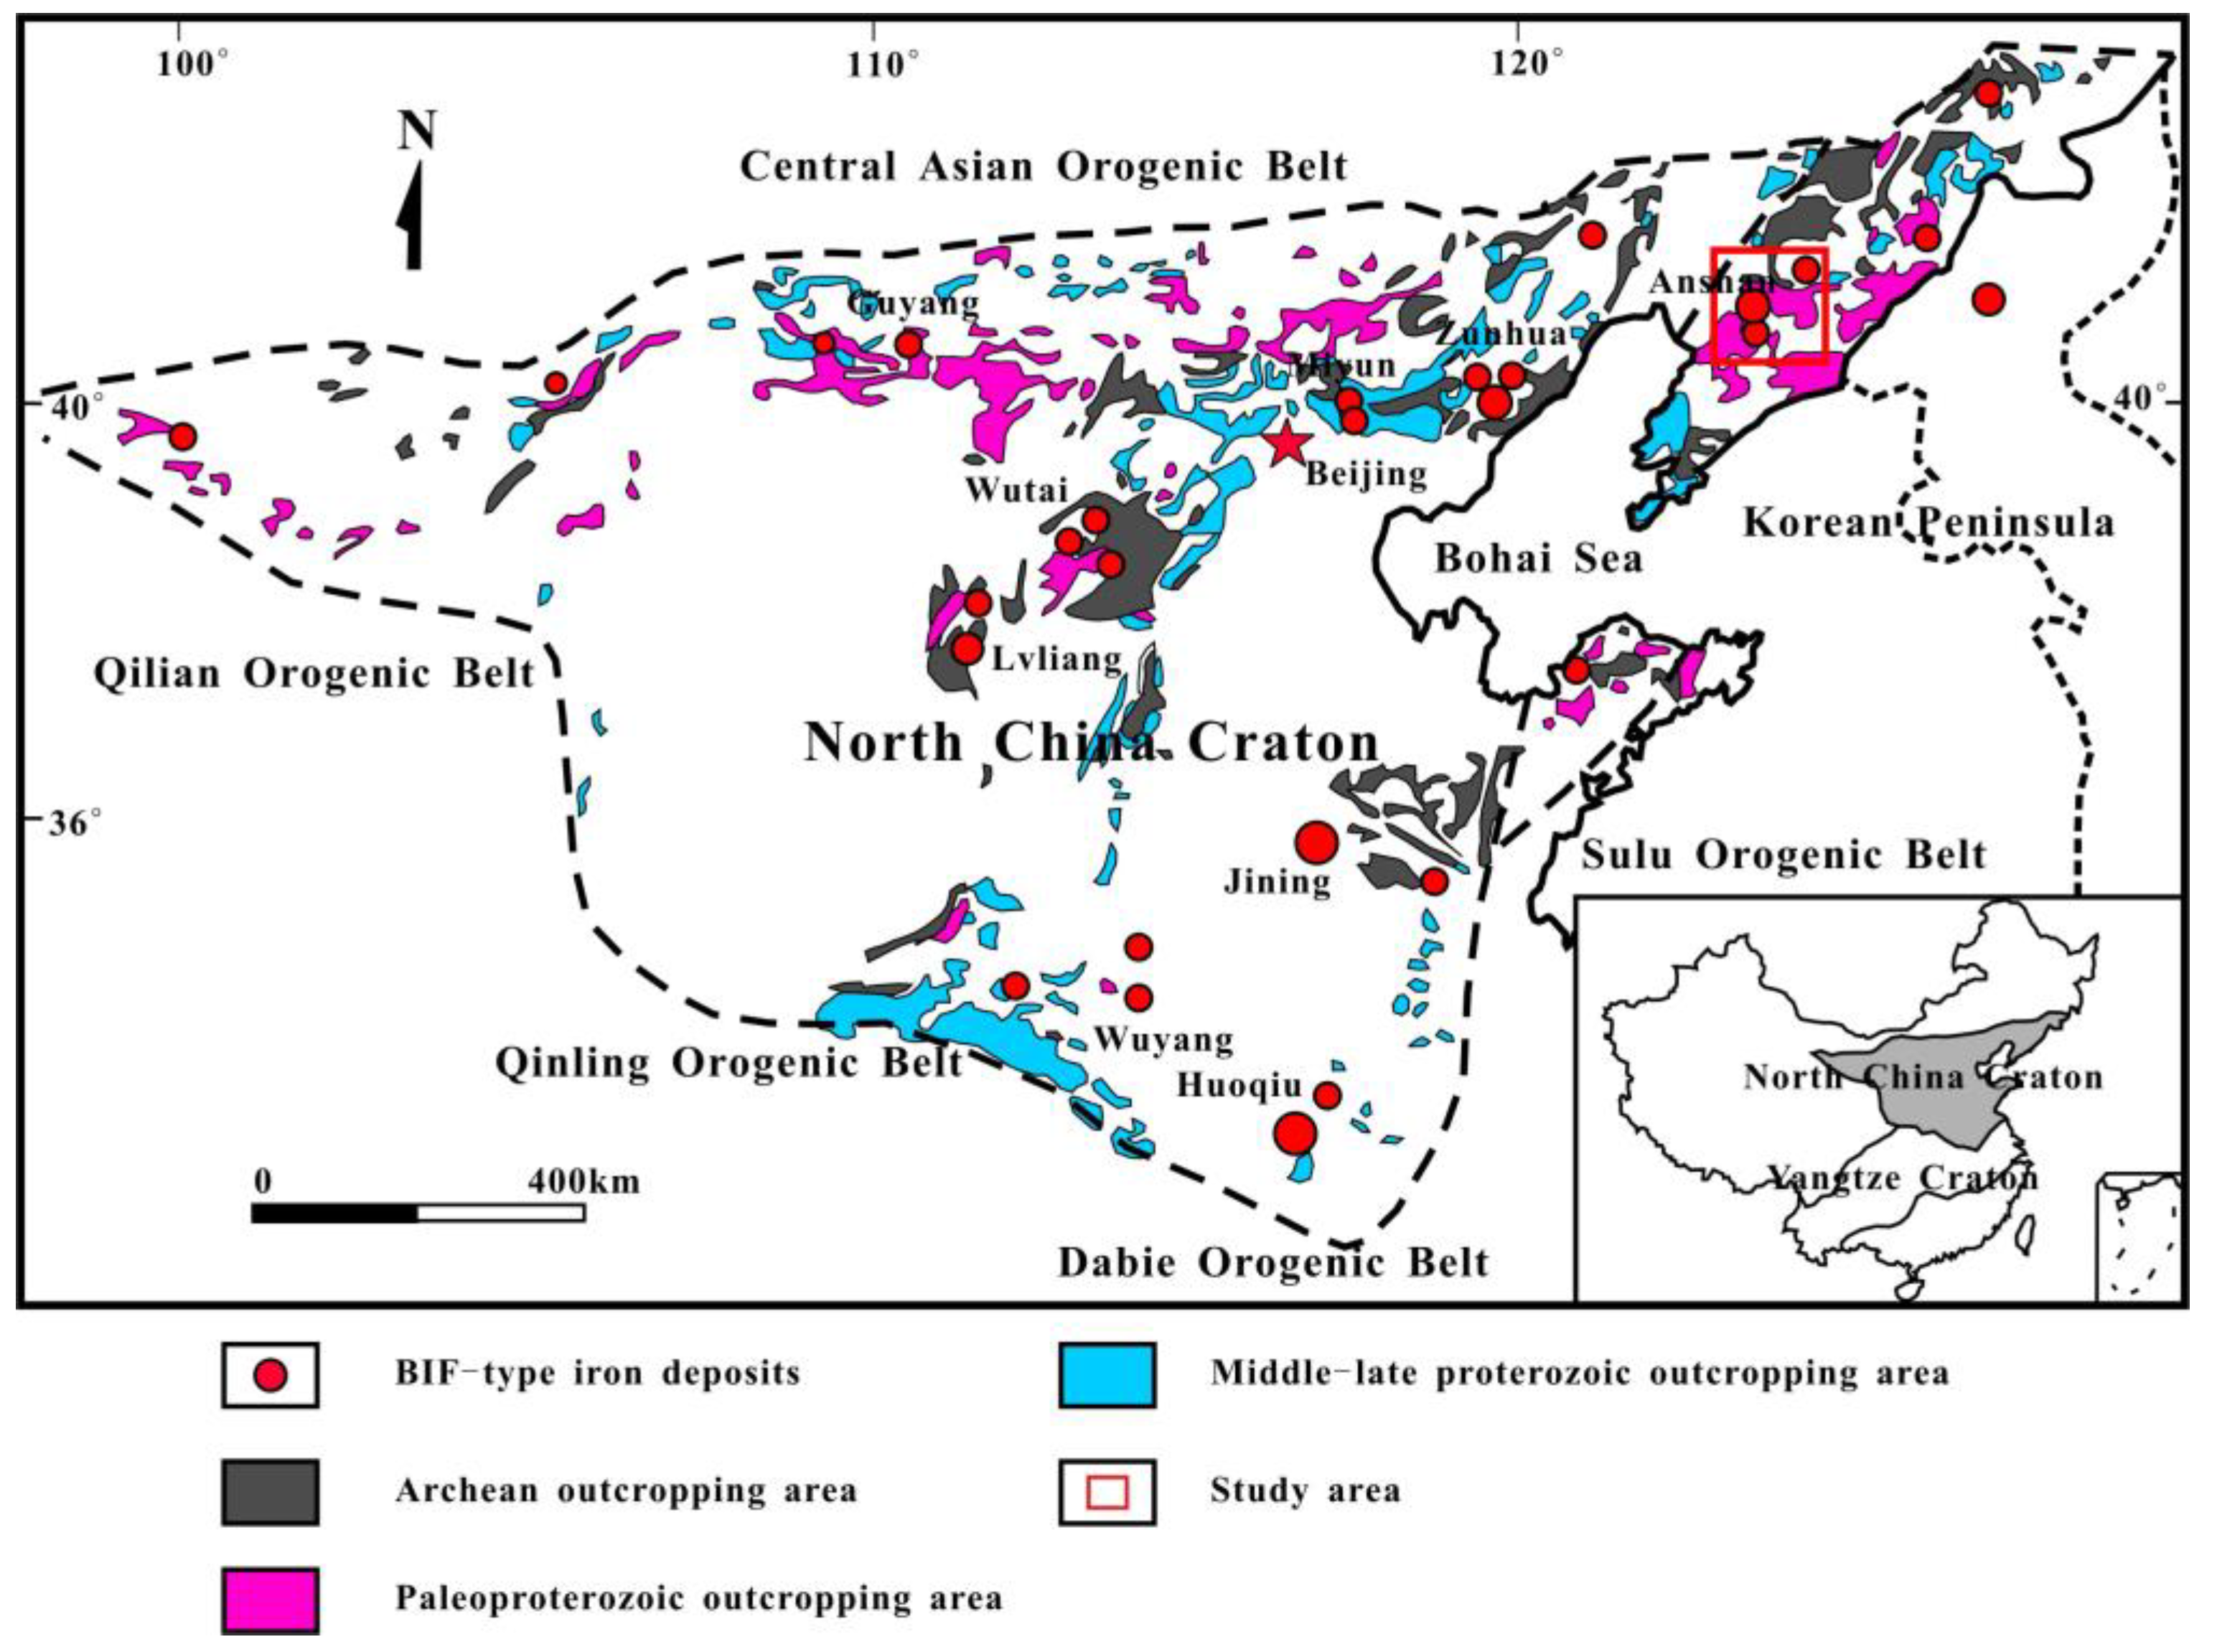
13]. BIF-type iron mines are found mainly in Russia, Australia, Brazil, Canada, China, Africa, India, and the United States. In China, BIF-type iron mines are mostly in the North China Craton (
Figure 1) and are concentrated largely in the Anshan-Benxi area, eastern Hebei, the Huoqiu-Wuyang area, Wutai, western Shandong, and Guyang.
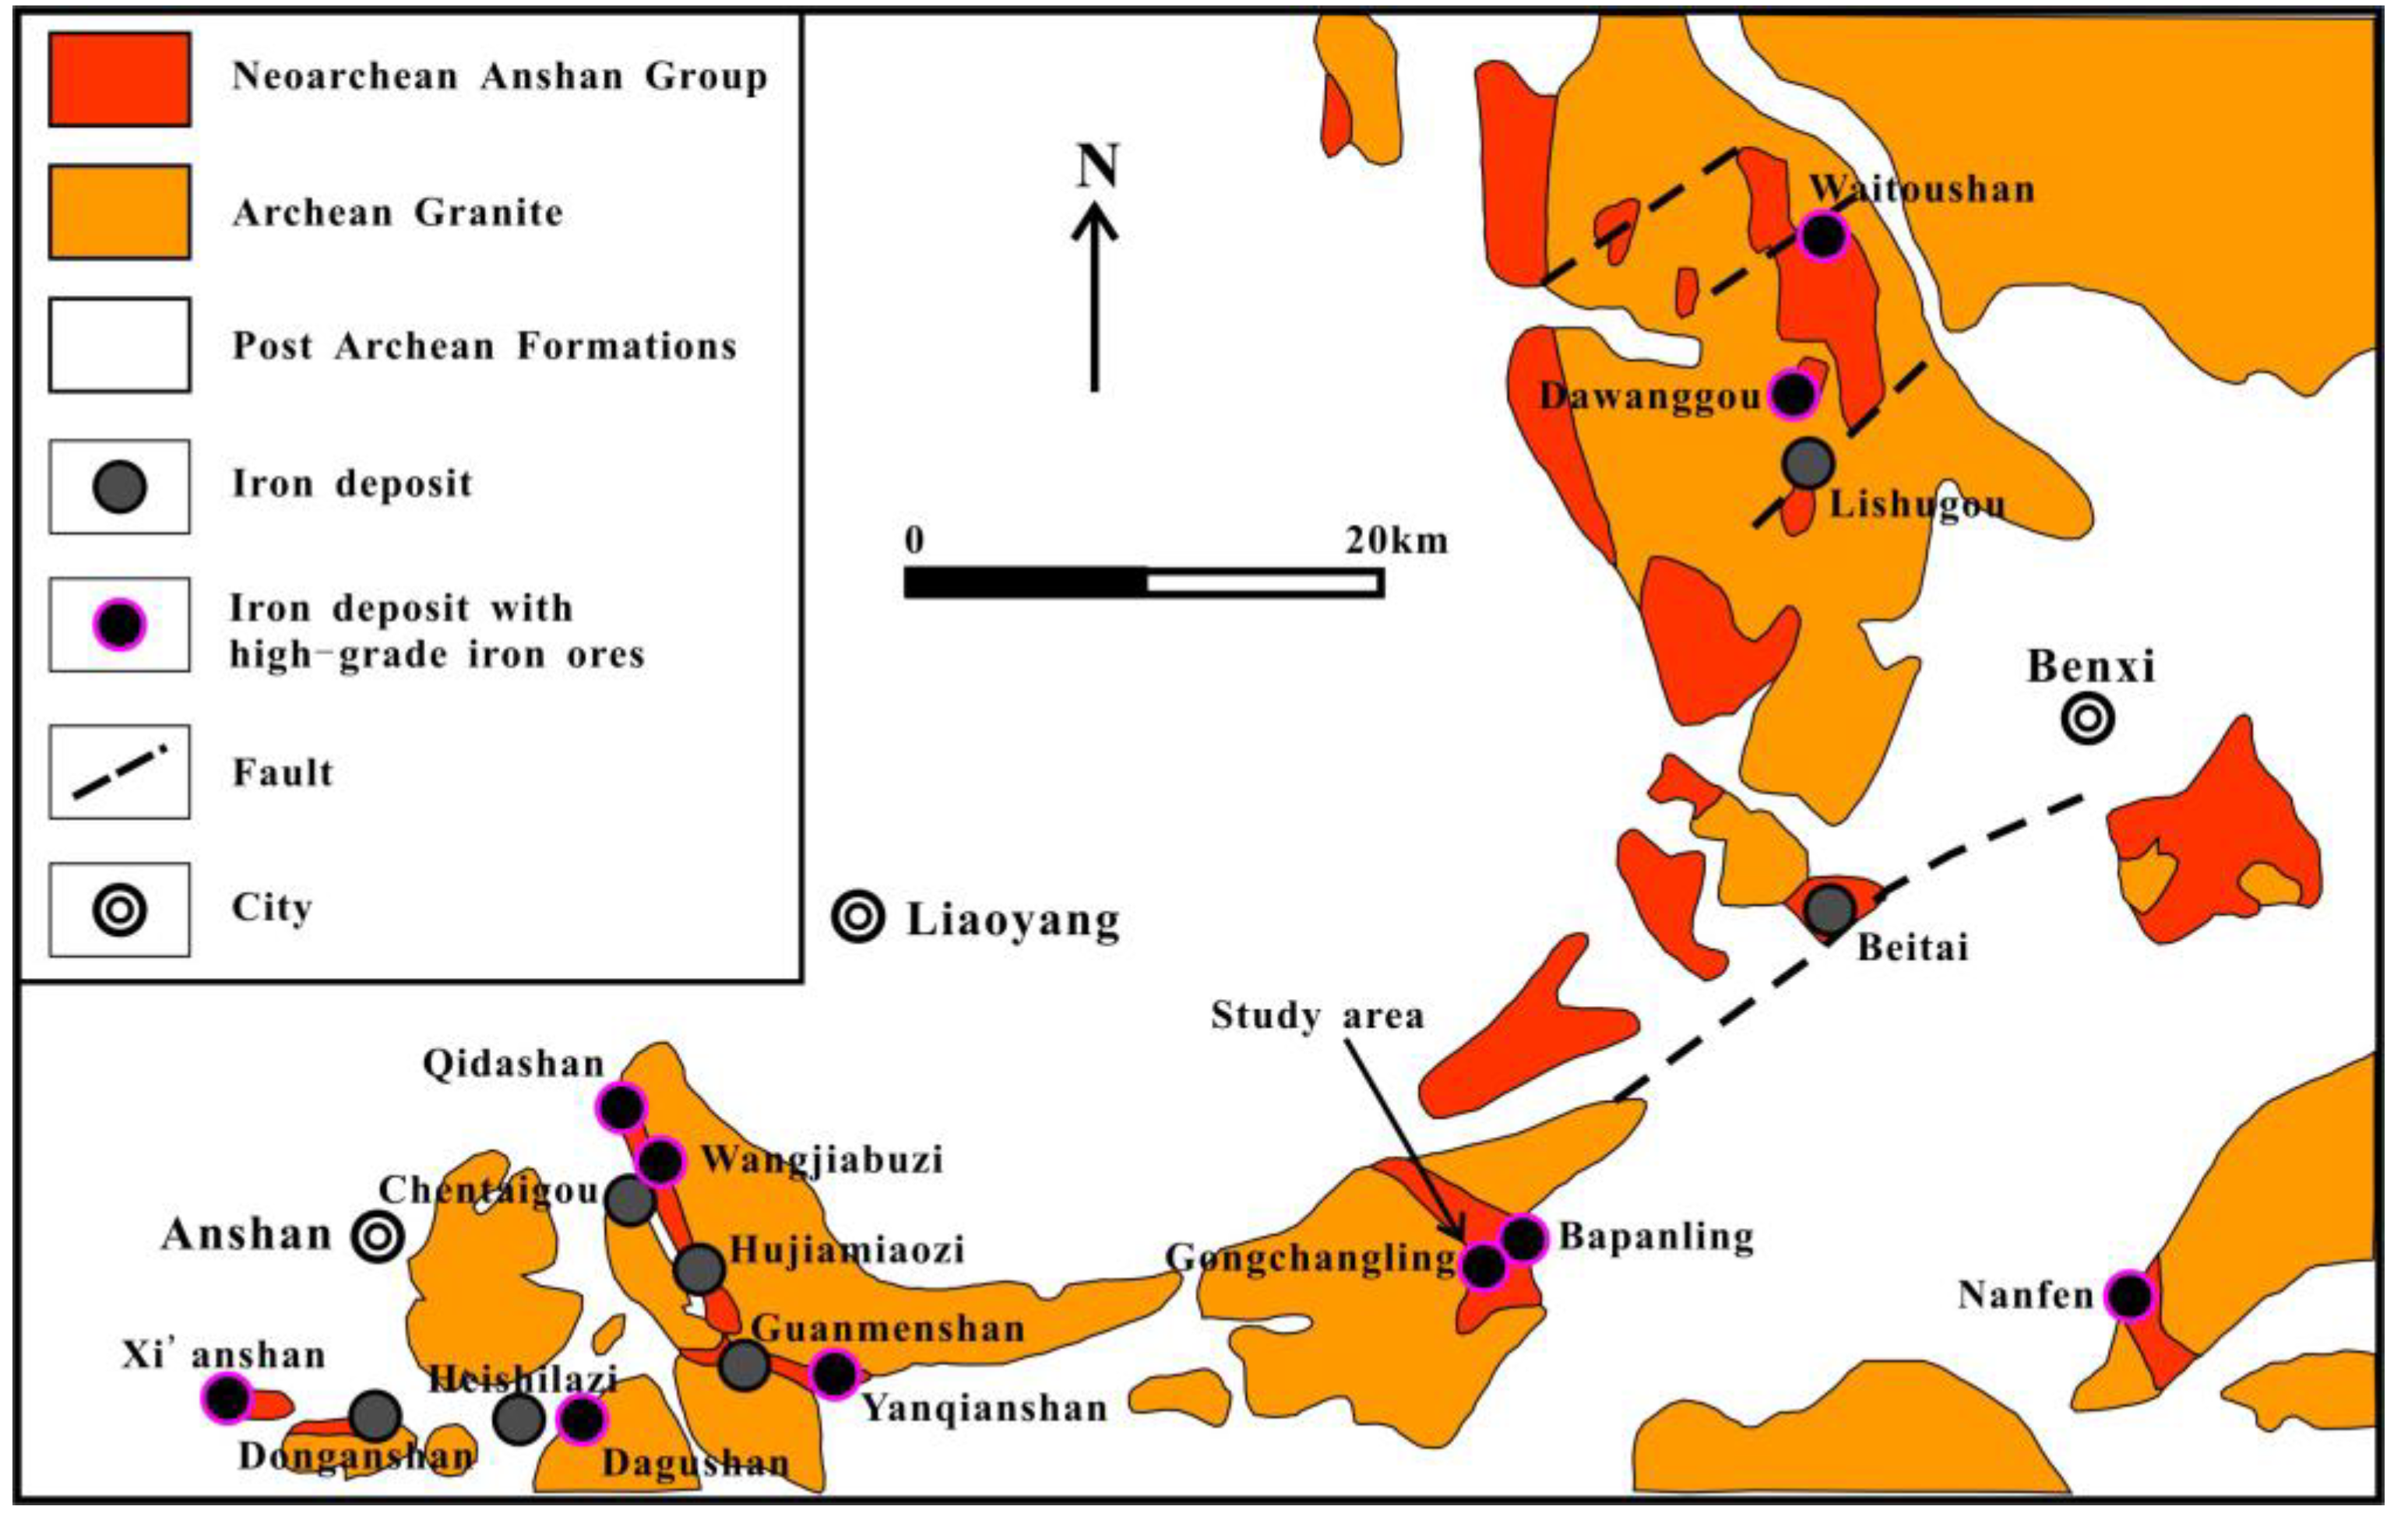
The Anshan-Benxi area is home to the most representative BIF-type iron mines, that is, the world-famous “Anshan-type” iron mines (
Figure 2). BIF-type iron deposits, mostly discovered through engineering verification of the early outcrops, as well as airborne gravity and magnetic anomalies, have the longest mining histories and the largest mining scale. However, the concealed resources in the deep and surrounding areas of these deposits have never been effectively detected or evaluated. The available resource reserves are unable to meet the continuously increasing demand for resources. The use of gridding-type engineering drilling alone to evaluate the deep and surrounding areas of existing mines is often too costly, and thus impractical, whereas the use of older monotonous aeromagnetic and gravity test results is unable to meet the high-precision evaluation requirements for concealed ore bodies. Notably, recent results have demonstrated that based on the metallogenic geological characteristics of existing deposits, it is feasible to make full use of multiple geophysical survey methods (e.g., the high-precision ground magnetic survey method (HPGMS), the transient electromagnetic method (TEM), the magnetotelluric method (MT), and the controlled source audio-frequency magnetotelluric method (CSAMT)) to accurately locate and evaluate concealed ore bodies in existing metal mines [
14,
15,
16]. While corroborating the research results for metallogenic theories, sizeable metallic ore bodies have been discovered. However, this type of research is rarely conducted on BIF-type iron mines. In particular, no such research has been performed on the BIF-type iron mines in the Anshan-Benxi area, which has complex cultural and geological settings. Hence, facing the crisis of the inability to ensure a continuous supply of iron ore resources in the future, how to efficiently, economically, and reasonably select multiple surface geophysical survey methods to evaluate concealed BIF-type iron bodies based on current metallogenic theories, as well as the current understanding of metallogenic geological characteristics, has become a technical difficulty that urgently needs to be addressed.
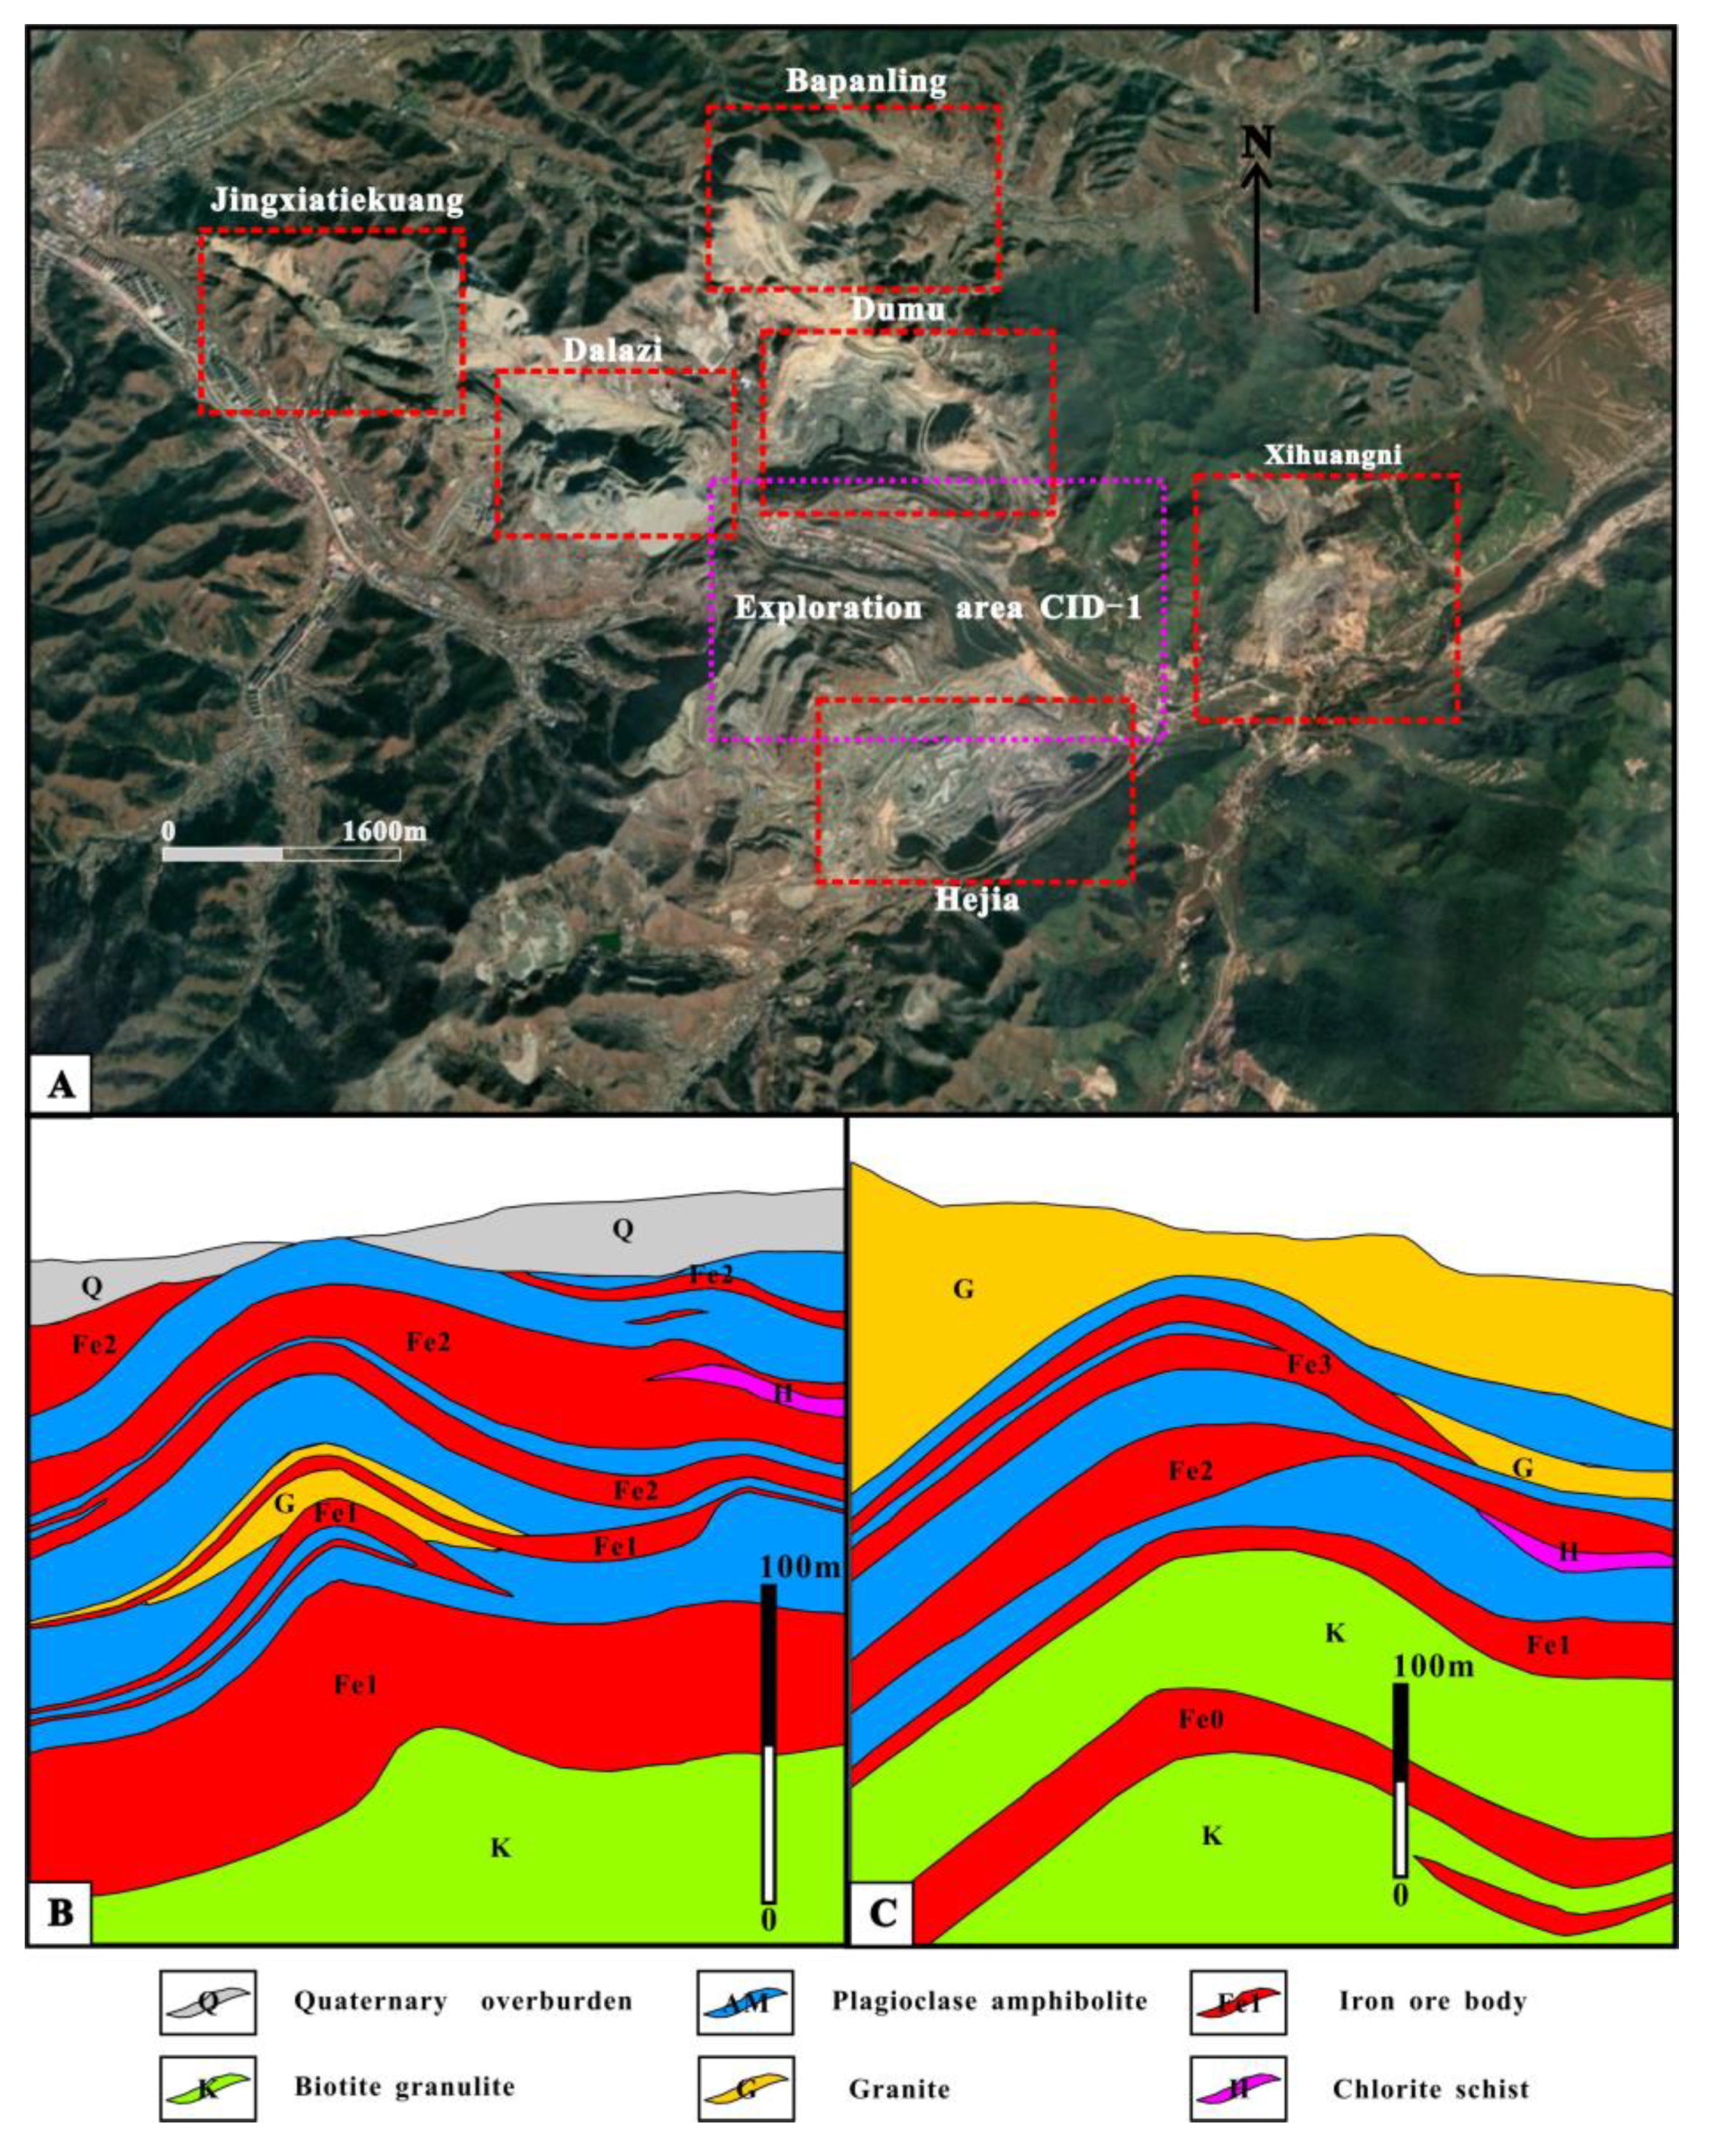
In view of this, this study investigated the detection and evaluation of the concealed iron ore bodies in the Gongchangling iron ore concentration area in the Anshan-Benxi area (
Figure 3). Specifically, based on the current status of mining and the spatial distribution patterns of the ore bodies in the Hejia and Dumu iron mines, and considering the complex cultural, geological, topographic, and geomorphic settings that ground surveying must account for, this study employed an optimal combination of geophysical survey methods, namely, the HPGMS, TEM, and MT methods, and their respective data collection devices that can take single-point, continuous, mobile survey measurements in order to detect the geophysical anomalies caused by the presence of the concealed iron ore bodies. The location, burial depth, and scale of each concealed iron ore body were accurately determined. This study addressed the technical difficulty in detecting and evaluating concealed BIF-iron ore bodies in complex topographic and geomorphic settings on the surface. This detection application study can provide a technical reference and theoretical guidance for evaluating concealed ore bodies in similar metal mines.
2. Geological Setting of the Gongchangling Iron Ore Concentration Area
Located in the eastern section of the north margin of the North China Craton, the Anshan-Benxi area is home to dozens of large to super-large BIF-type iron deposits, including the Waitoushan, Nanfen, Dong’anshan, Qidashan, Gongchangling, Hujiamiaozi, and Dagushan deposits (
Figure 2), as well as several hundred medium-sized and small iron deposits. The total proven reserves of iron ores in the Anshan-Benxi area has surpassed 12.5 billion tons [
18]. The iron ores in this area are located mainly in the strata of the Archean Anshan group. From bottom to top, the Anshan group can be divided into five formations, namely, the Shipengzi, Tongshicun, Cigou, Dayugou, and Yingtaoyuan formations, which differ in scale and outcropping degree in the Anshan-Benxi area. Each of these five formations contains BIF-type iron-bearing formations. The Cigou and Yingtaoyuan formations are important horizons that bear large and super-large iron ores and contain high-grade iron deposits of varying sizes, which are typical high-grade iron deposits among the deposits across the world and are represented by the Jingxiatiekuang iron deposits in the Gongchangling area. These iron deposits are also known as Anshan-type iron deposits.
The iron ores in the Gongchangling area are mainly located within the Cigou formation of the Archean Anshan group. Spatially, six large iron deposits are distributed in the Gongchangling area, namely, the Jingxiatiekuang, Dalazi, Bapanling, Dumu, Hejia, and Xihuangni iron deposits (
Figure 3A). The Jingxiatiekuang iron deposit is home to world-renowned large Gongchangling-type high-grade iron ores (Anshan-type high-grade iron ores). Spatially, the iron ores in the Gongchangling area are densely distributed in a steady, continuous, layered manner and crop out on the surface on a large scale. As a result, they can be easily discovered and have been mined for a long time. With regard to prospecting, there is only one “blank” zone (CID-1), which is located between the Hejia and Dumu iron deposits. Zone CID-1 was selected as the survey area of this study. Zone CID-1 is covered with clastic sedimentary rocks formed by intense erosion as a result of tectonic development and is also the core of a large anticlinorium composed of the Cigou formation. The south and north limbs of the anticlinorium are the present-day Hejia and Dumu iron deposits, respectively. The lithology of the Cigou formation, the primary ore-hosting strata in the area, is composed predominantly of plagioclase amphibolite, biotite leptynite, biotite-amphibole plagiogneiss, hornblende schist, chlorite schist, tremolite schist, biotite albite leptynite, monzonite leptite, and magnetite quartzite. The ore-bearing lithological horizon of the Cigou formation is primarily a plagioclase amphibolite layer. Various types of schist, such as chlorite schist, quartz schist, hornblende schist, and mica schist, have developed in the areas where the plagioclase amphibolite layer comes in contact with the ore bodies. In addition, sizeable reserves of iron ore resources have been discovered in recent years in the biotite leptynite layer at the bottom of the ore-bearing horizon. This biotite leptynite layer is referred to as the iron-bearing zone in the Fe0 bed. For example, currently, the ore bodies in the Fe0 bed are primarily mined from the Dumu iron deposit.
Zone CID-1 was selected as the survey area of this study. The ore-bearing lithological horizon of the Hejia iron deposit, located south of zone CID-1, is consistent with that of the Dumu iron deposit, located north of zone CID-1. Owing only to the difference in the extent of later-stage uplifting and erosion, the Hejia iron deposit contains no granite layer and no iron-bearing zone in the Fe3 bed (
Figure 3B,C). Currently, the iron bodies in the Fe1 and Fe2 beds are primarily mined from the Hejia iron deposit. Due to the difference in the stage of development and utilization, apart from the iron ore bodies mined in the Fe1, Fe2, and Fe3 beds from the Dumu iron deposit, a thick, large magnetite body layer in the Fe0 bed has been discovered in the biotite leptynite bed at the bottom of the Dumu iron deposit during the exploration and development process. In comparison, only a scattered magnetite body layer has been found in the biotite leptynite bed at the bottom of the Hejia iron deposit during the exploration process. Due to the conventional understanding that no mineralization occurs in biotite leptynite beds, no in-depth evaluation has been performed.
Survey zone CID-1 is the transition zone between the Hejia and Dumu iron deposits. In the center of zone CID-1, there exists a sizeable north-west trending Hejia fault, which has long been under erosion. Sporadic outcropping residual iron ores are visible only in the Quaternary coverage area on the surface. The extent of the erosion of zone CID-1 has yet to be systematically investigated. In addition, whether there exist concealed iron bodies beneath zone CID-1 has never been systematically evaluated. Due to the limitations of metallogenic theories and survey techniques, the evaluation of the resource potential of the deep and surrounding areas of many BIF-type iron mines has suffered the same shortcoming. For these reasons, zone CID-1 was selected, in this study, to investigate the detection of concealed iron bodies. First, concealed iron ore beds could be discovered and located in the Quaternary coverage area. Moreover, new geological discoveries and understandings could be verified to help break away from the conventional prospecting approach.
Table 1 summarizes the physical parameters of the main rocks and ores of CID-1. There are notable differences between their physical parameters. In particular, the iron ores have a notably lower resistivity and are more magnetic than the wall rocks. These traits provide a precondition for relevant geophysical surveys.
3. Methods
The concealed iron ore bodies in the transition zone CID-1 between the Hejia and Dumu iron deposits were detected primarily using deep-penetrating geophysical survey methods, that is, the HPGMS, TEM, and the MT methods, based on the observed differences between the physical parameters of the rocks and ores. First, the HPGMS method was employed to determine the spatial distribution pattern of the concealed iron ore bodies and to locate the geophysical anomalies caused by the presence of these concealed iron bodies. Second, portable TEM and MT data collection devices were used to survey the anomalous zones detected using the HPGMS method at fixed points and depths to determine the burial depths and sizes of the geophysical anomalies caused by the presence of the concealed iron bodies. Finally, engineering drilling verification was performed based on the determined spatial planar and burial-depth profile anomalies caused by the concealed iron bodies to obtain accurate location and scale information about the concealed iron bodies.
During the detection of the concealed iron bodies, the coordinates were set based on the coordinate parameters provided by the mine, except in HPGMS-based surveys. An S750 handheld geographic information system acquisition system (South Surveying & Mapping Instrument Co., Ltd., Guangzhou, China) with sub-meter-level positioning accuracy was used to collect coordinate data for spatial locations. The built-in global positioning system (GPS) with positioning accuracy better than 3 m was used to conduct HPGMS-based surveys.
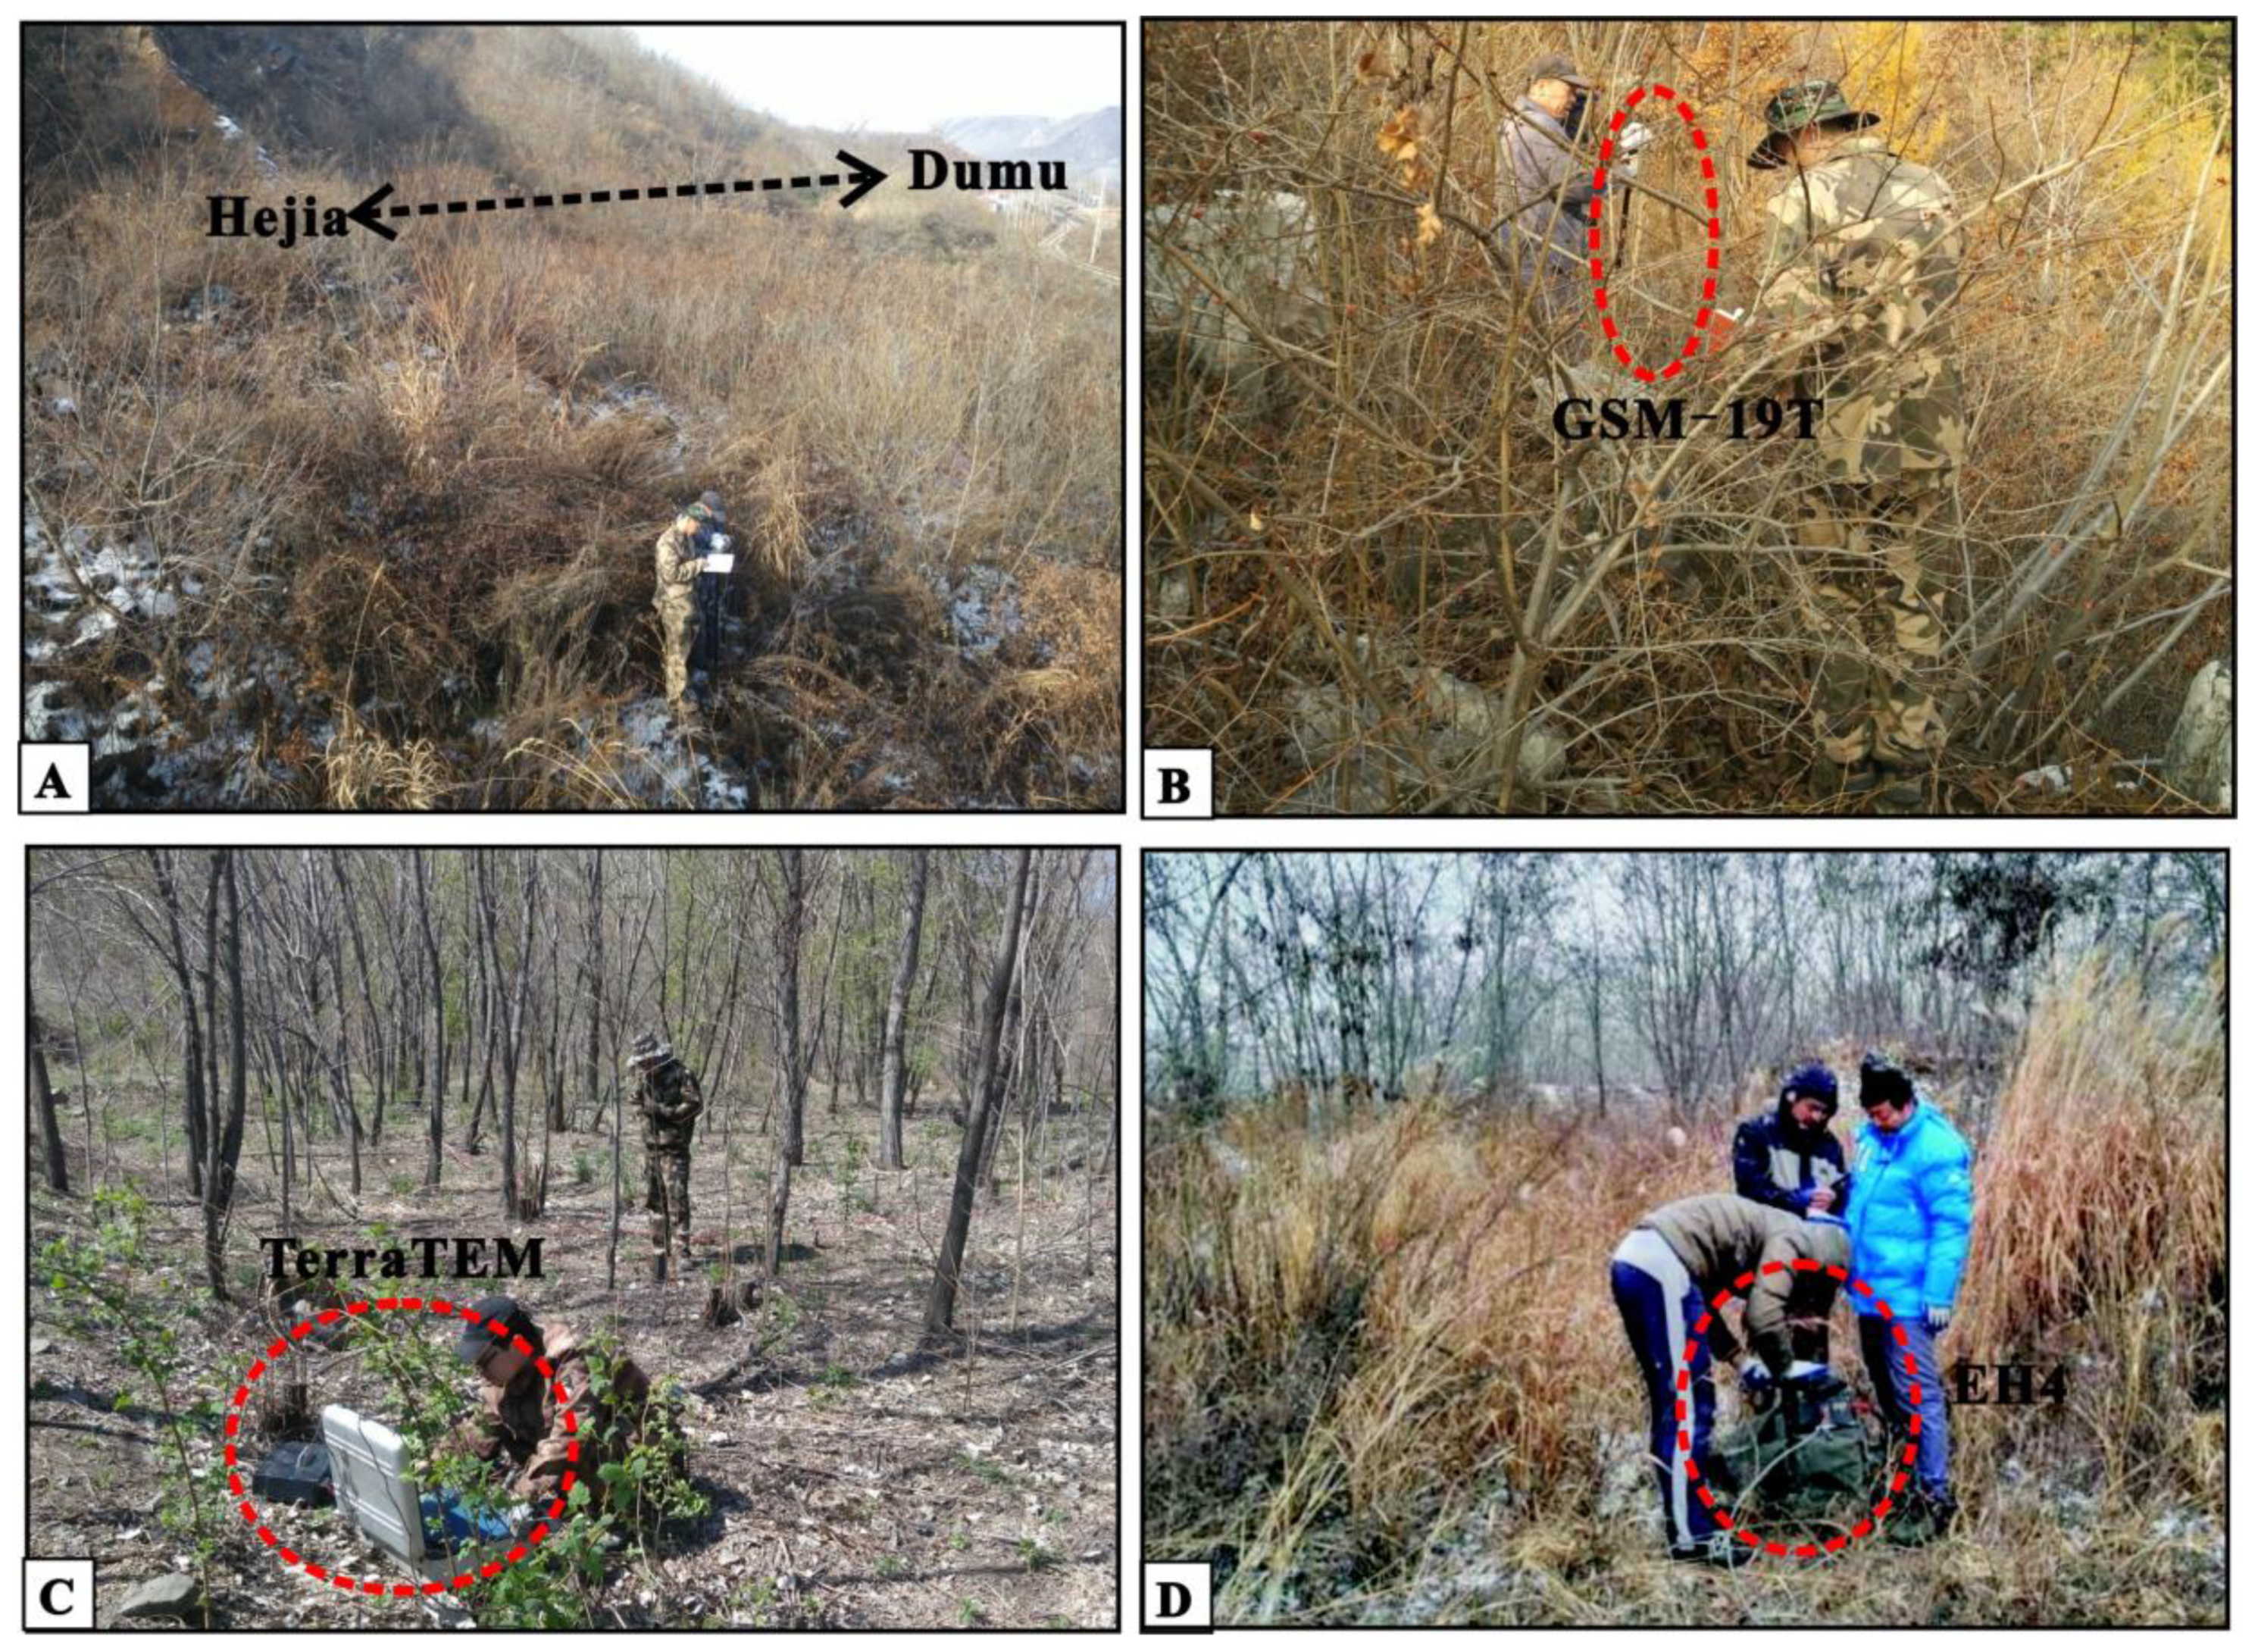
Notably, to make full use of the advantages (i.e., high efficiency, low cost, and convenience, and speediness) of the geophysical survey methods, based on the in-situ survey environment (
Figure 4A), portable equipment and data collection devices capable of taking single-point mobile surveys were used in this study. These devices were used in coordination to conduct flexible, efficient geophysical scans, and deep profile measurements on BIF-type concealed iron ore bodies.
3.1. High-Precision Ground Magnetic Method
A GSM-19T standard proton precession magnetometer (GEM, Canada) was employed to perform magnetic surveys. This magnetometer is equipped with an all-way probe with no north-pointing requirements and a high-precision GPS (
Figure 4B) and has a resolution of 0.01 nT, an absolute precision of ±0.2 nT, and a dynamic measuring range of 20,000–120,000 nT.
Magnetic survey data were obtained from multiple south-north trending survey lines passing through the study area (i.e., zone CID-1) within the space where magnetic surveys could be conducted. The spacing between magnetic survey lines was 50 m. The spacing between magnetic survey points varied from 5 to 20 m. The magnetic survey lines and points covered the whole study area selected for surveying. The magnetic survey points were positioned using the built-in GPS (positioning precision: 3 m) of the magnetometer. Magnetic survey data were collected in mobile mode. The mobile observation wait time was set to 5 s. Magnetic survey data were collected from 8417 magnetic survey points on 64 magnetic survey lines.
The magnetic survey data were processed using the GeoExpl multivariate geospatial data management and analysis system developed by the China Geological Survey. The measured magnetic field data were corrected, subjected to a reduction-to-the-pole (RTP) treatment, and upward continuation, and their vertical derivatives were also calculated. These treatments eliminated various interfering factors and allowed the magnetic anomalies to accurately reflect anomalous magnetic bodies within a certain depth from the surface.
3.2. Transient Electromagnetic Method
The TEM method is a time-domain electromagnetic method. A multi-turn coincident minor loop device capable of being disassembled and assembled can be employed to facilitate fixed-point, continuous TEM-based geophysical surveys of narrow, finite spaces [
19,
20]. The TerraTEM system (Monash GeoScope, Australia) was used in this study as the TEM-based survey device (
Figure 4C). This system can handle over 140 time-gate windows and collects high-resolution information within a short time. When equipped with a rapid, enhanced turn-off-time device, the TerraTEM system has a short turn-off time. In addition, this system is internally equipped with many combinations of detection devices, and therefore is suitable for the detection of concealed geological bodies at various depths.
The TEM survey lines were arranged such that they mainly passed through the long-axis direction of the anomalous planar bodies detected using the HPGMS method. The spacing between TEM survey lines was 100 m. The spacing between TEM survey points varied from 10 to 20 m. An S750 system with positioning precision better than 1 m was used to determine the locations of the TEM survey points. A multi-turn coincident minor loop device with a side length of 10 m, a 10-turn transmission coil, a seven-turn receiving coil, and a transmission voltage supply of 24 V, which could be disassembled and assembled on site, was used to collect TEM data. TEM data were collected and stacked 16–512 times. The single-point data sampling window density was 147, far exceeding the sampling density (interval) of conventional transient electromagnetic devices. As a result, this device could accurately identify anomalous changes in physical properties within a certain depth. Two TEM survey lines, TEM-1 and TEM-2, were set in the survey area. TEM data were collected from 21 (spacing 20 m) and 28 (spacing 10 m) points on survey lines TEM-1 and TEM-2, respectively.
The collected TEM data were processed using the built-in transient electromagnetic workstation. Specifically, the TEM data were subjected to treatments such as cleansing, preprocessing (shearing and filtering enhancement as well as distortion elimination), apparent resistivity conversion, and time-depth conversion. Finally, an apparent resistivity contour profile was generated and interpreted based on geological and geophysical data.
3.3. Magnetotelluric Method
An EH4 system, developed jointly by EMI (USA) and Geometrics (USA), was used in this study to conduct MT surveys. Capable of detecting concealed geological bodies at shallow and moderate depths [
21], the EH4 system is a dual-source electromagnetic system with a working frequency range of 10 Hz–100 kHz. When in operation, the EH4 system collects the signals of a natural or artificial electric field (E, a group of orthogonal E
x and E
y components) with a corresponding frequency f, as well as the signals of a magnetic field (H, a group of orthogonal H
x and H
y components) with a frequency of f. The resistivity ρ corresponding to f was calculated using Equation (1):
Thus, the resistivities of multiple underground layers were measured based on the relationship between frequency and depth. Notably, the EH4 system can take continuous, single-point measurements, and thus can be conveniently and flexibly applied to various adverse topographic and geomorphic settings (
Figure 4D).
The survey lines of the EH4 system were arranged mainly in parallel to and close to the TEM survey lines. On the one hand, this arrangement facilitated comparison with the TEM survey results. On the other hand, it let us detect and discover deep anomalous geological bodies. The spacing between the survey lines of the EH4 system was 100 m. The spacing between the survey points of the EH4 system was 20 m. An S750 system with positioning precision better than 1 m was used to determine the locations of the survey points of the EH4 system. The following procedure was used to collect data: laying a survey grid, testing the equipment, placing electrodes, placing magnetic bars, placing an analogue front-end amplifier (AFE), placing the main frame, and collecting data. Two survey lines of the EH4 system, MT-1 and MT-2, were set in the survey area. Data were collected from 20 and 10 points along survey lines MT-1 and MT-2, respectively.
The time-series data collected by the EH4 system were first preprocessed, and then subjected to a fast Fourier transform (FFT). Thus, data for the imaginary and real components of the electric and magnetic fields, as well as the phases, were obtained. Finally, the built-in software of the EH4 system was employed to perform one-dimensional inversion and two-dimensional joint inversion on the data. A two-dimensional resistivity profile was produced based on the processed data.
4. Results
The collected HPGMS, TEM, and MT data were systematically processed and geophysically interpreted using relevant software. In particular, the cross-validation of the survey results obtained using two geophysical methods, that is, the TEM and MT methods for the shallow and deep areas, let us make full use of the technical advantages of geophysical surveying in single-point, continuous measurements within a certain depth and overcame the technical difficulty of surveying narrow spaces and complex topographic and geomorphic environments. In addition, the geophysical survey results were preliminarily verified by drilling.
4.1. High-Precision Ground Magnetic Method Data
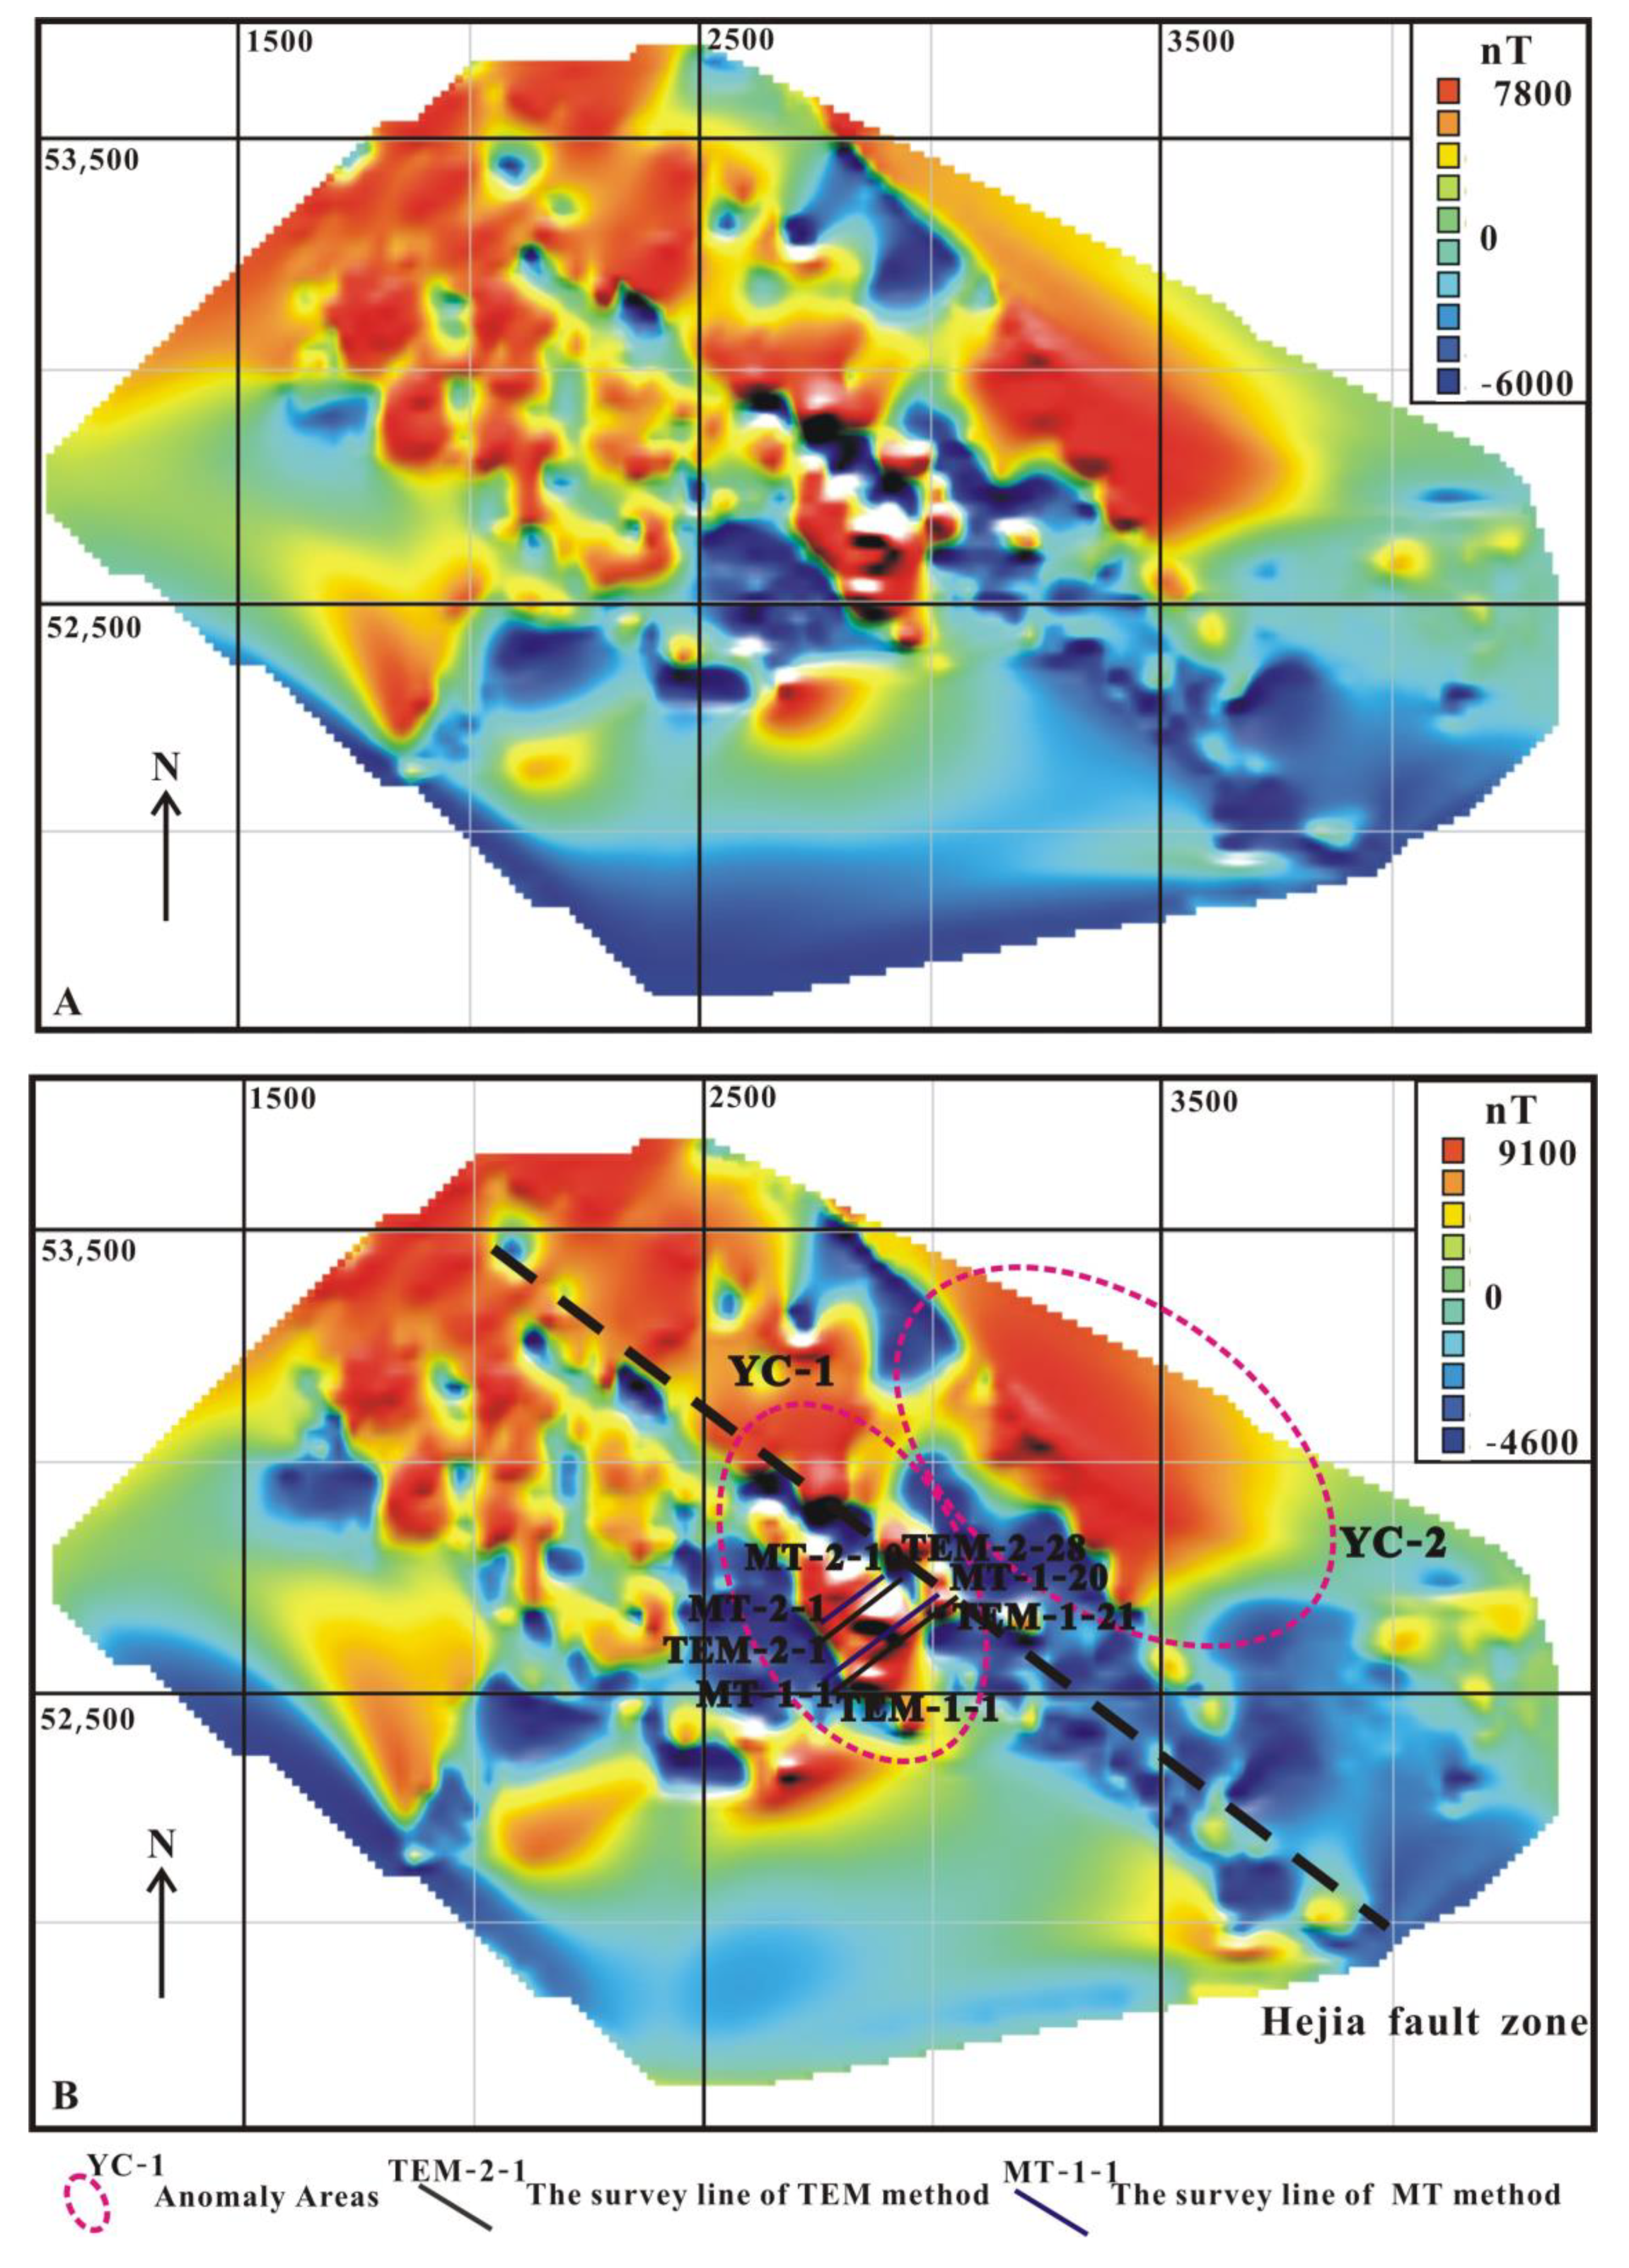
A total of 8417 HPGMS data points were collected from the survey area (zone CID-1) between the Hejia and Dumu iron deposits. These raw data were first corrected and processed, and then used to produce a magnetic anomaly map (
Figure 5A). When the geomagnetic field background of the survey area was 53,527 nT, the value of magnetic anomaly data varied from −6092 to 7872 nT. Evidently, the data satisfactorily reflected the scale of the concealed anomalous magnetic bodies.
To eliminate the effects of oblique magnetization and allow the location of a magnetic anomaly to reflect a hidden magnetic body directly beneath it, all the data were subjected to RTP treatment.
Figure 5B shows the magnetic anomaly map produced, based on the RTP-treated HPGMS data. Clearly, the highly magnetic anomaly zones are distributed in a densely scattered pattern in the survey area. This distribution pattern, on the one hand, results from the scattered distribution of the residual magnetic ore bodies on the surface and, on the other hand, is a consequence of the poor continuity of ores caused by the later-stage tensile failure of the Hejia fault zone. These, to a certain extent, suppress and affect the reflection of the anomalies caused by the large concealed magnetic bodies.
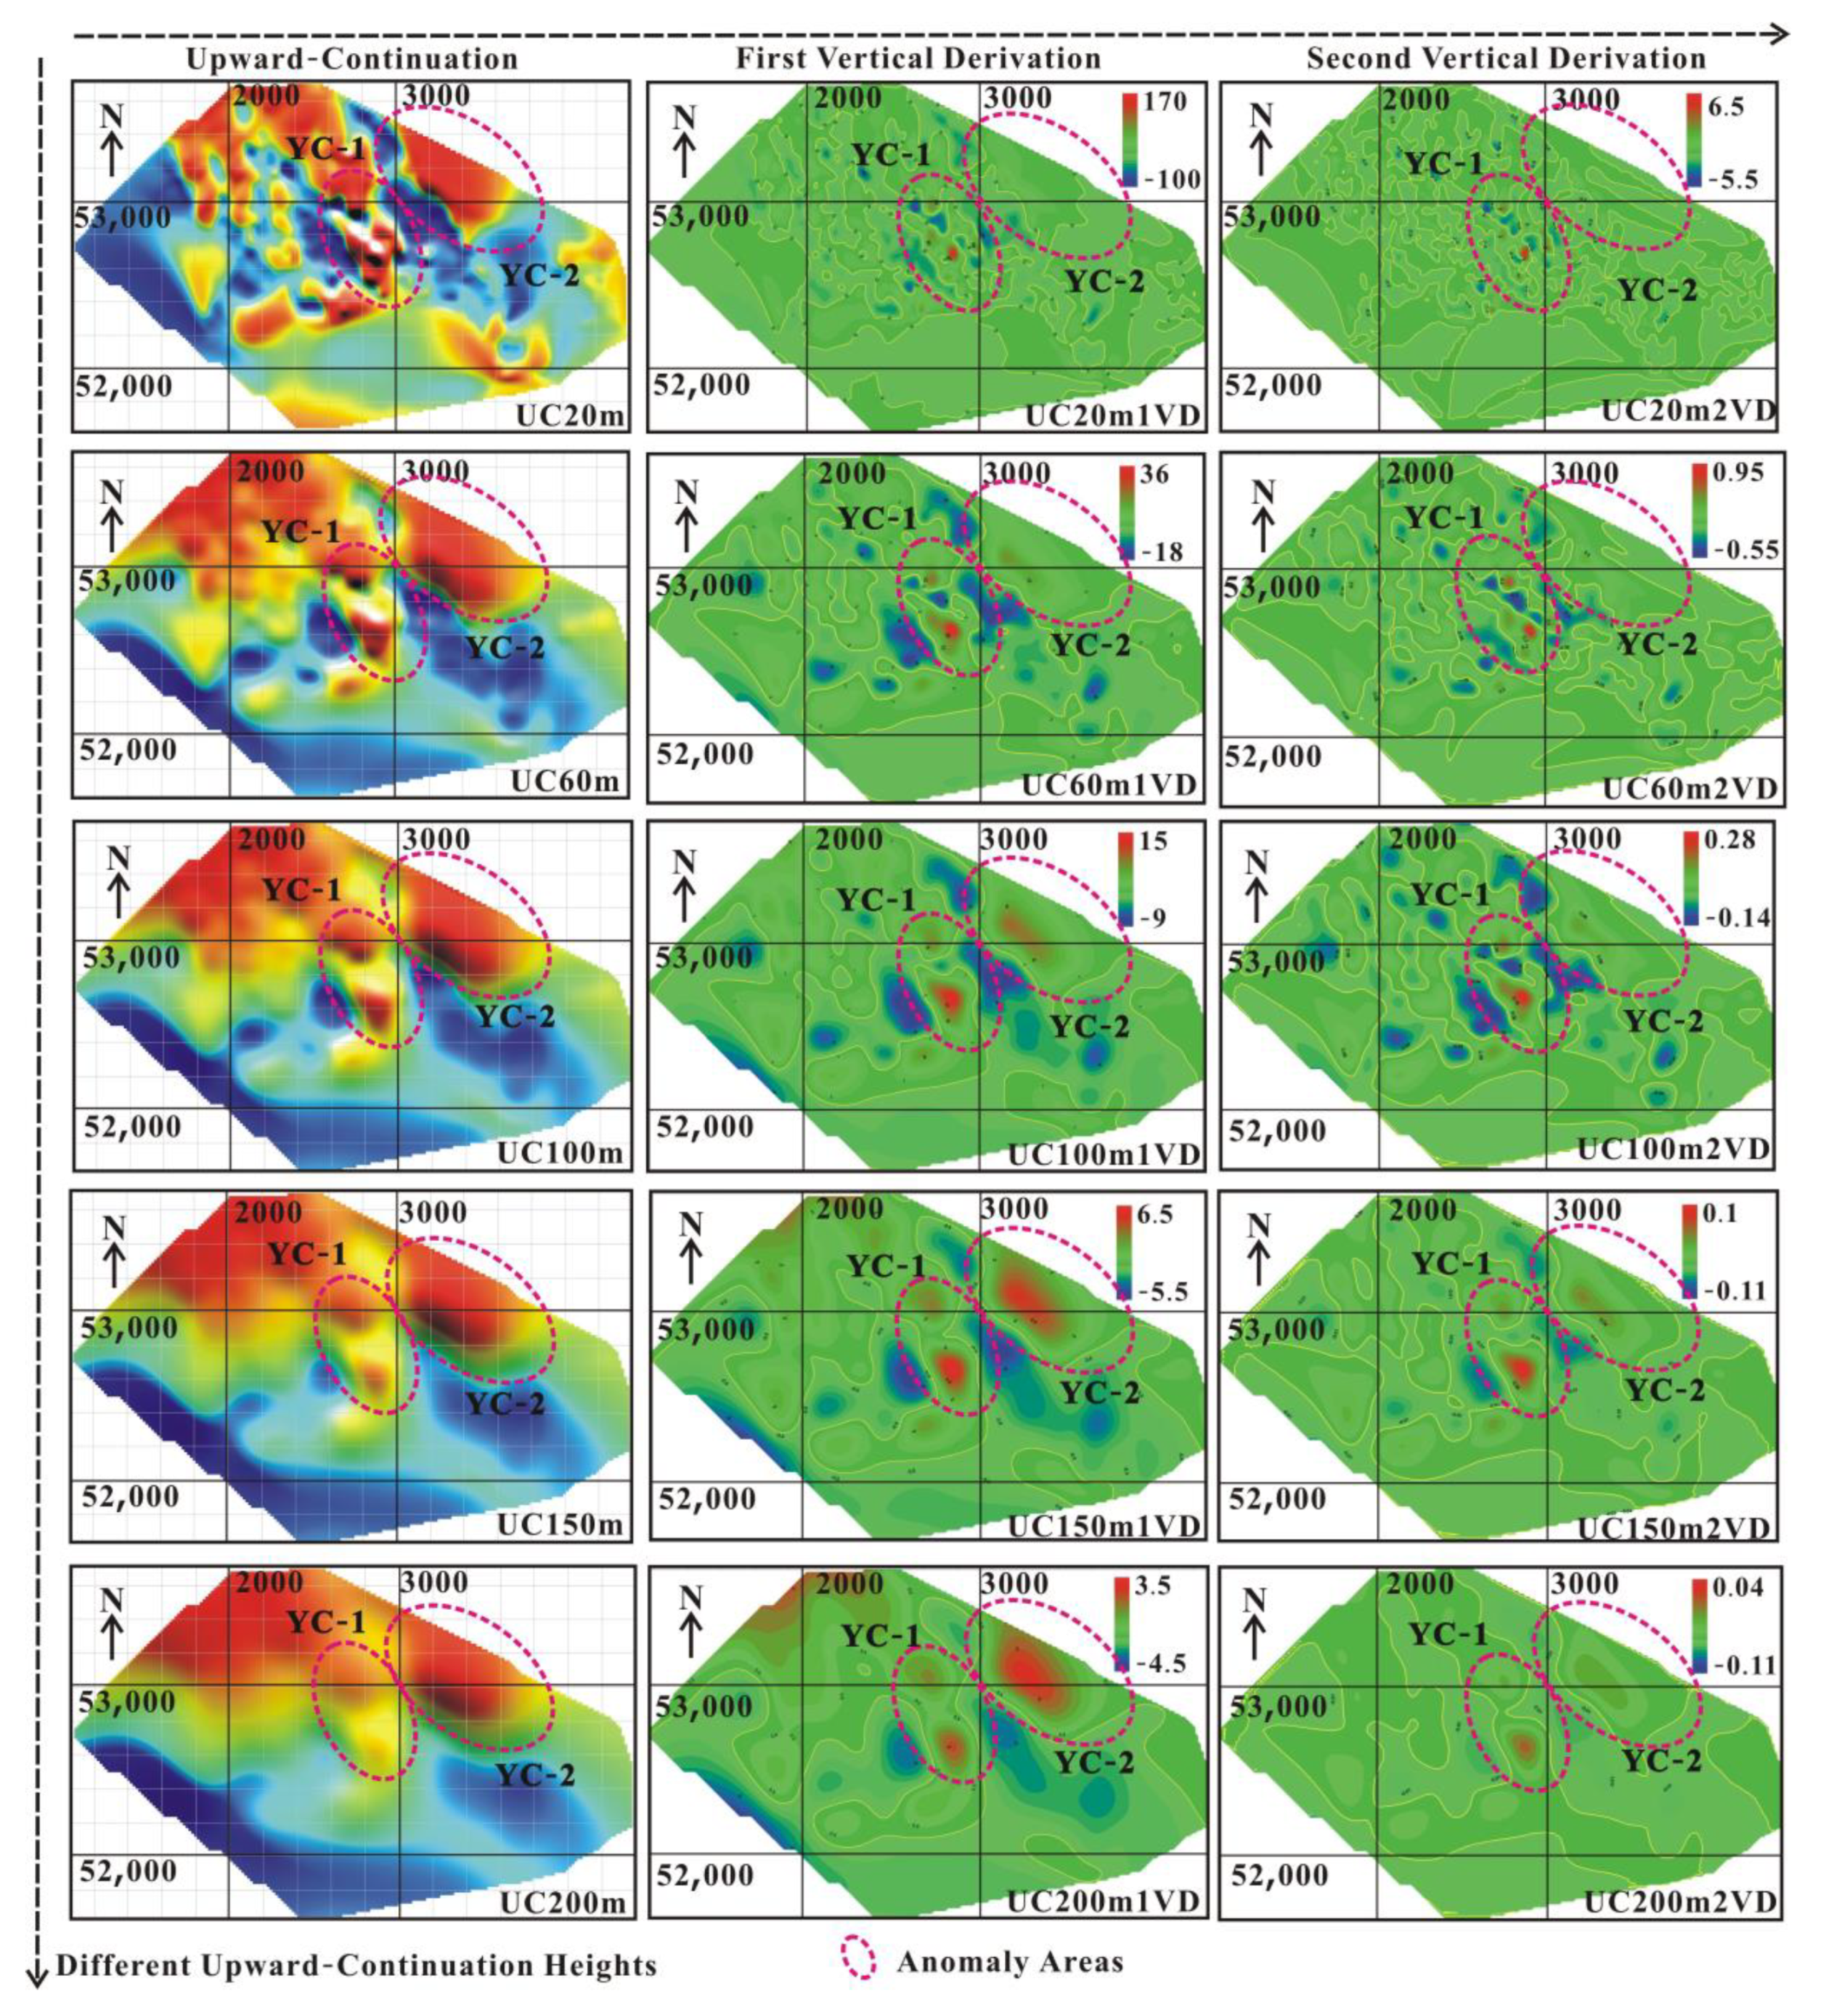
To better show the location, scale, and approximate burial depth of each concealed anomalous magnetic body, the data were processed by upward continuation to various heights (20, 60, 100, 150, and 200 m) (
Figure 6). This treatment eliminated the effects of the surface and shallow-surface residual anomalous magnetic bodies. The first-order vertical derivatives of the data were calculated to subdue the effects of the background field in the deep area and to highlight the local anomalies caused by the anomalous magnetic bodies in the survey area [
22]. Calculating the derivatives of the first-order vertical derivatives, that is, the second-order vertical derivatives, eliminated or weakened the background field and facilitated the delimitation of the anomalous magnetic bodies [
23,
24]. In the research, we processed the magnetic data via upward continuation at different heights and rasterized the obtained data to get gridding data. Subsequently, we took the vertical derivative of the gridding data and obtained first-order and second-order vertical derivatives. Two notably planar positive magnetic anomaly zones, YC-1 and YC-2, were discovered through the above systematic treatment. Zone YC-1 is located in the center of the survey area, and its long axis is distributed along the north-west direction, which is consistent with the strike of the main body of the ores in the area. The anomalies in zone YC-1 steadily extend several hundred meters from the shallow area to the deep area. Zone YC-2 is in the northern survey area, and its long axis is distributed along the north-west direction. Zone YC-2 adjoins the Dumu iron deposit and is separated from zone YC-1 by the main Hejia fault zone. Moreover, based on the extension of the HPGMS data to various heights, as well as the determined boundaries of the anomalous bodies, the anomalous magnetic bodies within zones YC-1 and YC-2 are, overall, inclined towards the NE direction. These are the anomalous spatial characteristics of the concealed magnetic ore bodies detected in this study.
The planar spatial locations of the concealed iron ore bodies were accurately determined by processing the HPGMS data. The burial depths and profile variations of the concealed iron ore bodies were determined primarily from the measurements of the TEM and MT survey lines. Considering that zone YC-2 adjoins the Dumu iron deposit, geophysical profile measurements were taken primarily in zone YC-1. These results adequately show the effectiveness of the geophysical survey methods in detecting concealed metallic ore bodies.
4.2. Transient Electromagnetic Method Data
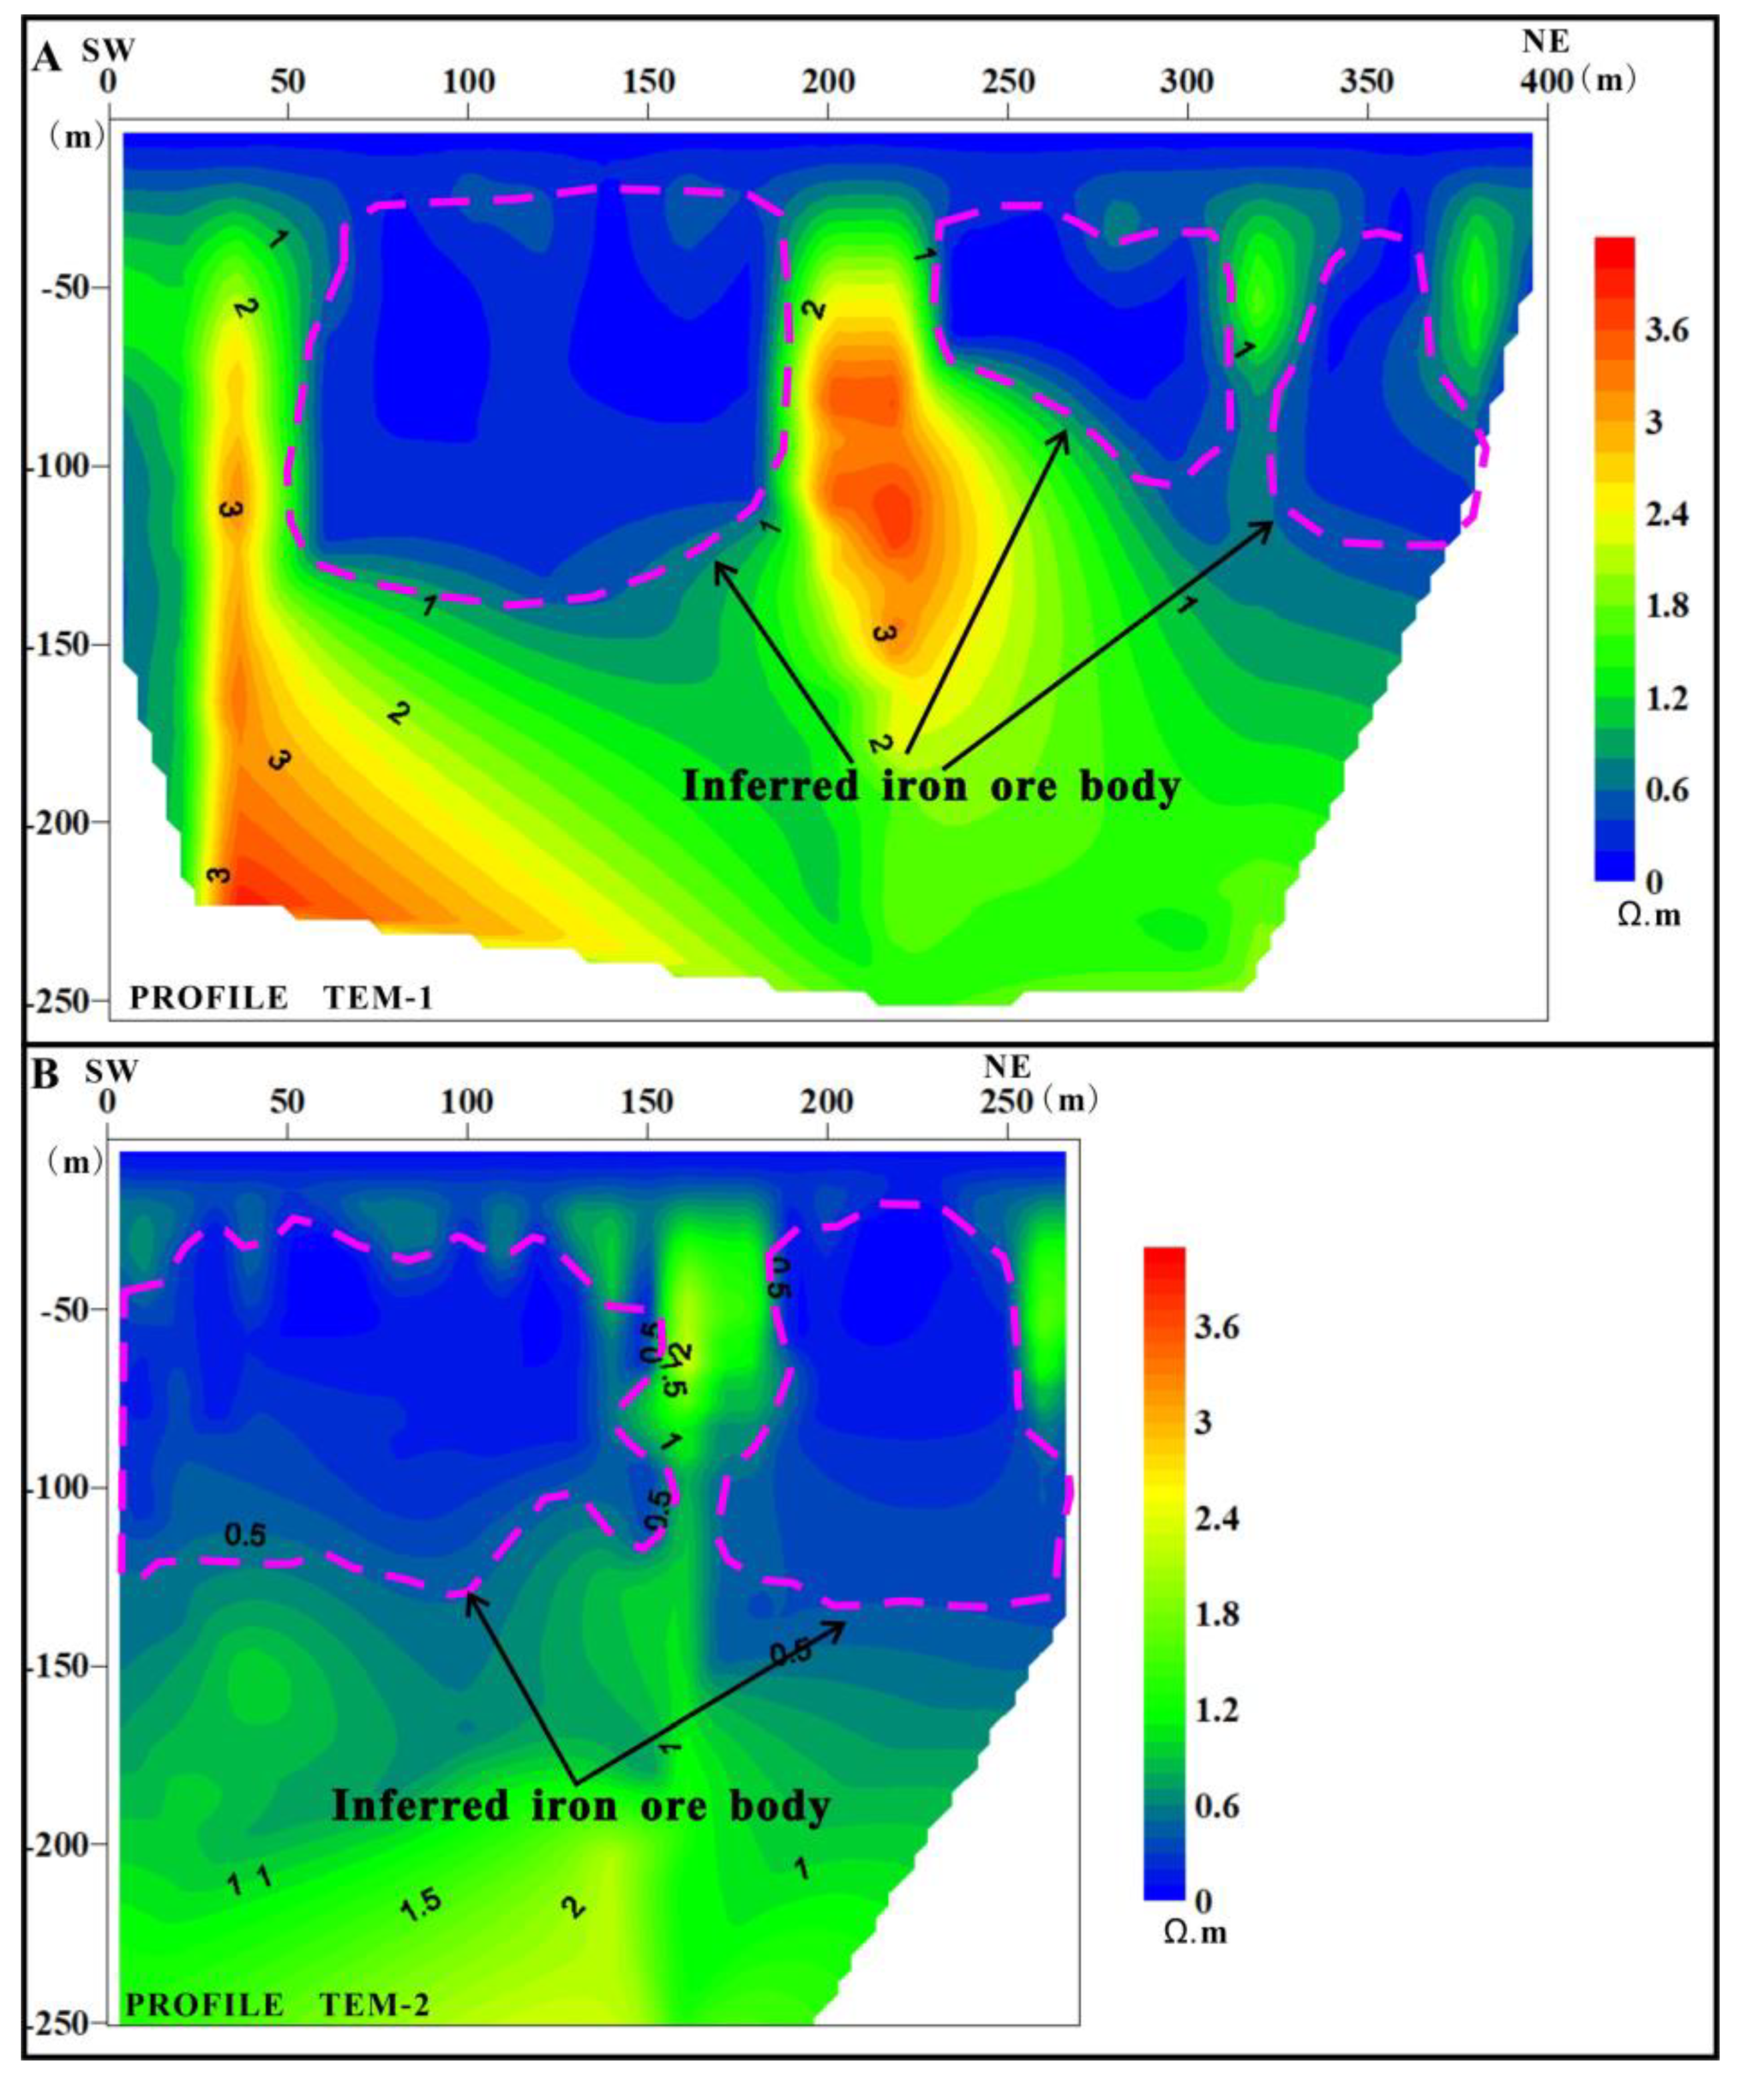
Figure 5B shows the arrangement of the TEM survey lines.
Figure 7 shows the processed TEM data. Due to the notable turn-off-time effect of the multi-turn coincident minor loop device [
25], there is a blind detection zone at depths of 0–10 m in the shallow area. Notable low-resistivity anomaly zones (LRAZs) are present at burial depths of 0–150 m on both survey lines TEM-1 and TEM-2. The LRAZs are distributed in discontinuous, thick layers and are located within strong positive magnetic anomaly zones. According to the spatial distribution patterns of the iron ore bodies in the Hejia and Dumu iron deposits and, particularly, the sensitivity of the TEM to low-resistivity bodies [
26,
27], we can infer that the LRAZs are concealed magnetic ore bodies and that the high-resistivity anomalous bodies discontinuously distributed and intercalated within the LRAZs are wall rocks. This is primarily a result of the tectonic activity of the Hejia fault in the area.
4.3. Magnetotelluric Data
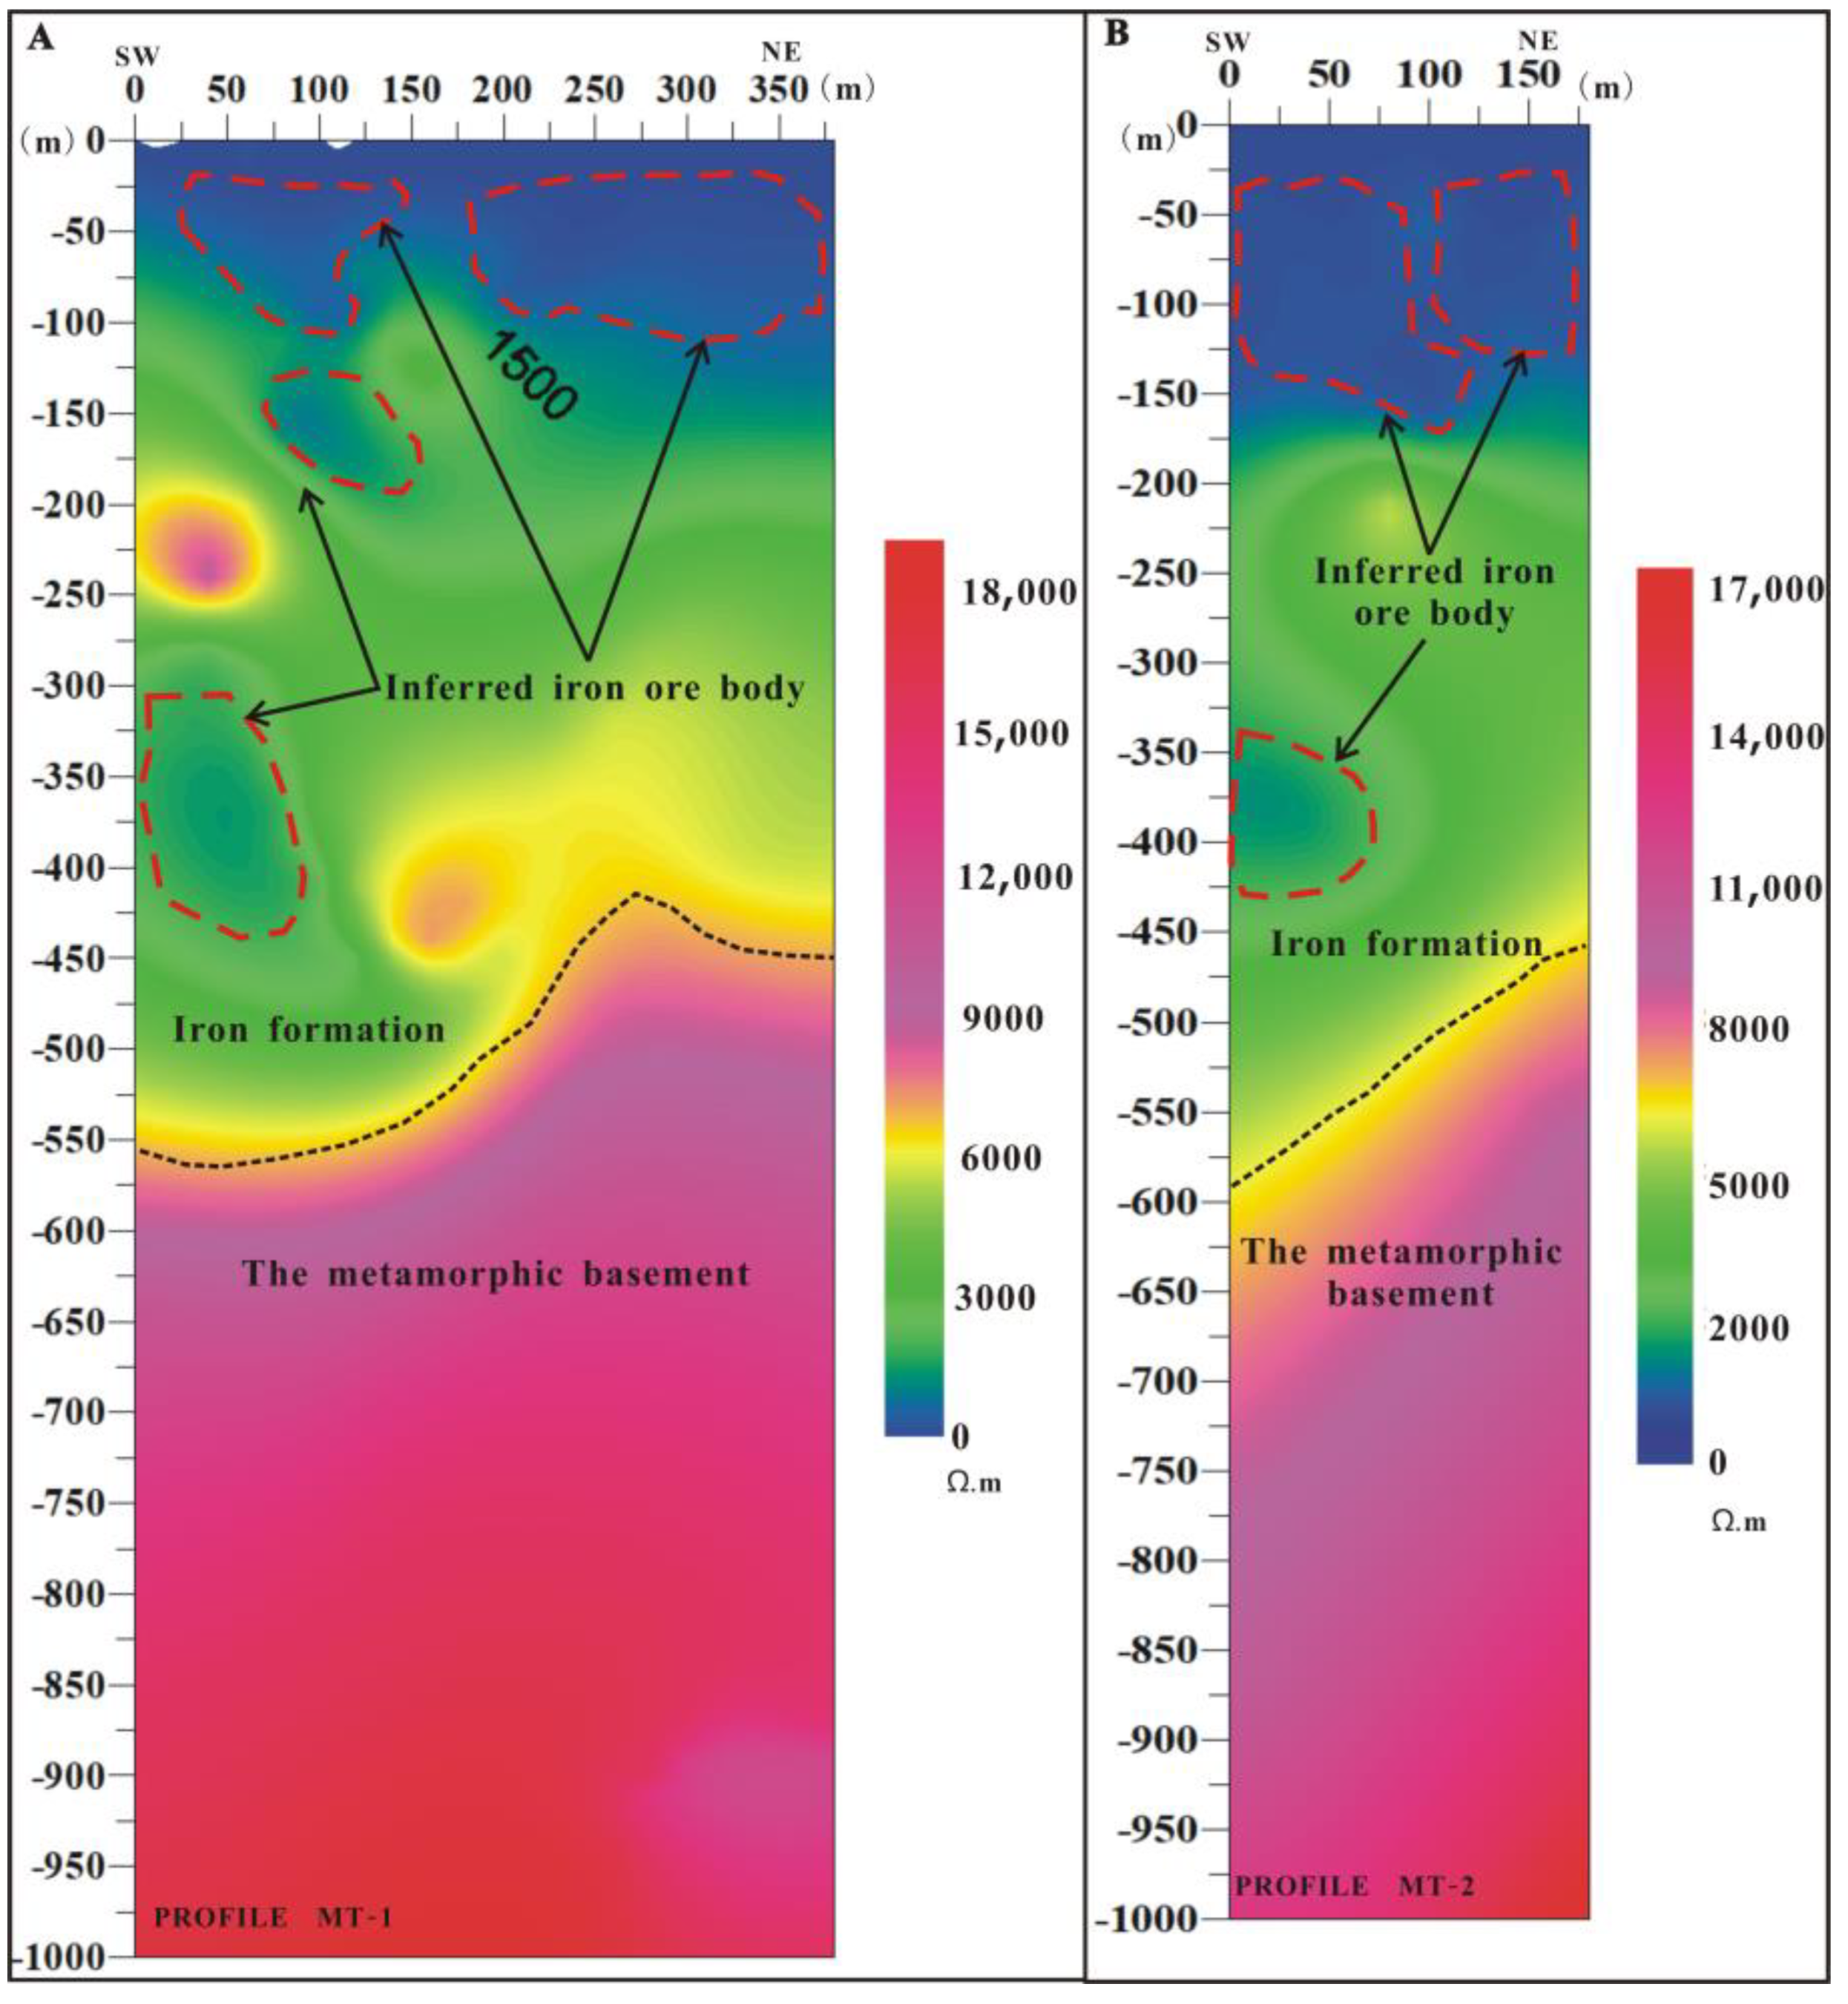
Figure 5B shows the arrangement of the MT survey lines, which were adjacent and parallel to the TEM survey lines.
Figure 8 shows the processed MT data. Compared with the TEM survey, the MT survey reached larger depths, up to 1000 m. The MT and TEM survey results both demonstrate that LRAZs are present at burial depths of 0–150 m, that they are distributed in a thick layer-like pattern, and that the deep areas of these LRAZs extend towards the north-east direction overall. Thus, we can infer that these LRAZs are concealed magnetite ore bodies. In addition, the MT survey results show that, as in the shallow area, LRAZs are present at burial depths of 300–450 m. We can infer that these LRAZs are also concealed magnetite ore bodies. However, compared with the TEM data, the MT data for the shallow area have relatively low resolution and are only able to show the outlines of the low-resistivity bodies. Nevertheless, the MT method can be used to perform geophysical surveys at greater depths. Moreover, the MT survey results show that the metamorphic basement in this area already appears at a burial depth greater than 500 m. This indirectly suggests that the thickness of the detected iron-bearing formation is 500 m.
4.4. Drilling Verification
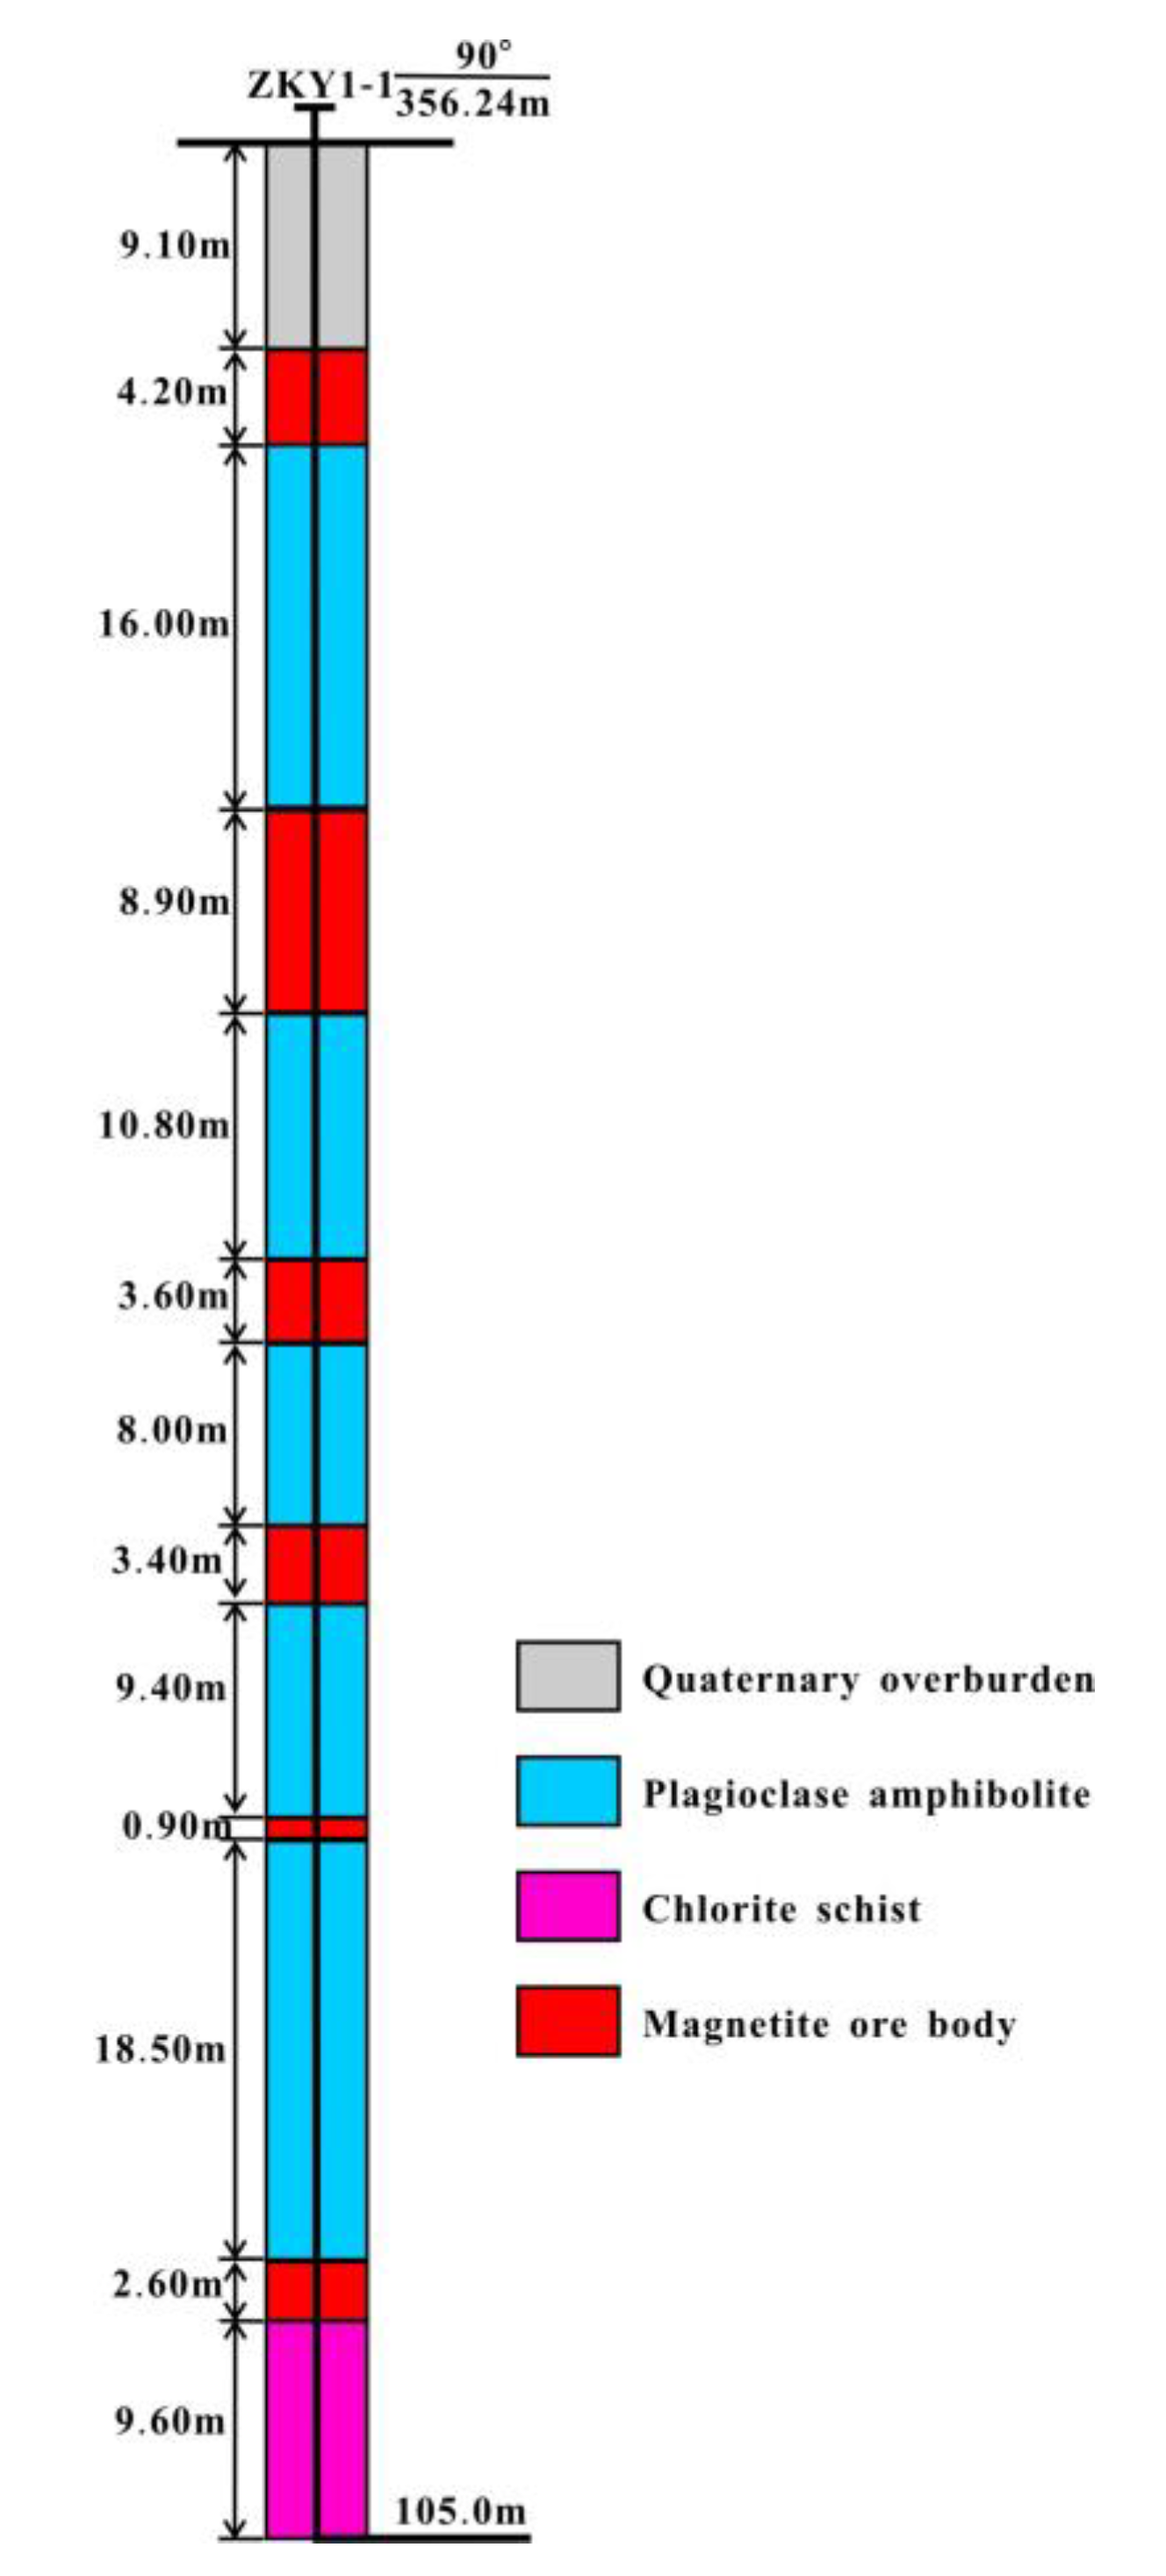
To verify the HPGMS, TEM, and MT survey results and to reduce the uncertainty in detecting concealed ore bodies, a verification borehole, ZKY1-1, was designed at 50 m on survey line TEM-2.
Figure 9 shows the borehole verification results. Clearly, indeed, there exist concealed magnetite ore bodies in zone YC-1. The minimum burial depth of the ore bodies is 9.1 m. These ore bodies are overlain by Quaternary sediments. Compared with the TEM and MT survey results, which show the presence of concealed magnetite ore bodies of an anomalous scale distributed in a single, thick layer-like pattern at depths of 0–150 m, the drilling test results show that multiple layers of magnetite ore bodies of varying thicknesses (0.9–8.9 m) are present at depths of 0–100 m and that the total thickness of the magnetite ore bodies at 0–100 m is 23.6 m.
5. Discussion
As an important geophysical survey method, the magnetic method can often be employed to scan large areas to directly find concealed deposits that contain ferromagnetic minerals, and it is extensively used to detect iron and iron polymetallic deposits and accurately determine the spatial locations of anomalous magnetic bodies [
28,
29,
30]. In particular, the HPGMS method can be employed to accurately depict the spatial planar morphology of a concealed iron body [
31]. In the magnetic method, a device close to the surface is used to take single-point, continuous scans, and therefore it is spatially closer to any anomalous magnetic bodies than devices used in other methods are. This can effectively avoid any shielding and interference from the strong magnetic fields of large deposits (e.g., Hejia and Dumu iron deposits) existing on the surface during the aeromagnetic scanning and measurement process, thereby highlighting the magnetic anomalies caused by the presence of the concealed iron ore bodies surrounding the existing iron deposits.
By taking full advantage of this quality, two sizeable, planar, concealed anomalous magnetic bodies were discovered, in this study within the transition zone CID-1 between the Hejia and Dumu iron deposits using the HPGMS method. On the basis of the HPGMS method survey results, as well as the sensitive response of the electromagnetic methods to metallic ore bodies [
32,
33], the electromagnetic methods (TEM and MT) were successfully employed, in this study, to survey the profiles of the concealed metallic ore bodies and determine their burial depths, morphologies, and scales [
34,
35,
36,
37]. The TEM and MT data collection devices, used in this study, can take single-point, continuous measurements, are adaptive to complex topographic and geomorphic environments, and can obtain high-quality geophysical survey data. The TerraTEM system was used to obtain data on shallow anomalies, while the EH4 system was employed to acquire data on deep anomalies. The data obtained on the shallow area using these two systems were cross validated. The TerraTEM system outperformed the EH4 system in survey resolution in shallow profile sections, whereas the EH4 system outperformed the TerraTEM system in survey depth. When used in close coordination, the TerraTEM and EH4 system can satisfactorily locate anomalous bodies caused by mineralization.
Notably, the electromagnetic methods often overestimate the scale of anomalous bodies [
21,
38], particularly that of metallic ore bodies to which the electromagnetic methods are sensitive. In other words, the electromagnetic methods can effectively detect large-scale metallic ore body, but it has some limitations in accurately distinguishing specific anomalies from anomalous assemblage in current studies [
39,
40]. This quality was demonstrated by the electromagnetic survey results (TEM and MT) obtained in this study. Hence, when reasonably interpreting anomalously thick bodies detected by the electromagnetic methods based on metallogenic geological characteristics, it is necessary to set suitable verification boreholes to correct and improve the geophysical interpretations.
Importantly, the advantages of comprehensive geophysical survey methods for detecting concealed metallic ore bodies were fully availed in this study to detect concealed iron ore bodies [
15,
16]. In particular, owing to their convenience and sensitive response to anomalous bodies, the magnetic and electromagnetic survey-based devices can rapidly determine the anomalous spatial planar locations and anomalous profile distribution patterns of the concealed iron ore bodies. The MT method is advantageous for deep prospecting. For example, the MT method helped us to determine the thickness of the iron-bearing formation in the survey area, as well as the top boundary of the metamorphic basement, that is, it helped delimit the depth range of the prospecting space. The MT method can accurately evaluate the amounts of resources in an area and facilitate the verification of metallogenic theories, as well as resource planning and development. The MT method can sometimes even locate a metallogenic system [
41,
42], verify metallogenic theories, and expand the prospecting space.
6. Conclusions
An optimized combination of geophysical survey methods capable of taking single-point, continuous measurements (e.g., HPGMS, TEM, and MT methods) can be employed to accurately determine the anomalous planar spatial locations, anomalous profile morphologies, and burial depths of concealed iron ore bodies. In this study, two concealed iron ore body-induced anomalous zones, YC-1 and YC-2, were discovered using the HPGMS method within the transition zone CID-1 between the Hejia and Dumu iron deposits. Two concealed iron-bearing zones (a shallow zone and a deep zone) were found within the anomalous zone selected for investigation (YC-1) using the TEM and MT methods. The shallow and deep iron-bearing zones are buried at depths of 0–150 and 300–450 m, respectively. A 100 m scale drilling test confirmed the presence of multiple layers of iron ore bodies in the shallow iron-bearing zone. The cumulative thickness of these iron ore bodies is over 23.6 m.


