Exploring the End-Liner Forces Using DEM Software


1
Institute of the Development of Energy for African Sustainability (IDEAS), Research Centre of the University of South Africa (UNISA), Florida Campus, Private Bag X6, Johannesburg 1710, South Africa
2
School of Chemical and Metallurgical Engineering, University of the Witwatersrand, Johannesburg 2050, South Africa
*
Author to whom correspondence should be addressed.
Minerals 2020, 10(12), 1047; https://doi.org/10.3390/min10121047
Submission received: 6 October 2020
/
Revised: 10 November 2020
/
Accepted: 12 November 2020
/
Published: 24 November 2020
(This article belongs to the Special Issue Simulation Using the Discrete Element Method (DEM) in the Minerals Industry)
Abstract
:The main roles of liners are to protect the mill shell and promote effective ball motion for grinding. For this reason the liner profile is carefully selected to ensure that the productivity is maximized and due liner replacement is made when this objective is no longer met. These issues have been extensively studied on shell liners as mill relining is a significant cost component of ball milling. To date, not much has been written about end-liners and the kind of forces they are subjected to. A discrete element method (DEM) simulation scheme is conducted to look at how ball size distribution, mill filling, end-liner configuration and shape affect the distribution of forces acting on the liners that were assessed to understand end-liner wear and damage. The results showed how forces varied both radially and tangentially for the different sections of end-liner, with important insights drawn for end-liner manufactures.
1. Introduction
The main roles of liners are to protect the mill shell and promote effective ball motion for grinding. For this reason, the liner profile is carefully selected to ensure that the productivity is maximized and due liner replacement is made when this objective is no longer met. The selection of liner profiles is determined by their ability to: protect the mill shell, facilitate energy transfer to the charge, retain grinding media and expedite transportation of material from the mill [1]. Thus, when designing the liner profiles these factors have to be put into consideration, lest liners would require frequent replacement and milling availability be compromised. Replacement of broken and worn out liners have largely been linked to major shut downs which in turn negatively influences mill availability [2].
Due to the strong influence of liner profiles on the availability and performance of comminution devices, considerable effort has been made to improve their design [2], focusing particularly on their process aspects and impacts on mill performance. From the wealth of research conducted so far about liner profiles, insightful information is drawn. For instance, face angles of liners were found to be linked to ball trajectories which in turn influence the point of impact in the ball mill, whilst the spaces between liners affect mill performance through their influence on the charge lifting rate [3].
The discrete element method (DEM) also has its fair share of contribution towards mill liner design. DEM is an advanced computational tool that has been around for some four decades, since it was officially introduced by Cundall and Struck [4] in soil mechanics. About a decade later, it was adapted to milling by Mishra and Rajamani [5]. The ins and outs of this computational tool have been well documented in many subsequent papers [6,7,8] that have demonstrated its extensive applicability to a variety of mineral processing problems. Milling remains a major application area.
Some researchers have utilized this advanced computing tool to describe the motion of charge and the interaction between liners, mill charge motion and mill power draft [9,10,11,12,13,14]. Others have focused on the role of shell liners in facilitating appropriate load dynamics and the resultant effect on the liners [15,16,17]. Using the same tool, Cleary [18] predicted liner wear and collisional force distributions for a range of mill conditions, among other parameters and managed to estimate the life spans of liners. Cleary [6] further notes that the life span of the mill liners could be extended by reducing peak wear rates.
The researchers among others cited above show that although not exhaustive, significant ground has been covered for shell liners, and their study is well established. Nonetheless, for end liners, not much has been written to date though they are believed to have a strong influence on the pressure drop along the mill length [2] as well as the mill availability and grinding efficiency. They have not been given adequate attention which makes them largely sparse in literature. On this account, the DEM computational tool was used to investigate the forces that are experienced by end-liners relative to their location. This work thus specifically investigates how end-liners are affected by ball collisions during the milling process considering that direct impact forces on mill shell liners by cataracting balls can cause damage. This is pertinent to the manufacturers of end-liners globally since it avails information on the forces acting on the end-liners which in turn helps them to produce more wear resistant liners that increase the mill availability.
2. Materials and Methods
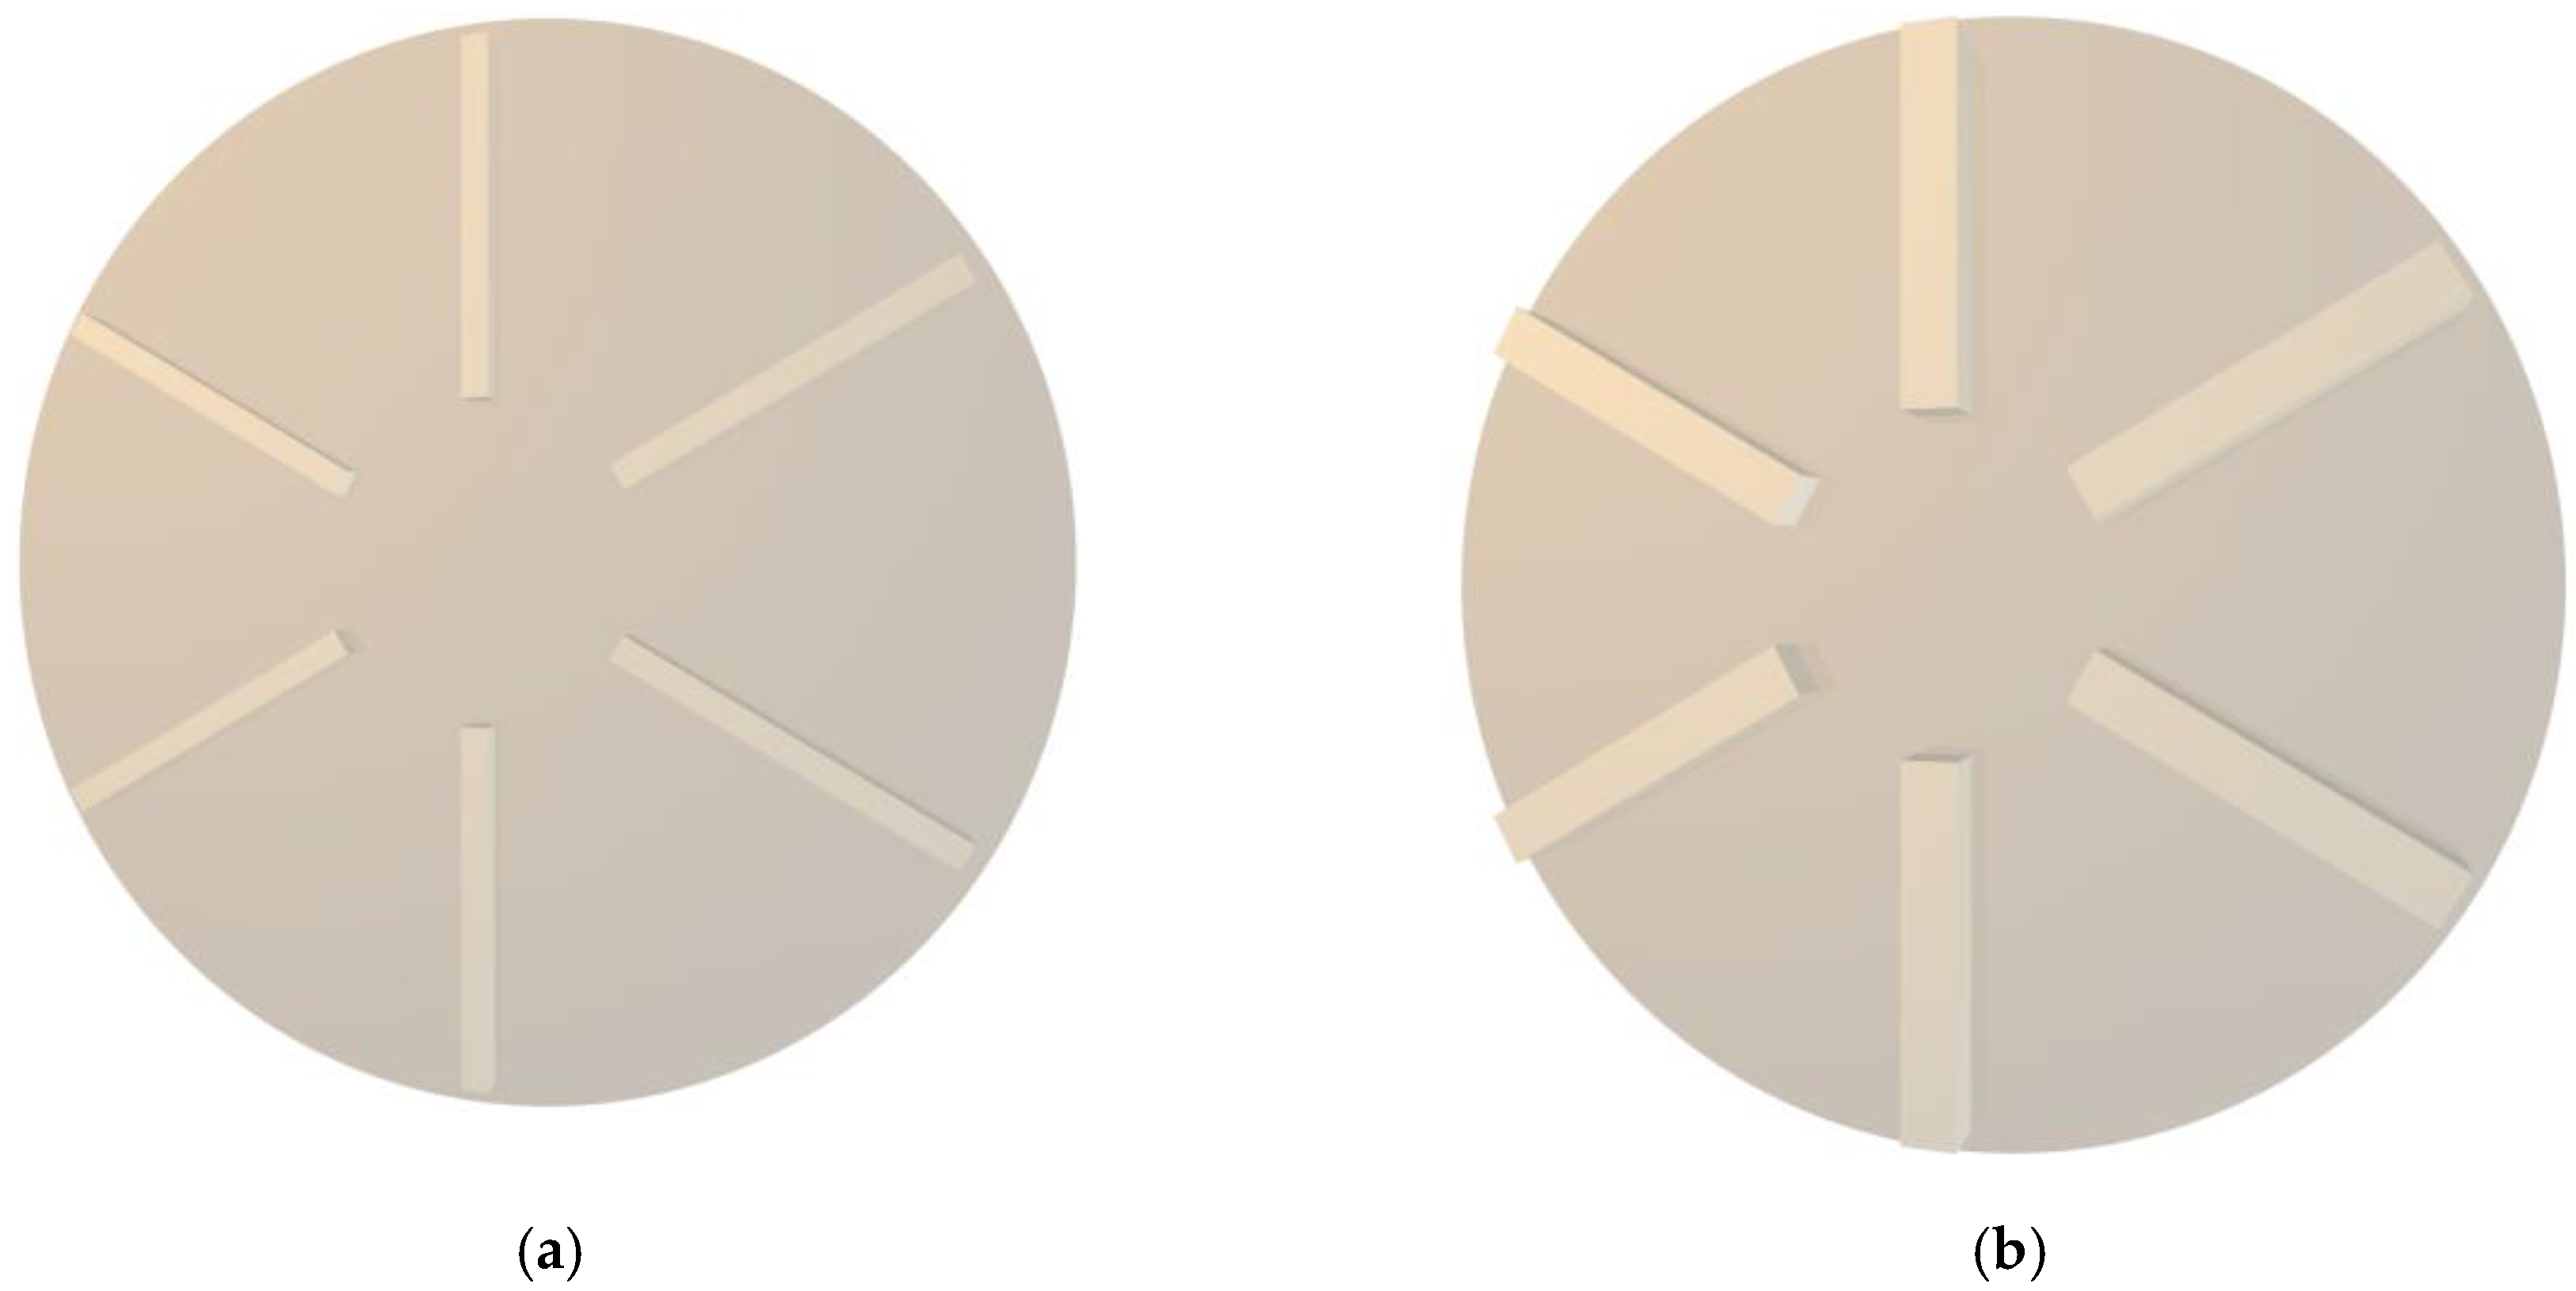
A 1 m diameter by 0.4 m long mill with 8 trapezium shell lifters and 6 square end lifters as shown in Figure 1 below was simulated. The end lifters were divided into 3 sections for the long end lifter and into 2 for the short end lifters as seen in Figure 1. It must however be mentioned that there was no through flow of feed in this simulation and thus the term feed end and discharge end are not applicable.
Simulation Procedure
The DEM tool used to carry out the simulations is an in-house model scripted in Fish programming language on the Itasca-PFC Version 2 platform. The linear spring and dashpot model was applied to solve contact energy dissipations and force resolutions between the interacting elements. Navaro et al. [19] gives an in-depth discussion of the application of linear spring and dashpot model in DEM simulation and concludes that this generally gives accurate results. To enable the user to interact with the simulation, another stand-alone VB application has been developed to set-up the required simulation inputs for the PFC-based script as well as post simulation handling of the output data.
For all the simulations, the time step was set-up using the smallest particle as presented in Equation (1) [20]:
where m is the mass of the smallest and lightest particle (kg) and K is the particle normal stiffness. In our experience, it was found that a smaller time step is required when the difference between the largest and smallest particle is big, thus for our purpose, the 2π factor was replaced by 0.2. The rest of the details that were adopted as standard are summarized in Table 1 below:
The mill was simulated for 4 revolutions and during the 3rd revolution, the average forces per degree revolution acting on the indicated sections of each liner were captured for each of the six lifters. Sampling commenced in the third revolution as from previous simulations, it was observed that steady state was attained within 2 revolutions for a single ball size simulation [21]. The analysis was mostly focused on long end lifters and only highlights some results on short end lifters. The investigations are covered as follows:
- Overview of forces on shell lifters and mill end lifters
- Full analysis of forces on the 50 mm × 50 mm square end lifters at 20% ball filling
- 25 mm × 25 mm square end lifters compared with 50 mm × 50 mm square end lifters
- 40% ball filling compared with 20% ball filling
- 25 mm balls size compared with 35 mm balls size.
For the purpose of collecting data for analysis, the end lifters were divided into three sections except for the simulations involving short end lifters where only two sections were used. The forces were accumulated at each time step for each of the specified sections for each degree of mill revolution and the average was recorded for this time period. Thus, about 360 readings per lifter were recorded for a complete mill revolution. Since there were six lifters in total, six data sets were collected, but each lifter was at a different angular position on the mill end disc and thus the starting points had to be re-aligned and based on these synchronized data, the average force profiles were obtained on which the figures in the next sections are based.
3. Results and Discussion
3.1. Overview of Forces Acting on the Shell and Mill End Liners
To get an overview of the forces acting on all the types of lifters represented in the simulation: shell lifters, long end lifters and short end lifters for just one particular configuration as a base case were considered.
3.1.1. Comparison of Radial and Tangential Forces on Shell Lifters
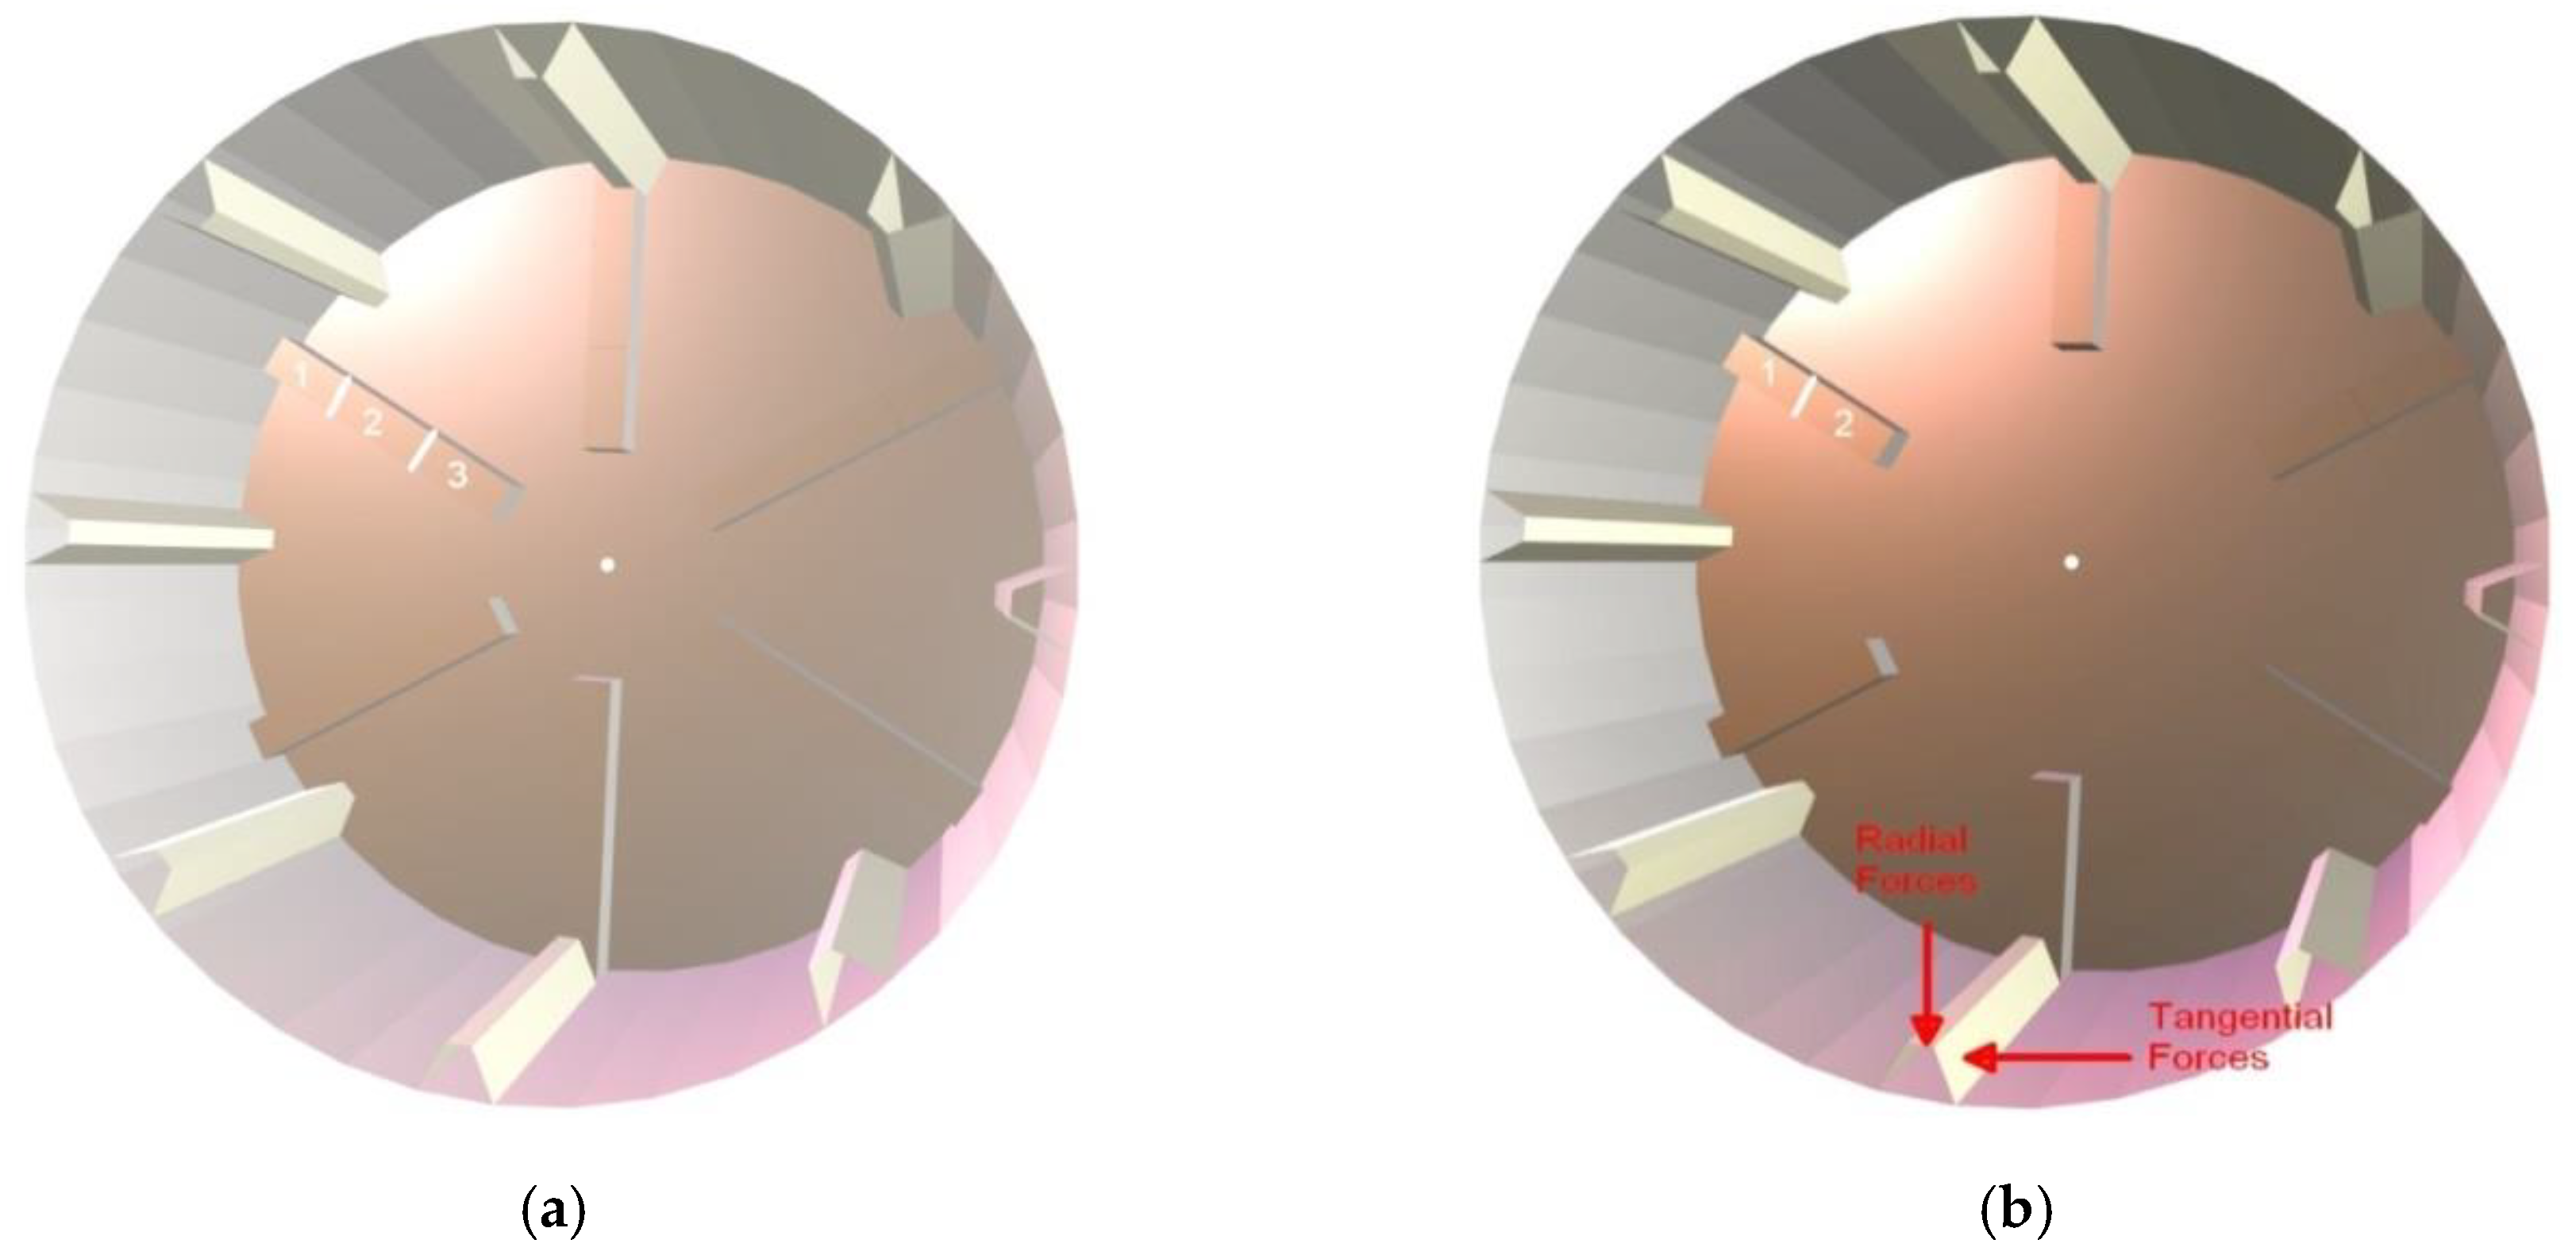
Figure 2 shows how the radial and tangential forces vary as the mill rotates from 0 to 360°. The definition of radial and tangential forces has been illustrated in Figure 1.
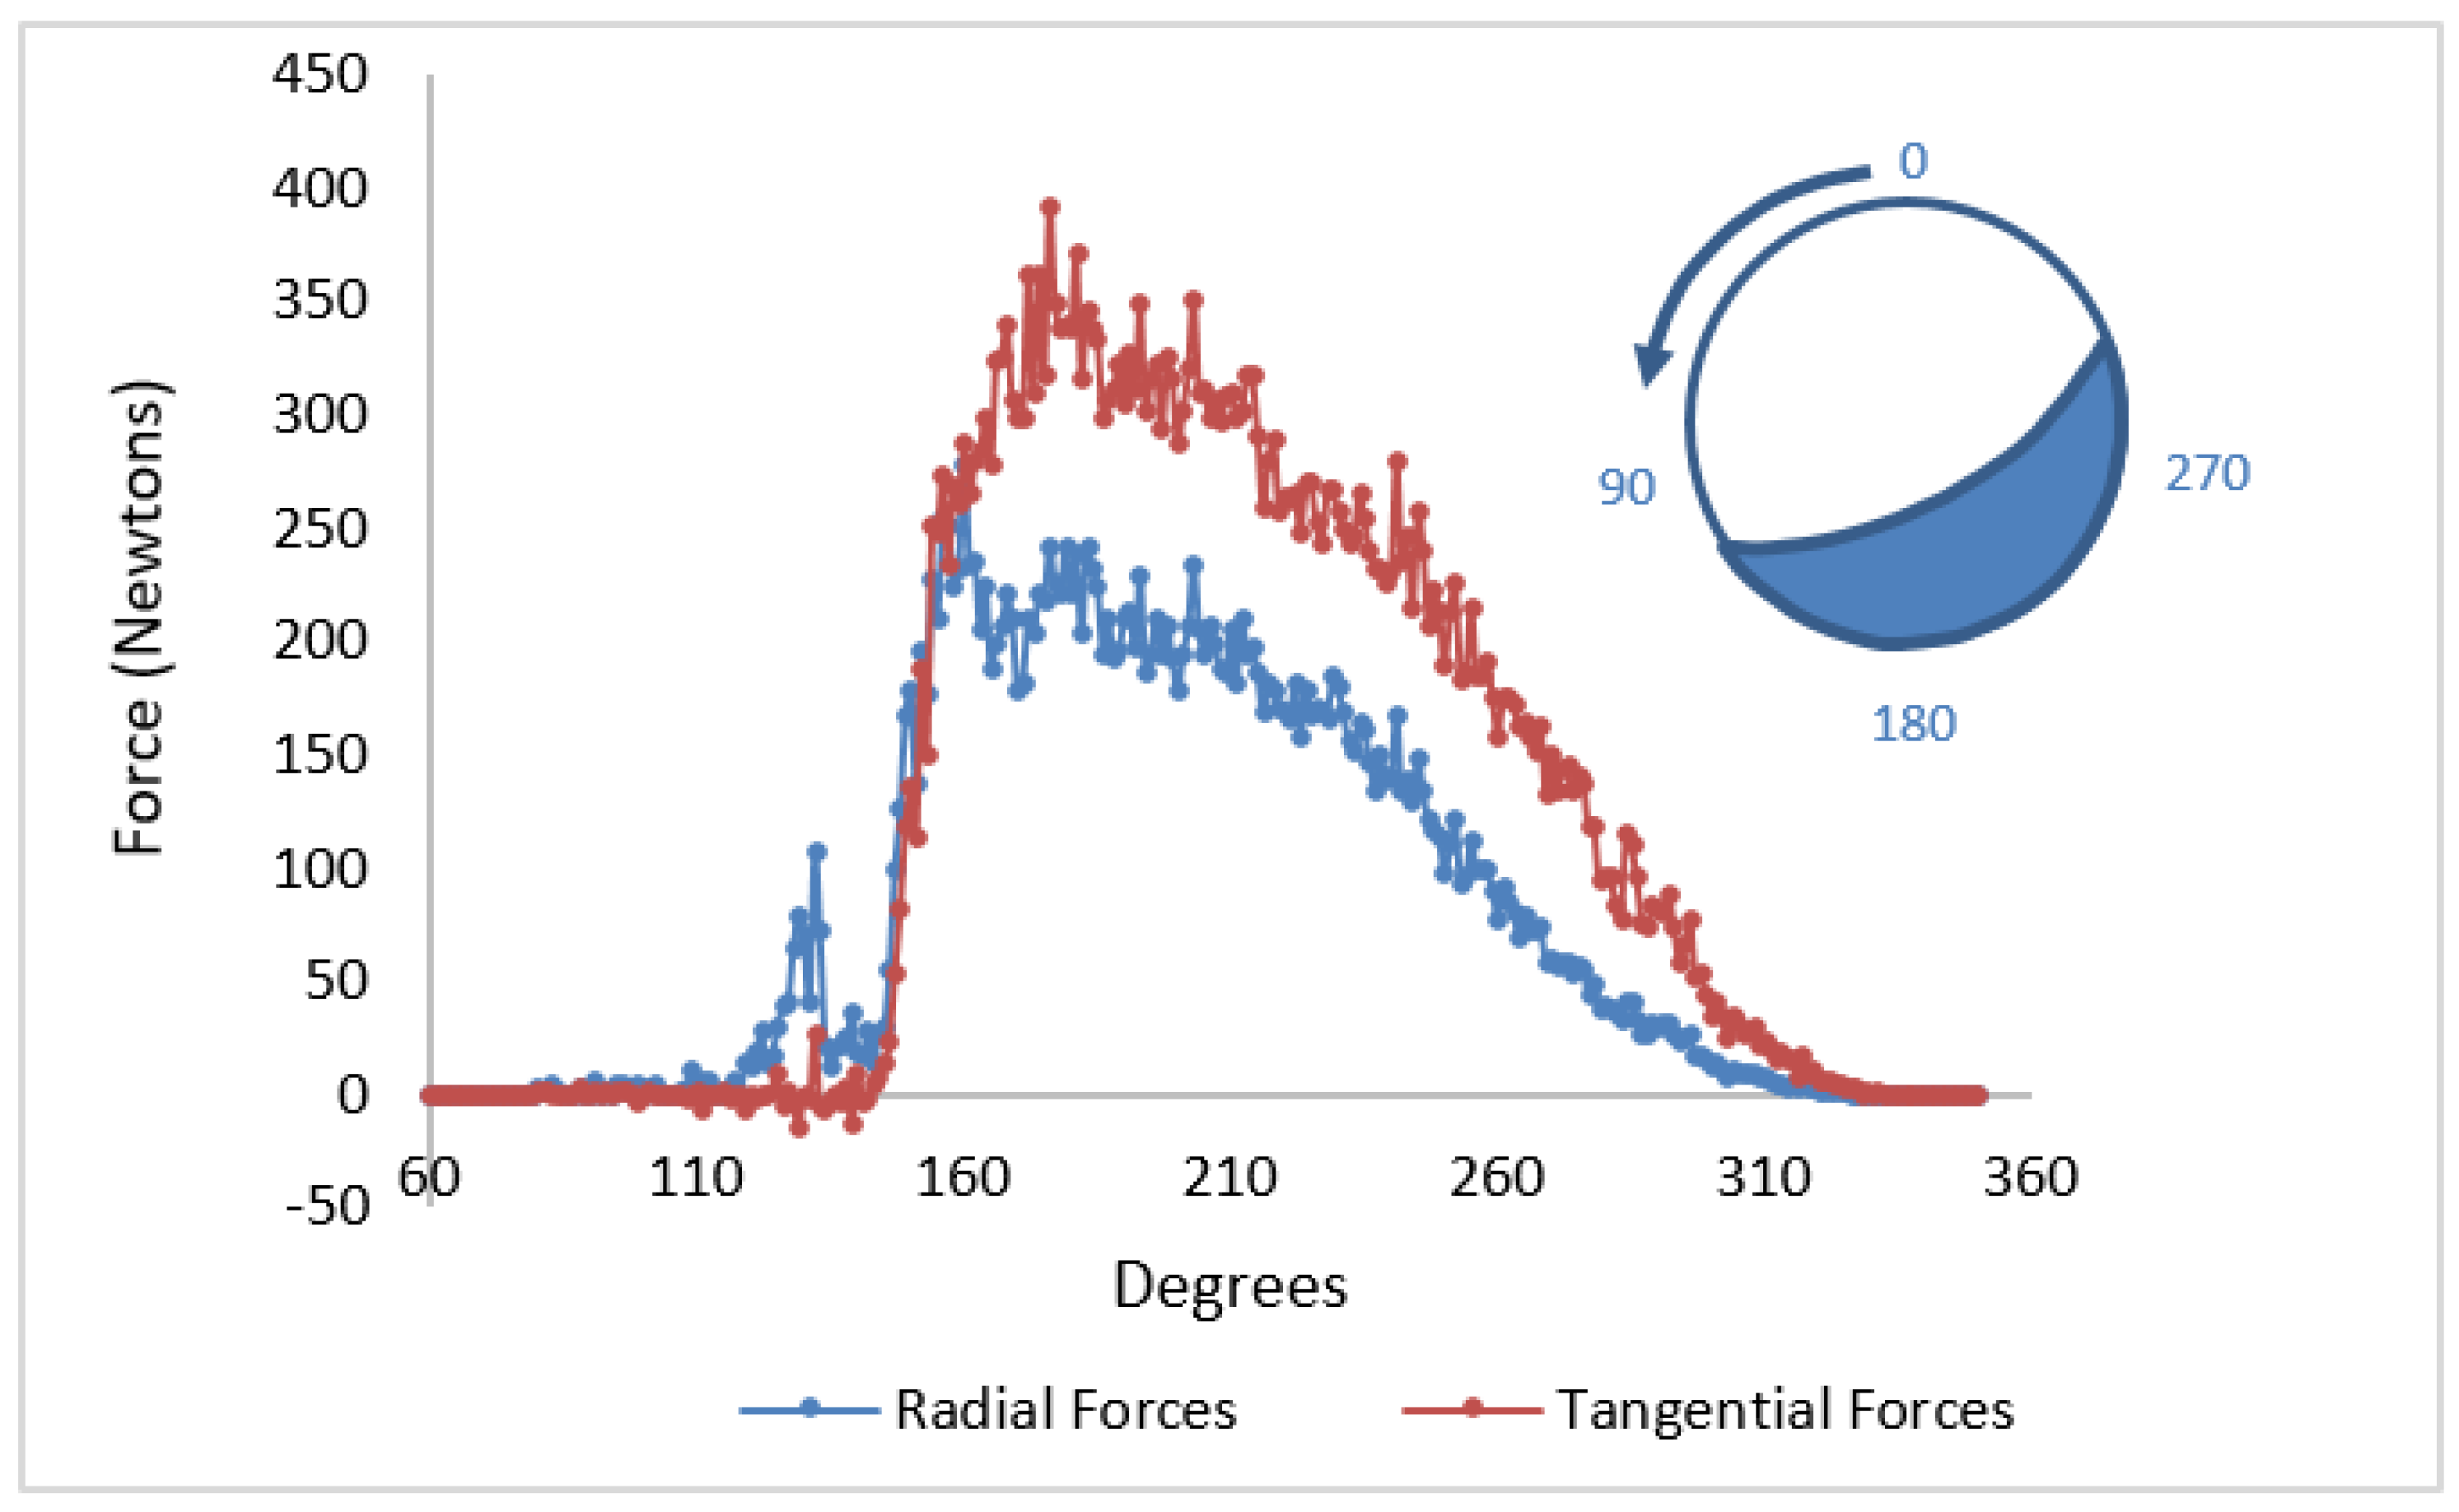
It is seen in Figure 2 that both radial and tangential forces rise quickly once the liners come under the load (at around 140°) and reaches a maximum at about 180° then decreases more gently until returning to zero at around 310–321°. This is typically what is expected [22]. As noted by Hasankhoei et al. [2], this region is the bulk region and has a crescent like shape with particles moving upwards to the shoulder region.
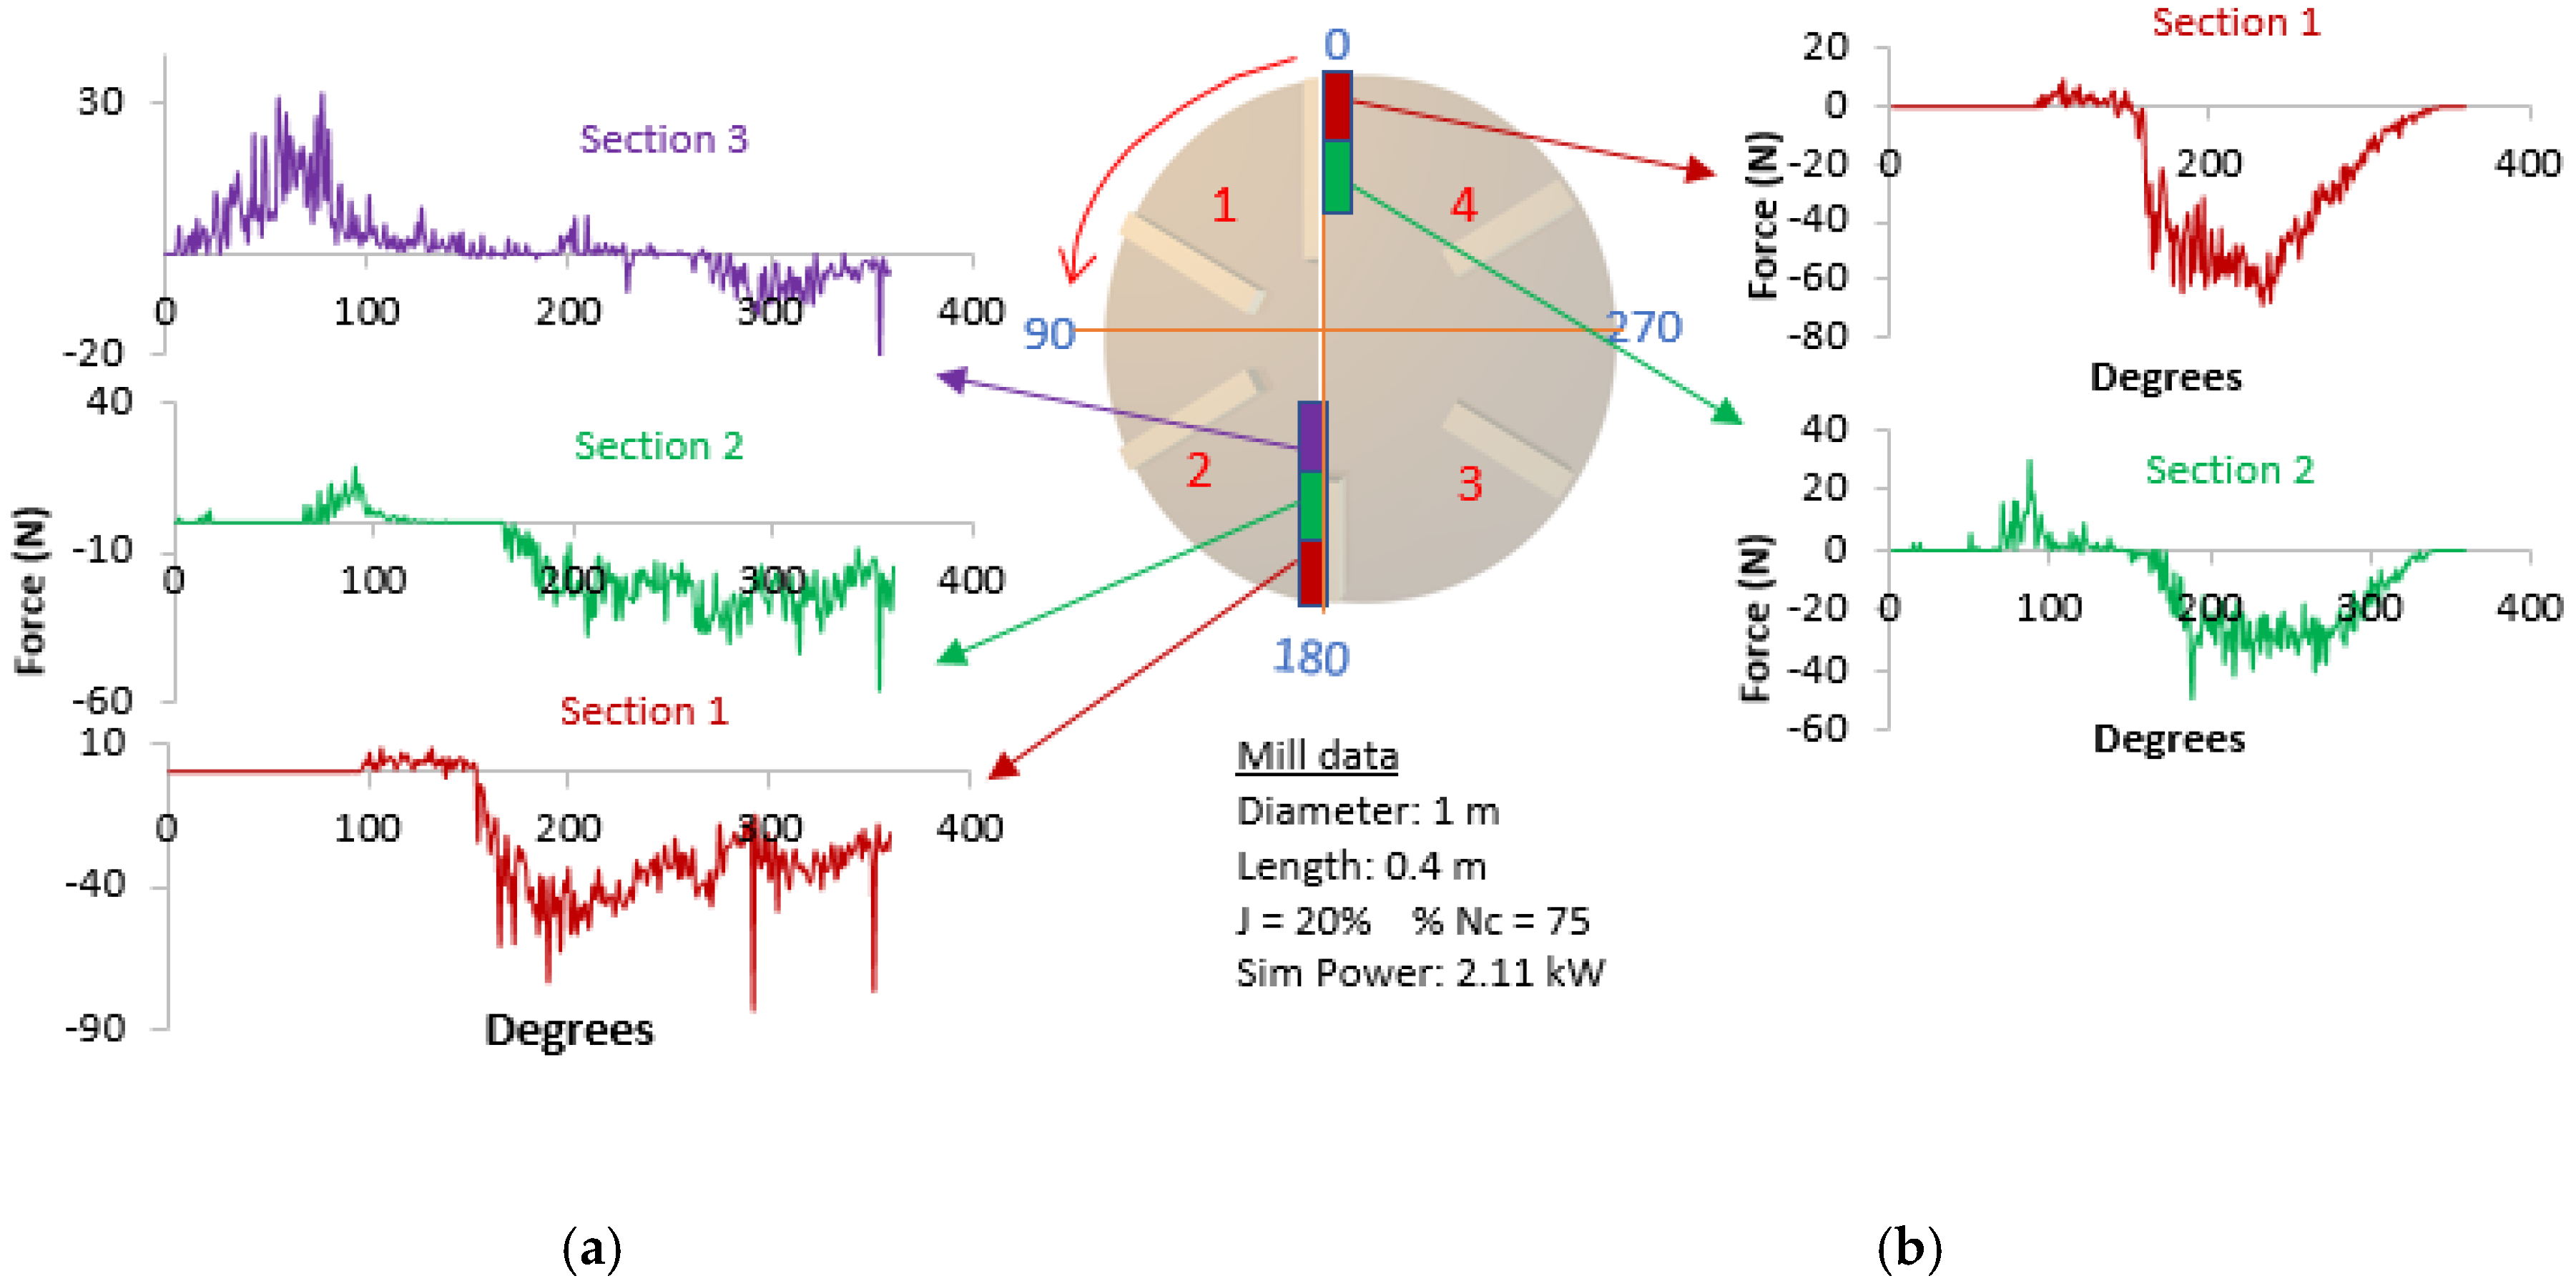
3.1.2. Radial Forces on the 3 Sections of the Long End Lifters
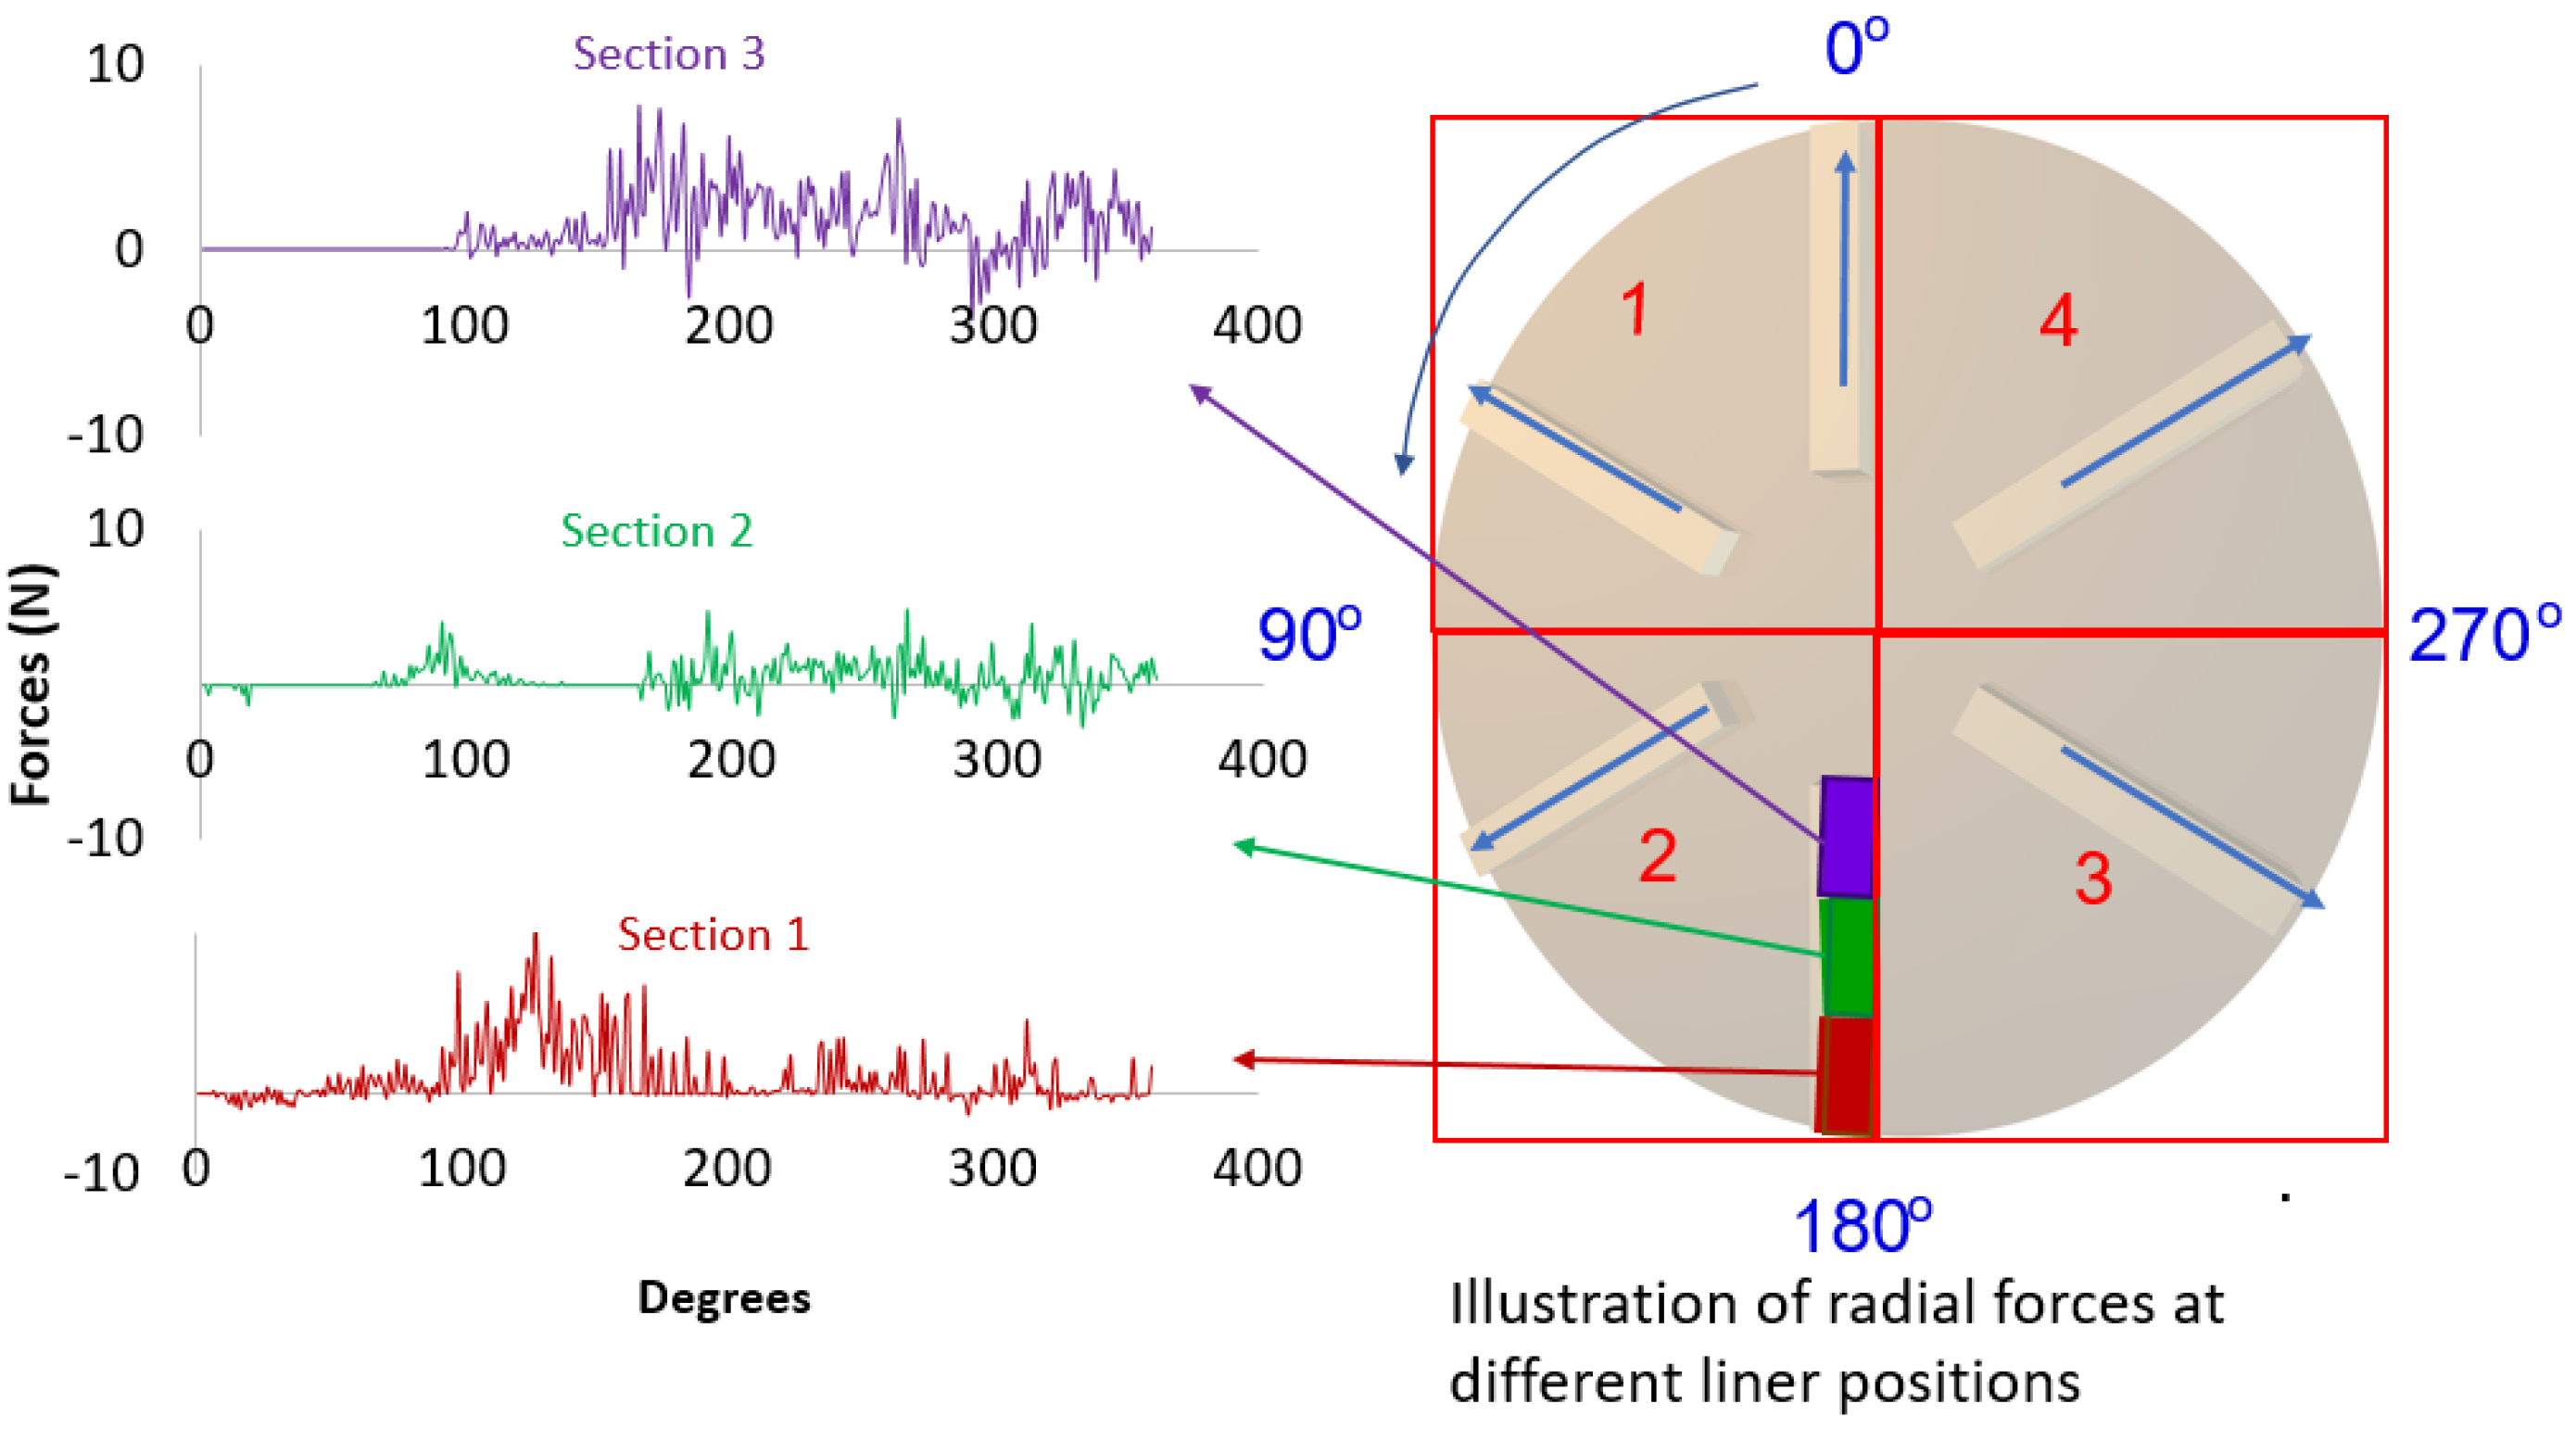
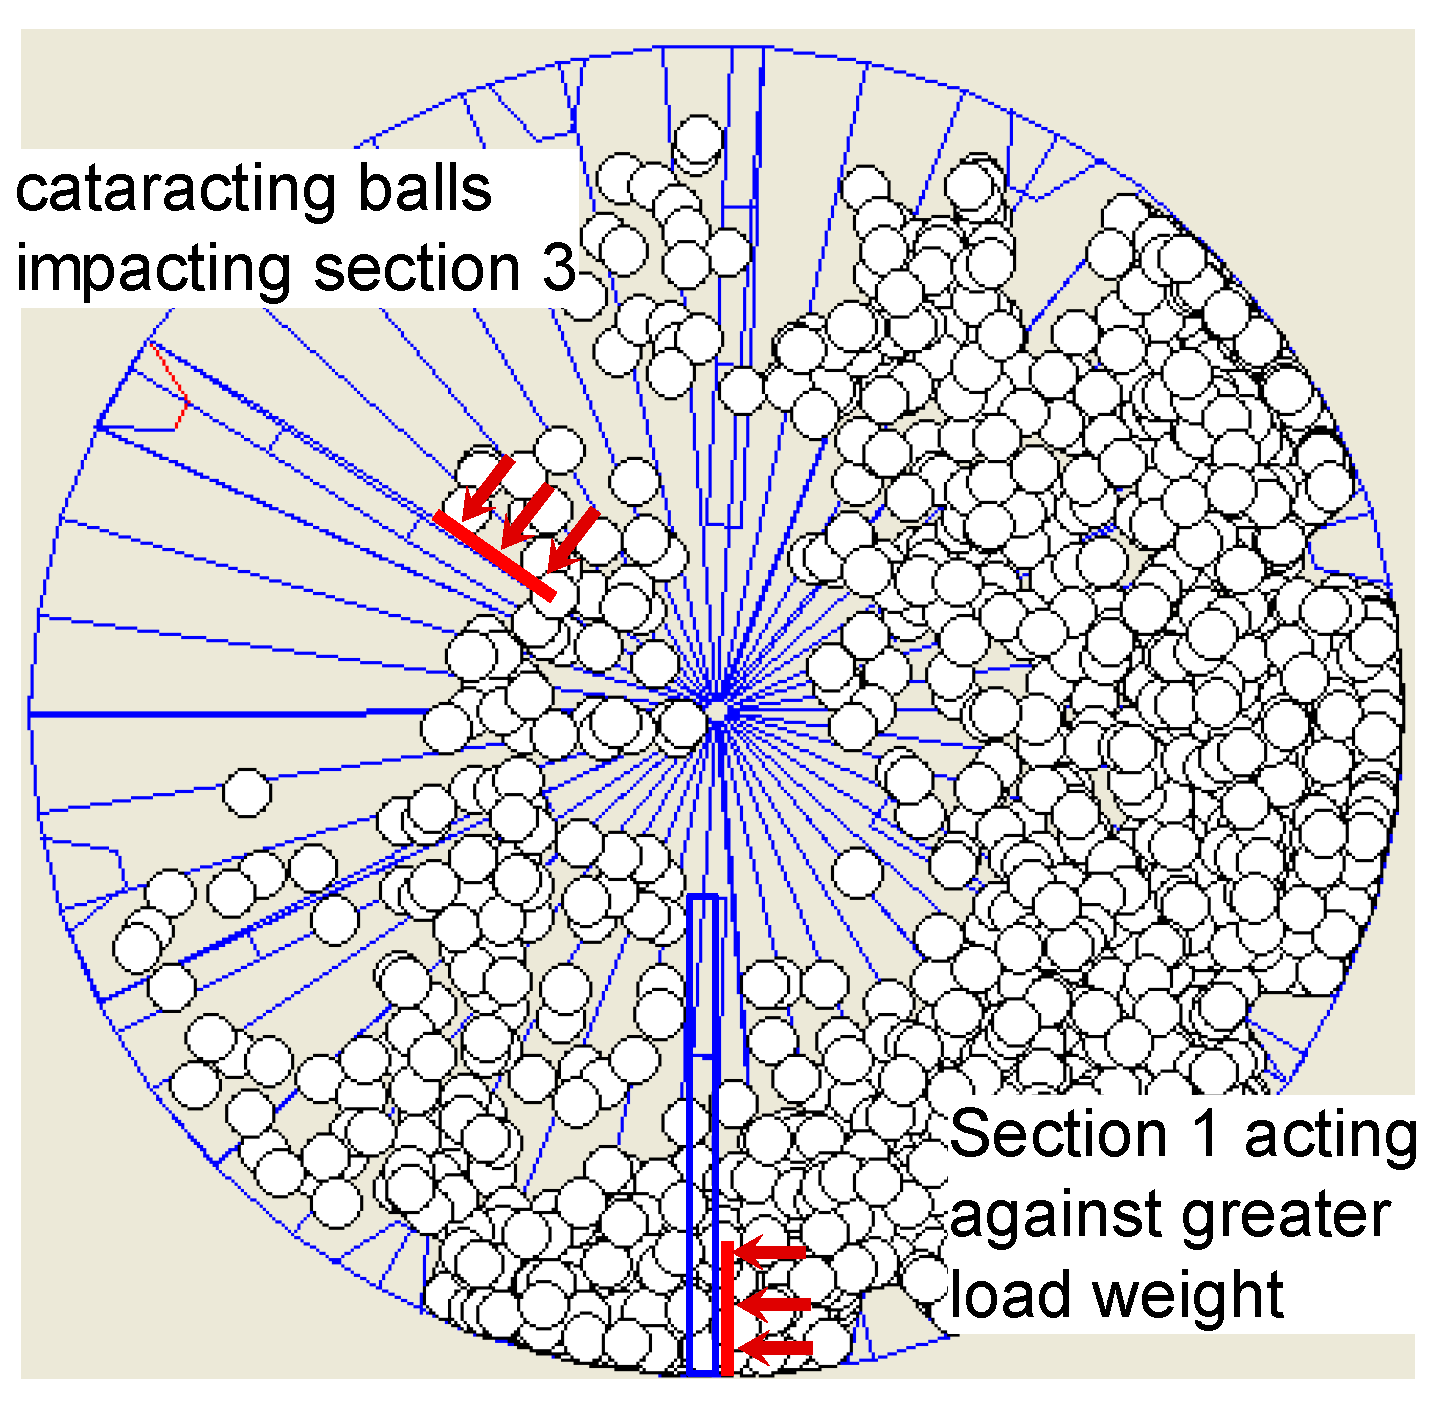
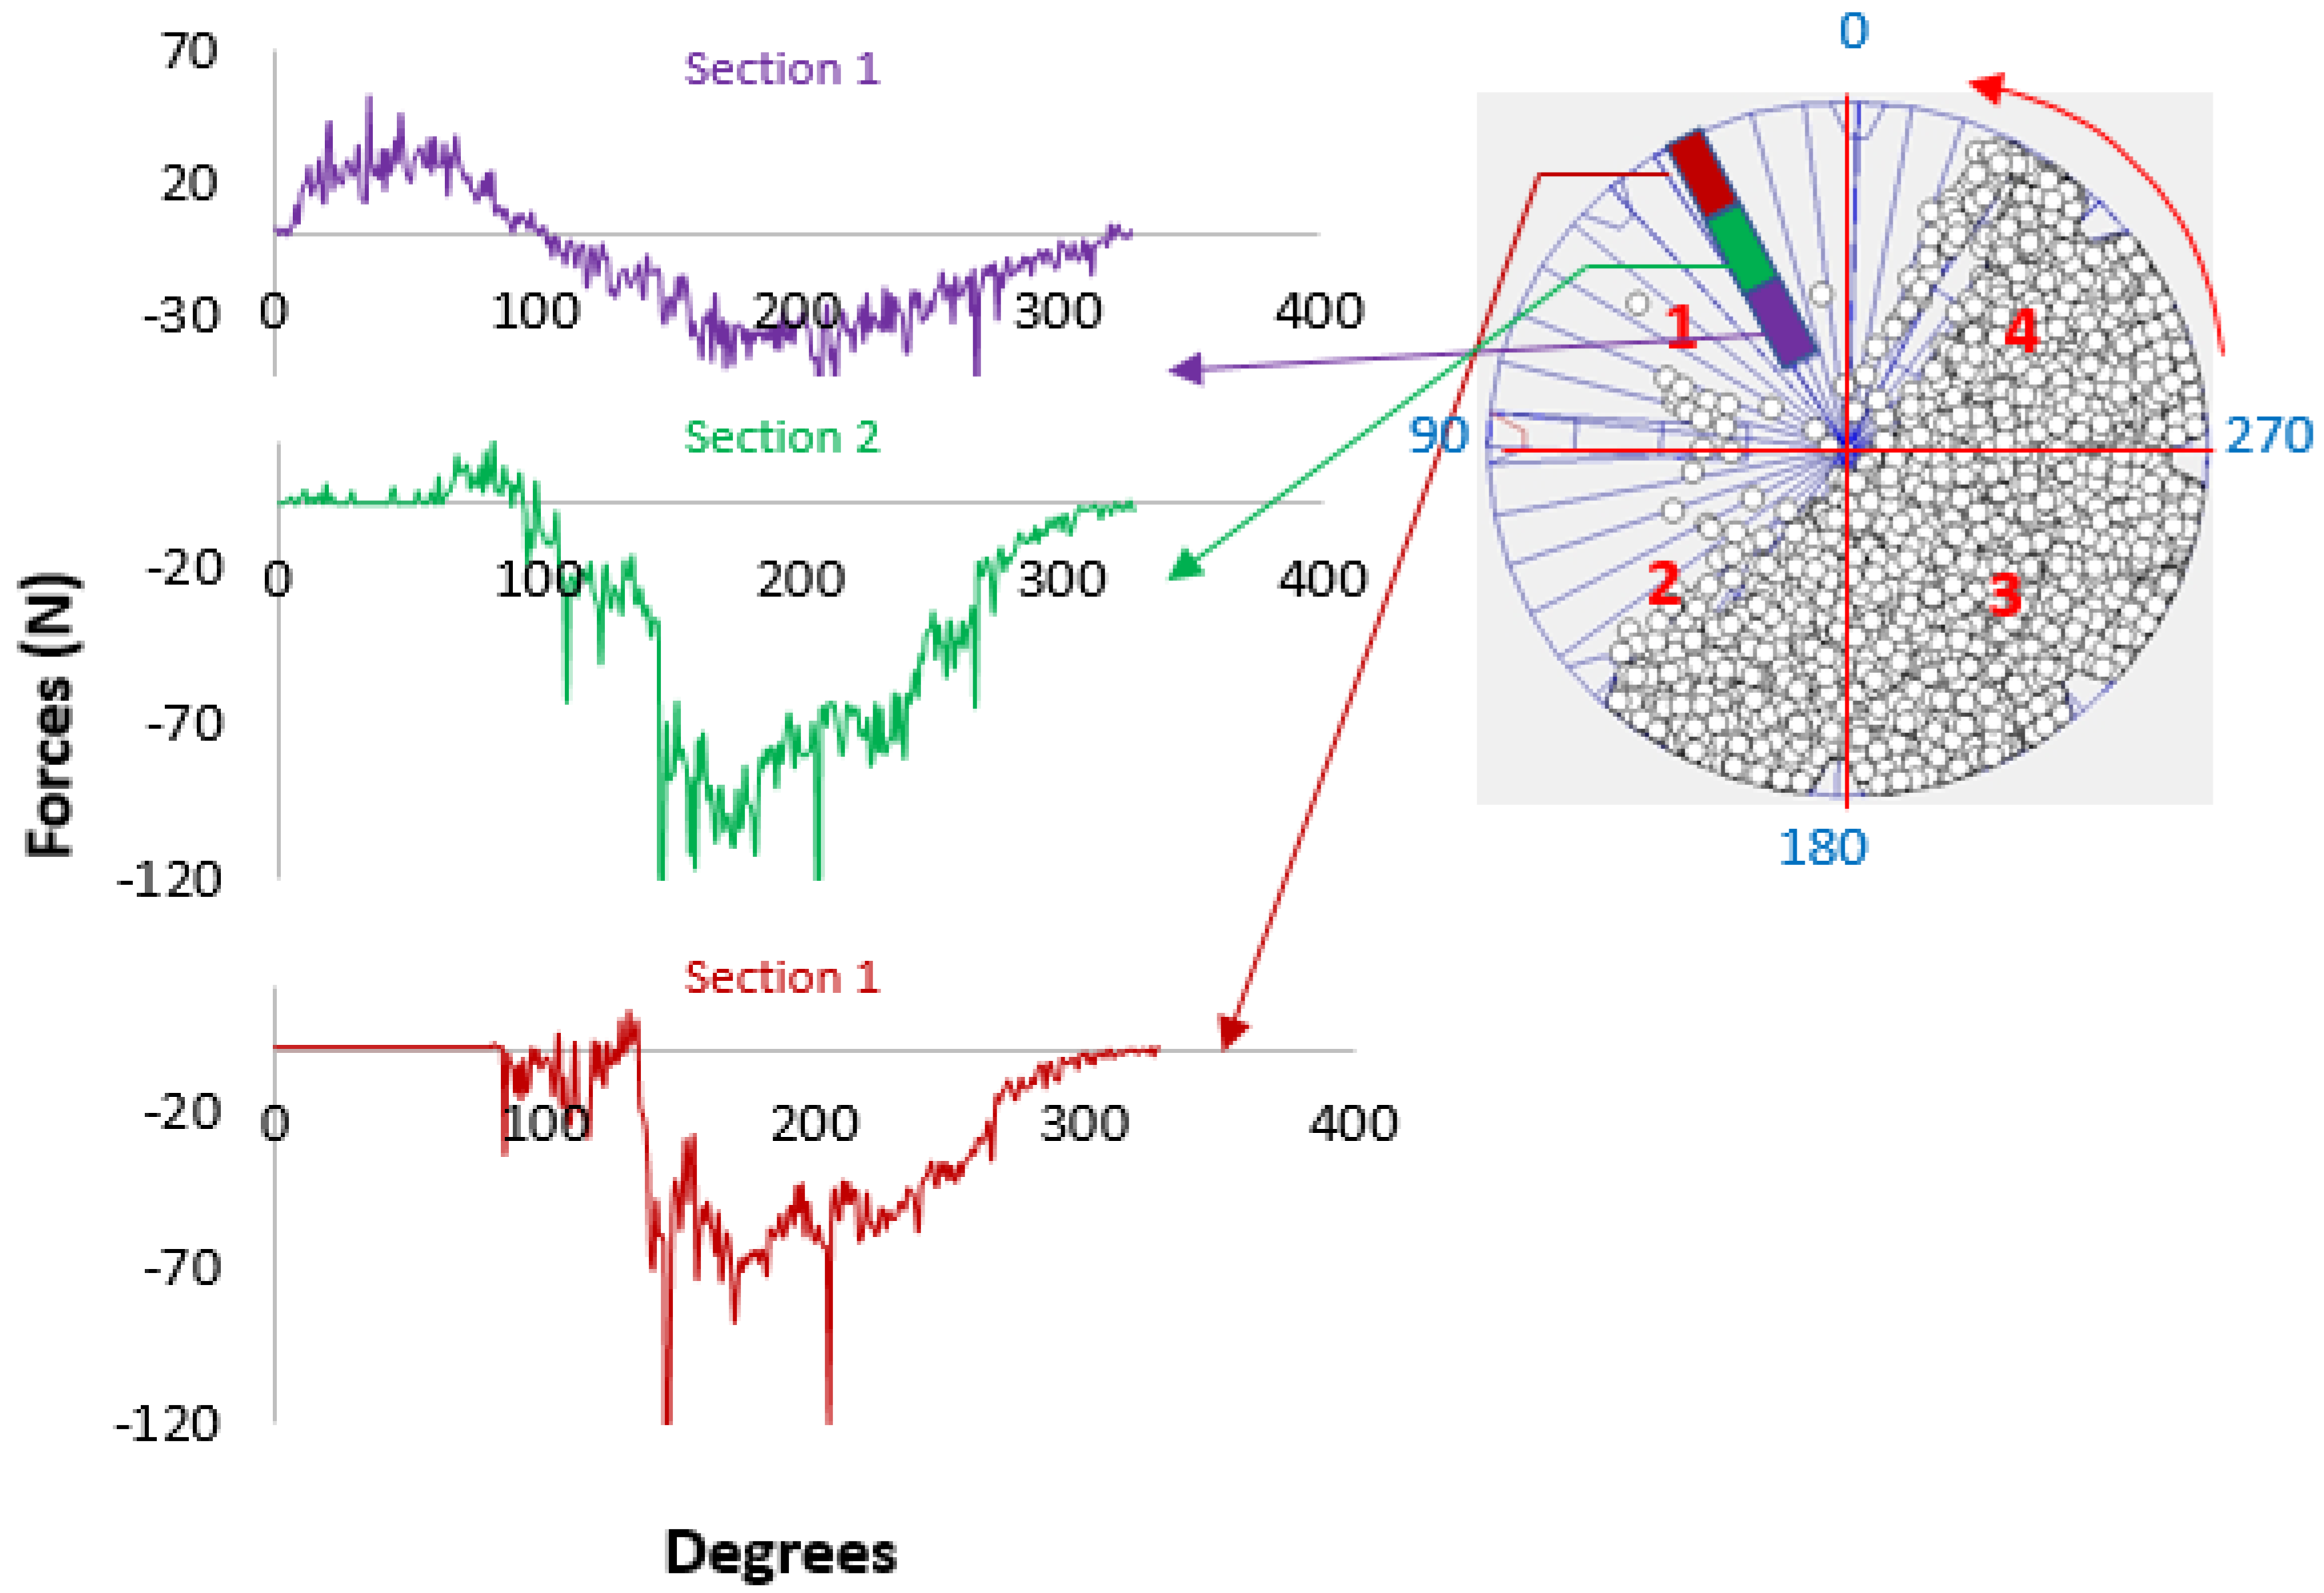
Figure 3 shows the force profiles for the three sections of the liner. The radial forces are apparently higher on the part nearest to the mill center (Section 3) but remains low throughout for the other sections.
To try and get a better understanding of this behavior, lines representing ball movements in Figure 4 were plotted. It can be seen that ball movement is more dynamic towards the mill center; hence the higher forces showing on Section 3. This is despite the fact that the charge is less compact at this point as the dynamics of the charge more than compensates for this. The same pattern as shown in Figure 4b has been observed by Hasankhoei et al. [2], when they displayed the overall pattern of charge motion in a mill. It was also noticed for Section 3 that the forces peak at around 130° and that is believed to be the result of the direction of the falling balls relative to the mill rotation. When the forces are resolved, the radial component is more dominant between 120 and 180°, probably because of the cataracting effect of the falling charge. The cataracting effect is caused by particles thrown on high ballistic trajectories and crash on the impact toe region.
3.1.3. Comparison of Tangential Forces on the Two Mill Ends
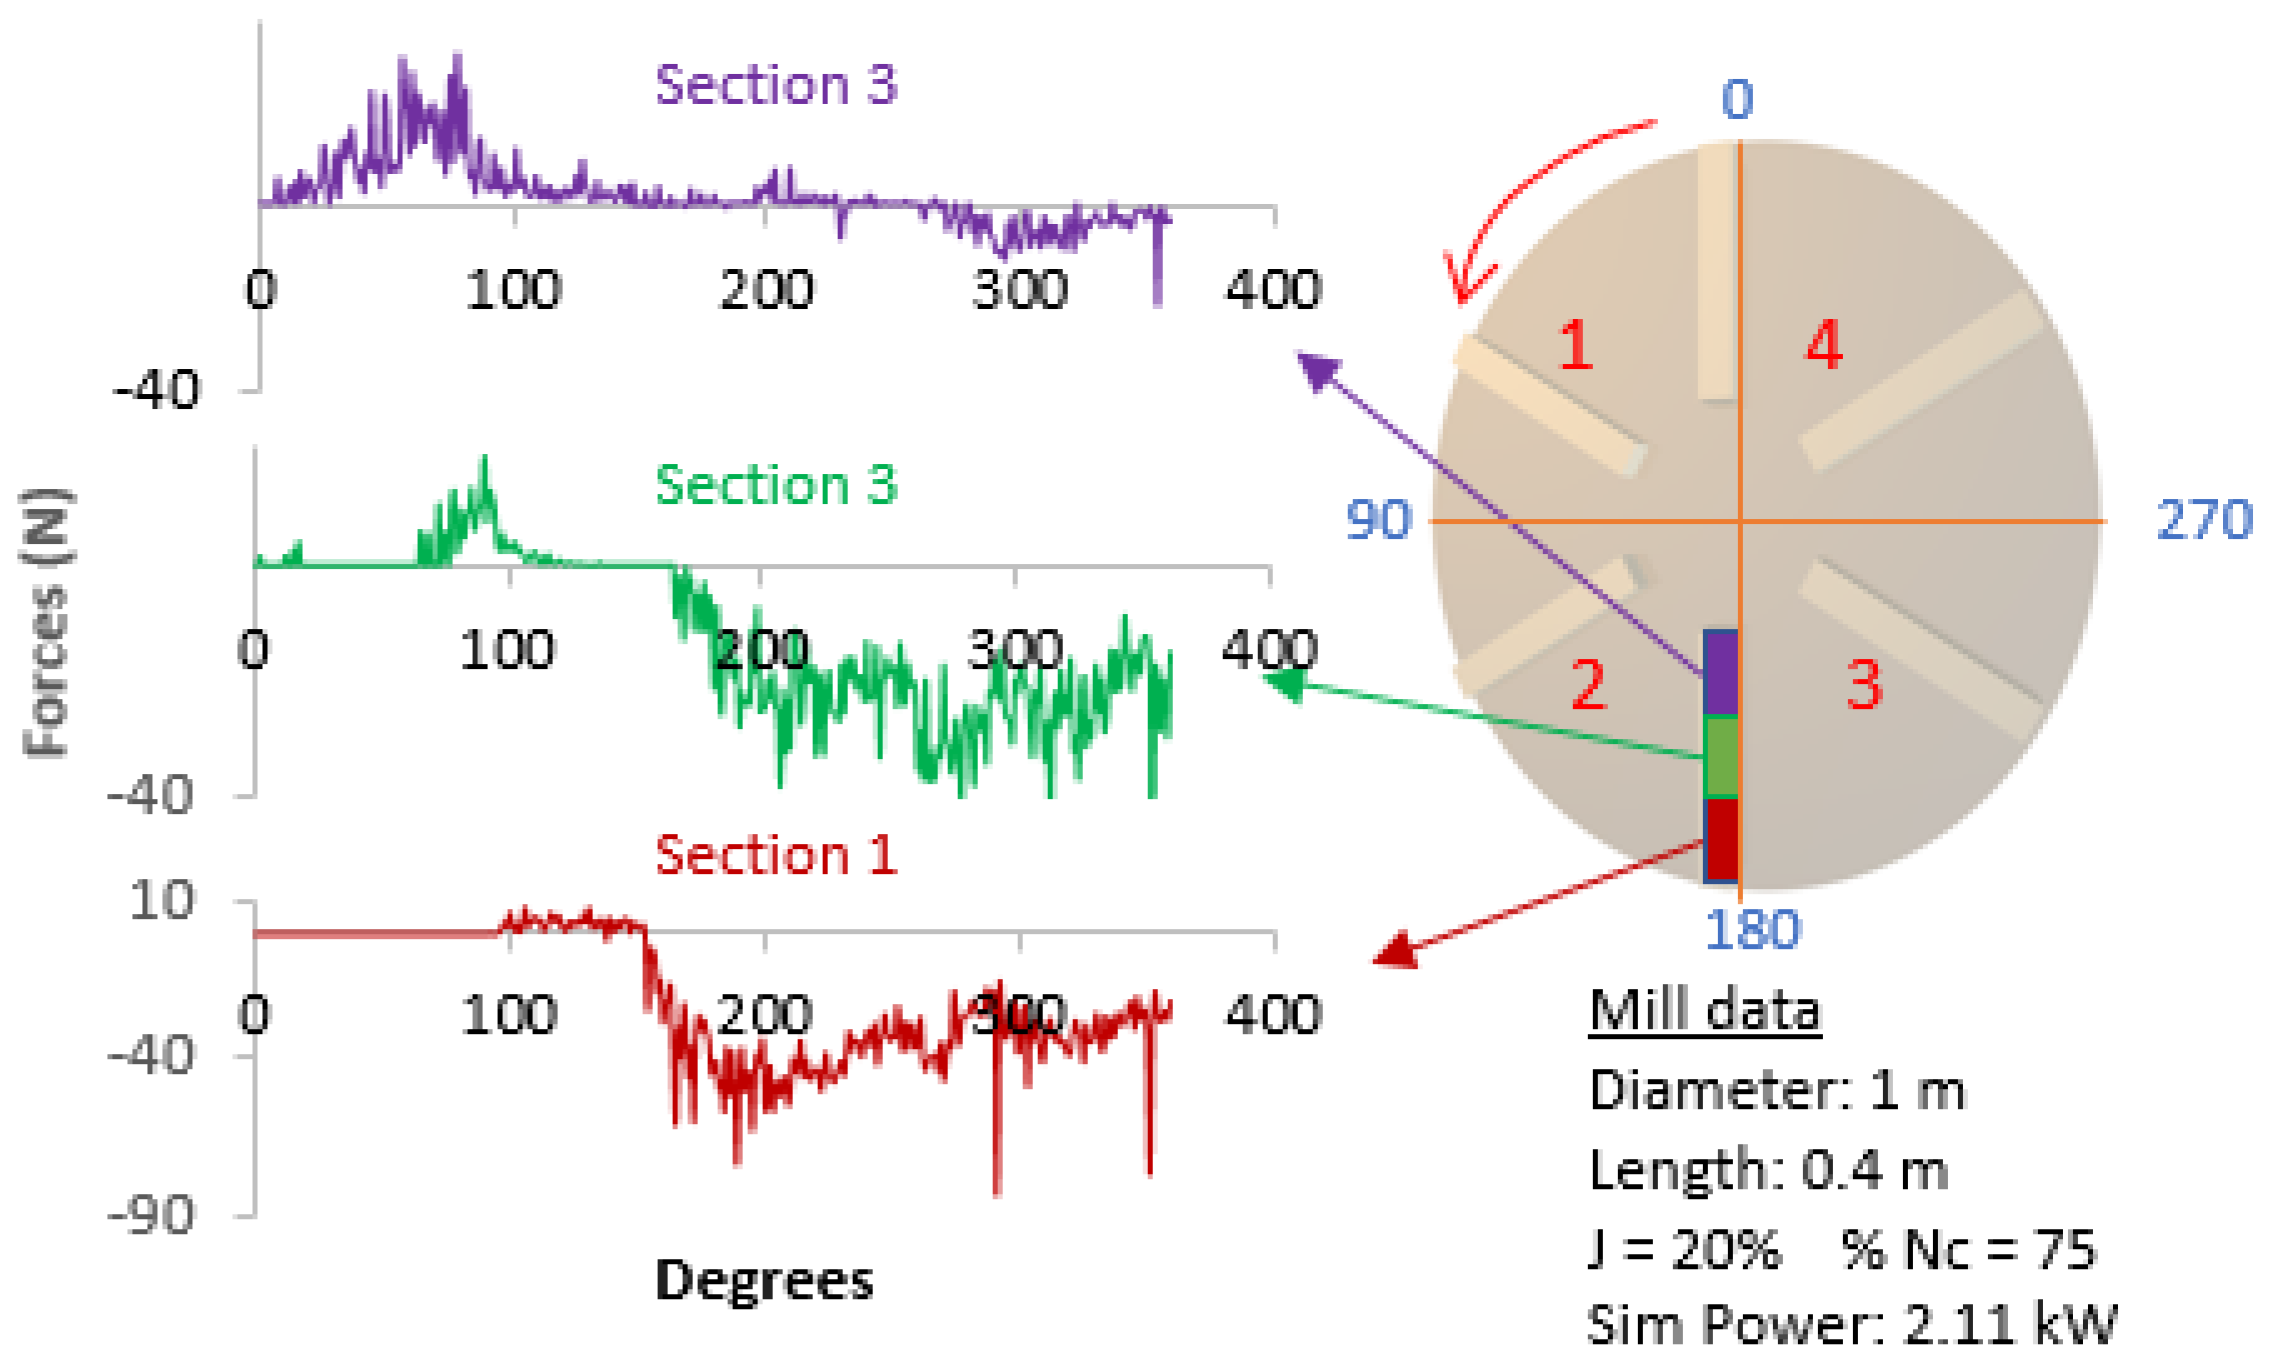
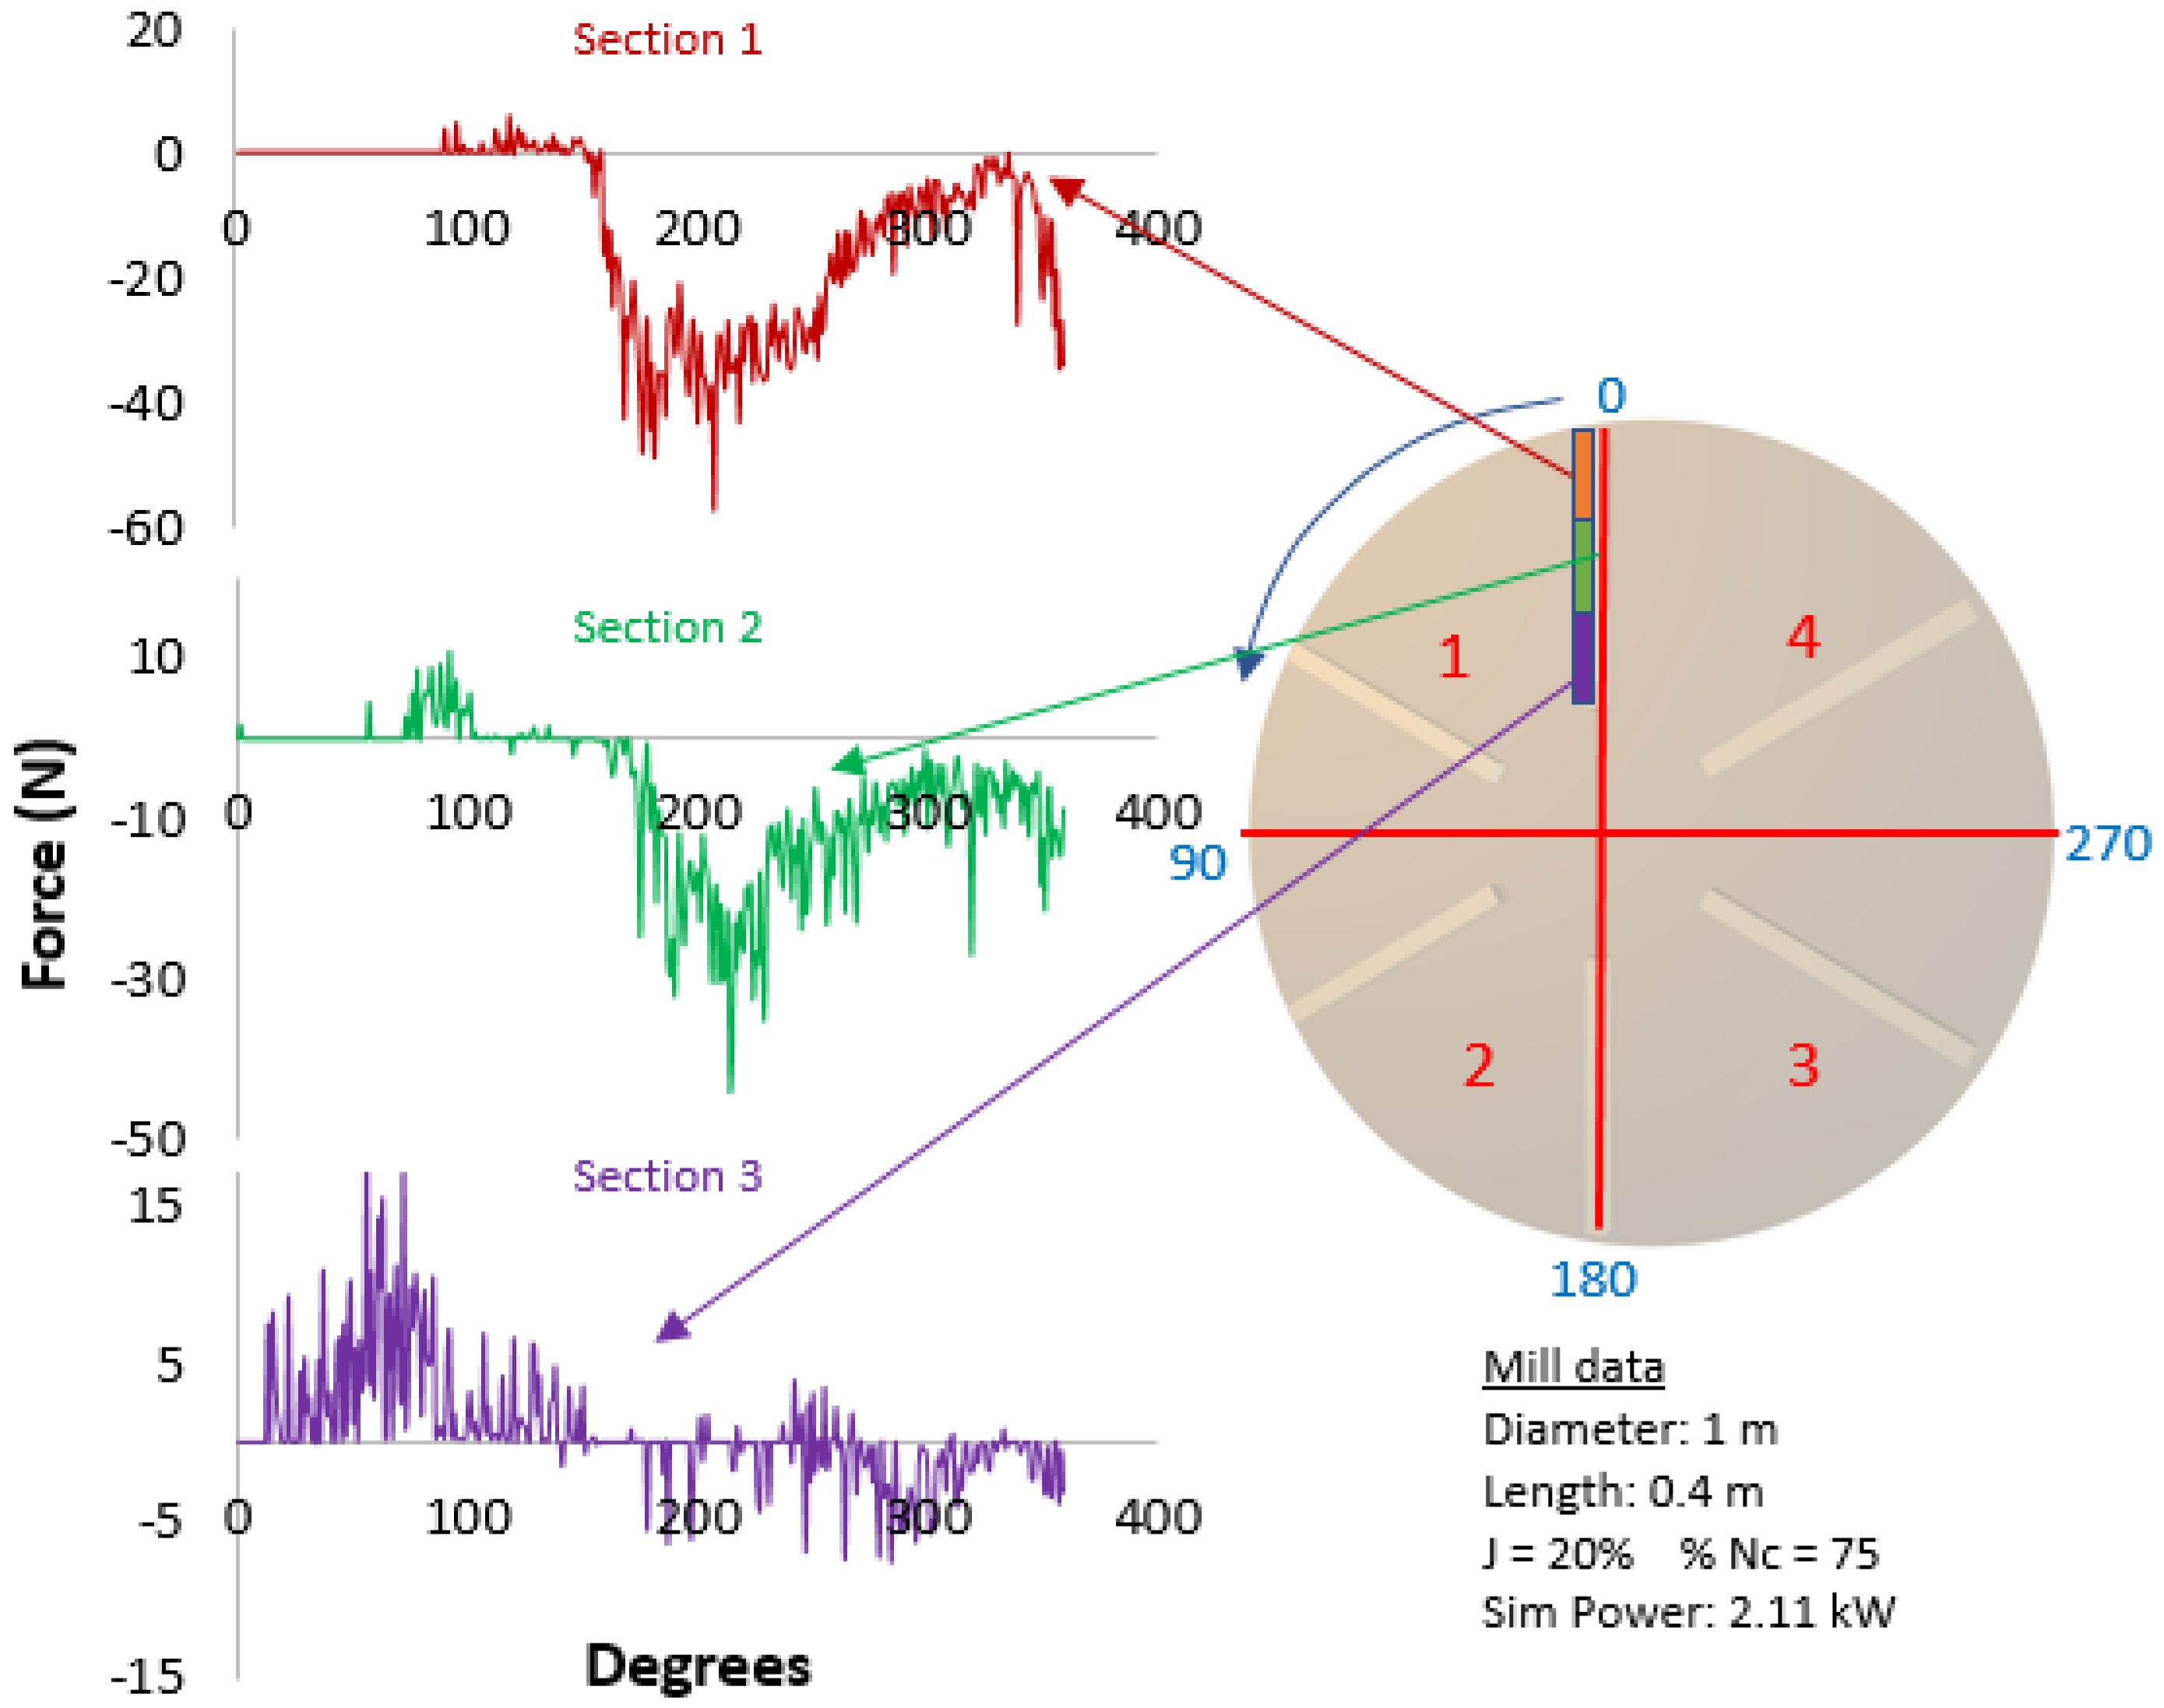
For the tangential forces, there are some subtle differences as presented in Figure 5; for Section 3, the peak occurs at around 70° and as explained for the radial forces, this has to do with direction of the tangential forces relative to the rotation of the mill. The tangential component of the force is more dominant in this segment. This is owing to the movement of charge in the carryover region beyond the 0° mark and since they move on top of the outer ring of the end liners, dominance of tangential forces results. The dominance of these forces undoubtedly causes excessive wear of liners. For sections 2 and 3, contrary to what was the case for radial forces, the tangential forces are larger on these two sections. The peak occurs at around 200° and these forces are sustained to around 350°. This is partly due to the gravitational force experienced by the charge in bulk region as it moves upwards to reach the shoulder position where the gravitational force starts to overcome the centrifugal force and fall into the in-flight region. Hasankhoei et al. [2] have observed that the shell liners at the discharge and feed end do not wear as quickly as those on the middle part due to the protection they get from the end liners, and that explains why the tangential forces are larger on these sections.
To add to the understanding of the changing profile of tangential forces for the three sections of the lifter, the forces acting on the lifters are illustrated in Figure 6 below. It is seen that the cataracting balls will be colliding with Section 3 of the mill in the first quadrant and proceed to collide with shell liners in the impact toe region [23]. At the beginning of the third quadrant; it is the mill that will work to raise the ball charge.
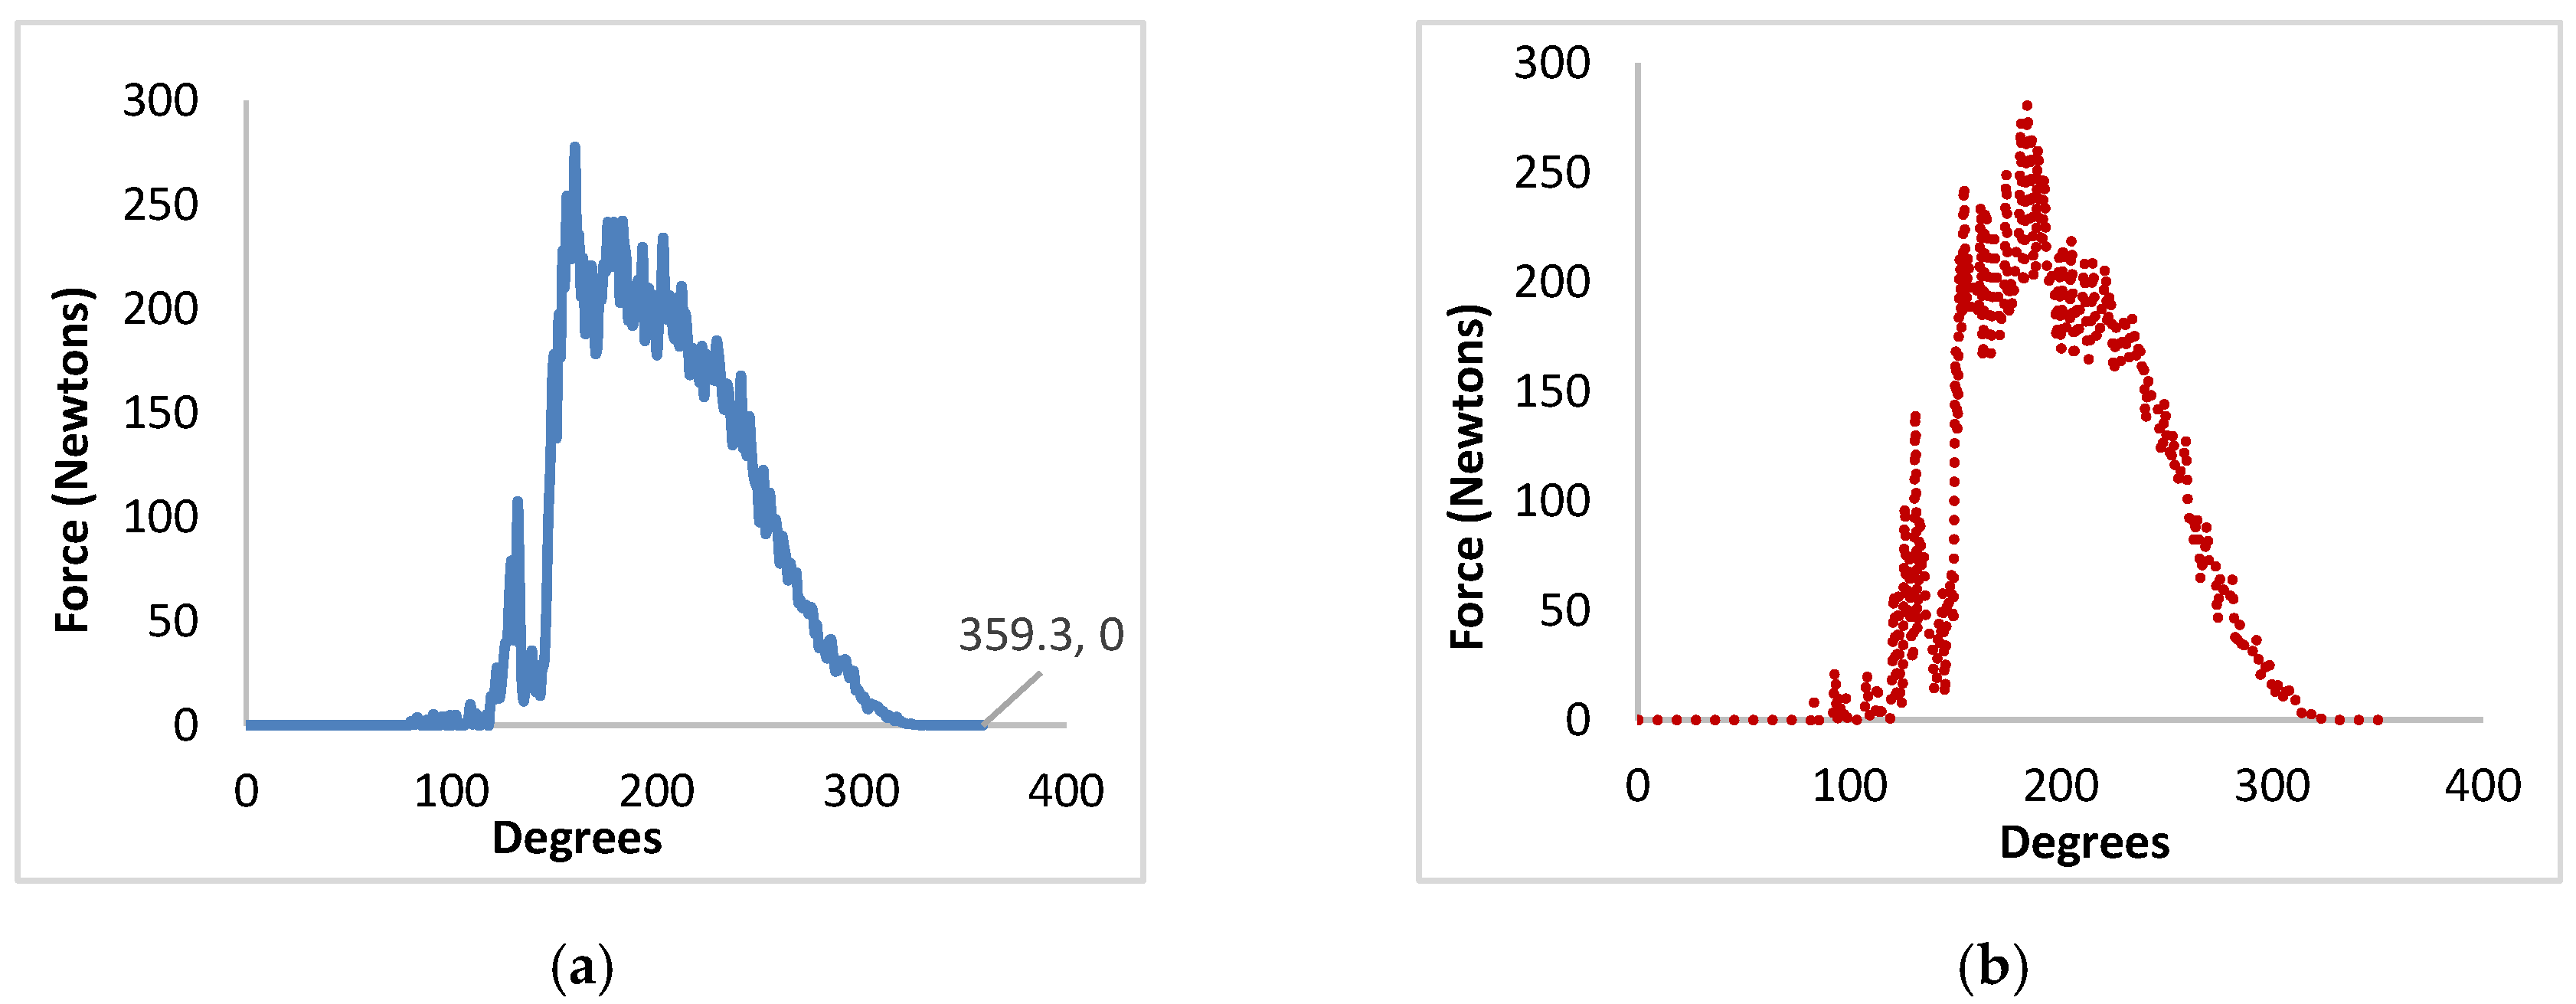
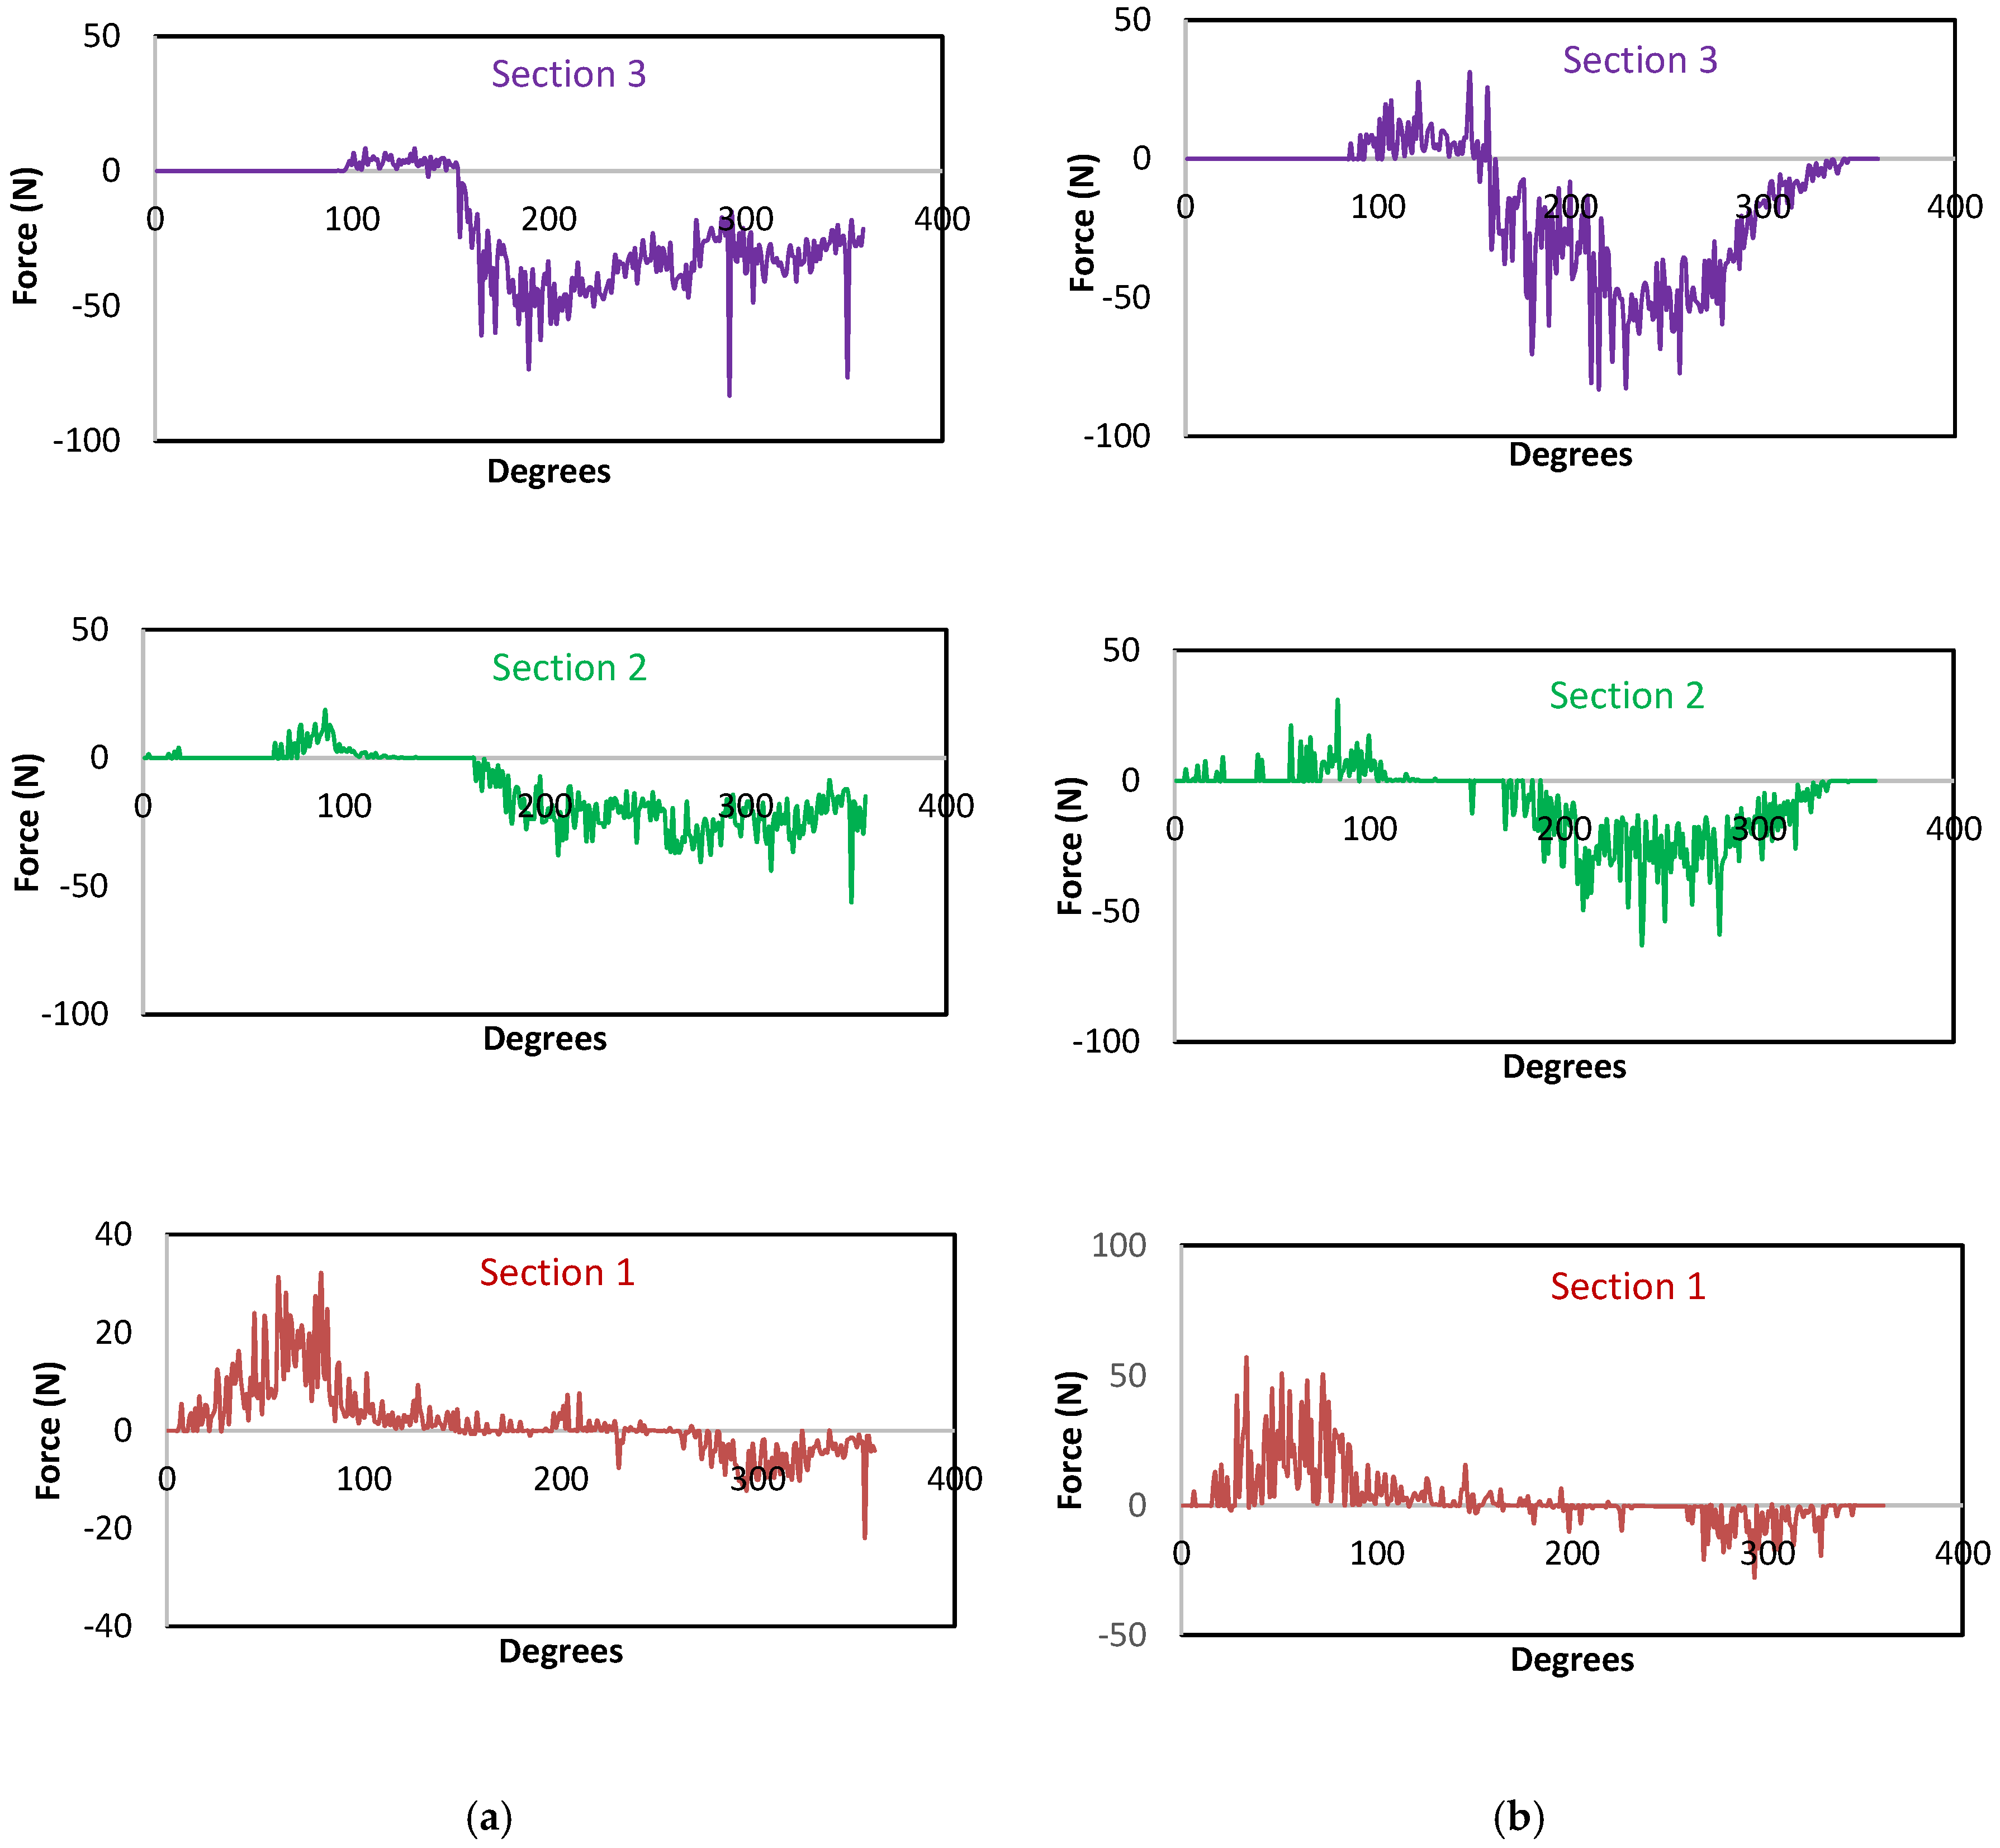
To see what happens on short end lifters, the tangential force profile in Figure 7 for the long end lifter was compared with tangential force recorded on the short end lifter.
It can be seen that the forces on both ends for the corresponding sections are similar except for a more defined force profile with short end lifters and slightly deeper troughs. The slight differences in peaks and projection of the forces are caused by the difference in length of the end-liners. As observed by [2], long end lifters have smaller gaps between the tips of end liners that trap a portion of materials which are supposed to fall into the main stream of the mill, whereas short end lifters with slightly bigger gaps between the tips of end liners prevents this from happening, thus differentiating the wear rate and grinding efficiency consequently.
3.1.4. Average Forces Acting per Unit Surface
An estimate of tangential shear forces acting on each of the three sections is given in the Table 2. The peak average forces based on 10% of the highest forces and overall average over a complete revolution are given.
It is seen that Section 1 experiences both a higher intensity of peak forces as well as an overall higher average intensity of forces and would thus be more susceptible to wear. From Figure 7, it has been shown that for Section 1, most of these forces act in the same direction as the vector of the mill rotation while for sections 2 and 3, the direction is mostly the opposite. This suggests a possibility of swapping positions of lifter Section 3 with lifter 1 to extend lifter life depending on the profile.
3.2. Comparison of 25 mm × 25 mm with 50 mm × 50 mm End Liners Both at 20% Ball Filling
The two mill simulations under comparison are presented in Figure 8. From the figure, is shown that the tabulated data show a 4% decrease in power draw with the 50 mm × 50 mm thicker lifters. It was noted that this is mostly accounted for by the difference in frictional power loss; 1046 W for the 25 mm × 25 mm liners and 972 for the 50 mm × 50 mm. The only apparent explanation is the extra contact sliding surface between the segments for the thinner liners. However, a closer examination of the load dynamics, which is worth another research paper, will be needed to get better insight.
From the manufacturer’s point of view, ensuring that liners last long enough in a wear prone environment while at the same time keeping down material cost of the replacement liners, would be a key consideration [24].
It was observed in Figure 9 that the force profiles for the thinner lifters are differentiated from what was observed for thicker lifters in Figure 5 by noise on the thinner profile. This suggests that the spacing between lifters or alternatively the number of end lifters can influence the stress pattern on the lifters and thus affect the wear rate of the end liners. The study of wear is beyond the scope of this investigation as this requires application of appropriate wear models such as the one applied by Kalala et al. [25].
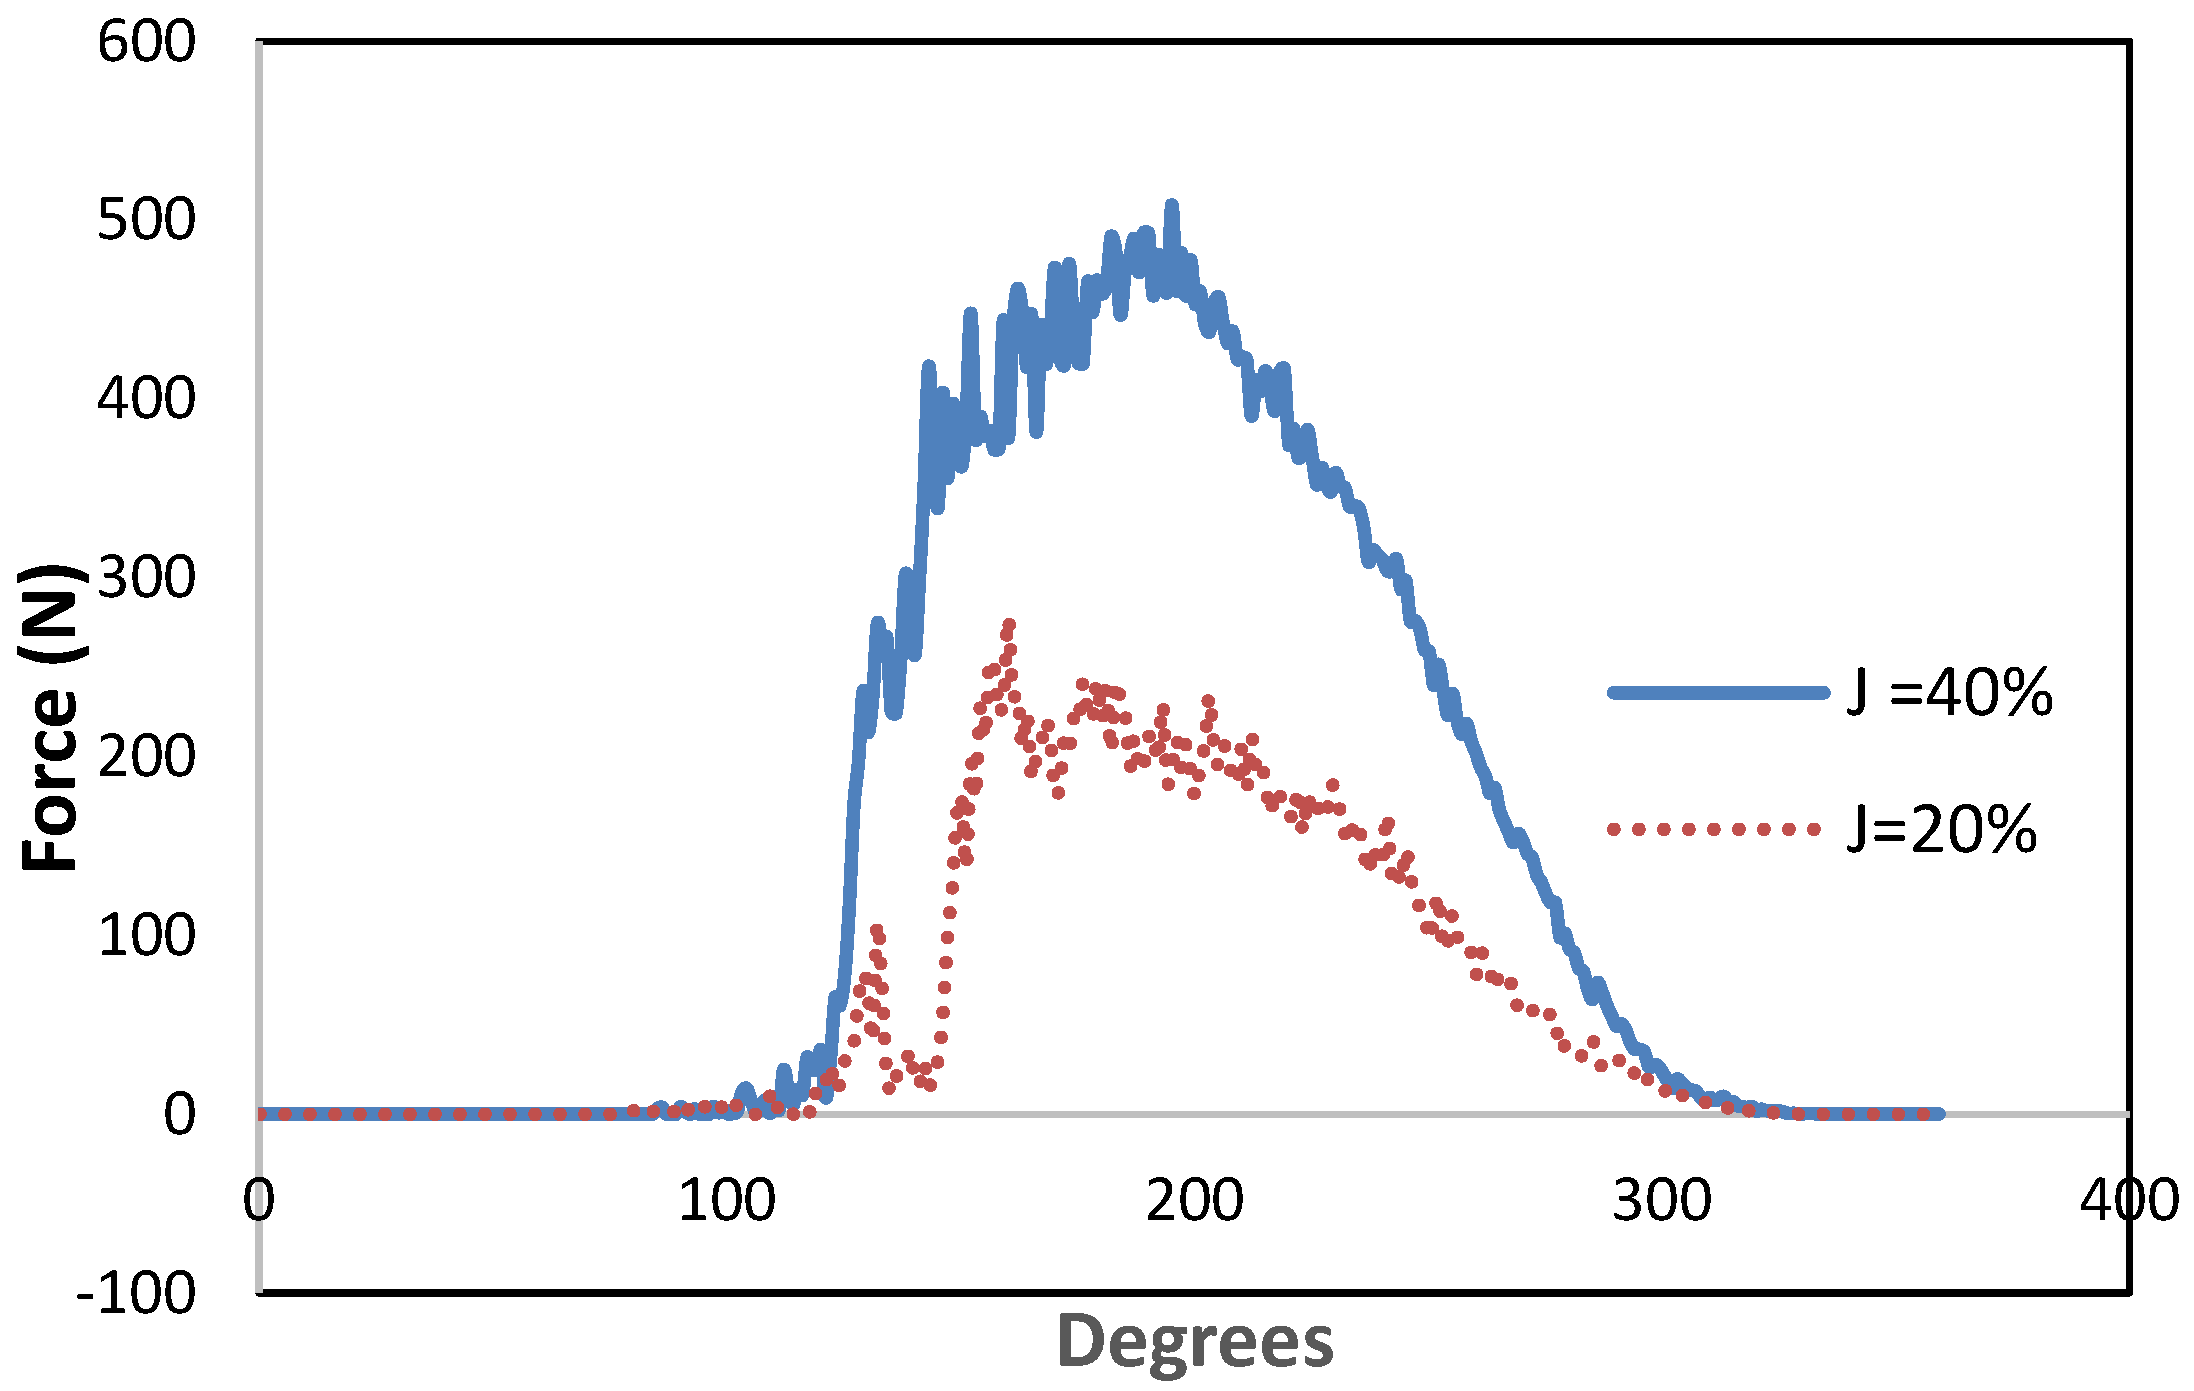
3.3. Comparison of 40% Ball Filling with 20% Ball Filling
Figure 10 shows profiles for sectional forces on lifters when the mill filling is doubled from 20% as shown in Figure 5 to 40%.
Some differences were noted for the results between Figure 5 and Figure 10; Section 3 forces translate from positive to negative forces without staying on the zero. It is also noted that the peak force for Section 2 is much greater than Section 1. The former can be explained by the effect of ball filling as it is evident that Section 3 is either being hit by balls at the back or pushing the balls after reaching the toe. The higher forces exerted on Section 2 can be attributed to the extra forces acting on the section due to the cascading balls.
Interestingly when the shell liner radial force profiles are plotted, it is seen in Figure 11 that forces for J = 40% are roughly double that of 20% as expected. The toe and shoulder positions change only marginally. It is thus clear from this investigation that it is important to understand the behavior of forces on the end-liner as they influence the rate and type of end liner wear in a given configuration, which in turn affects the mill availability.
3.4. Effect of Ball Size on the Forces Profiles (25 mm Balls Compared with 35 mm Balls)
Figure 12 below shows the different ball sizes that were simulated at the same J to capture the three sectional forces.
It was noted for the simulated scenario in Figure 12 that the power draw for the smaller 25 mm balls was at least 5% higher than that for the larger balls. This could be owing to the increased dissipation of energy emanating from the friction between the sliding balls and mill structure. The shell liner forces were compared and it was found that there is hardly any difference as seen in Figure 13.
For the end-liner forces presented in Figure 14, no differences were observed in all the sections. It was noted that the positive forces due to cataracting ball collisions were as expected; higher with the larger balls. Thus, there is a clear indication that larger balls can cause more damage in all three sections.
4. Conclusions
A number of simulations have been conducted to help us understand the forces that act on the end-liners and it is clearly evident that the forces that are operative on the end-liners are vastly different from those acting on the shell liners. It was noted that the forces varied both radially and tangentially for the different sections of an end-liner but tangential forces tend to be more significant. The spacing between liners or alternatively the number of end liners are influential on the stress pattern on the liners and thus affect the wear rate of the end liners. It was also noted that the forces increase with the increase in mill filling and also with bigger balls. Extra contact sliding surface between the segments for the thinner liners also affects end-liner forces. It was found that it is not always obvious what these force profiles may turn out to be and thus a simulator like DEM can be an invaluable tool for assessing situations before implementation.
Author Contributions
Conceptualization, N.C. and M.M.B.; methodology, N.C. and M.M.B.; software, M.M.B.; validation, N.C. and M.M.B.; formal analysis, N.C. and M.M.B.; investigation, N.C. and M.M.B.; resources, N.C. and M.M.B.; data curation, N.C. and M.M.B.; writing—original draft preparation, N.C. and M.M.B.; writing—review and editing, N.C. and M.M.B.; visualization, N.C. and M.M.B.; supervision, N.C. and M.M.B.; project administration, N.C. and M.M.B. Both authors have read and agreed to the published version of the manuscript.
Funding
This research was funded by the National Research Fund (NRF) South Africa, Development Grant for Y-Rated Researchers (Grant No 120394).
Acknowledgments
The authors wish to thank the University of the Witwatersrand South Africa for supporting this work.
Conflicts of Interest
The authors declare no conflict of interest.
References
- Parks, J.L. The influence of designs, maintenance practices, and operating conditions on SAG and AG mill liner performance. In Comminution Practices; SME: Englewood, CO, USA, 1998. [Google Scholar]
- Hasankhoei, A.; Maleki-Moghaddam, M.; Haji-Zadeh, A.; Barzgar, M.; Banisi, S. On dry SAG mills end liners: Physical modeling, DEM-based characterization and industrial outcomes of a new design. Miner. Eng. 2019, 141, 105835. [Google Scholar] [CrossRef]
- Royston, D. Semi-autogenous grinding (SAG) mill liner design and development. Min. Metall. Explor. 2007, 24, 121–132. [Google Scholar] [CrossRef]
- Cundall, P.A.; Strack, O.L. A distinct element model for granular assemblies. Geotechnique 1979, 29, 47–65. [Google Scholar] [CrossRef]
- Mishra, B.K.; Rajamani, R.K. Motion analysis in tumbling mills by the discrete element method. KONA Powder Part. J. 1990, 8, 92–98. [Google Scholar] [CrossRef] [Green Version]
- Cleary, P.W. Modelling comminution devices using DEM. Int. J. Numer. Anal. Methods Géoméch. 2001, 25, 83–105. [Google Scholar] [CrossRef]
- Weerasekara, N.; Powell, M.; Cleary, P.W.; Tavares, L.M.; Evertsson, M.; Morrison, R.; Quist, J.; Carvalho, R. The contribution of DEM to the science of comminution. Powder Technol. 2013, 248, 3–24. [Google Scholar] [CrossRef]
- Tavares, L.M. A Review of Advanced Ball Mill Modelling. KONA Powder Part. J. 2017, 34, 106–124. [Google Scholar] [CrossRef] [Green Version]
- Rajamani, R.K.; Mishra, B.K. Three dimensional simulation of charge motion in plant size SAG mills. In Proceedings of the International Conference on Autogenous and Semiautogenous Grinding Technology (SAG2001), Vancouver, BC, Canada, 30 September–3 October 2001; Volume 4, pp. 48–57. [Google Scholar]
- Rajamani, R.K.; Latchireddi, S.; Mishra, B.K. Discrete element simulation of ball and rock charge and slurry flow through grate and pulp lifters. Presented at the SME Annual Meeting, Cincinnati, OH, USA, 24–26 February 2003. [Google Scholar]
- Nordell, L.K.; Potapov, A.Y.; Herbst, J.A. Comminution simulation using discrete element method (DEM) approach—From single particle breakage to full-scale sag mill operation. In Proceedings of the International Conference on Autogenous and Semiautogenous Grinding Technology (SAG2001), Vancouver, BC, Canada, 30 September–3 October 2001; Volume 4, pp. 235–251. [Google Scholar]
- Cleary, P.W.; Sinnott, M.; Morrison, R. Prediction of slurry transport in SAG mills using SPH fluid flow in a dynamic DEM based porous media. Miner. Eng. 2006, 19, 1517–1527. [Google Scholar] [CrossRef]
- Cleary, P.W.; Prakash, M.; Ha, J.; Stokes, N.; Scott, C. Smooth particle hydrodynamics: Status and future potential. Prog. Comput. Fluid Dyn. Int. J. 2007, 7, 70. [Google Scholar] [CrossRef]
- Herbst, J.A.; Lichter, J.K. Use of multi-physics models for the optimization of comminution operations. In Advances in Comminution; Kawatra, S.K., Ed.; Society for Mining, Metallurgy, and Exploration, Inc. (SME): Littleton, CO, USA, 2006; pp. 193–204. [Google Scholar]
- Powell, M.; Smit, I.; Radziszewski, P.; Cleary, P.; Rattray, B.; Eriksson, K.-G.; Schaeffer, L. Selection and design of mill liners. In Advances in Comminution; Kawatra, S.K., Ed.; Society for Mining, Metallurgy, and Exploration, Inc. (SME): Littleton, CO, USA, 2006; pp. 331–376. [Google Scholar]
- Bian, X.; Wang, G.; Wang, H.; Wang, S.; Lv, W. Effect of lifters and mill speed on particle behaviour, torque, and power consumption of a tumbling ball mill: Experimental study and DEM simulation. Miner. Eng. 2017, 105, 22–35. [Google Scholar] [CrossRef]
- Xu, L.; Luo, K.; Zhao, Y. Numerical prediction of wear in SAG mills based on DEM simulations. Powder Technol. 2018, 329, 353–363. [Google Scholar] [CrossRef]
- Cleary, P.W. Predicting charge motion, power draw, segregation, wear and particle breakage in ball mills using discrete element methods. Miner. Eng. 1998, 11, 1061–1080. [Google Scholar] [CrossRef]
- Navarro, H.A.; Braun, M.P.D.S. Determination of the normal spring stiffness coefficient in the linear spring–dashpot contact model of discrete element method. Powder Technol. 2013, 246, 707–722. [Google Scholar] [CrossRef]
- Blithe, K.J.; Wilson, E.L. Numerical Methods in Finite Element Methods; Prentice-Hall: Englewood Cliffs, NJ, USA, 1976. [Google Scholar]
- Bwalya, M.M. Using the Discrete Element Method to Guide the Modelling of Semi and Fully Autogenous Milling. Ph.D. Dissertation, School of Chemical and Metallurgical Engineering, University of the Witwatersrand, Johannesburg, South Africa, 2005. [Google Scholar]
- Moys, M.; Van Nierop, M.; Smit, I. Progress in measuring and modelling load behaviour in pilot and industrial mills. Miner. Eng. 1996, 9, 1201–1214. [Google Scholar] [CrossRef]
- Owen, P.; Cleary, P.W. The relationship between charge shape characteristics and fill level and lifter height for a SAG mill. Miner. Eng. 2015, 83, 19–32. [Google Scholar] [CrossRef]
- Moys, M.H.; Powell, M.S. Lifter bars save costs for Lindum. In Mintek Bulletin, No. 77; Mintek: Randburg, South Africa, 1994. [Google Scholar]
- Kalala, J.T.; Bwalya, M.; Moys, M. Discrete element method (DEM) modelling of evolving mill liner profiles due to wear. Part II. Industrial case study. Miner. Eng. 2005, 18, 1392–1397. [Google Scholar] [CrossRef]
Figure 1.
Shell and end lifter configuration used in the simulations. (a) Long end lifter and (b) short end lifter.
Figure 1.
Shell and end lifter configuration used in the simulations. (a) Long end lifter and (b) short end lifter.

Figure 2.
Radial and tangential forces acting on the shell liners.

Figure 3.
Radial forces acting on the 3 sections of the end lifters.

Figure 4.
An indication of ball movement in the mill from (a) our simulation and (b) after Hasankhoei et al. [2].
Figure 4.
An indication of ball movement in the mill from (a) our simulation and (b) after Hasankhoei et al. [2].

Figure 5.
Tangential forces acting on long end lifters.

Figure 6.
Illustration of how the forces act on the different sections of the end lifters.

Figure 7.
Comparison of tangential forces at (a) long end lifter (b) short end lifter.

Figure 8.
Simulation of 25 mm × 25 mm end liner compared with 50 mm × 50 mm end liner. (a) 25 mm × 25 mm end liners, power draw = 2211 W, % energy loss due tofriction 47.33. (b) 50 mm × 50 mm end liners, power draw = 2114 W, % energy loss due to friction 46.08.
Figure 8.
Simulation of 25 mm × 25 mm end liner compared with 50 mm × 50 mm end liner. (a) 25 mm × 25 mm end liners, power draw = 2211 W, % energy loss due tofriction 47.33. (b) 50 mm × 50 mm end liners, power draw = 2114 W, % energy loss due to friction 46.08.

Figure 9.
Sectional forces obtained by averaging the forces on all six end lifters (25 mm × 25 mm square liners, 25 mm ball size and 20% ball filling).
Figure 9.
Sectional forces obtained by averaging the forces on all six end lifters (25 mm × 25 mm square liners, 25 mm ball size and 20% ball filling).

Figure 10.
Tangential forces acting on the end liner when mill filling is increased to 40%.

Figure 11.
Average radial forces acting on the shell liner forces for mill filling at 20% and 40%.

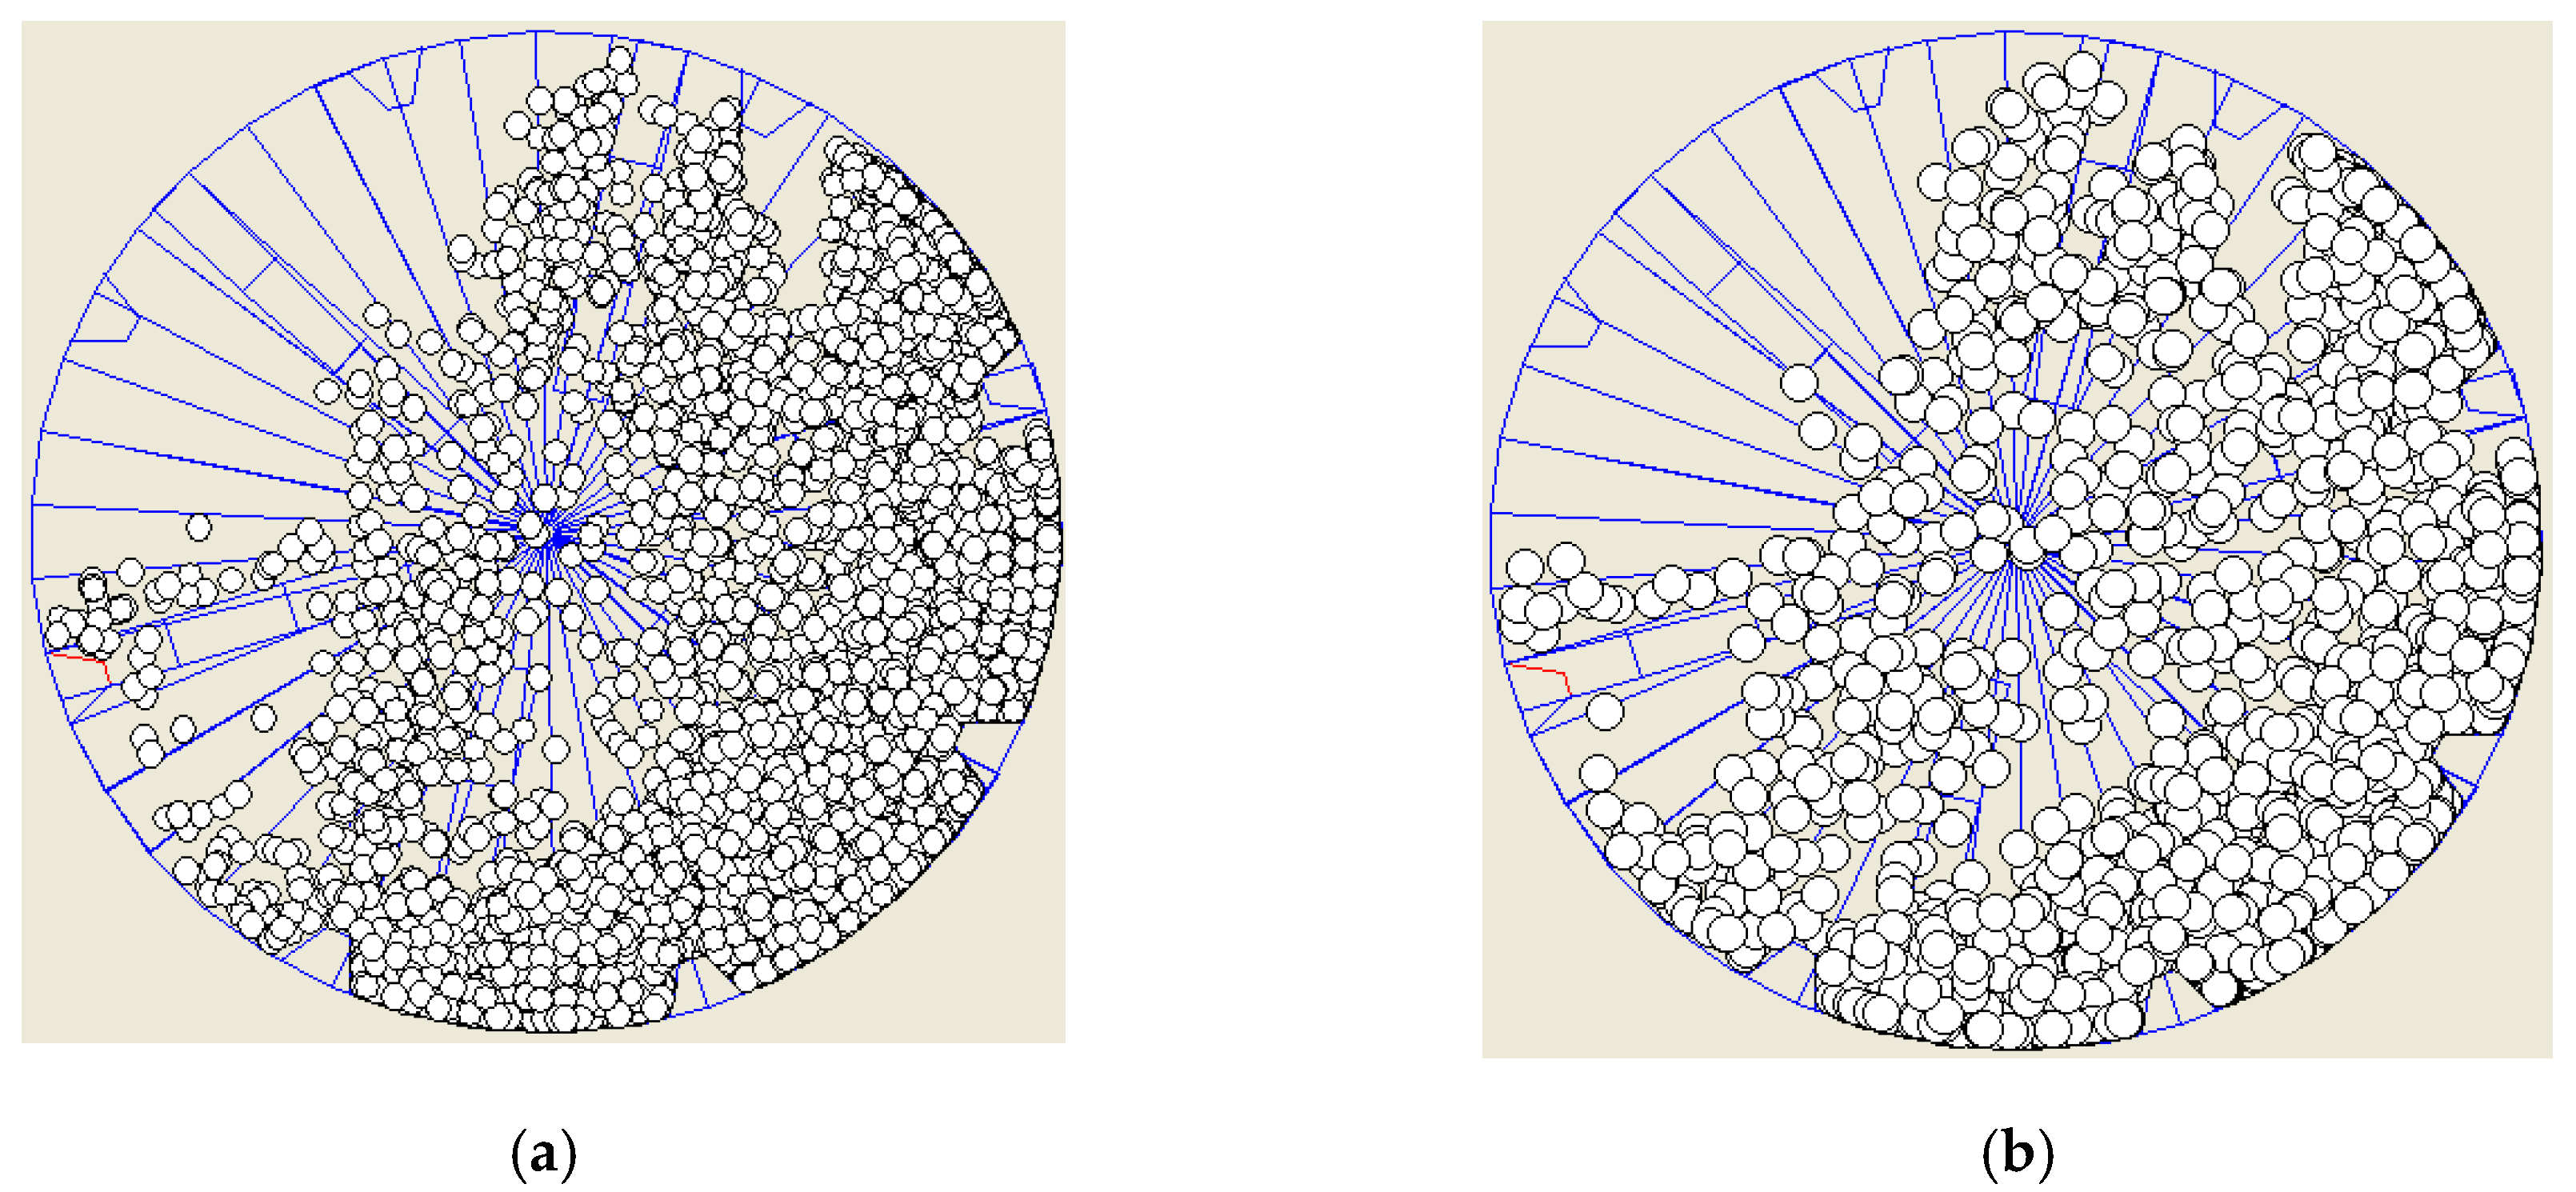
Figure 12.
Snapshot of the balls of different sizes acting on the end liners. (a) 25 mm balls. Simulated power 2114 W. (b) 35 mm balls. Simulated power 1995 W.
Figure 12.
Snapshot of the balls of different sizes acting on the end liners. (a) 25 mm balls. Simulated power 2114 W. (b) 35 mm balls. Simulated power 1995 W.

Figure 13.
Comparison of average shell liner force profiles for (a) 25 mm balls and (b) 35 mm balls.
Figure 13.
Comparison of average shell liner force profiles for (a) 25 mm balls and (b) 35 mm balls.

Figure 14.
Comparison of end liner tangential forces for the (a) 25 mm balls and (b) 35 mm balls.


Table 1.
Simulation specifications.
| Mill Parameters | Specifications |
| No. of shell liner: 8 trapezium lifters | Base 75 mm height 50 mm and top 25 mm Face angle 63° |
| No. of end liners: 6 square lifters | Two types: 25 mm × 25 mm or 50 mm × 50 mm |
| % Mill filling | 20 or 40 |
| Speed % of Nc | 75 |
| Ball size | 25 (0.06 kg) or 35 (0.18 kg) mm. (One ball size in each specific simulation) |
| Ball density | 7800 kg/m3 |
| No of sampled revs | 4 (3rd revolution is used for all the reviews) |
| DEM Parameters | Values |
| Friction coefficient | 0.5 |
| Coefficient of restitution | 0.5 |
| Normal stiffness | 4 × 10⁶ N |
| Shear stiffness | 3 × 10⁶ N |
Table 2.
Average forces acting on the lifter sections.
| Parameters | Section 1 | Section 2 | Section 3 |
|---|---|---|---|
| Lifter area (m2) | 0.06 | 0.06 | 0.06 |
| Peak shear force (N/m2) | 855.6 | 655.7 | 296.3 |
| Average shear force (N/m2) | 578.2 | 360.9 | 94.7 |
Publisher’s Note: MDPI stays neutral with regard to jurisdictional claims in published maps and institutional affiliations. |
© 2020 by the authors. Licensee MDPI, Basel, Switzerland. This article is an open access article distributed under the terms and conditions of the Creative Commons Attribution (CC BY) license (http://creativecommons.org/licenses/by/4.0/).
Share and Cite
MDPI and ACS Style
Chimwani, N.; Bwalya, M.M. Exploring the End-Liner Forces Using DEM Software. Minerals 2020, 10, 1047. https://doi.org/10.3390/min10121047
AMA Style
Chimwani N, Bwalya MM. Exploring the End-Liner Forces Using DEM Software. Minerals. 2020; 10(12):1047. https://doi.org/10.3390/min10121047
Chicago/Turabian StyleChimwani, Ngonidzashe, and Murray M. Bwalya. 2020. "Exploring the End-Liner Forces Using DEM Software" Minerals 10, no. 12: 1047. https://doi.org/10.3390/min10121047
Note that from the first issue of 2016, this journal uses article numbers instead of page numbers. See further details here.