Evaluating Growth and Photosynthesis of Kimchi Cabbage According to Extreme Weather Conditions


1
Vegetable Research Division, National Institute of Horticultural and Herbal Science, Wanju 55365, Korea
2
Department of Horticultural Science, College of Agriculture and Life Sciences, Kyungpook National University, Daegu 41566, Korea
*
Author to whom correspondence should be addressed.
Agronomy 2020, 10(12), 1846; https://doi.org/10.3390/agronomy10121846
Submission received: 2 November 2020
/
Revised: 18 November 2020
/
Accepted: 21 November 2020
/
Published: 24 November 2020
(This article belongs to the Section Horticultural and Floricultural Crops)
Abstract
:The aim of this study was to develop and validate growth and photosynthetic models of Kimchi cabbages under extreme temperature conditions at different growth stages. Kimchi cabbage plants were subjected to low and high air temperatures 7–10 days after transplanting (DAT) and 40–43 DAT using extreme weather simulators. Except during these periods, the air temperature, relative humidity, solar radiation, and precipitation were set according to previous meteorological data. The experiments were performed over two years: in the first year, data were used to develop the models; the second-year experimental data were used for validation. The growth parameters and relative growth rate of Kimchi cabbage decreased due to low and high air temperature treatments. Photosynthetic CO2 response curves, which were measured using a portable gas exchange system, were used to calculate three biochemical parameters from measured data: photochemical efficiency, carboxylation conductance, and dark respiration. These parameters were used to develop the photosynthetic models (modified Thornley’s models) representing predictions of net photosynthetic rate by CO2 concentration and growth stage. The simulated photosynthetic rate with extreme high temperature treatment (35/31 °C) was 19.7 μmol m−2 s−1 which was evaluated approximately 3% deduction compared with control. Results of this study indicate that the growth and photosynthetic models developed here could be applied to evaluate retarded growth and net photosynthetic rate under extreme temperature conditions.
1. Introduction
Kimchi cabbage (Brassica rapa L. ssp. pekinensis) is a primary vegetable crop in Korea given that it is the main ingredient of Kimchi, one of the nation’s leading foods. Because of its agricultural and economic importance, Kimchi cabbage is widely cultivated in Asia, especially in Korea and China. It is classified as a cool-season crop, and most cultivars will not form heads when the daily mean air temperature is >25 °C [1]. In general, the harvest period for Kimchi cabbage, i.e., when full head formation has occurred, varies from 50 to 100 days after sowing, depending on cultivars and the prevailing environmental conditions.
Previous studies have suggested that when Kimchi cabbage is exposed to a combination of elevated temperature and CO2, its leaf dry weight decreases [2]. Relevant studies have also indicated that increased air temperature reduces the growth, photosynthetic rate, PSII activity, and yield of Kimchi cabbage and can lead to severe soft rot disorder [3,4]. The interacting effects of elevated CO2 and air temperature on the growth and physiological responses of vegetables have been reported. A physiological disorder of hot pepper [5] reduced productivity by enriched CO2 concentration. Long-term exposure to a combination of elevated temperature and CO2 increased root dry weights of radish [6,7]. In contrast, low temperature can induce abiotic stresses that affect plant growth and development [8]. The photosynthesis under cold stress conditions of the warm-climate plant is the most significantly affected biological process [9,10] and cold shock protein 3 of non-heading cabbage can be induced by cold stress [11]. Cold stress has deleterious effects on the efficiency of photosynthesis in terms of altered gas exchange, pigment content and composition, and chloroplast development [12,13].
In Korea, autumn harvest yields contribute to the majority of total Kimchi cabbage production (61%), followed by spring (12%) and winter (15%) yields, with the remaining produce grown in alpine areas during the summer season (12%) [14]. In the alpine area, Kimchi cabbage is mostly cultivated at >400 m above sea level (Gangwon-do Province). As of 2018, this area accounts for ~19% (5700 ha) of the cultivated area of Kimchi cabbage [15]. With air temperature predicted to rise by 1–4 °C by the end of the 21st century due to increased greenhouse gas levels in the atmosphere, it is important that the heat tolerance of this highly valued crop be improved. Indeed, high temperatures during the autumn season could affect Kimchi cabbage growth during the early transplanting period. As Kimchi cabbage is mainly produced in the field, it is vulnerable to extreme weather conditions; these can reduce production due to growth retardation and related physiological disorders [4,5,16]. For example, high temperatures and extreme heat stress can cause cell damage leading to cell death, poor head formation, and reduced growth, which in turn decreases quality and production rate [6,17,18]. Lee et al. [4] cultivated Kimchi cabbage under moderate and extreme predicted climate change scenarios, finding that increased temperature and CO2 concentration delayed growth, impacted leaf morphology, reduced yield and CO2 assimilation rates, and affected overall photosynthetic efficiency.
Modeling enables researchers to investigate the effects of different environmental factors on the photosynthesis rate and productivity of plants [19,20]. However, constructing growth and photosynthetic models that accurately reflect the complex interactions of many environmental variables remains challenging [21]. Rectangular hyperbola models are commonly used to express photosynthetic responses to light and CO2. An increase in light intensity or CO2 concentration increases the photosynthetic rate in a saturation curve. Thornley [22] established a simple formula for photosynthesis in fluctuating light. By applying differential equations for both the light and dark reactions in photosynthesis, Thornley’s model has been developed into a rectangular hyperbola model for empirical use [23]. This model can express the change in the photosynthetic rate based on light intensity and CO2 concentration; however, it cannot express differences associated with the growth stage. Light use efficiency decreases exponentially with an increase in the leaf area index as plants grow [24]; therefore, it is necessary to modify the model according to the growth stage [25].
Currently, there is a lack of research on the effects of extreme low and high temperatures on the agronomy of the Kimchi cabbage, e.g., on physiology, growth, and photosynthesis. Extreme weather conditions are becoming more common, resulting in damage to vegetable crops grown in the field. Kimchi cabbage is a suitable model crop to elucidate the impact of climate change on biological parameters and yield because it is more adversely affected by elevated air temperatures than warm-season and tropical crops. Therefore, the aim of this study was to develop and validate growth and photosynthetic models of Kimchi cabbage that included the impacts of extreme weather on the growth and physiological responses of this important crop.
2. Materials and Methods
2.1. Plant Materials
Spring and autumn season cultivars of Kimchi cabbage, cv. Chunkwang (Sakada Korea Seed Co., Seoul, Korea) and cv. Bulam3ho (Hungnong Seed Co., Ansung, Korea), respectively, were sown in a plug tray (35 mL/cell) filled with commercial soil (BioMedia; Hungnong Seed Co., Ansung, Korea). The transplants were grown in a glasshouse at the National Institute of Horticultural and Herbal Science, located in Wanju, Korea (35°16′ N, 127°02′ E, and 32 m altitude). The air temperatures were set at 20 °C for the light period and 18 °C for the dark period during the transplant production phase. The average photo- and dark-periods each growing season, spring (14/10 h) and autumn seasons (11/13 h), were set respectively. Full irrigation was applied every day, and Mulpure nutrient solution (Daeyu Co., Seoul, Korea) for seedlings was applied at 3–4 day intervals. The plants were transplanted 28 days (spring season) and 35 days (autumn season) after sowing in approximately 22 m2 extreme weather growth-chambers (EWGCs; Modified Controlled Environment Extreme Weather Simulator (CEEWS) model, EGC, Chagrin Falls, OH, USA). The soil bin was 3 × 1 × 1 m (length × width × depth) in size and plant density was 7.7 plants/m2. Fertilizer was applied based on the results of soil tests performed during the spring and autumn seasons, following regional recommendations (920 kg/ha; 361 kg/ha for N, 263 kg/ha for P2O5, and 9.0 kg/ha for K2O).
2.2. Growth Environment Factors and Extreme Weather Treatments
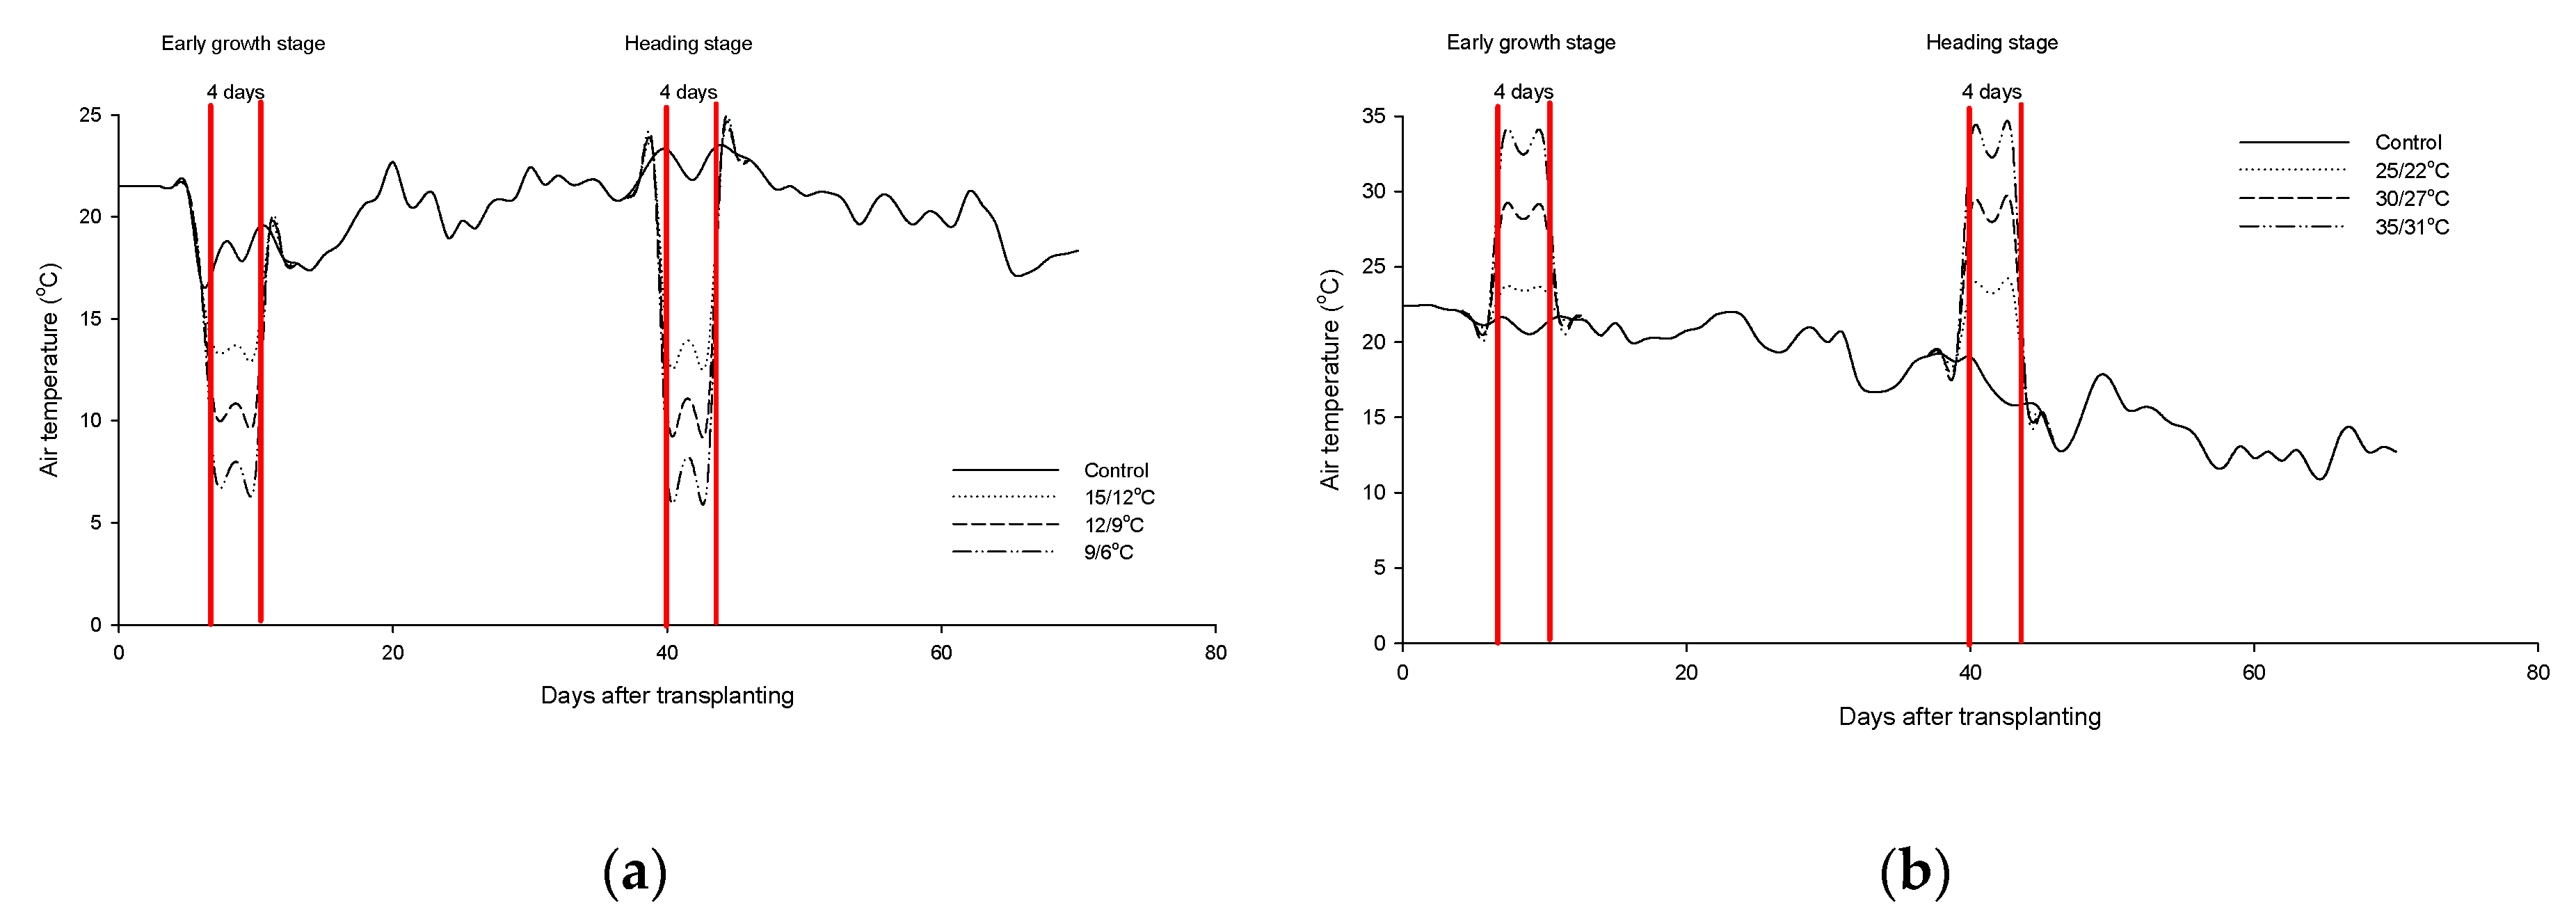
The climate values were adjusted to the existing weather conditions. Daegwanryeong (37°30′ N, 128°43′ E, and 800 m altitude) region data from June 1st to August 10th, 2013, 2014, and 2015 were used for the spring season experiment. Haenam (34°32′ N, 126°34′ E, and 15 m altitude) region data from September 1st to November 10th, 2013, 2014, and 2015 were used for the autumn season experiment as a control. Kimchi cabbages were subjected to extreme weather treatments at two times, in spring at 7–10 days after transplanting (DAT), and in fall at heading (40–43 DAT). In spring, three temperature levels were imposed: 15 °C/12 °C, 12 °C/9 °C, and 9 °C/6 °C light/dark. In autumn, three other temperature treatments were imposed: 25 °C/22 °C, 30 °C/27 °C, and 35 °C/31 °C light/dark.
The weather profiles were programmed into the eight EWGCs using an advanced environmental control program (SIMATIC WinCC Runtime Advanced V13 SP1; Siemens, Munich, Germany) and weather data were collected. Changes in air temperature are shown in Figure 1. The soil type was clay loam and soil moisture were maintained at 30–40% after transplanting until harvest. Irrigation was via a drip irrigation system. The irrigation amount and frequency were 500 mL/plant and 2–3 times per week, respectively.
2.3. Growth Parameter Analysis
Growth parameters, including maximum leaf length and width, number of leaves, leaf area, and fresh and dry weight, were measured 4 and 18 days after commencing extreme weather treatment (at the early transplanting stage). The leaf area was measured using a leaf area meter (LI-3100; Li-Cor Co., Inc., Lincoln, NE, USA). Three randomized samples were harvested to measure the fresh weight of Kimchi cabbage at five growth stages for the spring season experiment (0, 14, 28, 42, and 56 DAT) and at six growth stages for the autumn season experiment (0, 14, 28, 42, and 70 DAT). All fresh weights in each cultivation season with extreme weather treatment were applied to a regression analysis in a sigmoidal curve model (Equation (1)). In addition, a curve of the relative growth rate (Equation (2)) of Kimchi cabbage was calculated based on the fresh weight of each growth stage and those were validated:
where y: fresh weight; x: days after transplanting; a: maximum value of growth; b: relative growth rate is equal to maximum growth; x0: predicts the time of inflection.
where y: relative growth rate (RGR); x: days after transplanting; y0: the constant that affects the degree of kurtosis; a: the constant that affects the point at which the RGR maximum; b: the constant that affects the peak of RGR.
2.4. Measurement of Photosynthetic Rate for Developing Photosynthetic Rate Models
The CO2 assimilation rate (An) response to the intercellular CO2 concentration (Ci) (An-Ci) curve of cabbage leaves was measured using a portable photosynthesis system (Li 6400XT; Li-Cor Co., Inc., Lincoln, NE, USA) in the morning time. The curve data were collected at four growth stages for spring season experiment (16, 29, 43, and 59 DAT) and at five growth stages for autumn season experiment (16, 29, 43, 59, and 70 DAT). Each measurement was performed with three replicates per extreme weather treatment. The fully expanded leaf was clamped onto a 6 cm2 leaf chamber, and light was provided by a sensor head (6400-02B LED; Li-Cor Co., Inc., Lincoln, NE, USA). Relative humidity in the leaf chamber was 70–80% and the block temperature was maintained at 25 °C. For the An-Ci curve, gas exchange responses to various CO2 concentrations ranging from 50 to 1500 μmol/mol were measured at 500 μmol/m2/s photosynthetic photon flux. Each CO2 concentration level was measured for 300 s after an equilibrium time of 120 s. This is slightly less than the light saturation points for photosynthesis in Kimchi cabbage, with a 10% ratio of blue light required to maximize the stomatal aperture [24].
2.5. Development and Validation of Photosynthetic Rate Models
The photosynthetic rate at all CO2 concentrations was obtained using Equation (3) [20]:
where PPF and Ci represented photosynthetic photon flux and intercellular carbon dioxide concentration, respectively. P is the photosynthetic rate (μmol CO2/m2/s), while a, b, and c are the photochemical efficiency (μmol CO2/μmol), carboxylation conductance (/s), and dark respiration (μmol CO2/m2/s), respectively. Values for a, b, and c were obtained by regression analysis with photosynthetic rates at each growth stage from An-Ci curve data. A decrease in P with growth stage could be expressed as shown in Equation (4) because light use efficiency was exponentially reduced with leaf size and growth stage [24]:
where p and q are regression parameters. A simple multiplication model (Equation (5)) was developed by multiplying Equations (3) and (4) as follows:
by inserting Equation (4) into Equation (3), Thornley’s photosynthetic rate model (Equation (6)) was described as follows:
all the regression parameters in the simple multiplication model and the Thornley model were analyzed using the statistical program SPSS (IBM, New York, NY, USA). These models were then validated using the An-Ci curve data at each growth stage and extreme weather treatment.
2.6. Experiment Design and Statistical Analysis
In total, 40 Kimchi cabbage plants were placed in each EWGC treatment condition. Each EWGC condition was an independent treatment and was part of a randomized block design. The experiments were performed over two years with the same conditions each year in terms of plant materials, treatment methods, and growth and photosynthetic rate measurements. The first-year data were used to develop models or formulate curves; the second-year data were used to validate the developed models and equations. ANOVA was used to assess differences in growth parameters via SAS (SAS 9.2, SAS Institute Inc., Cary, NC, USA). Mean separation was analyzed using LSD tests (p < 0.05).
3. Results
3.1. Growth Parameter Analysis
Four days after commencing low air temperature treatment, the fresh weight of control Kimchi cabbage was 108.2 g/plant. Comparatively, the fresh weight of cabbage treated at 9 °C/6 °C was 54.0 g/plant, approximately 50% that of the control (Table 1). Eighteen days after commencing the low air temperature treatment, the growth of Kimchi cabbage differed significantly. The fresh weight of the control was 1158 g/plant, while that of Kimchi cabbage treated with moderate (15 °C/16 °C) and extreme (12 °C/9 °C and 9 °C/6 °C) low air temperatures was 79%, 62%, and 51% of the control. In contrast, 4 days after commencing moderate and extreme high air temperature treatments, the fresh weight of control Kimchi cabbage was the lowest among all treatments at 93.9 g/plant, while that of Kimchi cabbage treated at 25 °C/22 °C (moderate high air temperature treatment) was 147.9 g/plant (the highest value among all treatments). However, 18 days after commencing moderate and extreme high air temperature treatments, the fresh weight and leaf area of Kimchi cabbage did not differ significantly among treatments (Table 2). Indeed, 16 days after commencing the extreme high temperature treatment (at the heading formation period), fresh weight decreased by 41.4% in cabbage treated with extreme high temperatures (35 °C/31 °C) (data not shown). Extreme high air temperatures severely affected heading formation and development; however, low extreme air temperature treatments did not produce such effects.
3.2. Assessment of Growth Curves and Relative Growth Rate
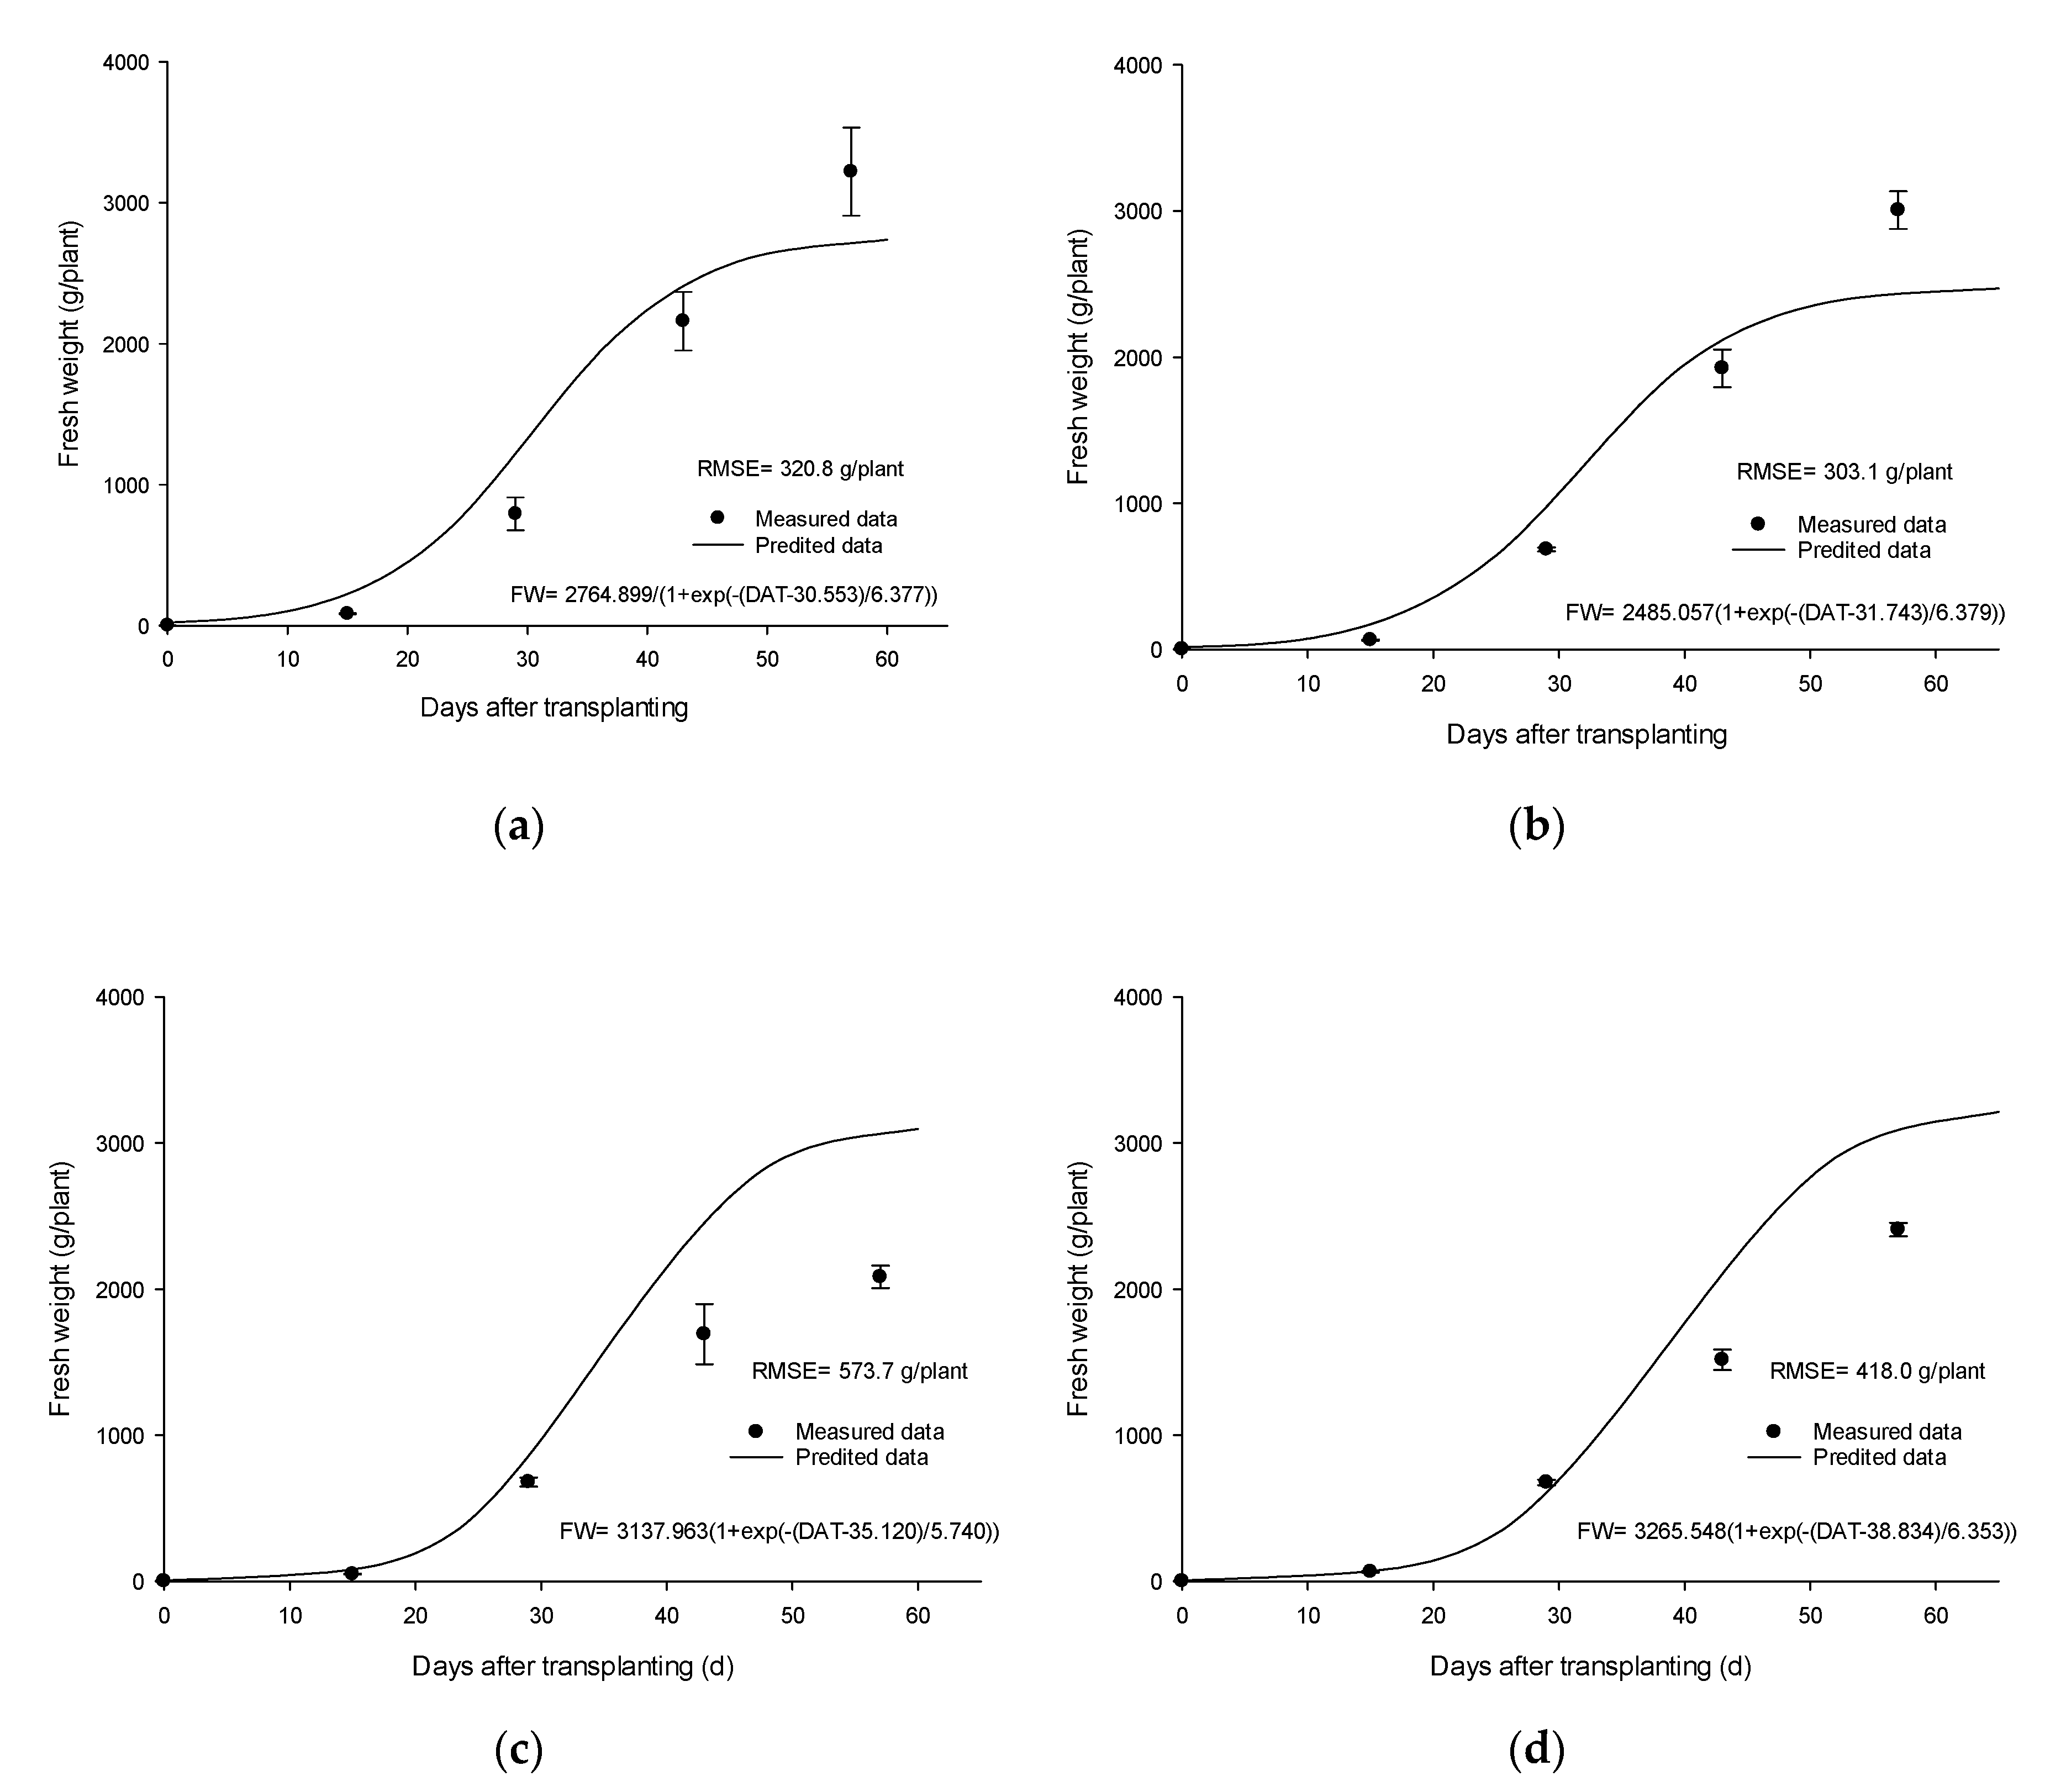
In fresh weight regression analysis including moderate and extreme low air temperature treatments, the DAT on which the fresh weight of Kimchi cabbage increased exponentially was as follows: 31 (control), 32 (15 °C/12 °C), 35 (12 °C/9 °C), and 39 (9 °C/6 °C) (Figure 2). Thus, growth was retarded by extreme low air temperature in the early stage of transplanting. A predictive model for growth inhibition by daily average temperature was developed, and the growth inhibition of Kimchi cabbage according to low air temperature levels in the early stage of transplanting was assessed. The root means square error (RMSE) was calculated between simulated and measured fresh weight values. The RMSE for the control, moderate, and two extreme low air temperature treatments were 321, 303, 575, and 418 g/plant, respectively. Prediction errors can be reduced by using additional statistical data and physiological responses with photosynthetic model-applied data.
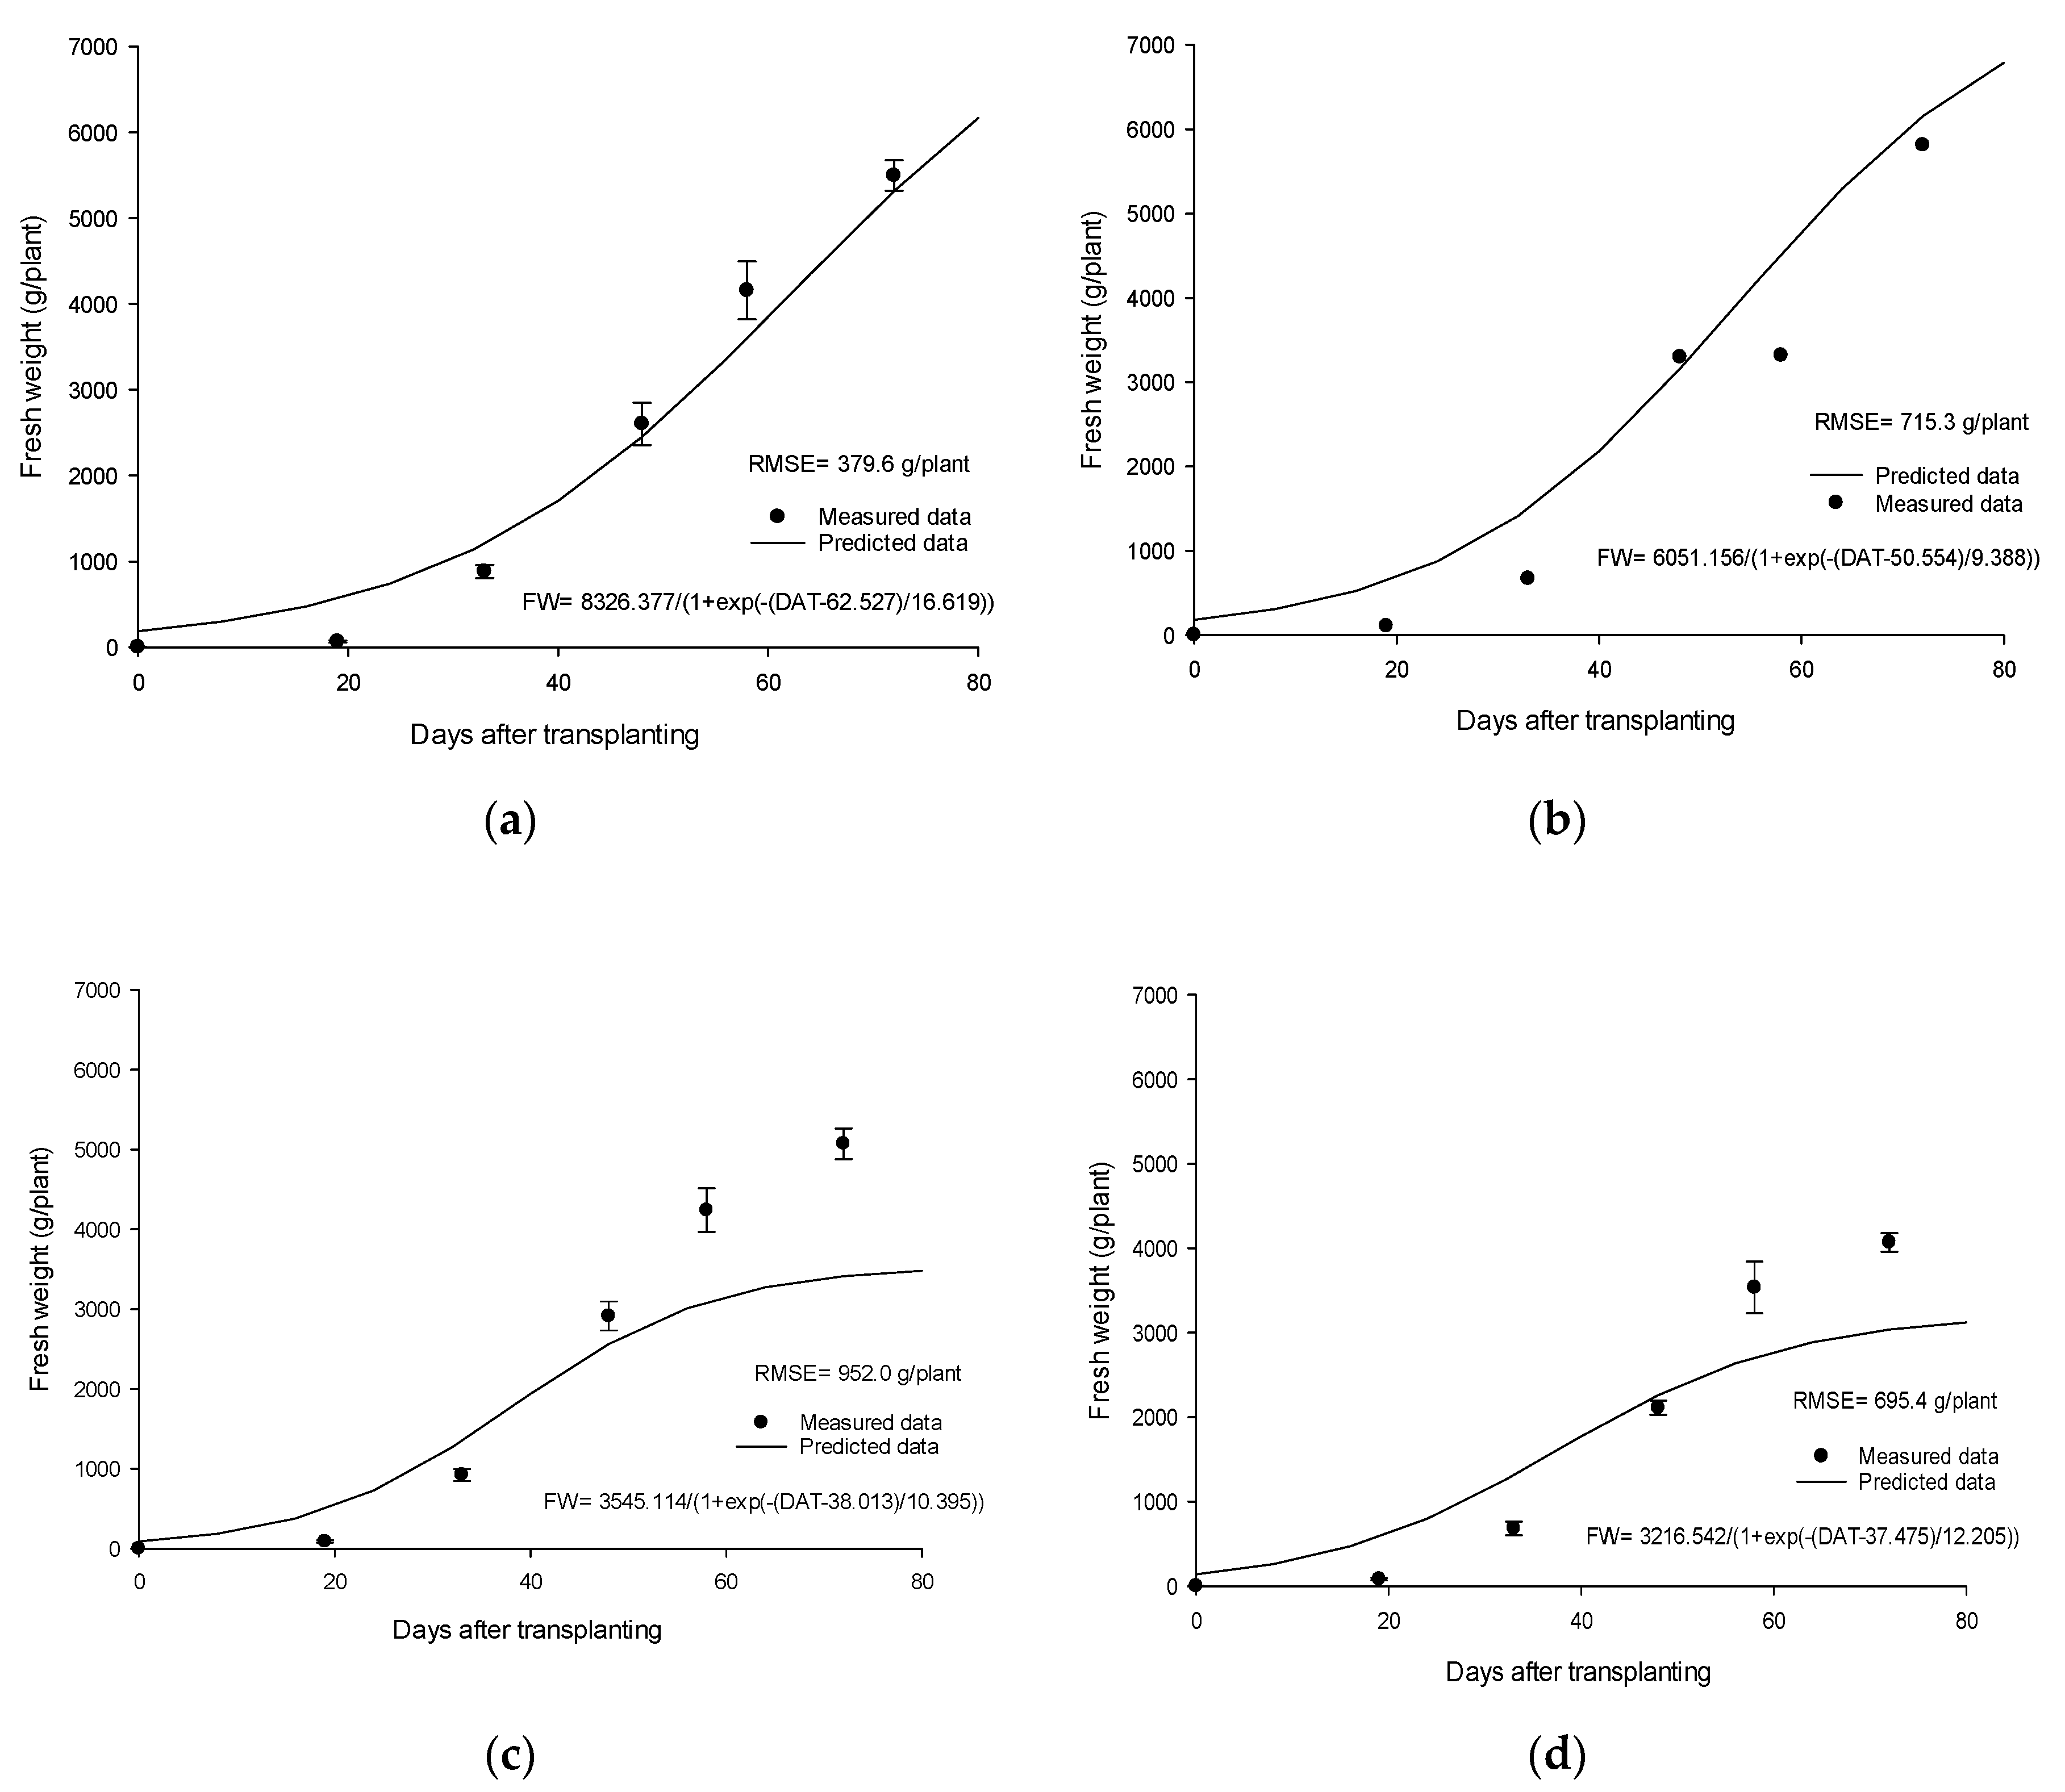
The regression analysis of fresh weight for moderate and extreme high air temperature treatments according to DAT is shown in Figure 3. The time of exponential increase of fresh weight at moderate high air temperature was accelerated relative to the control, although fresh weight did not increase rapidly at extreme high air temperatures (30 °C/27 °C and 35 °C/31 °C) at the beginning of the growth stage. Indeed, fresh weight significantly decreased by approximately 7% and 34% with these extreme high air temperatures, respectively, compared to the control.
According to estimations of the decrease in Kimchi cabbage weight by average daily temperature via the predictive model equation, a 21.9% decrease in Kimchi cabbage weight was expected at 28 °C for 4 days during the constituency period (data now shown). It would be possible to estimate the yield of Kimchi cabbage production when abnormally high air temperature occurs during cultivation periods. In addition, it would be possible to apply practical cultivation techniques to retard growth and reduce yield when extreme high air temperature occurred in the cultivation area of Kimchi cabbage.
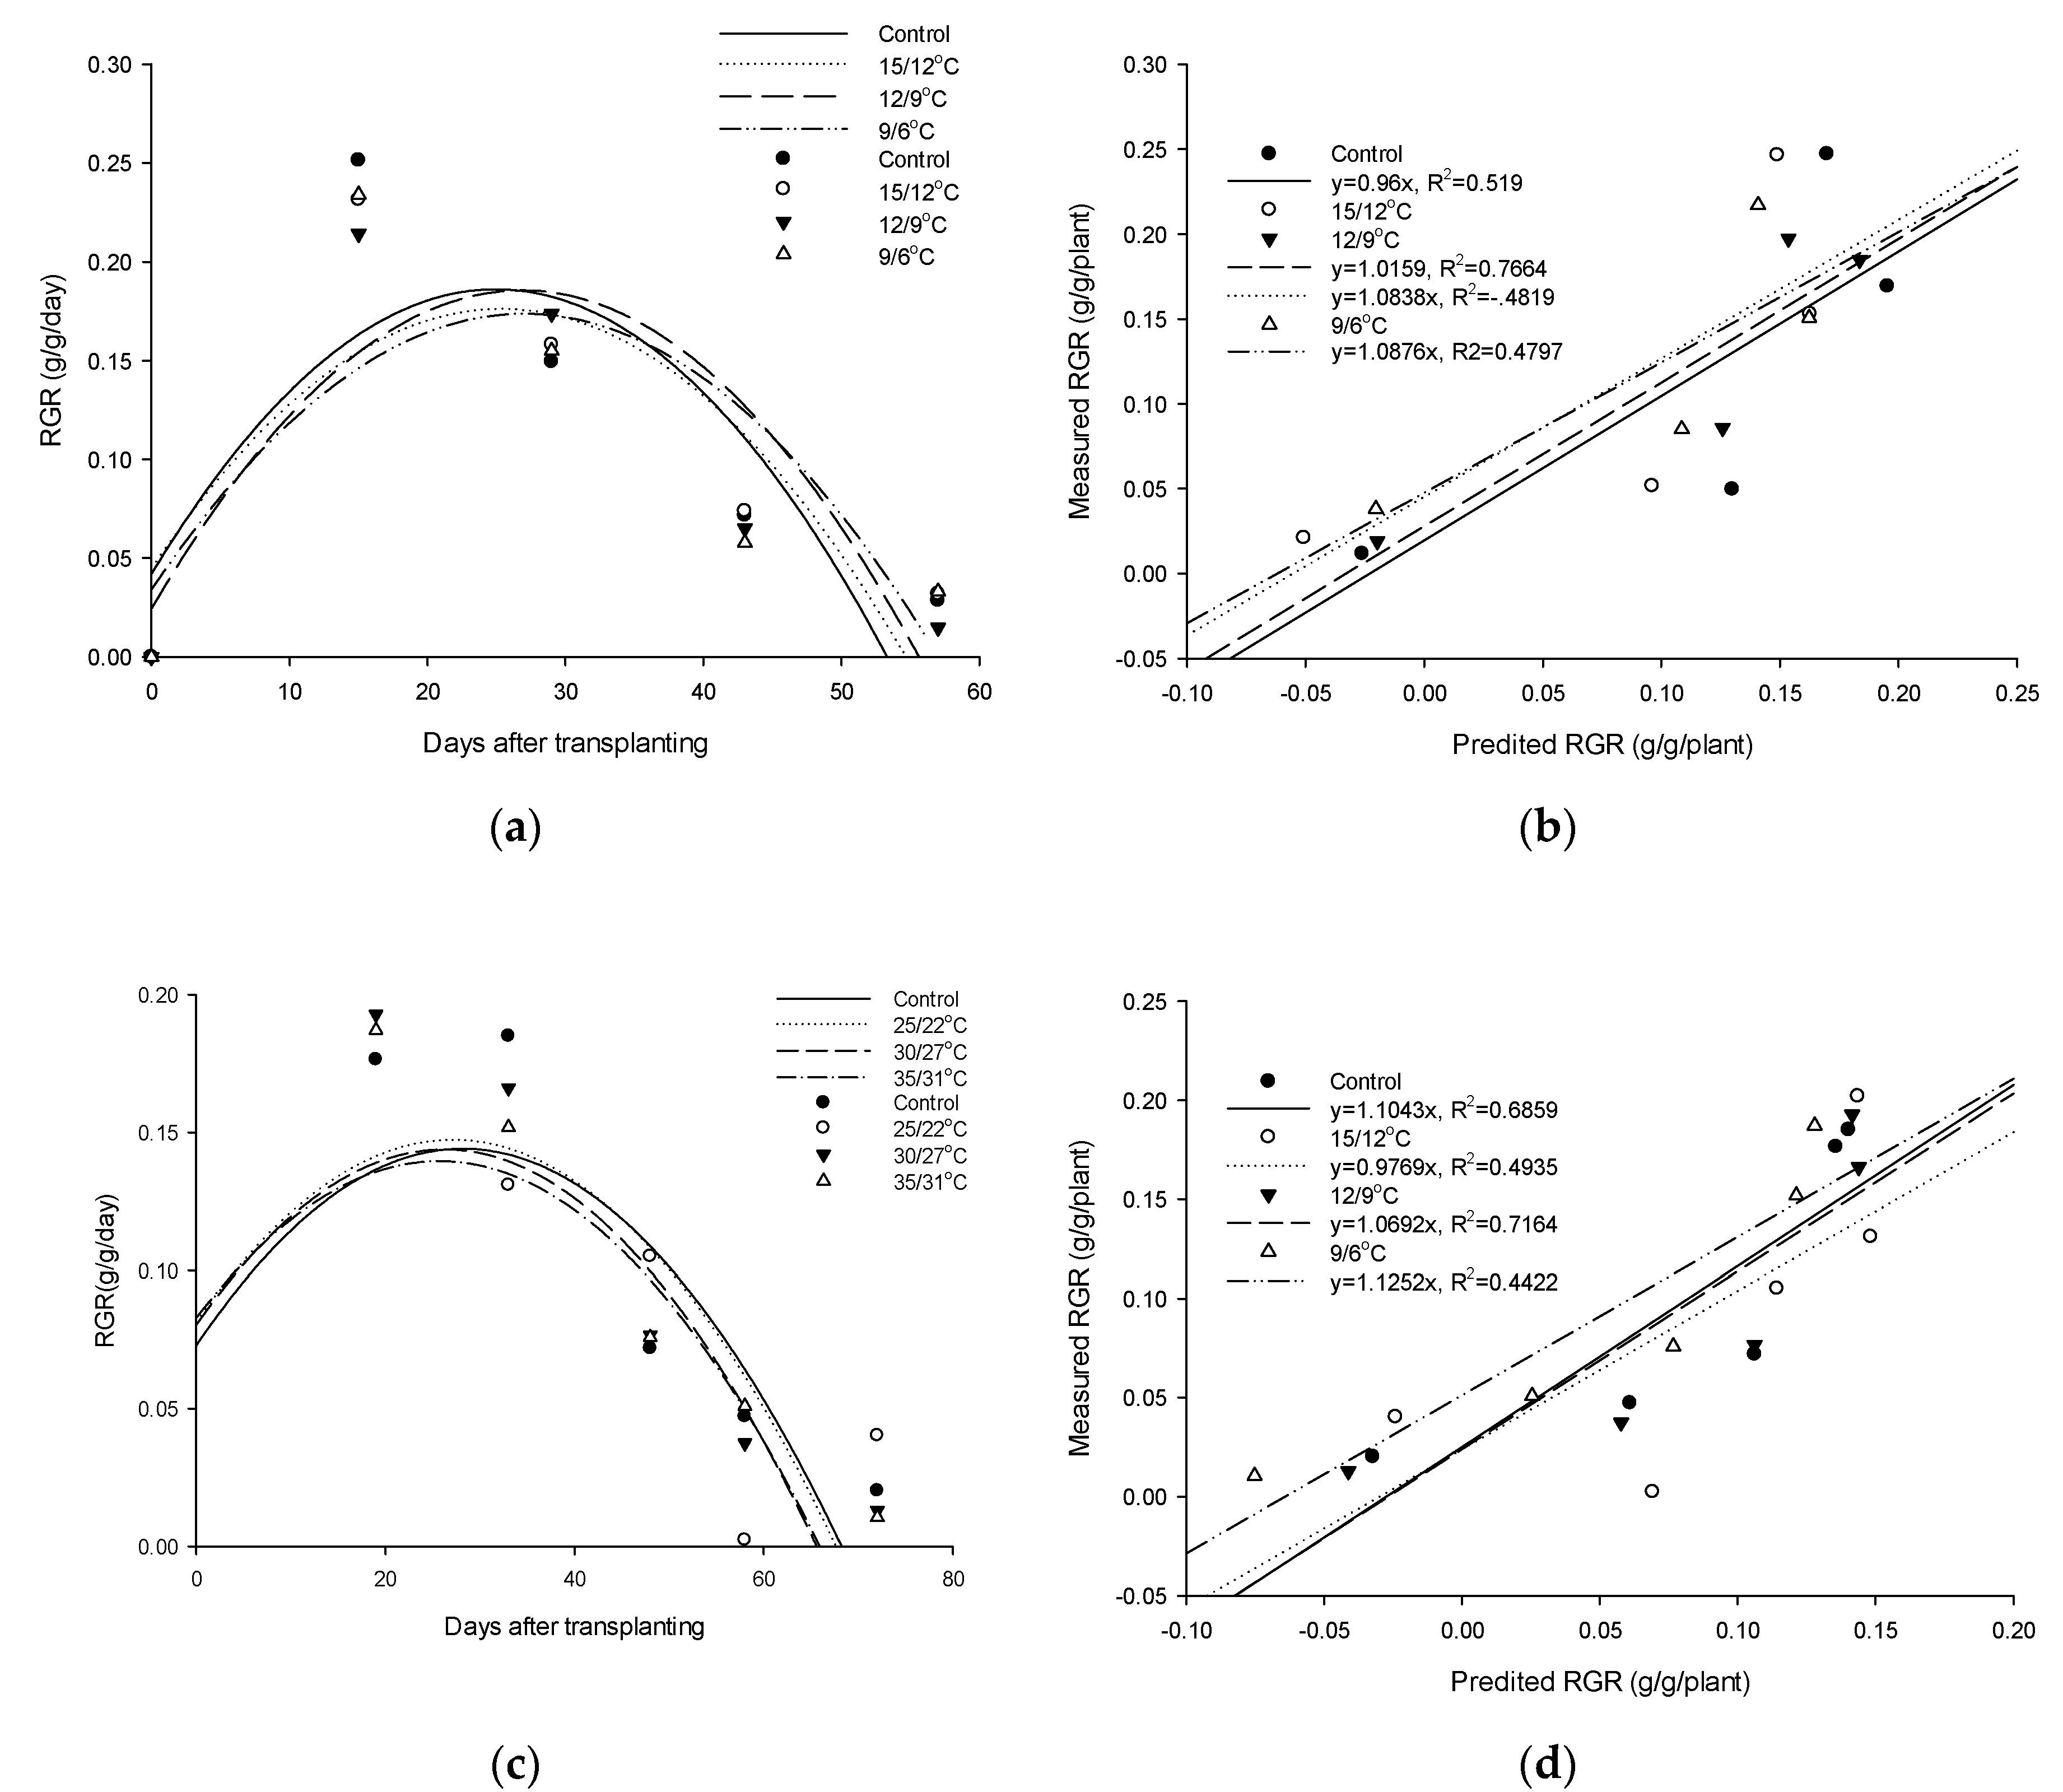
The relative growth rate (RGR) in fresh weight with extreme air temperature treatment is shown in Figure 4. The control had the highest RGR at 0.1861 g/g/day 5 days after the moderate and extreme low air temperature treatment. That was the highest at 26 DAT by the RGR equation. With an extreme low air temperature, the number of days at which the RGR reached a peak was one day later, which represented a ~6.7% reduction compared to the control (Figure 4a). Given RMSE analysis, there was an average difference of 0.047 g/g/d (Figure 4b). The RGR of the control was 0.1441 g/g/day on 27 days after commencing the extreme high air temperature treatment, while that of the extreme high air temperature treatment (35 °C/31 °C) was highest at 0.1396 g/g/day. The number of days at which the RGR reached a peak with extreme high air temperature treatment was 2 days earlier, which represented a ~3.1% decrease compared to the control (Figure 4c). According to RMSE analysis, there was an average difference of 0.044 g/g/d (Figure 4d). After correlating the predicted and measured values, the growth and development of head formation in Kimchi cabbage with moderate and extreme weather events could be analyzed.
3.3. Comparative Assessment of the Developed Photosynthetic Rate Model
The Thornley model was applied to develop a photosynthetic model of Kimchi cabbage. The constants used in the model equation included photochemical efficiency (μmol CO2/mol), carboxylation conductance (/s), and dark respiration (μmol CO2/m2/s). Constant values were obtained by regressing the An-Ci curves, and the constants p and q were calculated by regressing from these values in Kimchi cabbage growth stages (Table 3 and Table 4). These constant values differed significantly with moderate and extreme weather treatments. Photochemical efficiency and carboxylation conductance values decreased with the number of DAT, whereas dark respiration values increased; their tendency varied by treatment. By applying the constant values to the Thornley model via regression analysis, a photosynthesis model for each temperature treatment was developed (model Equations (7)–(14)). The equations are shown in the following order: spring season cultivation (control, 15 °C/12 °C, 12 °C/9 °C, and 9 °C/6 °C) and autumn season cultivation (control, 25 °C/22 °C, 30 °C/27 °C, and 35 °C/31 °C).
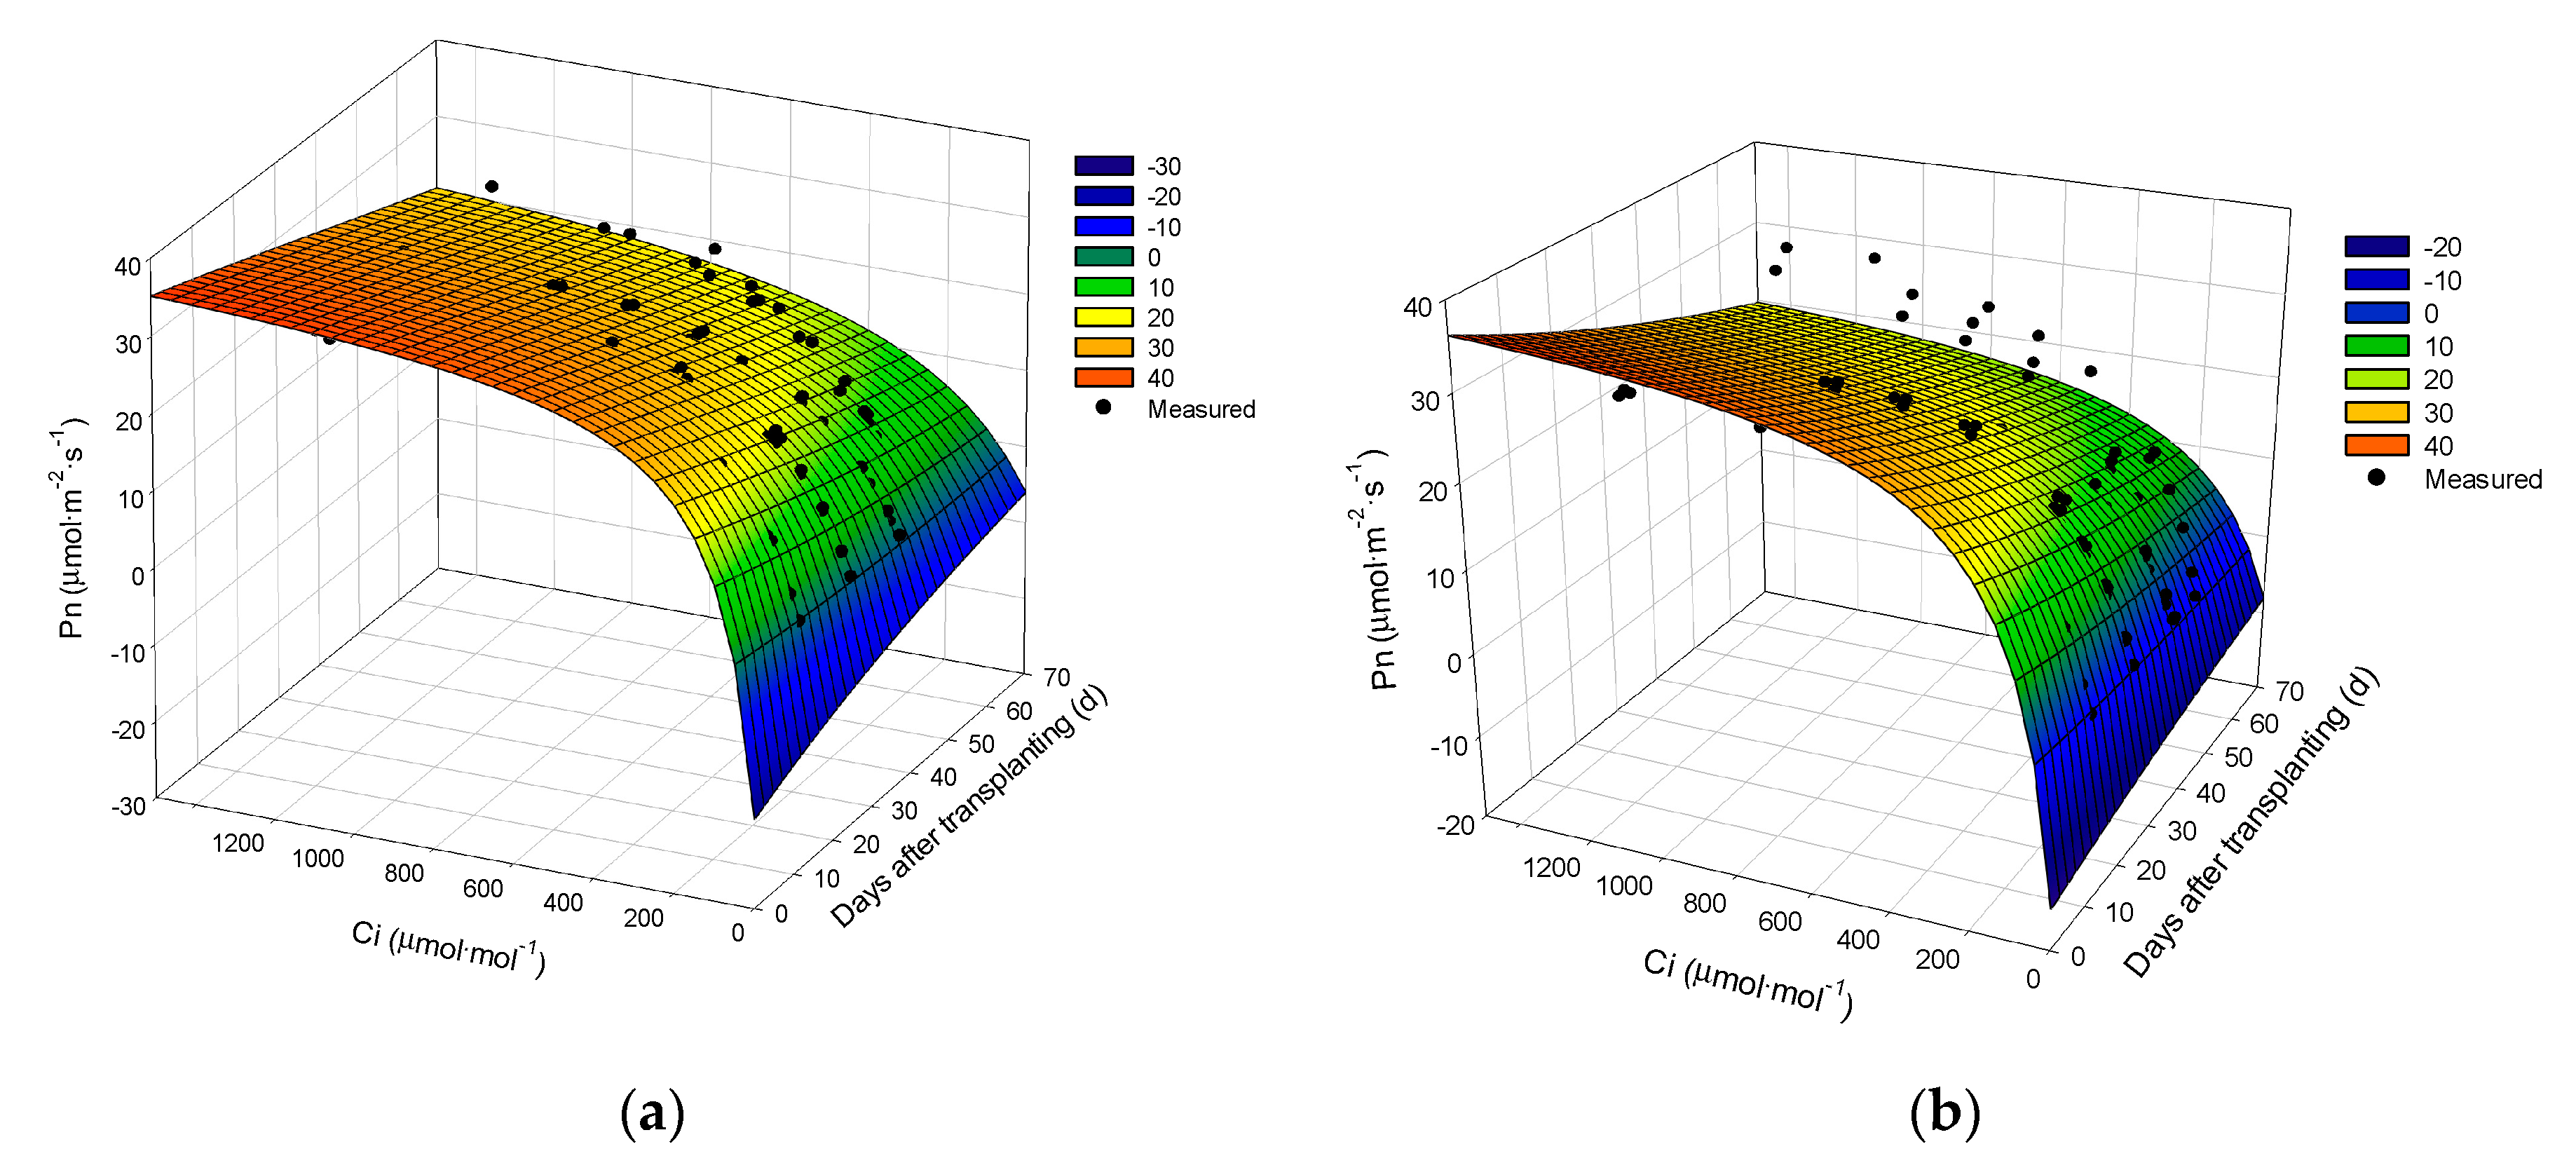
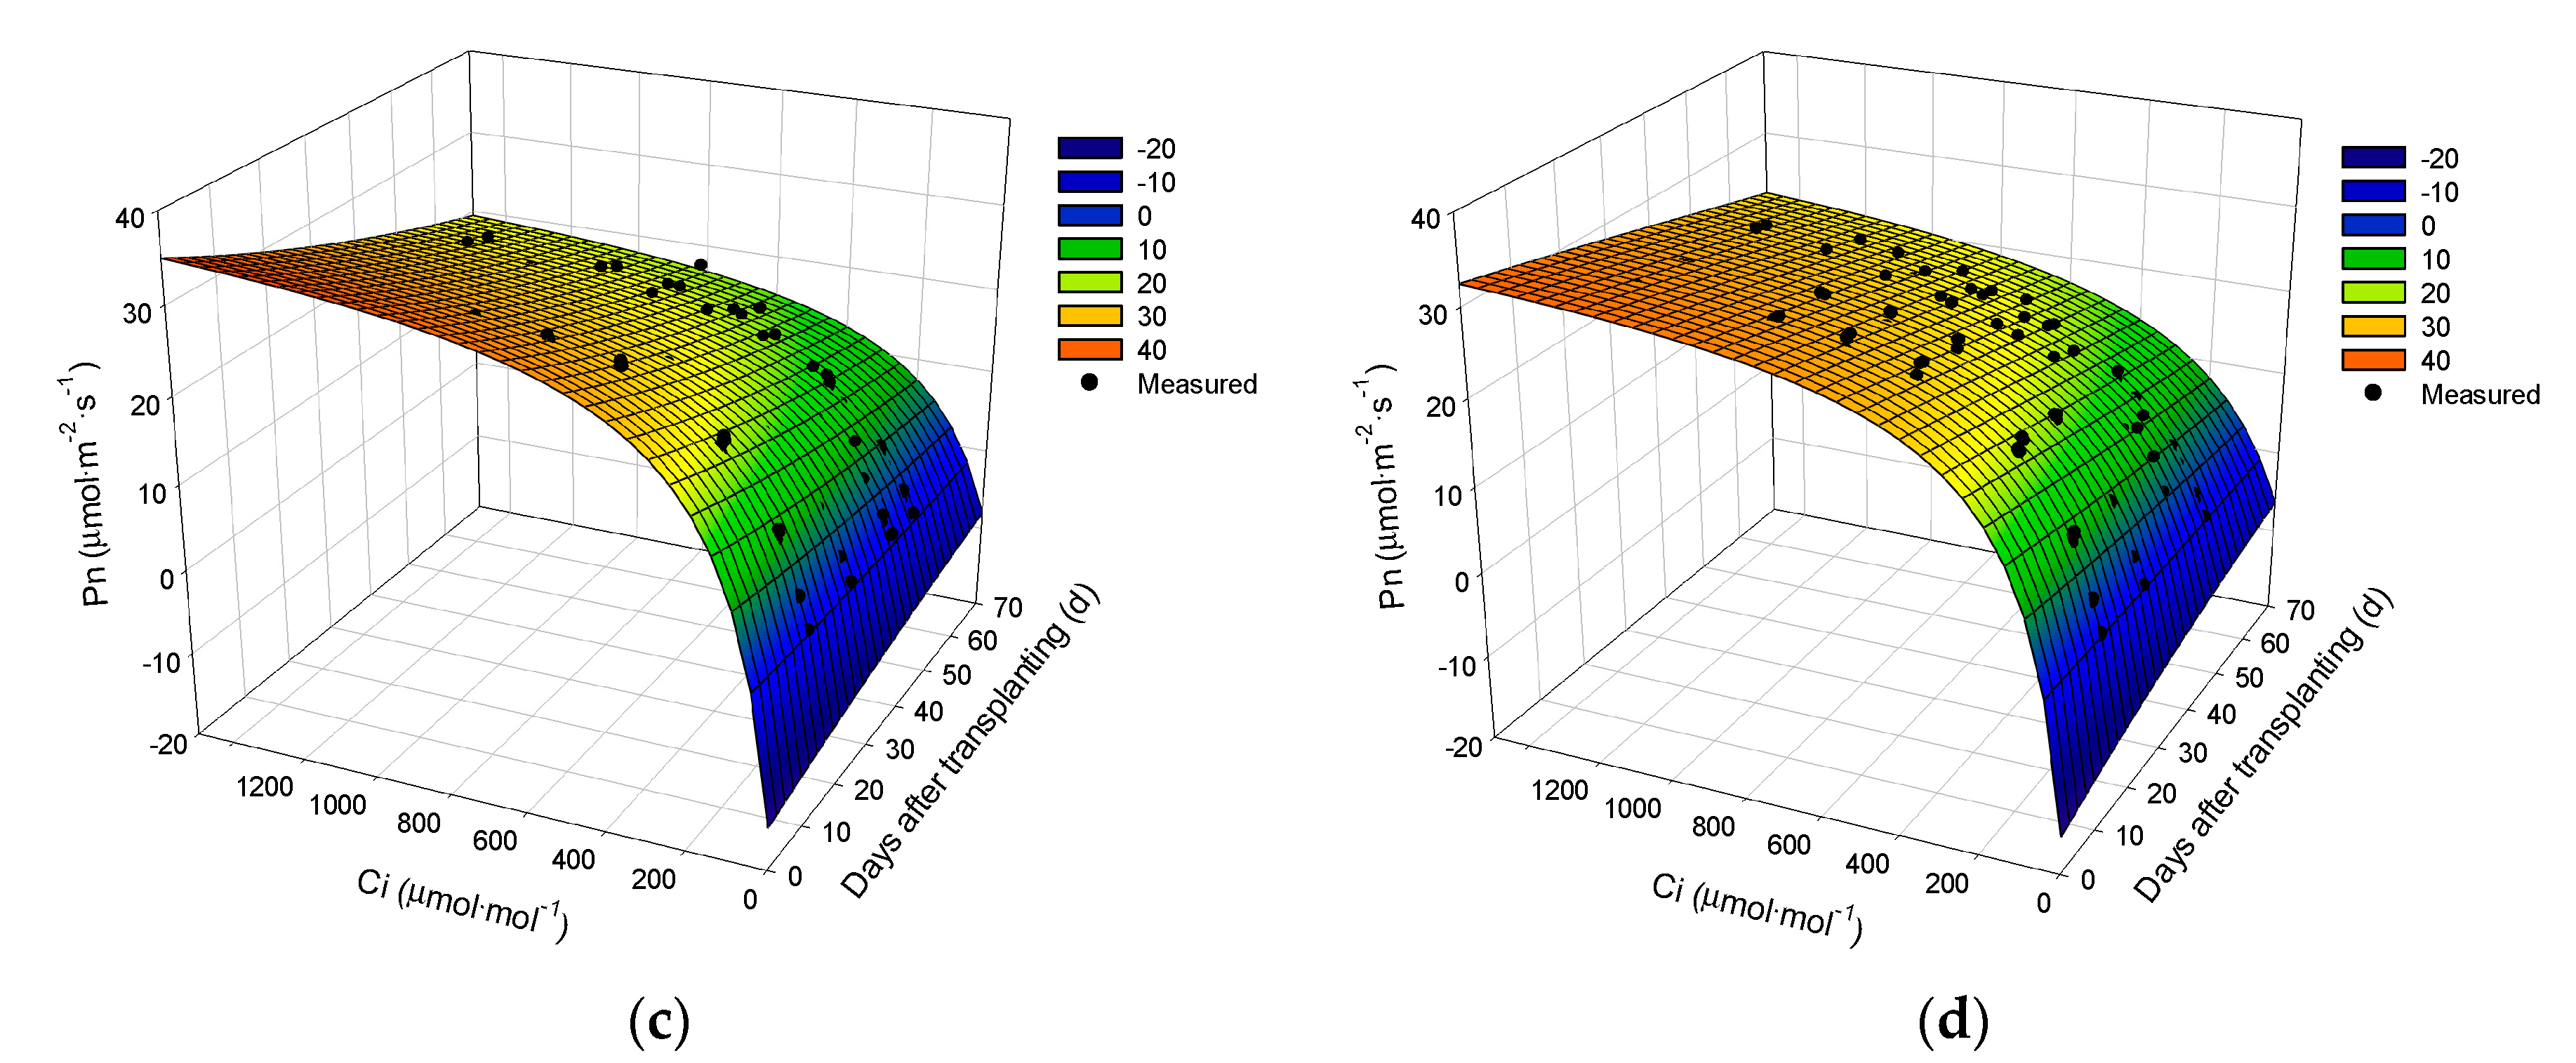
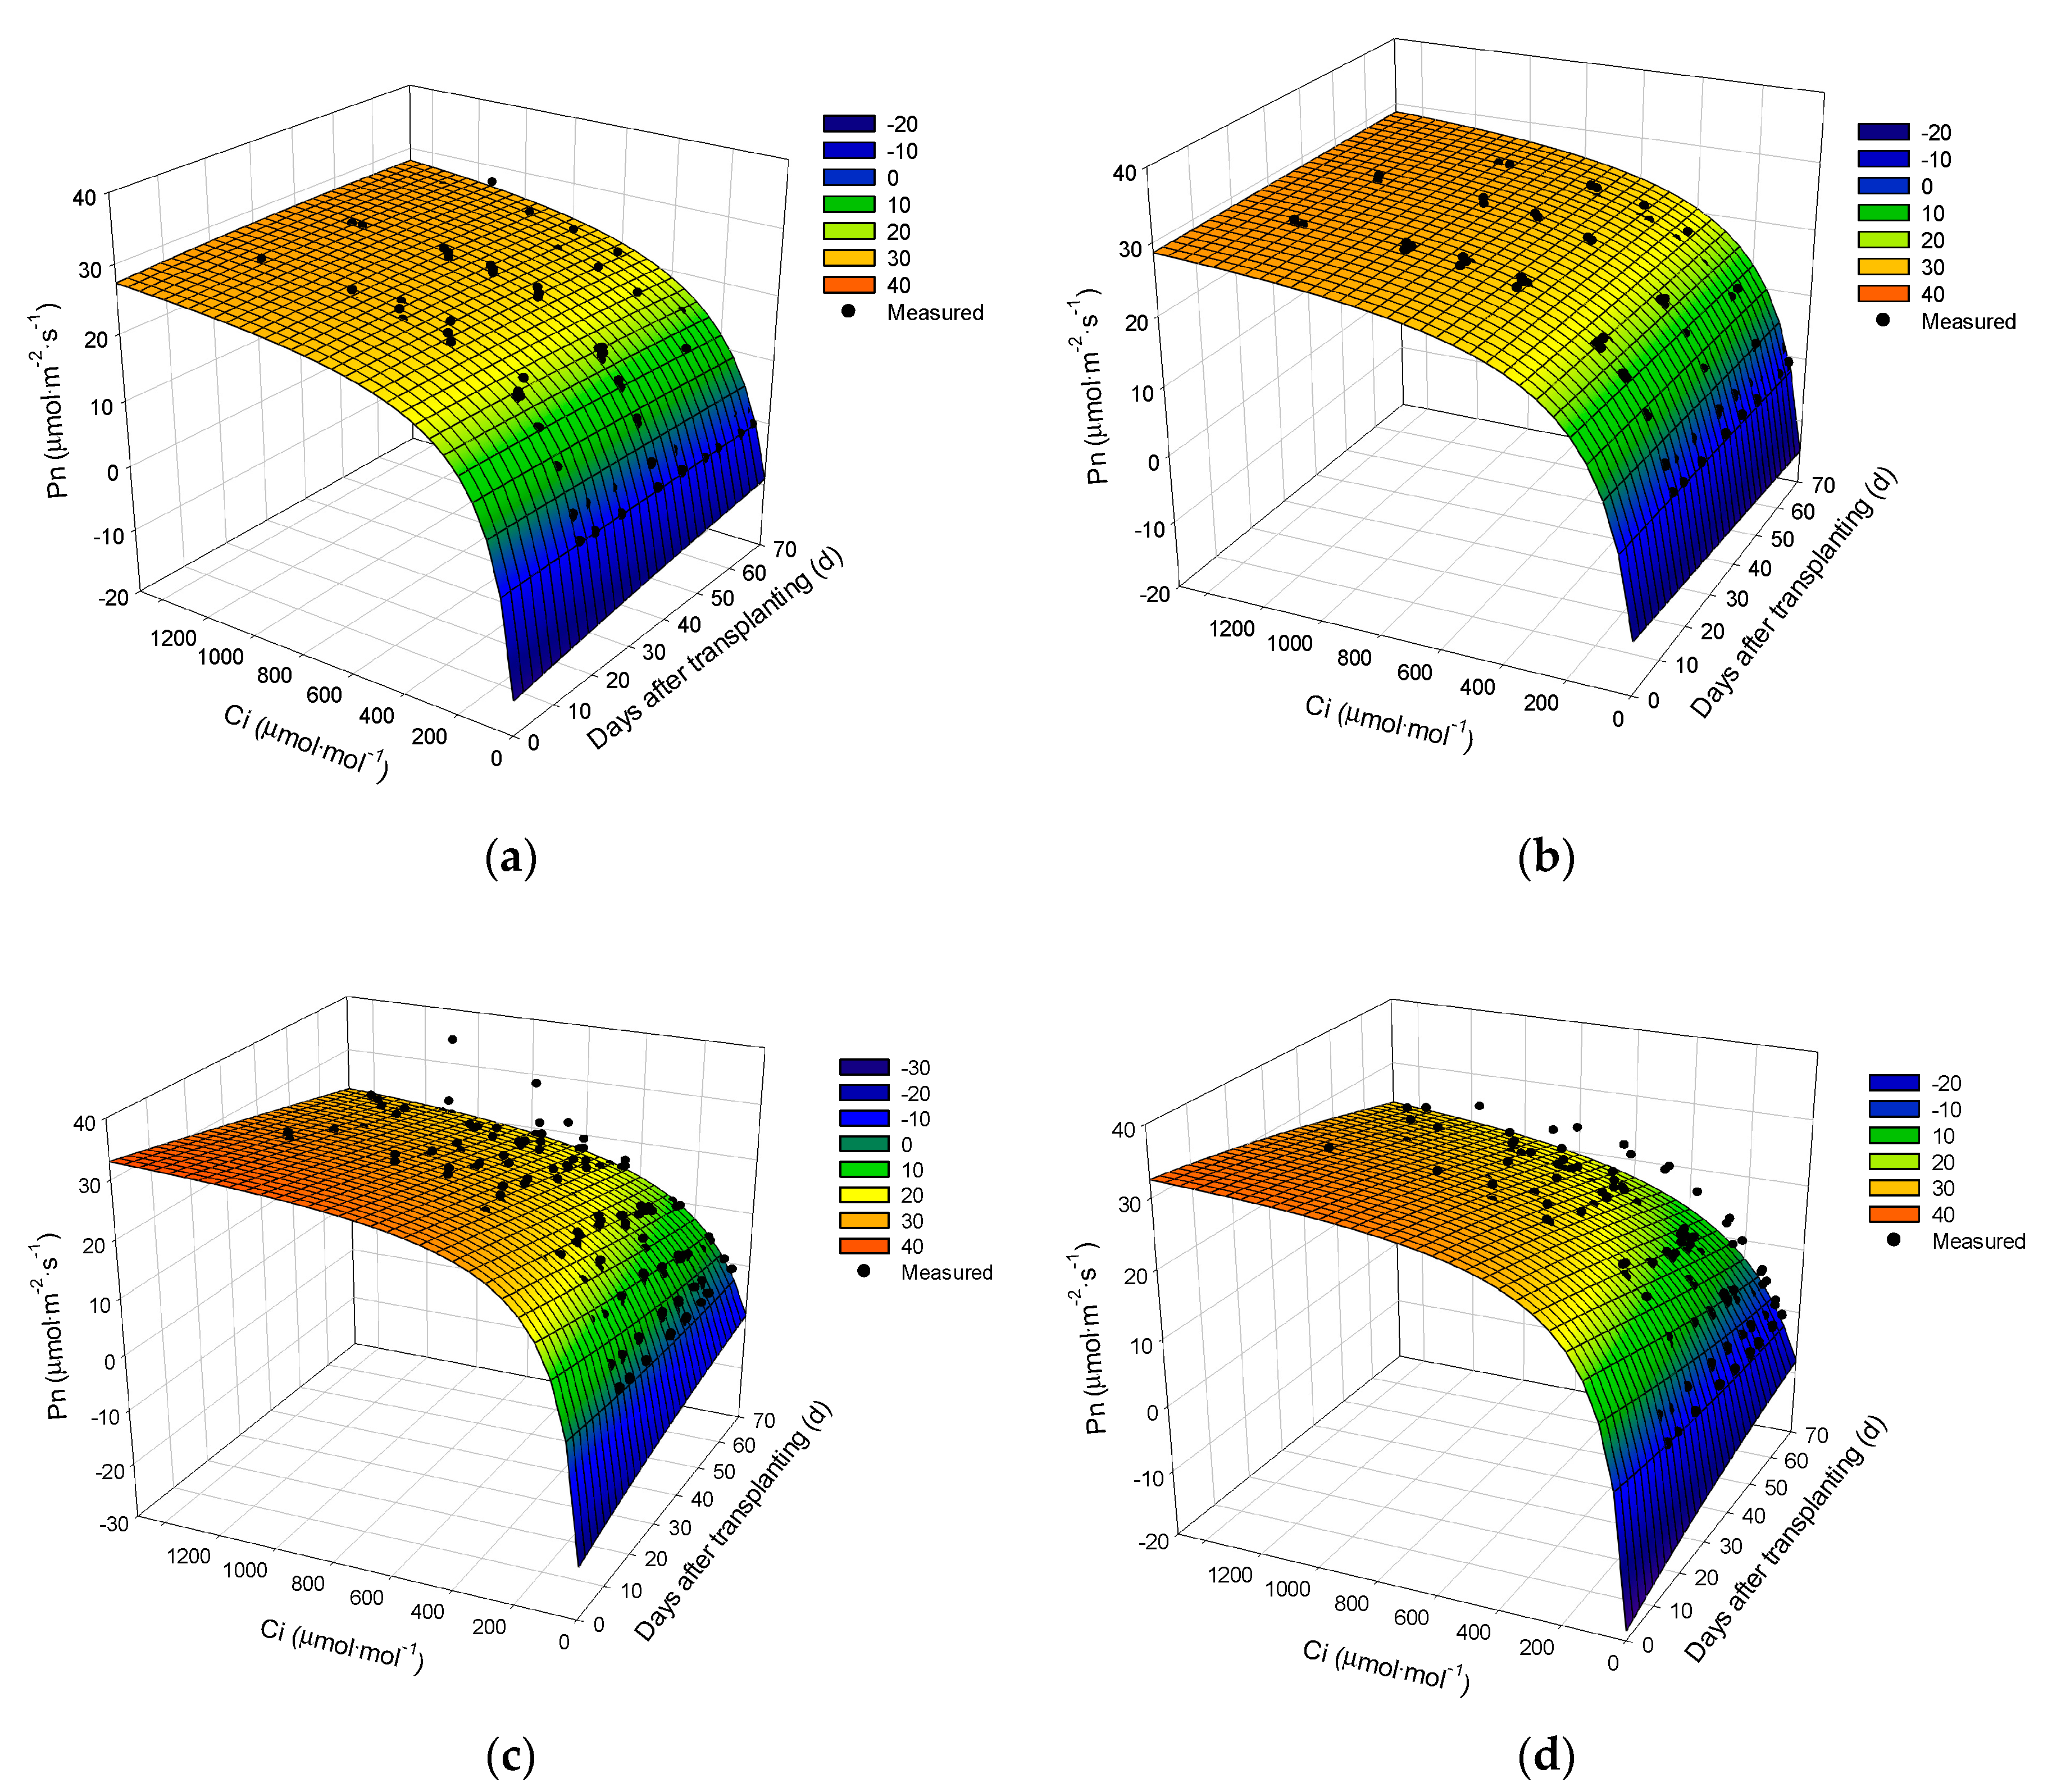
The developed photosynthetic models were simulated with DAT and the concentration of intercellular CO2 and then validated with data from the second-year experiments (Figure 5 and Figure 6). The simulated net photosynthetic rates (s-An) differed according to extreme weather treatment: the s-An from the extreme high temperature treatment was 19.7 μmol/m2/s, which was approximately 3% lower than that of the control. Biochemical models can be simulated by growth stage and levels of CO2 concentration in mesophyll cells; the parameters were estimated through regression analysis with the measured data by creating An-Ci curves for each growth stage. According to the RMSE of the photosynthetic rate at each growth stage and validation with data measured in the second year, there were differences of 3.1 (spring season cultivation) and 4.7 (autumn season cultivation) μmol/m2/s. Correction is likely to be possible due to the high coefficient of determination (R2 = 0.92) of the correlation analysis results; however, the predicted values for photosynthetic rate were estimated to be lower or higher than the measured values.
4. Discussion
4.1. Growth of Kimchi Cabbage during Extreme Weather Events
Kimchi cabbage is a well-known cool-season crop; the optimal average daily temperature is 20 °C–22 °C for growth and 16 °C–18 °C for proper formation of the Kimchi cabbage head [1,7,16,17,26,27,28,29,30,31,32]. However, given that Kimchi cabbage is a material for raw Kimchi, it must be produced stably throughout the year. Thus, in Korea, Kimchi cabbage is planted in late June in alpine areas (>700 m elevation) and harvested in August (the summer season cultivation). For autumn season cultivation, Kimchi cabbage is transplanted at the end of August in the South West area of Korea (Haenam) with the harvest being conducted in mid- or late-November. Due to climate change, abnormally low air temperatures now occur during the summer planting season in the highland regions, which cause damage to production. In the autumn season, extremely high air temperature in early autumn affects the growth and physiological responses of planted Kimchi cabbage [4,33]. The present study was performed using cutting-edge climate change research apparatus (EWGCs) capable of realizing extreme weather events; thus, a precisely controlled study of weather conditions was conducted. Results showed that the initial growth stage of Kimchi cabbage was delayed by low air temperature. Kimchi cabbage is particularly sensitive to weather and environmental stress; indeed, physiologically active substances in Kimchi cabbage can be reduced even under low temperature stress [11,22,23]. In contrast, high-temperature stress decreases growth and physiological reaction activity [2,6,16,30,34,35,36].
In the present study, the fresh weight and relative growth rate of Kimchi cabbage rapidly decreased with high air temperature in the early growth stage and continuum period (leaf elongation and heading stage) after commencing treatments; this resulted in significantly retarded head formation and development. These results were similar to those reported in previous studies [4,33]. They were also similar to the results of studies of Kimchi cabbage productivity according to climate change scenarios and the decreased physiological activity of cabbage due to long-term high-temperature stress [34,37]. The growth curves and relative growth in the present study will enable the evaluation of crop damage due to extreme weather (high or low temperatures) in certain crop types. This sort of study could be used in other research studies on climate change or environmental stress.
4.2. Prediction of Photosynthetic Rate of Kimchi Cabbage
A crop growth model is a mathematical description of the physiological response or growth process that occurs in the growth and development of a crop. The elements that comprise the growth model include weather parameters, such as temperature, relative humidity, radiation, wind speed, rainfall, and soil moisture, and state values of growth, including photosynthesis, respiration, and evaporation. The relationships of each parameter and the state values of growth and development are considered [20,21,22,23,29,38,39,40,41,42,43,44,45].
In crop growth models, the instantaneous rate of change in terms of photosynthesis, respiration, elongation, and development of leaves is calculated according to changes in the environment to represent the overall system change numerically. Correction by calibration and validation is important for improving the accuracy of model prediction [20,25,38,39,40]. The rate of photosynthesis of crops can be calculated from the assimilation rate of CO2, which can be accurately measured. Methods for modeling crop assimilation have changed gradually. For example, de Wit [46] calculated total dry matter production based on the photosynthetic reaction curve of leaves. However, this model underestimated CO2 assimilation rate at the light saturation point. Therefore, Goudriaan and van Laar [47] produced a modified equation using exponential models. Another method for simulating photosynthesis was proposed by Monteith [48]. A clear linear relationship was revealed between dry weight and cumulative blocked radiation; this was expressed as an equation measuring how efficiently solar radiation blocked by the plant canopy is converted into dry weight.
On the other hand, according to the biochemical approach of Farquhar et al. [45], the photosynthetic properties of leaves can be expressed in terms of the Rubisco enzyme reaction and electron transfer rate. As the concentration of CO2 outside the crop canopy increases, the speed of photosynthesis increases because the physical resistance is lowered, enabling rapid diffusion of CO2 and inhibiting the combination of rubisco and oxygen, the cause of photorespiration. These theoretical concepts were developed as biochemical model equations and programmed to judge the efficiencies of the photosynthetic mechanism of crops [49,50]. Lee et al. [4] applied the model to evaluate the photosynthetic efficiencies of Kimchi cabbage according to climate change scenarios. In addition, Kim et al. [51] developed photosynthetic models of roses by combining Farquhar’s leaf-level photosynthesis model and Ball-Berry’s stomatal diffusion conductivity model. A plant gas exchange simulator has also been created and disseminated. However, use of Thornley’s dynamic photosynthesis model is appropriate when measuring photosynthetic rates [52].
In the present study, using Thornley’s photosynthesis model, we developed a model that can simulate photosynthesis during the growth stage of Kimchi cabbage according to extreme weather (low and high temperatures). Eight different equation models were determined for predicting photosynthetic rate. By repeating our experiment in a second year, the predicted values of photosynthetic rate were validated with the resultant data. Those models simulated by growth stage and carbon dioxide in mesophyll cells, and parameters can be inferred through regression analysis using the measured data by creating a carbon dioxide saturation curve for each cultivation period. Early after transplanting, the maximum photosynthesis rate of Kimchi cabbage decreased by 9.1% compared to the control by extreme low air temperate treatment, while the photosynthetic efficiency decreased by 36.1% compared to the control in the extreme high air temperature treatment during the autumn cultivation season. It was able to judge the inhibition of growth and biomass production. Although there were errors in this validation, we nevertheless developed a tool to evaluate the impact of extreme weather events due to climate change by using a photosynthetic model to predict the photosynthetic rate under CO2 limiting conditions with air temperature stress for each Kimchi cabbage growth stage.
5. Conclusions
The growth parameters and relative growth rate of Kimchi cabbage decreased due to extreme low and high air temperature treatments. In particular, encountering extreme weather in a short period at the early growth stage severely affected growth, head formation, and development. Therefore, the Kimchi cabbage production is seriously vulnerable to climate change and tools to accurately calculate potential damage should be developed. Here, a modified Thornley model that predicts photosynthesis according to growth stage and the degree of damage from extreme weather was developed and validated. The developed photosynthetic model can predict the dynamic physiological response of Kimchi cabbage to extreme weather by cultivation region and crop type; thus, it could be used to evaluate practical damage-reducing cultivation methods prior to their application. In addition, rather than evaluating the vulnerability of crop productivity to long-term climate change, it can be used as the evaluation tools for rapid countermeasures and adaptation technology development for dynamic extreme weather.
Author Contributions
Conceptualization, S.K.K.; formal analysis, H.J.L.; investigation, S.A.; writing—original draft preparation, project administration, and funding acquisition, S.H.W.; writing—review and editing, supervision, S.K.K. All authors have read and agreed to the published version of the manuscript.
Funding
This research was funded by Rural Development Administration, Republic of Korea grant number Project No. PJ01196501.
Acknowledgments
This work was carried out with the support of the “Cooperative Research Program for Agriculture, Science & Technology (Project No. PJ01196501),” Rural Development Administration, Republic of Korea.
Conflicts of Interest
The authors declare no conflict of interest.
References
- Openart, R.T.; Lo, S. Genetics of heat tolerance in heading Chinese cabbage. HortScience 1979, 14, 33–34. [Google Scholar]
- Choi, E.Y.; Seo, T.C.; Lee, S.G.; Cho, I.H.; Stangoulis, J. Growth and physiological responses of Chinese cabbage and radish to long-term exposure to elevated carbon dioxide and temperature. Hortic. Environ. Biotechnol. 2011, 52, 376–386. [Google Scholar] [CrossRef]
- Son, I.C.; Moon, K.H.; Song, E.Y.; Oh, S.; Seo, H.; Moon, Y.E.; Yang, J. Effect of differentiated temperature based on growing season temperature on growth and physiological response in Chinese cabbage ‘Chunkwang’. Kor. J. Agric. For. Meteorol. 2015, 17, 254–260. [Google Scholar] [CrossRef] [Green Version]
- Lee, S.G.; Kim, S.K.; Lee, H.J.; Choi, C.S.; Park, S.T. Impacts of climate change on the growth, morphological and physiological responses, and yield of Kimchi cabbage leaves. Hortic. Environ. Biotechnol. 2016, 57, 470–477. [Google Scholar] [CrossRef]
- Lee, S.G.; Kim, S.K.; Lee, H.J.; Lee, H.S.; Lee, J.H. Impact of moderate and extreme climate change scenarios on growth, morphological features, photosynthesis, and fruit production of hot pepper. Ecol. Evol. 2018, 8, 197–206. [Google Scholar] [CrossRef] [Green Version]
- Lee, S.G.; Moon, J.H.; Jang, Y.A.; Kim, S.Y.; Ko, K.D. Change of photosynthesis and cellular tissue under high CO2 concentration and high temperature in Radish. Kor. J. Hortic. Technol. 2009, 27, 194–198. [Google Scholar]
- Oh, S.; Moon, K.H.; Song, E.Y.; Son, I.C.; Koh, S.C. Photosynthesis of Chinese cabbage and radish in response to rising leaf temperature druing spring. Hortic. Environ. Biotechnol. 2015, 56, 159–166. [Google Scholar] [CrossRef]
- Zhang, X.D.; Wang, R.P.; Zhang, F.J.; Tao, F.Q.; Li, W.Q. Lipid profiling and tolerance to low-temperature stress in Thellungiella salsuginea in comparison with Arabidopsis thaliana. Biol. Plant. 2013, 57, 149–153. [Google Scholar] [CrossRef]
- Goh, C.H.; Ko, S.M.; Koh, S.; Kim, Y.J.; Bae, H.J. Photosynthesis and environments: Photoinhibition and repair mechanisms in plants. J. Plant Biol. 2012, 55, 93–101. [Google Scholar] [CrossRef]
- Farooq, M.; Aziz, T.; Wahid, A.; Lee, D.J.; Siddique, K.H.M. Chilling tolerance in maize: Agronomic and physiological approaches. Crop Pasture Sci. 2009, 60, 501–516. [Google Scholar] [CrossRef]
- Huang, F.; Wang, J.; Duan, W.; Hou, X. Identification and expression analysis of cold shock protein 3 (BcCSP3) in non-heading Chinese cabbage (Brassica rapa ssp. chinensis). Plants 2020, 9, 890. [Google Scholar] [CrossRef] [PubMed]
- Hu, C.; Hou, X.; Wang, M. Effects of low temperature on photosynthetic and fluorescent parameters of non-heading Chinese cabbage. Acta Bot. Boreali-Occident. Sin. 2008, 28, 2478–2484. [Google Scholar]
- Zhang, S.; Zhang, Z.; Zhnag, H.; Kong, Y. Growth, physiological and biochemical characteristics of non-heading Chinese cabbage under low temperature stress. Acta Bot. Boreali-Occident. Sin. 2008, 28, 109. [Google Scholar]
- Korean Statistical Information Service. 2018. Available online: https://kosis.kr/index/index.do (accessed on 1 December 2018).
- Ministry of Agriculture, Farm Primary Statistics for Agriculture Production. 2019. Available online: http://www.mafra.go.kr/main.jsp (accessed on 1 November 2018).
- Lee, S.G.; Lee, H.J.; Kim, S.K.; Choi, C.S.; Park, S.T.; Jang, Y.A.; Do, K.R. Effects of vernalization, temperature, and soil drying periods on the growth and yield of Chinese cabbage. Kor. J. Hortic. Sci. Technol. 2015, 33, 820–828. [Google Scholar]
- Oh, S.; Moon, K.H.; Son, I.C.; Song, E.Y.; Moon, Y.E.; Koh, S.C. Growth, photosynthesis and chlorophyll fluorescence of chinese cabbage in response to high temperature. Kor. J. Hortic. Sci. Technol. 2014, 32, 318–329. [Google Scholar]
- Lee, S.G.; Seo, T.C.; Jang, Y.A.; Lee, J.G.; Nam, C.W.; Choi, C.S.; Yeo, K.H.; Um, Y.C. Prediction of Chinese cabbage Yield as affected by planting date and nitrogen fertilization for spring production. J. Bio-Environ. Cont. 2012, 21, 271–275. [Google Scholar]
- Medina-Ruíz, C.A.; Mercado-Luna, I.A.; Soto-Zarazúa, G.M.; Torres-Pacheco, I.; Rico-García, E. Mathematical modeling on tomato plants: A review. Afr. J. Agric. Res. 2011, 6, 6745–6749. [Google Scholar] [CrossRef]
- Steffen, M.N.; Giersch, C. Simple dynamic model of photosynthesis in oak leaves: Coupling leaf conductance and photosynthetic carbon fixation by a variable intercellular CO2 pool. Funct. Plant Biol. 2004, 31, 1195–1204. [Google Scholar]
- Johnson, I.R.; Thornley, J.H.M.; Frantz, J.M.; Bugbee, B. A model of canopy photosynthesis incorporating protein distribution through the canopy and its acclimation to light, temperature and CO2. Ann. Bot. 2010, 106, 735–749. [Google Scholar] [CrossRef] [Green Version]
- Thornley, J.H.M. Light fluctuations and photosynthesis. Ann. Bot. 1974, 38, 363–373. [Google Scholar] [CrossRef]
- Kaitala, V.; Hari, P.; Vapaavuori, E.; Salminen, R. A dynamic model for photosynthesis. Ann. Bot. 1982, 50, 385–396. [Google Scholar] [CrossRef]
- Green, C.F. Nitrogen nutrition and wheat growth in relation to absorbed solar radiation. Agric. For. Meteorol. 1987, 41, 207–248. [Google Scholar] [CrossRef]
- Jung, D.; Kim, D.; Yoon, H.; Moon, T.; Park, K.; Son, J. Modeling the canopy photosynthetic rate of romaine lettuce (Lactuca sativa L.) grown in a plant factory at varying CO2 concentrations and growth stages. Hortic. Environ. Biotechnol. 2016, 57, 487–492. [Google Scholar] [CrossRef]
- Son, I.C.; Moon, K.H.; Song, E.Y.; Oh, S.J.; Moon, Y.I. Effects of temperature according to the climate change scenario on growth pattern and physical response of ‘Chunkwang’ Chinese cabbage. Kor. J. Hortic. Sci. Technol. 2014, 32 (Suppl. I), 128. [Google Scholar]
- Ahn, J.H.; Kim, K.D.; Lee, J.T. Growth modeling of Chinese cabbage in an alpine area. Kor. J. Agric. For. Meteorol. 2014, 16, 309–315. [Google Scholar] [CrossRef] [Green Version]
- Cho, J.H.; Suh, J.M.; Kang, J.S.; Hong, C.O.; Shin, H.M.; Lee, S.G.; Lim, W.T. The economic impacts of abnormal climate on fall Chinese cabbage farmers and consumers. J. Environ. Sci. Int. 2013, 22, 1691–1698. [Google Scholar] [CrossRef] [Green Version]
- Kalisz, A.; Kostrzewa, J.; Sekara, A.; Grabowska, A.; Cebula, S. Yield and nutritional quality of several non-heading chinese cabbage (Brassica rapa var. chinensis) cultivars with different growing period and its modelling. Kor. J. Hortic. Sci. Technol. 2012, 30, 650–656. [Google Scholar] [CrossRef]
- Lee, S.G.; Moon, J.H.; Jang, Y.A.; Lee, W.M.; Cho, I.H.; Kim, S.Y.; Ko, K.D. Photosynthetic characteristics and celluar tissue of Chinese cabbage are affected by temperature and CO2 concentration. J. Bio-Environ. Cont. 2009, 18, 148–152. [Google Scholar]
- Kuo, C.G.; Shen, B.J.; Chen, H.M.; Chen, H.C.; Opeña, R.T. Associations between heat tolerance, water consumption, and morphological characters in Chinese cabbage. Euphytica 1988, 39, 65–73. [Google Scholar] [CrossRef]
- Kato, T. The physiological mechanism of heading in Chinese cabbage. In Chinese Cabbage: Proceedings of the First International Symposium; Talekar, N.S., Griggs, T.A., Eds.; AVRDC: Shanhua, Taiwan, 1981; pp. 207–215. [Google Scholar]
- Kim, K.D.; Suh, J.T.; Lee, J.N.; Yoo, D.L.; Kwon, M.; Hong, S.C. Evaluation of factors related to productivity and yield estimation based on growth characteristics and growing degree days in highland Kimchi Cabbage. Kor. J. Hortic. Sci. Technol. 2015, 33, 911–922. [Google Scholar]
- Rodríguez, V.M.; Soengas, P.; Alonso-Villaverde, V.; Sotelo, T.; Cartea, M.E.; Velasco, P. Effect of temperature stress on the early vegetative development of Brassica oleracea L. BMC Plant Biol. 2015, 15, 145–153. [Google Scholar] [CrossRef] [PubMed] [Green Version]
- Cho, J.H.; Suh, J.M.; Jin, K.H.; Kang, J.S.; Hong, C.O.; Lim, W.T.; Lee, S.G. The impacts of high temperature and heavy precipitation amount on winter Chinese cabbage yields. J. Environ. Sci. Inter. 2013, 22, 235–242. [Google Scholar] [CrossRef]
- Plowman, A.B.; Richards, A.J. The effect of light and temperature on competition between atrazine susceptible and resistant Brasscia rapa. Ann. Bot. 1997, 80, 583–590. [Google Scholar] [CrossRef] [Green Version]
- Jahangir, M.; Abdel-Farid, I.B.; Kim, H.K.; Choi, Y.H.; Verpoorte, R. Healthy and unhealthy plants: The effect of stress on the metabolism of Brassicaceae. Envion. Expt. Bot. 2009, 67, 23–33. [Google Scholar] [CrossRef]
- Archontoulis, S.V.; Miguez, F.E. Nonlinear regression models and applications in agricultural research. Agron. J. 2015, 107, 786–798. [Google Scholar] [CrossRef] [Green Version]
- Yin, X.; Struik, P.C. C3 and C4 photosyntheis models: An overview from the perspective of crop modelling. NJAS-Wageningen. J. Life Sci. 2009, 57, 27–38. [Google Scholar] [CrossRef] [Green Version]
- Zhang, W.; Bai, C.; Liu, G. Neural network modeling of ecosystems: A case study on cabbage growth system. Ecol. Model. 2007, 201, 317–325. [Google Scholar] [CrossRef]
- Dubois, J.J.B.; Fiscus, E.L.; Booker, F.L.; Flowers, M.D.; Reid, C.D. Optimizaing the statistical estimation of the parameters of the Farquhar-von Caemmerer-Berry model of photosynthesis. New Phytol. 2007, 176, 402–414. [Google Scholar] [CrossRef]
- van Ittersum, P.A.; Leffelaar, H.; van Keulen, M.J.; Kropff, L.; Bastiaans, J.; Goudriaan, J. On approaches and applications of the Wageningen crop models. Eur. J. Agron. 2003, 18, 201–234. [Google Scholar] [CrossRef]
- Farquhar, G.D.; Caemmerer, S.V.; Berry, J.A. Models of photosynthesis. Plant Physiol. 2001, 125, 42–45. [Google Scholar] [CrossRef] [Green Version]
- Fink, M.; Feller, C. An empirical model for descrbing growth and nitrogen uptake of white cabbage (Brassica oleracea var. capitata). Sci. Hortic. 1998, 73, 75–88. [Google Scholar] [CrossRef]
- Farquhar, G.D.; Caemmerer, S.v.; Berry, J.A. A biochemical model of photosynthetic CO2 assimilation in leaves of C3 species. Planta 1980, 149, 78–90. [Google Scholar] [CrossRef] [PubMed] [Green Version]
- De Wit, C.T. Photosynthesis of leaf canopies. AGric. Res. Rep. Pudoc. Wageningen. 1965, 663, 57. [Google Scholar]
- Goudriaan, J.; Laar, H.H.V. Calculation of daily totlas of the gross CO2 assimilation of leaf canopies. Neth. J. Agric. Sci. 1978, 26, 373–382. [Google Scholar]
- Monteith, J.L. Climate and efficiency of crop production Britain. Philos. Trans. R. Soc. Lond. 1977, 980, 277–294. [Google Scholar]
- Kaiser, E.; Morales, A.; Harbinson, J.; Kromdijk, J.; Heuvelink, E.; Marcelis, L. Dynamic photosynthesis in different environmental conditions. J. Exp. Bot. 2015, 66, 2415–2426. [Google Scholar] [CrossRef] [PubMed] [Green Version]
- Sharkey, T.D.; Bernacchi, C.J.; Farquhar, G.D.; Singsaas, E.L. Fitting photosynthetic carbon dioxide response curves for C3 leaves. Plant Cell Environ. 2007, 30, 1035–1040. [Google Scholar] [CrossRef] [PubMed]
- Kim, S.H.; Lieth, J.H. A coupled model of photosynthesis, stomatal conductance and transpiration for a rose leaf (Rosa hybrida L.). Ann. Bot. 2003, 91, 771–781. [Google Scholar] [CrossRef] [Green Version]
- Thorley, J.H.M. Dynamic model of leaf photosynthesis with acclimation to light and nitrogen. Ann. Bot. 1998, 81, 421–430. [Google Scholar] [CrossRef]
Figure 1.
Changes in air temperature conditions with three levels of moderate and extreme weather scenarios applied during spring (a) and autumn (b) season cultivation periods.
Figure 1.
Changes in air temperature conditions with three levels of moderate and extreme weather scenarios applied during spring (a) and autumn (b) season cultivation periods.

Figure 2.
Sigmoidal curves for the fresh weight of control Kimchi cabbage (a) and Kimchi cabbage with three levels of moderate and extreme weather scenarios (b): 15 °C/12 °C; (c): 12 °C/9 °C; and (d): 9 °C/6 °C applied during the spring season cultivation period. RMSE: root mean square errors; DAT: days after transplanting; FW: fresh weight.

Figure 3.
Sigmoidal curves for the fresh weight of control Kimchi cabbage (a) and Kimchi cabbage with three levels of moderate and extreme weather scenarios (b): 25 °C/22 °C; (c): 30 °C/27 °C; and (d): 35 °C/31 °C) applied during the autumn season cultivation period.
Figure 3.
Sigmoidal curves for the fresh weight of control Kimchi cabbage (a) and Kimchi cabbage with three levels of moderate and extreme weather scenarios (b): 25 °C/22 °C; (c): 30 °C/27 °C; and (d): 35 °C/31 °C) applied during the autumn season cultivation period.

Figure 4.
Relative growth rate (RGR) of control Kimchi cabbage and Kimchi cabbage with three levels of moderate and extreme weather treatments applied. The figures represent the RGR curves (a,c) and their validation (b,d) in the spring and autumn cultivation periods, respectively.
Figure 4.
Relative growth rate (RGR) of control Kimchi cabbage and Kimchi cabbage with three levels of moderate and extreme weather treatments applied. The figures represent the RGR curves (a,c) and their validation (b,d) in the spring and autumn cultivation periods, respectively.

Figure 5.
Pn of Kimchi cabbage leaf simulated by Equations (7)–(10) and the closed circle dot represented the measured Pn for validation: (a) control (normal weather data); (b,c) applied the moderate weather scenarios (photo-/dark-periods; 15/12 °C and 12/9 °C, respectively); (d) applied extreme weather scenarios (9/6 °C). Ci: intercellular carbon dioxide concentration.


Figure 6.
Pn of Kimchi cabbage leaf simulated by Equations (11)–(14) and the closed circle dot represented the measured Pn for validation: (a) control (normal weather data); (b,c) applied the moderate weather scenarios (photo-/dark-periods; 25/22 °C and 30/27 °C, respectively); (d) applied extreme weather scenarios (35/31 °C).


Table 1.
Growth of spring season Kimchi cabbage after commencing moderate and extreme air temperature treatment 7–10 days after transplanting.
Table 1.
Growth of spring season Kimchi cabbage after commencing moderate and extreme air temperature treatment 7–10 days after transplanting.
| Treatment | Fresh Weight (g/Plant) | Dry Weight (g/Plant) | Leaf Length (cm/Plant) | Leaf Width (cm/Plant) | Number of Leaves (/Plant) | Leaf Area (cm2/Plant) | ||||||
|---|---|---|---|---|---|---|---|---|---|---|---|---|
| 4 DAT 1 | ||||||||||||
| Control | 108.2 | a 2 | 8.2 | a | 25.4 | a | 16.6 | a | 17.0 | a | 1812.5 | a |
| 15 °C/12 °C | 107.3 | a | 8.6 | a | 24.7 | a | 16.4 | a | 16.7 | ab | 1672.9 | a |
| 12 °C/9 °C | 71.1 | b | 4.3 | b | 20.7 | b | 13.1 | b | 14.3 | c | 1040.0 | b |
| 9 °C/6 °C | 54.0 | b | 5.2 | b | 21.9 | ab | 13.9 | b | 15.3 | bc | 1219.8 | b |
| 18 DAT | ||||||||||||
| Control | 1157.8 | a | 67.9 | a | 39.2 | a | 33.7 | a | 59.0 | a | 11,248.0 | a |
| 15 °C/12 °C | 915.3 | b | 52.2 | b | 38.1 | ab | 32.8 | a | 49.3 | a | 8597.9 | b |
| 12 °C/9 °C | 717.2 | c | 40.6 | c | 34.1 | c | 27.3 | b | 46.0 | a | 6936.8 | c |
| 9 °C/6 °C | 586.8 | c | 30.8 | d | 35.0 | bc | 27.0 | b | 53.3 | a | 6248.9 | c |
1 DAT: days after treatment (low air temperature applied in the early growth stage after transplanting). 2 Different letters within columns indicate significant differences at p ≤ 0.05 based on LSD tests.
Table 2.
Growth of autumn season Kimchi cabbage after commencing moderate and extreme air temperature treatment 7–10 days after transplanting.
Table 2.
Growth of autumn season Kimchi cabbage after commencing moderate and extreme air temperature treatment 7–10 days after transplanting.
| Treatment | Fresh Weight (g/Plant) | Dry Weight (g/Plant) | Leaf Length (cm/Plant) | Leaf Width (cm/Plant) | Number of Leaves (/Plant) | Leaf Area (cm2/Plant) | ||||||
|---|---|---|---|---|---|---|---|---|---|---|---|---|
| 4 DAT 1 | ||||||||||||
| Control | 93.9 | b 2 | 5.9 | b | 24.7 | b | 15.7 | b | 17.7 | b | 1929.4 | b |
| 25 °C/22 °C | 147.9 | a | 8.9 | a | 28.9 | a | 18.8 | a | 20.7 | ab | 2722.2 | a |
| 30 °C/27 °C | 139.3 | a | 8.9 | a | 28.6 | a | 20.5 | a | 22.0 | a | 2716.6 | a |
| 35 °C/31 °C | 128.4 | a | 8.4 | a | 27.9 | a | 16.8 | b | 22.3 | a | 2352.6 | ab |
| 18 DAT | ||||||||||||
| Control | 1061.0 | a | 48.3 | b | 47.8 | a | 33.6 | a | 48.0 | a | 12,923.0 | a |
| 25 °C/22 °C | 1209.8 | a | 60.2 | ab | 43.8 | b | 30.5 | ab | 46.7 | a | 13,500.0 | a |
| 30 °C/27 °C | 1147.8 | a | 57.0 | ab | 48.9 | a | 30.3 | ab | 45.0 | ab | 13,155.0 | a |
| 35 °C/31 °C | 1282.0 | a | 71.5 | a | 42.2 | b | 29.2 | b | 41.7 | b | 14,783.0 | a |
1 DAT: days after treatment (high air temperature applied in the early growth stage after transplanting). 2 Different letters within columns indicate significant differences at p ≤ 0.05 based on LSD tests.
Table 3.
Photochemical efficiency, carboxylation conductance, dark respiration, and R2 values calculated using regression analyses at several Kimchi cabbage growth stages according to moderate and extreme weather treatments (measured on days after transplanting during the spring season).
Table 3.
Photochemical efficiency, carboxylation conductance, dark respiration, and R2 values calculated using regression analyses at several Kimchi cabbage growth stages according to moderate and extreme weather treatments (measured on days after transplanting during the spring season).
| Days After Transplanting | Treatment (°C, Light/Dark) | Photochemical Efficiency (μmol CO2/mmol) | Carboxylation Conductance (/s) | Dark Respiration (μmol CO2/m2/s) | R2 |
|---|---|---|---|---|---|
| 16 | Control | 0.096 | 0.388 | −13.347 | 0.994 |
| 29 | 0.094 | 0.305 | −13.572 | 0.994 | |
| 43 | 0.087 | 0.235 | −9.843 | 0.992 | |
| 59 | 0.063 | 0.079 | −5.789 | 0.991 | |
| 16 | 9/6 | 0.093 | 0.283 | −11.519 | 0.995 |
| 29 | 0.096 | 0.345 | −13.729 | 0.994 | |
| 43 | 0.068 | 0.184 | −6.903 | 0.994 | |
| 59 | 0.077 | 0.115 | −7.118 | 0.991 | |
| 16 | 12/9 | 0.093 | 0.279 | −11.388 | 0.996 |
| 29 | 0.098 | 0.360 | −15.639 | 0.992 | |
| 43 | 0.068 | 0.219 | −8.327 | 0.993 | |
| 59 | 0.072 | 0.133 | −8.872 | 0.995 | |
| 16 | 15/12 | 0.093 | 0.313 | −11.093 | 0.991 |
| 29 | 0.098 | 0.360 | −15.639 | 0.992 | |
| 43 | 0.081 | 0.257 | −9.371 | 0.991 | |
| 59 | 0.066 | 0.120 | −7.986 | 0.991 |
Table 4.
Photochemical efficiency, carboxylation conductance, dark respiration, and R2 values calculated using regression analyses at several Kimchi cabbage growth stages according to moderate and extreme weather treatments (measured on days after transplanting in the autumn season).
Table 4.
Photochemical efficiency, carboxylation conductance, dark respiration, and R2 values calculated using regression analyses at several Kimchi cabbage growth stages according to moderate and extreme weather treatments (measured on days after transplanting in the autumn season).
| Days After Transplanting | Treatment (°C, Light/Dark) | Photochemical Efficiency (μmol CO2/mmol) | Carboxylation Conductance (/s) | Dark Respiration (μmol CO2/m2/s) | R2 |
|---|---|---|---|---|---|
| 16 | Control | 0.085 | 0.315 | −11.462 | 0.993 |
| 29 | 0.092 | 0.410 | −15.873 | 0.992 | |
| 43 | 0.087 | 0.266 | −9.74 | 0.991 | |
| 59 | 0.074 | 0.162 | −6.786 | 1.000 | |
| 70 | 0.086 | 0.248 | −10.883 | 0.996 | |
| 16 | 25/22 | 0.090 | 0.311 | −12.152 | 0.991 |
| 29 | 0.094 | 0.369 | −15.298 | 0.987 | |
| 43 | 0.091 | 0.311 | −11.878 | 0.987 | |
| 59 | 0.095 | 0.349 | −15.459 | 0.992 | |
| 70 | 1.042 | 0.398 | −10.112 | 0.996 | |
| 16 | 30/27 | 0.096 | 0.442 | −15.281 | 0.990 |
| 29 | 0.104 | 0.437 | −17.612 | 0.992 | |
| 43 | 0.093 | 0.29 | −12.103 | 0.986 | |
| 59 | 0.082 | 0.219 | −13.036 | 0.991 | |
| 70 | 0.07 | 0.070 | −5.951 | 0.995 | |
| 16 | 35/31 | 0.099 | 0.422 | −14.659 | 0.993 |
| 29 | 0.094 | 0.357 | −14.793 | 0.992 | |
| 43 | 0.090 | 0.220 | −10.386 | 0.989 | |
| 59 | 0.081 | 0.136 | −8.947 | 0.968 | |
| 70 | 0.075 | 0.124 | −7.94 | 0.994 |
Publisher’s Note: MDPI stays neutral with regard to jurisdictional claims in published maps and institutional affiliations. |
© 2020 by the authors. Licensee MDPI, Basel, Switzerland. This article is an open access article distributed under the terms and conditions of the Creative Commons Attribution (CC BY) license (http://creativecommons.org/licenses/by/4.0/).
Share and Cite
MDPI and ACS Style
Wi, S.H.; Lee, H.J.; An, S.; Kim, S.K. Evaluating Growth and Photosynthesis of Kimchi Cabbage According to Extreme Weather Conditions. Agronomy 2020, 10, 1846. https://doi.org/10.3390/agronomy10121846
AMA Style
Wi SH, Lee HJ, An S, Kim SK. Evaluating Growth and Photosynthesis of Kimchi Cabbage According to Extreme Weather Conditions. Agronomy. 2020; 10(12):1846. https://doi.org/10.3390/agronomy10121846
Chicago/Turabian StyleWi, Seung Hwan, Hee Ju Lee, Sewoong An, and Sung Kyeom Kim. 2020. "Evaluating Growth and Photosynthesis of Kimchi Cabbage According to Extreme Weather Conditions" Agronomy 10, no. 12: 1846. https://doi.org/10.3390/agronomy10121846
Note that from the first issue of 2016, this journal uses article numbers instead of page numbers. See further details here.