
Abstract
The NiO/graphene (NiO/G) composite nanofibers were successfully synthesized by simple electrospinning followed by heat treatment. They as anode materials for lithium ion batteries demonstrated the more outstanding electrochemical performance when compared with the NiO + Ni composite nanofibers as the reference. NiO/G exhibited a higher discharging/charging capacity (about 712 mAh·g−1 at the third cycle) with a coulombic efficiency of nearly 100% than NiO + Ni (547 mAh·g−1). NiO/G also demonstrated the excellent cycling stability due to its higher discharging capacity of 571 mAh·g−1 and retention rate of 78% than NiO + Ni (184 mAh·g−1 and 33%) when subject to 50 cycles at 100 mA·g−1. Moreover, its rate performance was also greatly improved when compared with NiO + Ni owing to its higher discharging capacity (305 mAh·g−1, 556 mAh·g−1) and retention rate (44%, 80%) at the current density increased from 100 mA·g−1 to 2000 mA·g−1, and then recovered to 100 mA·g−1. The outstanding electrochemical performance of the NiO/G electrode is closely related to its lower ohmic resistance (2.1 Ω)/charge transfer resistance (86.5 Ω), and stronger diffusion capability of Li+ resulting from the high specific surface area, excellent conductivity and a certain charge storage capacity of graphene.
Export citation and abstract BibTeX RIS

Original content from this work may be used under the terms of the Creative Commons Attribution 4.0 licence. Any further distribution of this work must maintain attribution to the author(s) and the title of the work, journal citation and DOI.
1. Introduction
Lithium-ion batteries (LIBs) have been widely applied in fixed energy storage devices, new energy power batteries, portable electronic products and other fields due to their high power and energy density, high working voltage, environmental friendliness, low cost and the other advantages [1–3]. Graphite as a commercial anode material for LIBs has been unable to meet the current market demand owing to its low specific capacity (372 mAh·g−1) and poor rate performance [4, 5]. In recent years, the researchers have conducted a large number of studies about transition metal oxides (TMOs) with excellent electrochemical performance as the substitute for graphite [6–10]. Among them, NiO stands out because of its high theoretical specific capacity (718 mAh·g−1) and volumetric energy density of 4800 mAh·cm−3, which are about two and six times those of graphite (372 mAh·g−1, 820 mAh·cm−3), respectively [11, 12]. However, the two shortcomings involved in NiO seriously restrict the improvement in its electrochemical performance. On the one hand, the NiO inherently poor conductivity hinders the transportation of lithium ion and electron during discharging and charging. Moreover, NiO will undergo the large volume expansion and gradually pulverize during diacharging and charging for a long time, which greatly reduces its cycling stability [2, 13–15]. Some researchers have proved that the electrochemical performace of NiO can be improved to a certain extent by regulating its structure and size based on a large number of experiments [16–18]. Sasidharan et al reported that NiO nanospheres with a hollow structure using poly (styrene-b-acrylic-b-ethylene oxide) ABC triblock copolymer micelles (PS-PAA-PEO) with a core–shell structure as a template. The NiO particle size was 28 ± 2 nm. The unique construction exhibited excellent electrochemical performance (a high specific capacity of about 393 mAh·g−1 after 50 cycles at 0.3 C), which was mainly attributed to hollow void space coupled with a nanosized NiO shell domain that expansion of the contact area between the electrode/electrolyte and the shortening in transportation path of lithium ion [19]. Oh et al [20] successfully synthesized a new type of one-dimensional tube-in-tube structure NiO nanobelts by the electrospinning technology followed by one-step heat treatment. The shell thickness of the NiO nanobelts was about 25 nm and the mean crystallite size of NiO were 26 nm. The high structural stability and special morphology of NiO nanobelts led to the superior lithium storage performance (the discharge specific capacity of about 992 mAh·g−1 after 200 cycles at 1.0 A·g−1) and excellent rate performance (531 mAh·g−1 at 10.0 A·g−1). In addition, the defects of NiO can also be overcome by the other paths, such as introducing highly conductive substances. Pan et al [21] prepared the Cu-NiO electrode and investigated the effect of the doping content of Cu on the electrochemical performance of the composite electrodes. The results indicated that the electrode with the Cu/Ni weight ratio of 1:8 displayed the best electrochemical performance with respect to a high maintained capacity of 714 mAh g−1 after 50 cycles at 0.1 C. Yin et al [22] prepared NiO/carbon nanotube (CNT) composite materials exhibiting the high cycling stability. The initial discharge capacity of the NiO/carbon nanotube composite materials was 1015 mAh·g−1, and the capacity remained at 873 mAh·g−1 after 50 cycles at a rate of 0.1 C, with a capacity retention rate is as high as 86%. However, there are few reports about the combination of the two above-mentioned methods for improving the electrochemical performance of NiO.
In this study, NiO/graphene (NiO/G) composite nanofibers were successfully synthesized via the simple electrospinning followed by heat treatment. The sturcture of composite nanofibers was investigated indetail, and the electrochemical performance of the nanofibers as the anode materials for LIBs was compared with that of the NiO + Ni composite nanofibers. The results indicated that NiO/G demonstrated the higher discharging/charging capacity, more outstanding rate performance and cycling stability when compared with NiO + Ni. This study provides a simple and novel method to fabricate NiO/G composite nanofibers as a promising anode material for high-performance LIBs.
2. Experimental
2.1. Synthesis of NiO + Ni and NiO/G Nanofibers
NiO + Ni sample was prepared by electrospinning followed by heat treatment. First, composite nanofibers comprising nickel(II) nitrate hexahydrate (Ni(NO3)2·6H2O, 98.5%, Shanghai Titan Scientific Co., Ltd), polyvinylpyrrolidone (PVP, (C6H9NO)n, Mw: 1,300,000, Aladdin Industrial Corporation, Shanghai, China), citric acid (C6H8O7, Aladdin Industrial Corporation, Shanghai, China, 99.5%) were electrospun. The 0.78 g citric acid and 0.34 g PVP were dissolved in a solution containing 12 ml ethanol successively and stirred vigorously for 2 h to prepare the electrospinning precursor. Then, 1.13 g nickel(II) nitrate hexahydrate was added to the above solution with vigorous stirring overnight. Finally, green polymer solution was obtained. The prepared solution was packed into a plastic syringe equipped with a stainless-steel needle (22 G). During the electrospinning, the solution was subsequently ejected at a flow rate of 1 ml·h−1 and the spinning temperature was kept at 50 °C. The tip is kept at a distance of 17 cm from the collector, and the rotation speed of the drum was maintained at 70 rpm. The applied voltage between the collector and the syringe tip was 9 kV. Nanofibers consisting of Ni(NO3)2-PVP-citric acid were calcined directly in a muffle furnace. The experimental process can be visually described by a schematic diagram (figure 1). Subsequently, the nanomaterials were calcined to obtain the NiO + Ni nanofibers at 400 °C for 3 h with a heating rate of 5 °C·min−1 in an air atmosphere. The synthesis of NiO + Ni at a comparatively low temperature can be described as followings. NiO is firstly obtained at the experimental temperature of about 400 °C due to the decomposition of Ni(NO3)2. Then PVP and citric acid decomposition, resulting in the formation of reducing gases such as NO and CO. A portion of NiO will be transformed into Ni in the reducing atmosphere. As a result, the disorder mixture of NiO + Ni will be formed. In addition, bare NiO nanofibers were prepared by heat treatment at 600 °C for 3 h under the same conditions.

Figure 1. Schematic diagram of electrospinning process.
Download figure:
Standard image High-resolution imageIn order to obtain NiO/G nanofibers, the 0.14 g bare NiO was added to 20 ml anhydric ethanol followed by introducing G. The ratio of NiO:G in NiO/G nanocomposite was determined as 97:3 (in wt.%). The dispersion of G in ethanol will produce the significant effect on the final electrochemical performance of the electrode materials. The following measures were taken to ensure the uniform dispersion of G in ethanol. Firstly, a commercial product (graphene suspension, 1 mg·ml−1, XFNANO, Nanjing, China) was used as the source of gaphene nanoparticles, in which graphene nanoparticles were uniformly distributed in ethanol with PVP as the dispersing agent. Seconedly, the commercial graphene suspension and NiO nanofibers were introduced into ethanol as the solvent during the mixing process of graphene and nanofibers, which ensured the consistency of uniform dispersion of graphene nanoparticles in ethanol. Thirdly, an Ultrasonic Homogenizer (JY92-IIN, Ningbo Xinzhi Biotechnology Co. LTD., China) was chosen to further uniformly disperse graphene nanoparticles and nanofibers, which exhibited a better dispersion effect when compared with the traditional magnetic stirrer. The resultant suspension was dried in an oven, subsequently kept for 2 h at 300 °C with a rate of 2 °C·min−1 under the protection of argon.
2.2. Characterization techniques
The morphology and structures of the samples were characterized by an x-ray diffractometer (XRD, D2-PHASER, Bruker, Karlsruhe, Germany) with Cu Kα radiation (γ = 0.1540560 nm). The morphologies and particle sizes of the samples were determined by a field-emission scanning electron microscope (FE-SEM, S-4800, HITACHI, Tokyo, Japan) and a transmission electron microscope (TEM, JEM-2100F, JOEL, Tokyo, Japan). The functional groups of the samples were analyzed by a Fourier infrared spectroscope (FT-IR, IS-10 IR, Nicolet, Shanghai, China) in a range of 4000–400 cm−1. The main elements and chemical valence states of the samples were determined by an x-ray photoelectron spectrometer (XPS, ESCALAB 250XI, Thermo Fisher Scientific, Waltham, MA, USA).
2.3. Electrochemical measurements
Electrochemical performance of the samples was tested by CR2032 coin cell, and all tests were conducted at room temperature. The NiO/G or NiO + Ni (70 wt.%), acetylene black (20 wt.%) and PVDF (10 wt.%) were mixed uniformly with N-methyl-2-pyrrolidone (NMP). Afterward, the mixture was coated on the copper foil and then dried at 60 ℃ for 12 h to obtain the working electrodes. The electrolyte was comprised of 1.0 M LiPF6 in an ethylene carbonate/dimethyl carbonate (EC:DMC, 1:1, v/v) mixture. CR2032-type coin cells were assembled with lithium foil as the counter electrodes and Celgard 2400 (Φ 19 mm) as the separator in a glove box under an argon atmosphere (Super 1220/750/900, Shanghai Mikrouna Electromechanical Technology Co., Ltd., Shanghai, China). Galvanostatic charge-discharge performance results were collected on the workstation (CT4008, Neware Electronics Co., Ltd., Shenzhen, China) with the cutoff voltages from 0.01 to 3.0 V (versus Li/Li+). The cyclic voltammetry (CV) measurements were carried out on an electrochemical workstation (CHI 760E, CH Instruments Ins, Shanghai, China) with the cutoff voltages from 0.01 to 3.0 V (versus Li/Li+) at 0.1 mV·s−1. Electrochemical impedance spectroscopy (EIS) analysis was performed on the electrodes at a scan rate of 5 mV and the frequency range of 0.01 Hz-100 KHz.
3. Results and discussion
3.1. Microstructural characterization of nanofibers
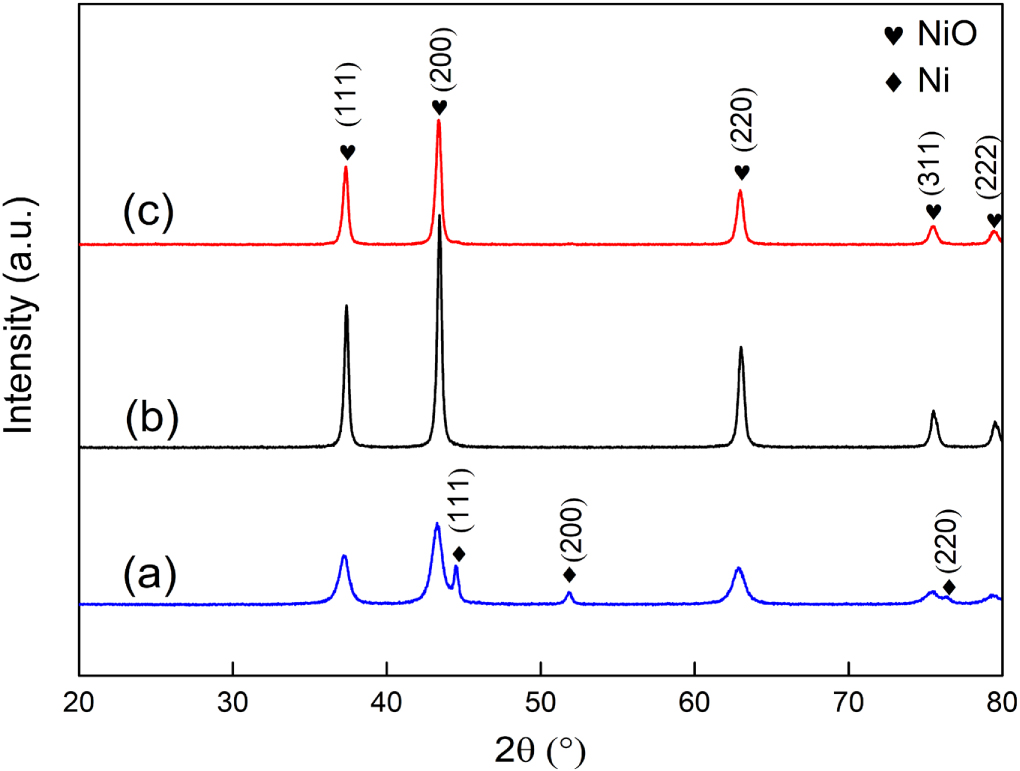
Figure 2 shows the XRD patterns of bare NiO, NiO + Ni, NiO/G nanofibers. All the patterns are composed of some sharp diffraction peaks with different intensities, indicating that the nanofibers demonstrate a very good crystallinity. With respect to the NiO + Ni nanofibers (figure 2(a)), three diffraction peaks situate at 37.27°, 43.29° and 62.87° well correspond to the (111), (200) and (220) crystal planes of NiO (JCPDS, No. 00-047-1049) [23]. The other three strong peaks at 44.48°, 51.83° and 76.35° are associated with the (111), (200) and (220) crystal planes of Ni (JCPDS, No. 00-04-850). The coexistence of NiO and Ni should be related to the calcination temperature and the circumstance difference of nanofibers. The inner of nanofibers may be in a relatively strong reducing environment due to the incomplete thermal decomposion of PVP and citric acid into reducing gases such as CO and NO, in which reduces part of the Ni2+ to metallic Ni. When the calcination temperature reaches 600 °C (figure 2(b)), the peaks associated with metallic Ni disappear entirely, accompanied with the increase in peak intensity of NiO. The existence of metallic Ni in NiO can efficiently improve the ability of Li+ exportation and insertion. However, Ni as a kind of inert substance hardly has the charge storage ability. For comparison with the introduction of Ni, bare NiO was modified by adding G. Figure 2(c) shows the XRD pattern of G and NiO composited. All peaks can be identified from NiO and no other peaks related to G are observed due to the traces of G in the composites.

Figure 2. XRD patterns of (a) NiO + Ni; (b) NiO; (c) NiO/G.
Download figure:
Standard image High-resolution imageFunctional groups in NiO and NiO/G samples were analyzed by FT-IR (figure 3(a)). The peaks at 429 cm−1 are so big that the other features cannot be recognized properly, so the spectra without the peaks at 429 cm−1 was intercepted (figure 3(b)). For the NiO sample, the broadband appearing near 3410 cm−1 can be attibuted to the stretching vibration of O–H bond. Weak absorption at 1632 cm−1 and 1416 result from bending vibration of the O–H bond formed between the sample and the absorbed water [24]. The absorption peak at 1086 cm−1 can be due to the stretching vibration of C–O bond [25], which is the result of NiO calcining under air atmosphere. The absorption band at 429 cm−1 could be attributed to the tensile vibration of Ni–O bond in NiO [26]. With respect to the NiO/G sample, the broadband appearing near 3410 cm−1 and the absorption band at 429 cm−1 have weakened relative to NiO sample. The peak observed at the spectral peak of 1588 cm−1 was due to the contraction of C = C [27], which provides a strong evidence for the presence of G in the sample. Moreover, the absorption spectral bands located at 1167 cm−1 and 1725 cm−1 can be attributed to the C–O bond and aldehyde C = O formed between graphene and residual oxygen during the secondary calcination of the sample in argon.

Figure 3. (a) FT-IR spectra of NiO and NiO/G; (b) FT-IR spectra of NiO and NiO/G at 4000–1000 cm−1.
Download figure:
Standard image High-resolution imageXPS was used to further confirm the chemical valence state and elements of NiO + Ni and NiO/G (figure 4). Ni and O elements are detected in the two samples (figure 4(a)). Besides them, a small quantity of C is also involved in them. For NiO + Ni, the existence of C may be attributed to the adsorption of CO2 into the sample during the testing. For NiO/G, the intensity of C 1 s peak is significantly higher than that in NiO + Ni, which indicates that a portion of C originates from the added graphene. Four pairs of Ni 2p peaks can be clearly observed in the Ni 2p high-resolution spectrum for NiO + Ni (figure 4(b)). A pair of peaks are located at 854.48 eV and 871.50 eV, accompanied with which two satellites peaks appear at 861.23 eV and 879.01 eV. They are well in accordance with those of Ni2+ in NiO. The other pairs of peaks with the bonding energy of 852.43 eV and 870.04 eV should be attributed to the formation of metallic Ni. The residual two peaks situated at 855.63 eV and 873.47 eV confirm the existance of Ni2O3 in the sample [23, 28, 29]. The formation of the Ni2O3 is due to oxygen-enriched nickel oxide, which may be caused by the combustion of carbon during heat treatment. Considering that there is no corresponding peak related to Ni2O3 in the XRD test results, the content of Ni2O3 is considered to be negligible [29, 30]. The Ni 2p spectrum of NiO/G is very similar to that of NiO + Ni. However, the peaks relate to metallic Ni cannot be well fitted, which implies that Ni in NiO/G exists in the form of NiO and Ni2O3. With respect to the O 1s spectrum in NiO + Ni sample (figure 4(c)), one peak with a binding energy of 529.7 eV originates from the Ni–O bond in NiO, the other peak at 531.51 eV corresponds to the formaton of Ni2O3 [31]. Besies the two fitted peaks associated with NiO and Ni2O3, a weak peak at 533.32 eV can be observed in the O 1s spectrum for NiO/G, which originates from the absorbed water. Figure 4(d) shows the additional C 1s in NiO/G sample was deemed to derive from the graphene in the sample. C 1s was mainly fitted with three peaks and one peak at 284.8 eV corresponding to C = C stand for benzene ring, which means that the introduced of G has a good structure. The other two peaks at 285.45 eV and 288.38 eV corresponding to C–O–C, and O–C=O (carbonyl group) are from CO2 [32]. The results are consistent with the above FT-IR test results.

Figure 4. (a) XPS survey spectra of NiO + Ni and NiO/G samples; (b) Ni 2p of NiO + Ni and NiO/G; (c) O 1 s of NiO + Ni and NiO/G; (d) C 1 s of NiO/G.
Download figure:
Standard image High-resolution imageAs shown in figure 5, the morphology of NiO + Ni, bare NiO and NiO/G were characterized by field emission scanning electron microscope (FE-SEM). In figures 5(a), 5(c), 5(e), it can be seen that all the nanofibers demonstrate nanobelt morphology and are interwoven into a network structure. The formation of the nanobelts are attributed to the electrospinning process. The fiber filaments ejected from the spinneret were soft before reaching the drum receiver, and gradually solidify when they reach the receiver. The nanobelt structure was finally obtained due to the rapid rotation of the drum [33]. For the NiO + Ni sample (figure 5(a)), a large number of fine white nanoparticles are uniformly distributed throughout the whole nanofibers, which should be Ni particles. A high-magnified image reveals that their surfaces are comparatively smooth (figure 5(b)). Some irregular grains with a size from 20 nm to 50 nm grow up from the surface, however, among which the grain boundaries are very vague due to no enough driving force for grains' growth at a comparatively low temperature (400 °C). When the heat-treatment temperature is elevated to 600 °C, a portion of nanobelts becomes more narrower (with a average width of about 425 ± 25 nm), and the residual nanobelts are transformed into nanofibers with a diameter of about 325 ± 20 nm. In the calcination process of the nanobelts compressing Ni(NO3)2-PVP-citric acid obtained via electrospinning, the PVP and citric acid undergo thermal shrinkage during decomposition in the role of surface tension [23, 34]. Because of the slow shrinkage at lower temperature, the nanobelts are obtained after heat treatment for 3 h. As the temperature elevated to 600 ℃ (figure 5(c)), the core rapidly softens and shrinks, resulting in the change of fiber morphology, which gradually changed from nanobelts to nanofibers, and the size of nanofibers also gradually decreases. Besides the above changes, the fine white particles are hardly observed, which indicates that residual Ni had been oxidized into NiO. Numerous spherical nanoparticles with a average diameter of about 40 nm tightly cluster together on nanobelts/nanofibers (figure 5(d)), among which the grain boundaries can be clearly identified. Along the increase in heat-treatment temperature, the grain will grow with a rapid rate, which will continuously swallow up the around zone and form the coarse spherical grains.

Figure 5. FE-SEM images of (a), (b) NiO nanofibers; (c), (d) NiO + Ni nanofibers; (e), (f) NiO/G nanofibers.
Download figure:
Standard image High-resolution imageWith respect to the NiO/G sample, the nanobelts are completely converted into the nanofibers, and their diameter is further reduced into about 230 ± 20 nm (figure 5(e)), which is colsely raleted to the secondary calcing of the sample. Moreover, some wrinkled substances tightly adhere to the surfaces of nanofibers, which can be identified as the added G. Due to the role of graphene in the secondary calcination, NiO shows an extra porous structure after the secondary calcination, and grows on both sides of the graphene nanosheets and is wrapped tightly with graphene at the same time. This crosslinking structure can effectively increase the contact between the electrode material and the electrolyte. Thus, effectively decrease the resistance of lithium ions during the insertion/extraction process and improve the conductivity of the electrode material. More importantly, NiO nanofibers originally grown on graphene nanosheets can effectively prevent particle agglomeration that is prone to occur during charging and discharging of electrode materials.
The morphology and microstructure of NiO + Ni and NiO/G are analyzed by TEM (figure 6). NiO/G nanofibers (figure 6(b)) are more transparent when compared with NiO + Ni nanofibers (figure 6(a)), in which a large numbers of fine pores can be clearly observed. Moreover, the NiO nanofibers are tightly wrapped by wrinkled G in NiO/G nanofibers, which greatly enhances the specific surface area of NiO/G nanofibers. The high-resolution TEM (HRTEM) image of NiO + Ni nanomaterials (figure 6(c)) displays the lattice planes with the spaces of about 0.2087 nm and 0.2039 nm, which well correspond to those of NiO (200) and Ni (111). The selected-area electronic diffraction (SAED) image of NiO + Ni (seeing the inset in figure 6(c)) also clearly shows the concentric diffraction rings related to (111), (200) and (220) planes of NiO, as well as (111) and (200) planes of Ni. The SAED image of NiO/G (figure 6(d)) indicates that the nanofibers only contain NiO and are free of Ni. The element mapping image of NiO/G sample confirms the existence of elements Ni, O and C (figures 6(e)–6(h)). Ni and O are uniformly distributed throught the whole nanofibers, however C is detected around nanofibers, indicating that G mainly adheres to the surfaces of nanofibers.

Figure 6. TEM images of (a) NiO + Ni nanofibers; (b) NiO/G nanofibers; (c) HRTEM image of a section of NiO + Ni nanofibers and the inset of Selected-area electronic diffraction (SAED) pattern; (d) Selected-area electronic diffraction (SAED) pattern of NiO/G nanofibers; TEM images of (e) NiO/G nanofibers for elemental mapping. Mapping of (f) O; (g) Ni; (h) C.
Download figure:
Standard image High-resolution image3.2. Electrochemical performance of the nanofibers electrodes
Figure 7 shows the cyclic voltammograms (CV) recorded at the NiO + Ni electrode and the NiO/G electrode in the voltage range of 0.01–3 V (versus Li/Li+) at a rate of 0.1 mV · s−1. As shown in figure 7(a), a sharp reduction peak appears at 0.38 V (versus Li/Li+) in the first cathode scan, which is mainly attributed to the reduction of NiO into metallic Ni (NiO + 2Li+ + 2e−→Ni + Li2 O) [35–37]. Moreover, the formation of the SEI layer at the interface between the electrode and the electrolyte also make a partial of contributions. An oxidation peak can be observed at 2.21 V (versus Li/Li+), which corresponds to the combination of oxidation of metallic Ni into NiO and partial decomposition of SEI layer. In the subsequent scanning, the reduction peak shifts toward the more positive potential, which may result from the change in structural of the electrode. This similar phenomenon had been observed in the related studies [38, 39]. However, the corresponding oxidation peak becomes less obvious due to the significant decrease in peak current, implying that the NiO + Ni exhibits the poor cycling stability.

Figure 7. The first three cycles of cyclic voltammograms (CV) of (a) NiO + Ni electrode; (b) NiO/G electrode.
Download figure:
Standard image High-resolution imageThe NiO/G electrode (figure 7(b)) has the CV curves similar to NiO + Ni. There are two slight differences when compared with those obtained in the NiO + Ni electrode, corresonding to the appearance of a new oxidation peak at 1.38 V, and the remained high peak current at the second and third circles. The former is associated with the reaction occuring between graphene and the electrolyte ( ) [40, 41]. The latter can be ascribed to the improvement in cycle stability of the elecrode resulting from the addition of G, indicating that the NiO/G electrode has good cycling stability and reaction reversibility.
Figure 8 indicates the charging and discharging curves of the first three cycles recorded on the bare NiO, NiO + Ni and NiO/G electrodes in the voltage range of 0.01–3 V (versus Li/Li+) at a current density of 100 mA·g−1. The three electrodes have the similar trends of charging and discharging. The voltage drops rapidly to 0.57 V during the first discharge, then there is a relatively stable voltage plateau from 0.57 to 0.50 V, which mainly corresponds to the Li insertion coupled with the reduction of NiO into Ni. A comparatively stable voltage plateau appears at near 2.25 V, which originates from the reversible Li extraction together with the oxidation of Ni into NiO. This is well in accordance with that analyzed in CV tests. However, no extra discharging/charging plateaus associated with the Li insertion/extraction in graphene can be observed for the NiO/G electrode, which may be attributed to the extremely low content of added graphene. The discharging/charging capactance at different cycles and the corresponding coulombic efficiency were calculated (table 1).

Figure 8. The first three cycles of constant current charging and discharging curves at 100 mA·g−1 (a) NiO; (b) NiO + Ni; (c) NiO/G.
Download figure:
Standard image High-resolution imageTable 1. The first three cycles of constant current charging and discharging curves at 100 mA·g−1 of bare NiO, NiO + Ni and NiO/G.
| sample | 1st-cycle Discharge /charge (mAh·g−1) | 1st-cycle Coulomb efficiency (%) | 2st-cycle Discharge /charge (mAh·g−1) | 2st-cycle Coulomb efficiency (%) | 3st-cycle Discharge /charge (mAh·g−1) | 3st-cycle Coulomb efficiency (%) |
|---|---|---|---|---|---|---|
| NiO | 862/386 | 45 | 380/258 | 68 | 266/221 | 83 |
| NiO + Ni | 972/598 | 62 | 553/532 | 96 | 547/531 | 97 |
| NiO/G | 1116/714 | 64 | 733/695 | 95 | 712/684 | 96 |
Regarding of the NiO electrode, the first cycle discharging/charging specific capacity are 860/385 mAh·g−1 with a coulombic efficiency of about 45%. The formation of SEI film on the active substance surface should be responsible for the irreversible capacity (475 mAh·g−1), which can be approximately considered as the irreversible process[42, 43]. As the further increase in cycling number, its discharging/charging capacity of bare NiO presents the downword tendency (380/258 mAh·g−1 for the second circle and 266/221 mAh·g−1 for the third circle), indicating that the reactions occurring on the NiO electrode have a poor cycling stability. The opposite tendency occurs for the coulombic efficiency (68% and 83% for the second/third circle). However, the comparatively low value implys that the considerably Li+ is pinned in the electrode resulting from the poor reversibility of the reactions. The low capacitance and poor reversiblity/cycling stablity of the NiO electrode are ascribed to low conductibility and poor structural stability resulting from the drastic volume variation during discharging/charging. Referring to the NiO + Ni electrode, the first discharging/charging specific capacity are 972/598 mAh·g−1 with a coulombic efficiency of about 62%. The specific discharging/charging capacity are reduced to 553/532 mAh·g−1 at the second circle, however the colulombic efficiency is sharply raised to near 100% (96%). The discharging/charging curves at the third circle are almost overlapped with that obtained at the second circle. By comparing the data at the second and third circle, it is clear that the capacitance, the reversibility and the cycling stability of the electrode are significantly improved by introducing Ni into NiO. Fine metallic Ni particles are uniformly dispersed in NiO, which will play an important role in facilitate the transportation of Li+ during discharging and charging. Moreover, metallic Ni particles with a high conductivity will play the buffer role among within the NiO particles, which will accommodate the drastic volume change of NiO during the discharging and charging. As a result, the integrity of the electrode can be well maintained. The two effects resulting from the addition of Ni cause the improvement in electrochemical performance of the NiO + Ni electrode [44, 45].
When graphene as a substitute for Ni was doped into NiO, it is worth noting that the NiO/G electrode has the similar coulombic efficiency to the NiO + Ni electrode at different cycles, indicating that it demonstrates the outstanding reversibility and cycling stability. However, the discharging/charging capacity of the NiO/G electrode are higher than that of the NiO + Ni electrode at the given circle. The first discharge and charge capacity are 1116/714 mAh·g−1, which are increased by about 14.8% and 19.4%, and the second/third discharging/charging capacity are enhanced by about 30%. The obvious improvement in discharging/charging capacity is closely related to the characteristics of graphene. Graphene with a higher conductivity than Ni will contribute to the transportation of Li+ with a rapid rate. On the other hand, graphene with a high specific surface of about tightly wrapped round the NiO nanofibers will greatly increase their specific surface, which will provide more active sites for the lithium insertion/extraction. Moreover, graphene can be regarded as the other active substance for the charge storage and release [41]. The above-mentioned factors cause the significant increase in capacitance of the NiO/G electrode when compared with the NiO + Ni electrode.
In order to further evaluate the cycling stability of the NiO, NiO + Ni and NiO/G electrodes, their capacitance and the corresponding coulombic efficiency were tested at 100 mA·g−1 over 50 cycles. As shown in figure 9(a), the specfic capacity of the NiO electrode subject to 50 cycles is about 92 mAh·g−1 with a retention rate of only about 24% that obtained in the second cycle, demonstrating a poor stability. When metallic Ni particles were introduced into NiO, the retention rate is increased to 33% with a residual specific capacity of 184 mAh·g−1 after 50 cycles. When graphene is substituted for metallic Ni, the specific capacity of NiO/G electrode is maintained at a higher value of about 571 mAh·g−1 after 50 cycles. Moreover, a higher retention rate of about 78% was acquired on the NiO/G eletrode. This indicates that the cycling stability of the NiO electrode can be efficiently improved by introducing the substance with a high conductivity. The coulombic efficency reaches nearly 100% for the three electrodes (97.8% for NiO, 99.8% for NiO + Ni and 98.8% for NiO/G) after 50 cycles. Comparatively speaking, the NiO eletrode after introducing Ni or G has a higher coulombic efficiency. Based on the above analyses, it can be concluded that the introduction of G will bring about more obvious effects.

Figure 9. (a) Cycle performance of NiO, NiO + Ni and NiO/G electrodes at 100 mA·g−1; (b) the rate performance of NiO, NiO + Ni and NiO/G electrodes.
Download figure:
Standard image High-resolution imageThe rate performance of NiO, NiO + Ni and NiO/G electrodes were tested at different current densities of 100 mA·g−1, 250 mA·g−1, 500 mA·g−1, 1000 mA·g−1, and 2000 mA·g−1. As shown in figure 9(b). The average capacities of the NiO electrode are drastic reduced from 375 mAh·g−1 to 1 mAh·g−1 with an extremely low retention rate of about 0.2% when the current density increased from 100 mA·g−1 to 2000 mA·g−1, indicating that the NiO electrode almost loses the charge storage capacity. The average capacitance of the electrode is only 124 mAh·g−1 (only about 33% of the initial capacitance) when the current density is recovered to the initial value, implying that the NiO electrode has a poor rate performance. When compared with the NiO electrode, the NiO + Ni presents a better rate performance due to a higher capacitance and retention rate of about 41 mAh·g−1 and 6.3% obtained at 2000 mA·g−1. Moreover, the capacitance is reurned to a higher value of about 344 mAh·g−1 when the current density is recovered to the initial value. It means that the introduction of Ni contributes to the improvement in rate performance of the NiO electrode. When metallic Ni is replaced by graphene and introduced into NiO, the rate performance is further enhanced owing to the capacitance shapely increased from 41 mAh·g−1 to 305 mAh·g−1 with a higher retention rate of 44% when the current density is increased to 2000 mA·g−1. Other than those, the higher retained capacitance (556 mAh·g−1) and retention rate (80%) the electrode is acquired when the current is returned to 100 mA·g−1. It can be concluded that the addition of G into NiO can endow the NiO electrode with a more outstanding rate performance than Ni.
A series of tests have shown that NiO/G electrode exhibits more obvious advantages than NiO + Ni electrode in terms of electrochemical performance. Electrochemical impedance spectroscopy (EIS) was used to further analyze the Li+ storage kinetics. Figure 10(a) shows the Nyquist plots of the NiO, NiO + Ni and NiO/G electrodes and the equivalent circuit is obtained by the Zview software (the insert in figure 10(a)). Rs denotes the ohmic resistance from the electrolyte, which corresponds to the horizontal intercept in the high frequency region (the enlarged image in figure 10(a)) [46]. The value of NiO, NiO + Ni and NiO/G are 3.6 Ω, 2.8 Ω, 2.1 Ω, respectively. Based on EIS date, the conductivity of NiO, NiO + Ni, NiO/G electrodes were calculated [47]. The calculation results also show that the NiO/G electrode possesses the highest electrical conductivity of NiO/G (4.24 × 10⁻⁵ s·cm−1), followed by the NiO + Ni electrode (3.20 × 10⁻⁵ s·cm−1) and the NiO electrode (2.48 × 10⁻⁵ s·cm−1). The conductivity of the NiO electrode is increased by about 71% and 29% when introducting graphene and metallic Ni, respectively. Rct signifies the charge transfer resistance, which is related with the semicircle diameter the intermediate frequency region. It is clear that the value of the NiO electrode can also be reduced (690.9 Ω for NiO, 418.2 Ω for NiO + Ni, 86.5 Ω for NiO/G) by introducing graphene and metallic Ni. Zw represents the Warburg impedance and can be used to characterize diffusion resistance of lithium ions in the active substances, which can be connected with the straight slope in the low frequency region [48–50]. Figure 10(b) reveals that there a linear relationship between Z' and ω−1/2, which can be seen visually from the following equation [47, 51]

where the σ means the Warburg factor. It is clear that the NiO/G electrode has the smallest Zw, follwed by the NiO + Ni electrode and the NiO electrode, due to NiO/G electrode shows a gentler slope (θ3 < θ2 < θ1). In addition, the diffusion coefficient of lithium ion (DLi) can be calculated by the following equation[46, 52]

in which the R represents the gas constant (8.314 J·mol−1 · K−1), T represents the absolute temperature (298 K), A represents the contact area of electrode and electrolyte (1.13 cm2), n is the number of electrons transferred, F represents the Faraday constant (96500 C·mol−1) and C represents the concentration of Li+ (mol·cm−3). The calculation results show that the NiO/G electrode possesses the optimal diffusion capacity of lithium ions (5.1 × 10⁻¹⁴ cm2 · s−1), followed by the NiO + Ni electrode (4.9 × 10⁻¹⁴ cm2 · s−1) and the NiO electrode (1.3 × 10⁻¹⁶ cm2 · s−1). The mention-aboved results reveals that the electrochemical kinetics of the bare NiO electrode was improved effectively with the introduction of metallic Ni and graphene. Comparatively speaking, the effect of graphene is more obvious than metallic Ni, which is also associated with its higher conductivity, larger specific surface and a certain storage capacity.

Figure 10. (a) Nyquist plots and the equivalent circuit of bare NiO electrode, NiO + Ni electrode and NiO/G electrode at room temperature; (b) the relationship between Z' and ω−1/2 in low-frequency region for bare NiO electrode, NiO + Ni electrode and NiO/G electrode.
Download figure:
Standard image High-resolution image
4. Conclusions
- 1.Graphene was successfully introduced into NiO nanofibers to synthesize the NiO/G electrode by a new technique route with respect to the combination of the preparation of NiO nanofibers by electrospinning followed by treatment, the mixing of NiO nanofibers and graphene, and the second heating of the mixture. The NiO + Ni and NiO electrodes were prepared as the reference to comparing their electrochemical performance.
- 2.The introduction of metallic Ni and graphene greatly improve the reversibility of the insertion/extraction reactions due to the the coulombic efficiency raised from 70% to nearly 100% at the second circle. The discharging/charging capacity were improved by about 46%–93%, 106%–168%, respectively. Moreover, the discharging/charging capacity was further enhanced by 38% and 31% when metallic Ni was substituted for graphene.
- 3.The introduction of graphene and metallic Ni into NiO contributed to the improvement in rate performance of the NiO electrode. The highest discharging capacity (305 mAh·g−1) and retention rate (44%) were obtained in the NiO/G electrode subject to discharging/charging at 2000 mA·g−1, followed by those of the NiO + Ni electrode (41 mAh·g−1, 6.3%) and the NiO electrode (1 mAh·g−1, 0.2%). Moreover, the two indexes were still retained at the highest level when the current density was recovered to 100 mA·g−1 (556 mAh·g−1 and 80%).
- 4.The cycling stability of the NiO electrode was significantly enhanced by introducing graphene and metallic Ni. The NiO/G demonstrated the highest discharging capacity 571 mAh·g−1 and retention rate 78% when subject to 50 cycles at 100 mA g−1, followed by the NiO + Ni electrode (184 mAh·g−1 and 33%), and the NiO electrode (92 mAh·g−1 and 24%).
- 5.The excellent electrochemical performance of the NiO/G electrode should be attributed to the lower ohmic resistance (2.1 Ω), charge transfer resistance (86.5 Ω) and stronger diffusion capability of Li+ resulting from the high specific surface area, excellent conductivity and a certain charge storage capacity of graphene.
Acknowledgments
This work was financially supported by the National Natural Science Foundation of China, China (no. 51471105) and Natural Science Foundation of Shanghai (20ZR1422200).
Declaration of interest
None