Exploring Grapevine Phenology and High Temperatures Response Under Controlled Conditions
 N. K. Merrill
 I. García de Cortázar-Atauri
 A. K. Parker
 M. A. Walker6
  E. M. Wolkovich
- 1Arnold Arboretum of Harvard University, Boston, MA, United States
- 2Organismic & Evolutionary Biology, Harvard University, Cambridge, MA, United States
- 3Department of Geography, University of Oregon, Eugene, OR, United States
- 4INRAE, US AgroClim, INRAE, Avignon, France
- 5Department of Wine, Food and Molecular Biosciences, Faculty of Agriculture and Life Sciences, Lincoln University, Christchurch, New Zealand
- 6Department of Viticulture & Enology, University of California, Davis, Davis, CA, United States
- 7Forest & Conservation Sciences, Faculty of Forestry, The University of British Columbia, Vancouver, BC, Canada
Climate change has challenged growers and researchers alike to better understand how warm temperatures may impact winegrape plant development across varieties. Yet multi-variety studies present challenges. Here we review studies of controlled warming on winegrape varieties alongside a new study of the budburst and flowering phenology of 50 varieties of Vitis vinifera subsp. vinifera in the lab, with a small set of plants exposed to higher temperatures (20, 26, 30, 34, and 37°C mean temperatures in growth chambers) during flowering. We found few studies have examined more than one variety, which may be due to the challenge of growing diverse varieties together. Indeed, we found high variability in flowering success across varieties in the lab (28 out of 50 varieties had no flowering), which made it impossible to study variety-specific response to temperature. Across varieties, however, we found results in line with a literature review (which we also present): higher temperatures did not have a significant effect on the rate at which vines progressed through the flowering stage, but higher temperatures did correlate with flower abortion. These results suggest a potential decrease in winegrape yields in a warmer climate due to flower abortion, but also highlight the challenges of understanding heat responses across many varieties.
Introduction
As the climate changes, the viticulture industry needs to adapt to shifting terroir. Terroir – the critical link between the flavor and style of a wine and the characteristics of the environment in which it is grown – is shaped strongly by climate, and the matching of climates to varieties (Van Leeuwen et al., 2019). Thus, as climate change continues to raise temperatures in winegrowing regions across the world, the viticulture industry will be continually challenged to adapt to new terroirs over future decades. Already, the industry has shifted growing areas toward the poles and higher elevations to maintain ideal growing temperatures for winegrapes (Mozell and Thach, 2014; Wang et al., 2020). This trend is predicted to continue (Schultz and Jones, 2010; Hannah et al., 2013), raising concerns that vineyards could move to land that is currently conserved for biodiversity and ecosystem services (Hannah et al., 2013).
Alternatively, vineyards could take advantage of the high geno- and phenotypic diversity that already exists by planting varieties better suited to the new climate (Ollat et al., 2015, 2016; Wolkovich et al., 2017; Morales-Castilla et al., 2020) or breeding new varieties (Myles, 2013; Duchêne, 2016). Vitis vinifera subsp. vinifera (winegrape) has at least 6000 genetically distinct varieties grown for many purposes, but only ∼1100 are grown currently by the viticulture industry, and an even smaller number dominate the global market (Lacombe, 2012; Anderson, 2013). However, for this adaptation to be effective, growers need better information on how different varieties fare in warmer climate regimes, with phenology being one important component (Ollat et al., 2016).
Studying the phenology of different varieties of winegrapes would help viticulturists better adapt to climate change, because winegrape phenology is extremely sensitive to temperature (Parker et al., 2011, 2013; Jones, 2013; García de Cortázar-Atauri et al., 2017). Timing for leafout and flowering of diverse plant species has advanced six to 20 days in the last 30–40 years of warming (Root et al., 2003; Menzel et al., 2006), equivalent to 4–6 days per °C. A similar advance is seen for winegrape harvest dates, which can change about 6 days per °C (Cook and Wolkovich, 2016; Labbé, 2019). The time between flowering and veraison also decreased by a little more than 1 day per °C (Duchêne and Schneider, 2005). In winegrapes, phenological timing varies across varieties, and this variability could be used to better adapt to future climates. Generally, timing of phenology can vary from 3 to 6 weeks across varieties (Boursiquot et al., 1995; Wolkovich et al., 2017).
However, most varieties still have little phenological data and far fewer varieties have data from many different environments. In this context, it is difficult to describe where many varieties could best be grown and how they respond to higher temperatures during critical phenological phases, such as flowering. While recent efforts have greatly expanded our resources for understanding phenological responses to climate in the field across varieties – yielding information on approximately 100 varieties (Parker et al., 2011, 2013) this is still less than 10% of currently planted varieties. For growers to select varieties for adapting to shifting terroirs, they will need information on more varieties and across diverse temperature regimes.
A first step toward this goal is research on an increased number of varieties and an understanding of whether phenology in semi-artificial conditions (i.e., greenhouses, labs, and growth chambers), where temperatures can be controlled more easily, matches field-based phenology. To date, much research has focused on a limited number of varieties (Sepúlveda et al., 1986; Mullins, 1992), making it difficult to know how much results for one variety can be extrapolated to another. Yet, if a greater diversity of varieties can be grown in lab conditions, lab studies could quickly increase our understanding across varieties. Further, if lab phenology appears similar to field phenology, it would suggest such results could be relevant to field conditions. Beyond this first step then, researchers will want to examine how varying temperature regimes affect particular phenological stages.
Understanding how climate change will affect winegrape flowering may be a particularly important aspect of the overall effect on phenology and the impact of temperature on the flowering process will ultimately influence harvest yields. Studies of vegetative growth and photosynthesis in other perennial crops exposed to a range of temperatures show that extreme temperatures tend to slow or inhibit certain processes in the plants (Zaka et al., 2016, 2017), with temperatures in between extremes generally speeding development. In this context, we would expect that grapevine flowering development may similarly slow down at higher temperatures.
Here we address these issues through first, a literature review of warming studies on winegrape phenology to examine how many varieties have been studied, over which temperatures, and their findings, and second, our efforts to examine experimentally how temperature affects flowering in a variety-rich study. To explore this second issue, we had two major aims: (1) to test whether the phenological stages of budburst and leafout in lab conditions correlated with field phenology for 50 varieties in the lab, and (2) to examine the effect of higher temperatures on flowering development, by following the flowering response of a small subset of these varieties across mean temperatures of 20 to 37°C in growth chambers. Overall, we aim to provide both an overview of experiments to date, and to outline how our findings and challenges may guide future efforts to conduct variety-rich lab experiments.
Materials and Methods
Literature Review
We conducted a literature review by searching Google Scholar, ISI Web of Science, and ScholarOneSearch for several searches, each search included “Vitis vinifera” combined with (AND) “heat tolerance∗” OR “growth chamber” OR “phenolog∗” OR “temperature manipulation.” Then we reviewed papers that experimentally manipulated temperatures of growing grapevines and reported phenological responses (excluding all studies without experimental warming or of warming applied to dormant cuttings or plants or focused only on berry ripening). We additionally included any relevant papers of which we were aware that we did not find in these searches. While some studies included additional treatments (e.g., drought, CO2 manipulation) we focus on results relating to warming and phenology.
Variety-Rich Study
Observations of field-grown winegrapes in the UC Davis Robert Mondavi Institute (RMI) Vineyard (Davis, CA, United States) using the modified Eichorn-Lorenz (EL) scale (Coombe, 1995) began 6 March 2015 and continued generally every 3–4 days until 2 April 2015, when almost all plants had reached EL stage 11 or higher (data and full methods available at: https://knb.ecoinformatics.org/view/ 10.5063/F18G8J29). Dormant winegrape cuttings were then taken in December of 2015.
Following collection, cuttings were chilled for 21 days (4°C) at the Arnold Arboretum (Boston, MA, United States), then forced in greenhouses in 26 cm diameter (9.6L) pots in January 2016. After several months of growth, on 27 May they were placed in growth chambers with day/night temperatures of 6/4°C and an 8-h photoperiod to induce dormancy, though the plants did not appear visibly dormant until 20 June 2016.
On 15 August 2016, the 351 potted cuttings were moved out of the chambers and into a greenhouse where the initial day temperature was 18.5 ± 1.5°C and night temperature was 16.75 ± 1.25°C. After the first week, the temperatures were slowly raised to 25.5 ± 2.5°C during the day and lowered to 10°C at night. The cuttings were pruned the day they were removed from the chambers so that each cutting had two spurs and each spur had two nodes. Then, the diameter of each spur and node and the distance between the two nodes on each spur were measured with calipers. About every 2 days, the plants’ soil was checked for moisture, and they were watered as needed to keep soils moist. Starting 1 October, plants were also fertilized once a week with a 50% dilution.
Twice a week, beginning 22 August, each plant’s development was recorded using the modified EL scale (Coombe, 1995) and soil moisture was measured with a probe in three locations in each pot. Each spur was kept at two shoots, but only the dominant shoot on each spur had observations recorded. Each shoot was trained up a stake for support. When an inflorescence had developed (EL stage 12), the plant was randomly assigned to one of five growth chambers if it was a part of the heat tolerance experiment (varieties were chosen for inclusion in the experiment to include a diversity of phenology from those varieties for which there were five or more replicates growing). Otherwise, observations on each plant continued in the greenhouse.
The five chambers all had a 12-h photoperiod with 800 m–2s–1 of fluorescent light, but varied in their temperature: Chamber 1 was set at 17/23°C Chamber 2 was set at 23/29°C, Chamber 3 was set at 27/33°C, Chamber 4 was set at 31/37°C, and Chamber 5 was set at 34/40°C (all temperatures given as night/day). Initially, CO2 levels were set at 400 ppm during the day and 600 ppm at night, because plants respire at night, increasing CO2 levels (we used 600 ppm given a review of the literature in natural and crop systems where we found little evidence of levels above 550 ppm near plants, e.g., Buchmann and Ehleringer (1998) and Mortazavi and Chanton (2002), though we did not find grape-specific studies). Each inflorescence was contained in a paper bag to collect the flower caps as they fell. Every 10 days, the plants and their assigned temperatures were rotated to a new chamber to minimize individual chamber effects on the experiment.
Observations of the percent of flower buds that flowered on each inflorescence (% flowering), leaf number, stem length, and number of fallen flower caps were made three times a week, along with soil moisture. On 19 September, it was noted that some inflorescence bags also contained aborted buds that had yet to flower, and thereafter observations of aborted buds were also recorded. Once a plant had reached 100% flowering, or, in the case of plants where the entire inflorescence had abscised, each plant had spent a minimum 14 days in the chamber, it was returned to the greenhouse. No further observations were made once no more plants were developing inflorescences and all plants in the chambers had finished flowering (data available at: https://knb.ecoinformatics.org/view/doi:10.5063/F1TM78HS).
To determine if there was any correlation between the chamber temperatures and the other variables, we used ANOVA. Linear regression was used to compare the development of the plants in the greenhouse with the data collected in the RMI Vineyard growing season. All analyses were performed in R version 3.3.3 (R Core team, 2013). Given limited replicates per variety all analyses of the growth chamber study were done across varieties.
Results
Literature Review
Most studies (7/10) examined only one variety, while at most one study examined five varieties. Certain varieties were studied often (e.g., Semillon, Shiraz, and Cabernet-Sauvignon); given the overlap in varieties across studies, all 10 studies yielded information on only a total of 10 varieties (Table 1). Experimental warming was split between being applied in the vineyard (through passive and active warming) or in the lab (growth chambers or greenhouses) with temperatures generally ranging from 20 to 40°C, while some field conditions exceeded 40°C. Warming generally advanced phenology, save for one field study that showed temperatures above 40°C delayed veraison (Greer and Weedon, 2013). Studies focused on flowering found decreased flowering at higher temperatures applied near budburst (Petrie and Clingeleffer, 2005) and flower abscission at higher temperature applied during flowering (Greer and Weston, 2010).
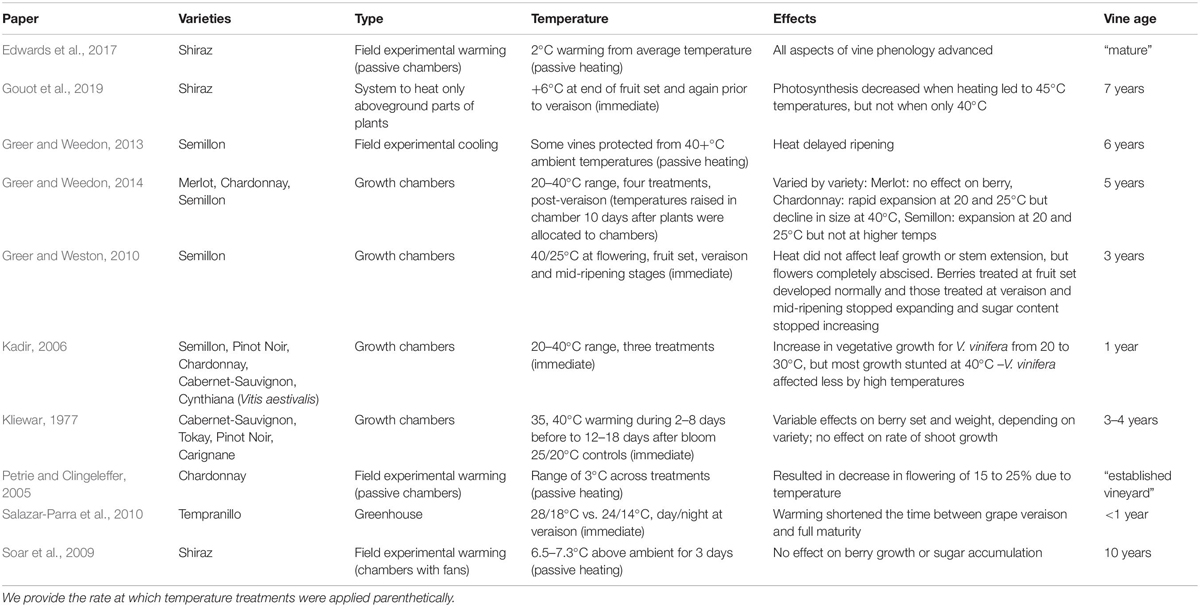
Table 1. Literature review of studies applying experimental warming to winegrapes during development and following phenological responses.
Variety-Rich Study
The plants underwent budbreak (EL 4) between 17 August and 6 September (mean = 29 August) and leafout (EL 7) between 22 August and 22 September (mean = 4 September). Budbreak and leafout timing among the varieties were similar in the lab and field (Figure 1, budburst: F(1,47) = 14.55, p < 0.001; leafout: F(1,47) = 18.51, p < 0.001). The first inflorescence formed on 5 September, and 51 plants reached this stage (EL 12) later, with substantial variation in terms of the number of plants of each variety that flowered at all. Most varieties (28/50 total) did not form inflorescences, while for a few varieties nearly half of the plants underwent flowering (e.g., Sauvignon Blanc, Tempranillo, Verdelho). Due to this high variation in inflorescence appearance, only 26 of the flowering plants were used in the experiment corresponding to 10 varieties.
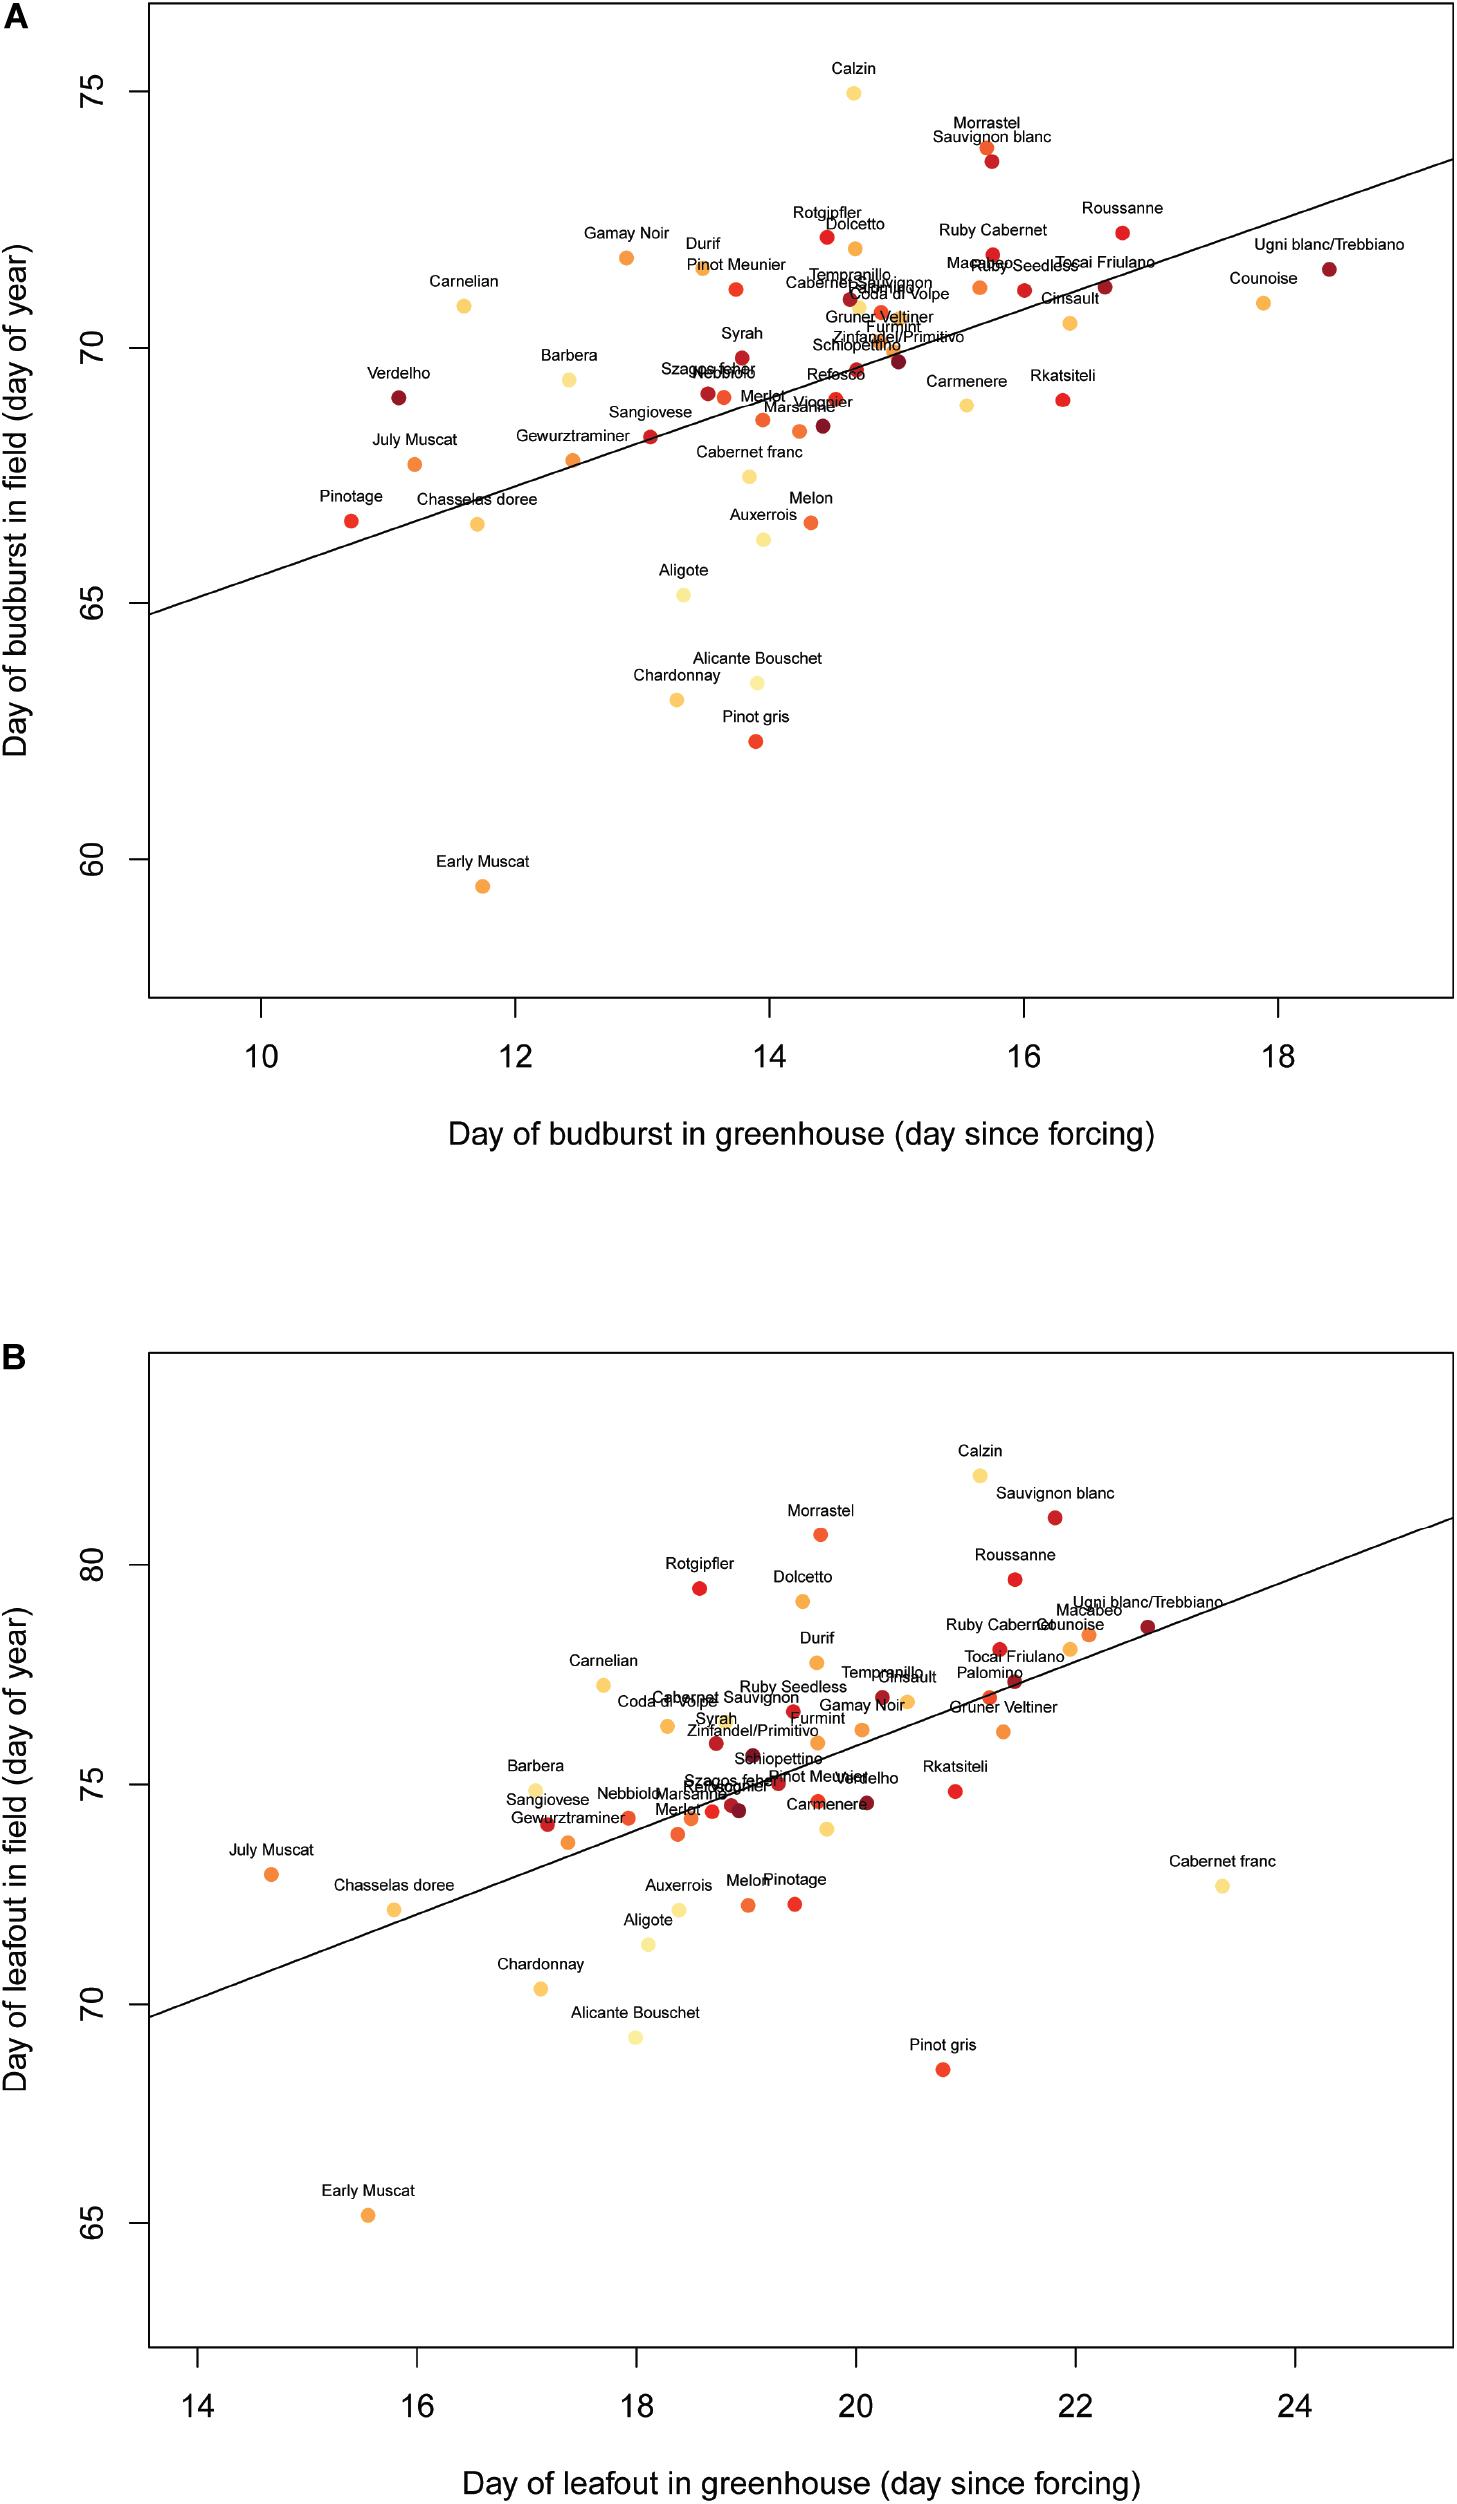
Figure 1. Day of budburst (A) and leafout (B) in the Robert Mondavi Institute Vineyard (Davis, CA, United States) from the 2015 growing season correlates to the day of budburst (F(1,47) = 14.55, p < 0.001) and leafout (F(1,47) = 18.51, p < 0.001) in greenhouse conditions across 50 varieties (each point represents a different variety that was grown both in the vineyard and in the greenhouse).
Given the low number of plants that formed inflorescence, most varieties could be placed in only one or two temperature treatments (with very low or no replication per variety: chamber 1 (mean of 20°C) had one plant each of Cabernet-Sauvignon, Durif, Sauvignon Blanc, and Verdelho. Chamber 2 (mean of 26°C) had one plant each of Durif, Pinot Gris, Sauvignon Blanc, and Verdelho. Chamber 3 (mean of 30°C) had three Durif plants, then one plant each of Gewürztraminer, Tempranillo, and Verdelho. Chamber 4 (mean of 34°C) had two Tempranillo plants, then one each of Dolcetto, Pinot Gris, Sauvignon Blanc, Syrah, and Verdelho. Chamber 5 (mean of 37°C) had two Tempranillo plants, and one each of Sauvignon Blanc, Verdelho, and Vinhão). Because of the limited number of replicated per variety, we do not report variety-specific estimates and all statistics are done across varieties. Plants that had thicker spurs were more likely to develop inflorescence (Z(340) = 2.21, p = 0.03), and more likely to reach 50% flowering (Figure 2, Z(340) = 2.85, p = 0.004).
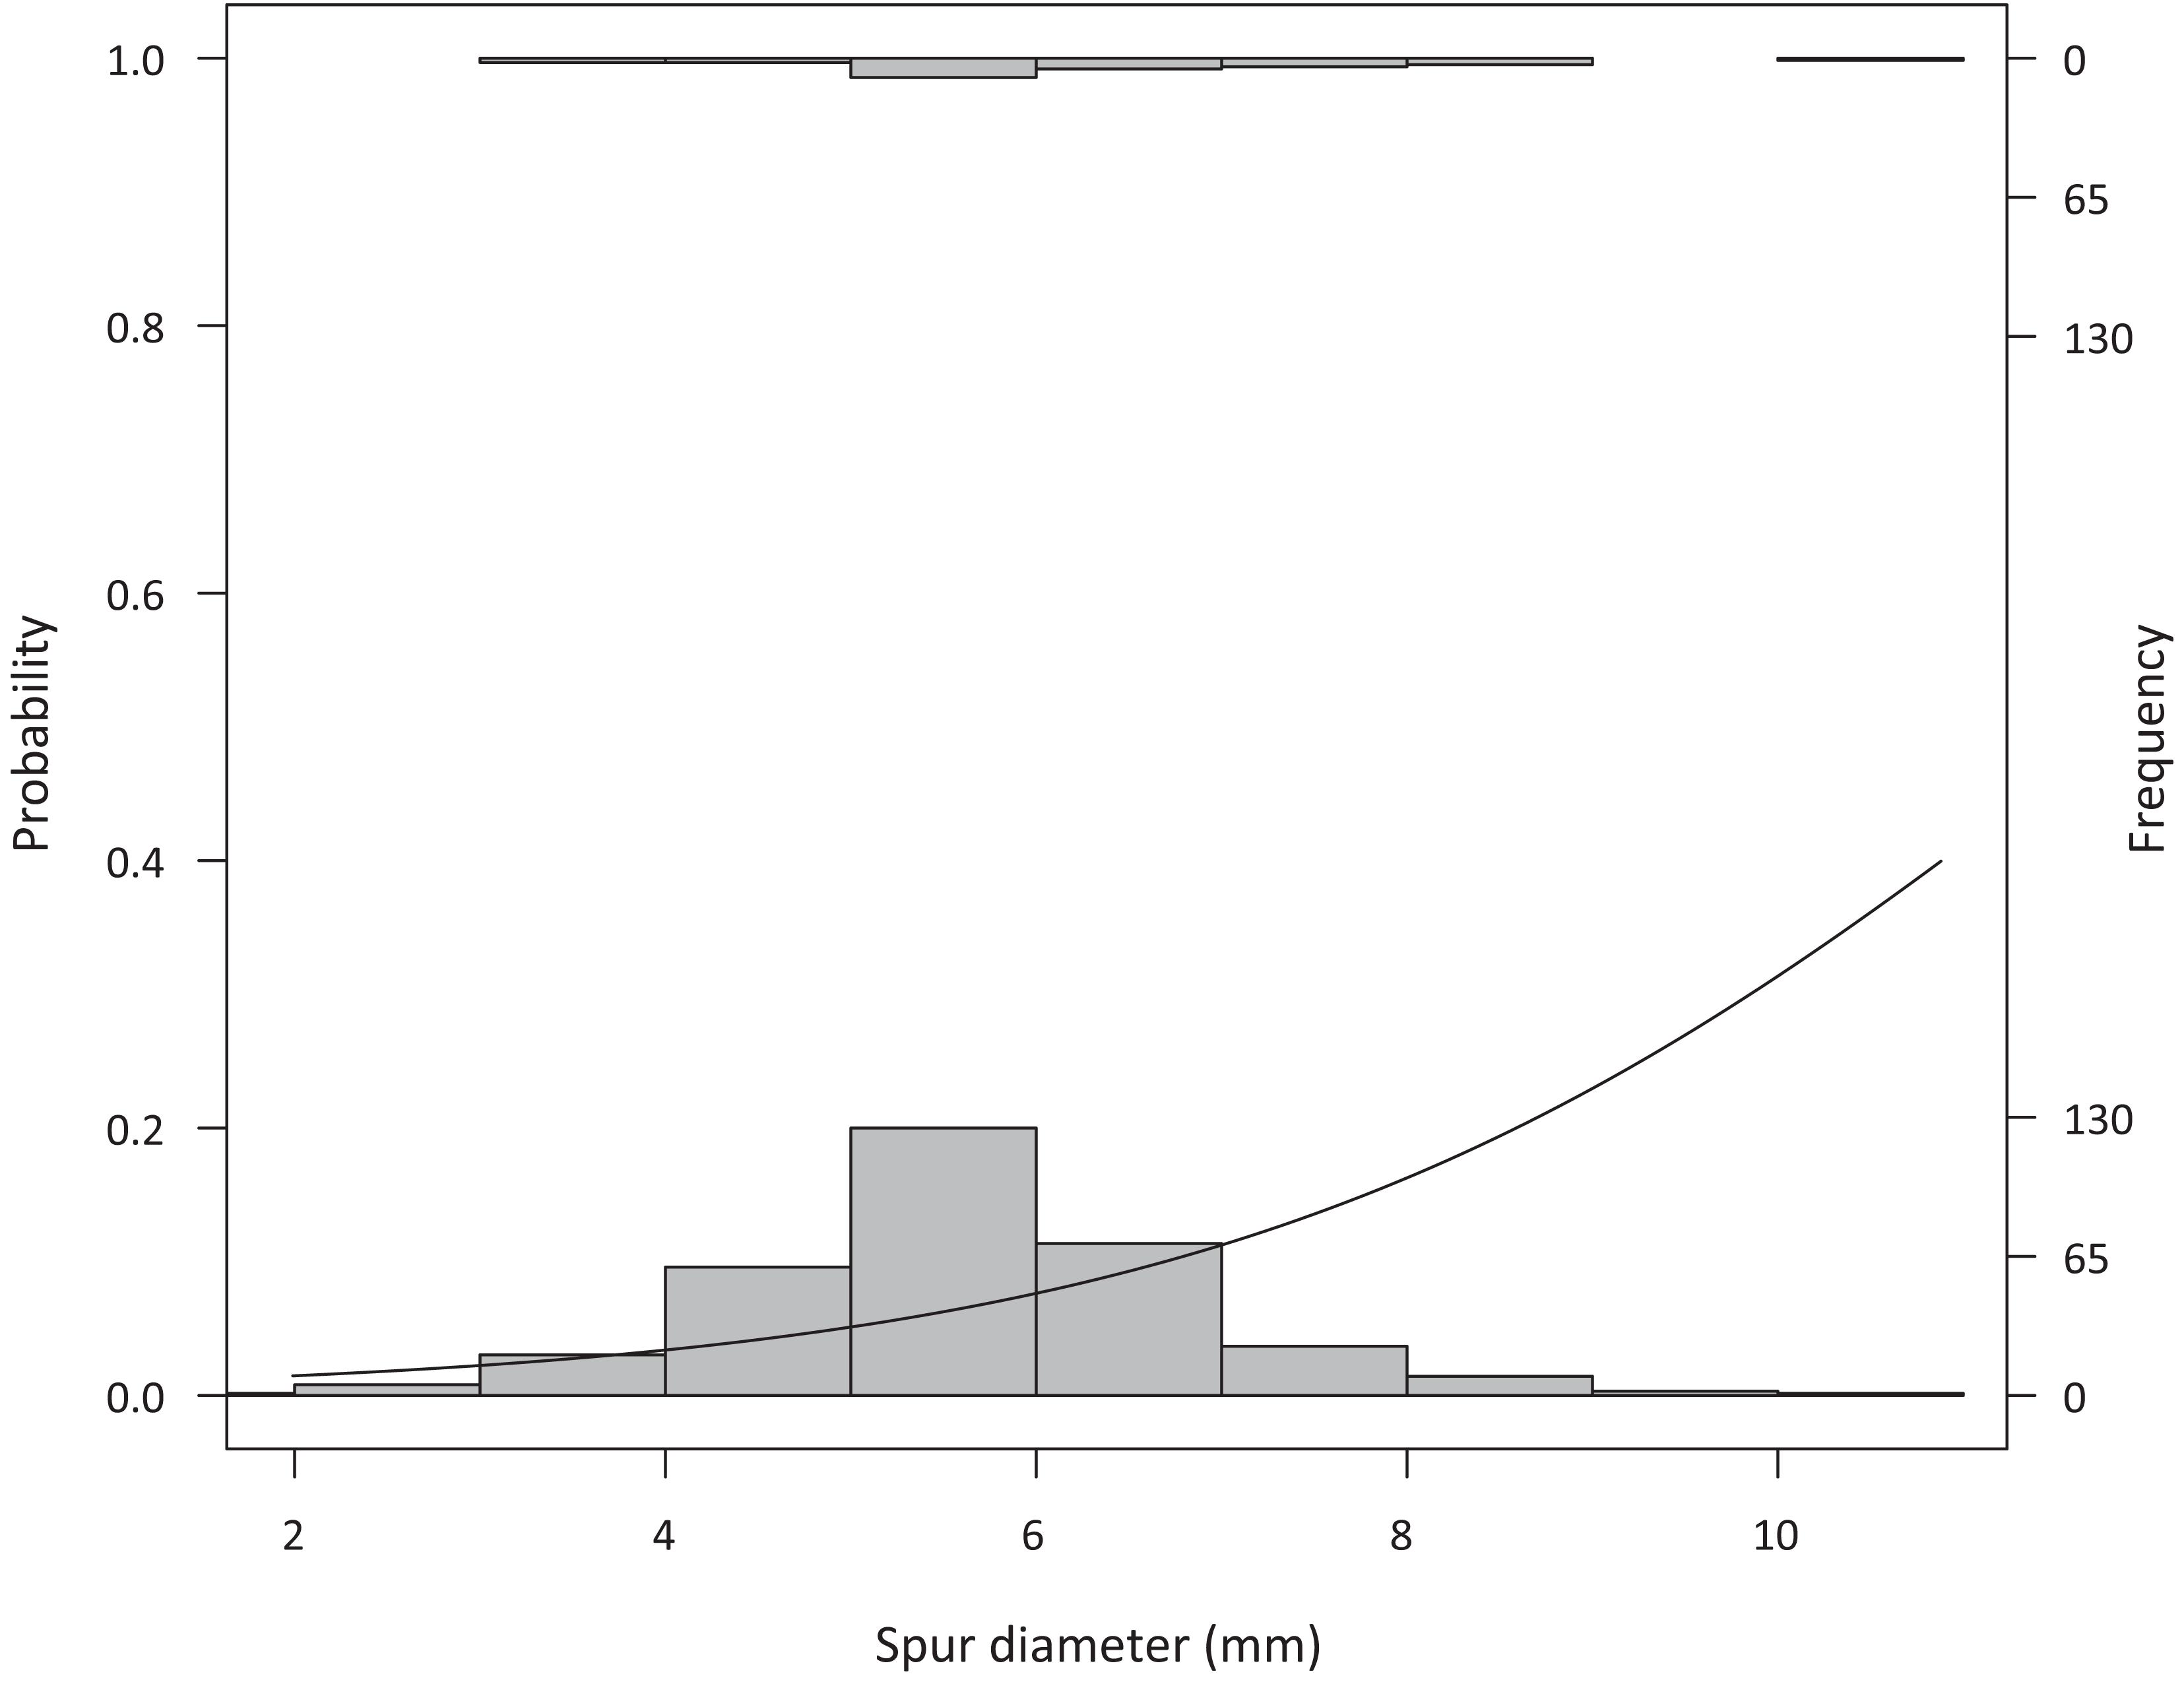
Figure 2. Spur diameter in greenhouse-grown vines (measured when plants were removed from dormancy) related to the probability that a plant would reach 50% flowering (Z(340) = 2.85, p = 0.004), with larger spur vines more often reaching 50% flowering. Histograms show the vines that did not reach 50% flowering (recorded in this analysis as 0 values, bottom) and those that did reach 50% flowering (recorded in this analysis as 1 values, top).
Soil moisture in the chambers varied by chamber temperature (F(1,24) = 8.05, p = 0.01), ranging from 69 to 76% over time. There was no directional relationship between the moisture levels and the chamber temperature (i.e., the warmest chambers were not the driest) and means were similar across treatments, ranging from 71 to 74%.
There was also no directional relationship between chamber temperature and either change in stem length or leaf appearance rate (stem length: F(1,24) = 0.53, p = 0.47; leaf appearance: F(1,24) = 0.05, p = 0.83).
Chamber temperatures did not affect the time it took for the plants to reach 10% and 50% flowering and there was no trend in the duration of flowering (Figure 3, 10%: F(1,20) = 0.43, p = 0.52; 50%: F(1,15) = 0.50, p = 0.49). Within treatments, the number of days after forcing it took plants to reach 10% flowering ranged from 34 to 51 days (mean = 42.6 ± 0.9).
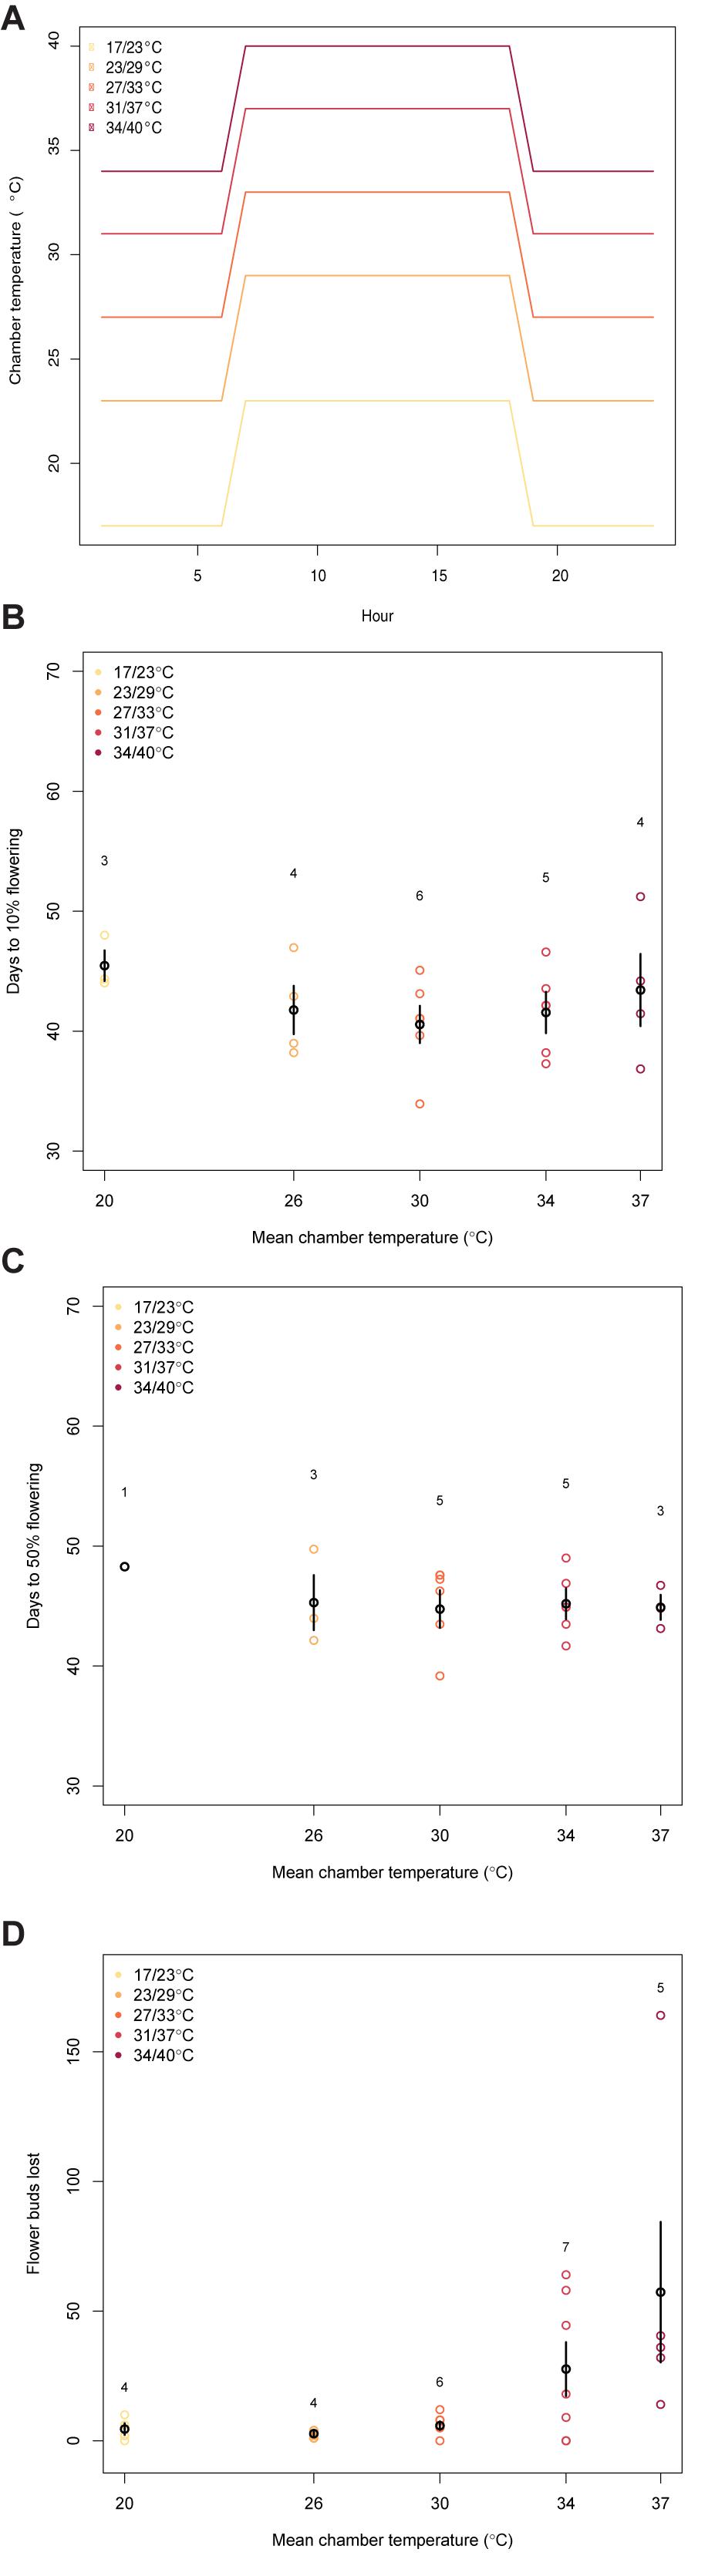
Figure 3. These figures illustrate the relationship between mean chamber temperature (treatments shown in panel (A) and (B) the days it took the plants to reach 10% flowering (F(1,20) = 0.43, p = 0.52), (C) the days it took the plants to reach 50% flowering (50%: F(1,15) = 0.50, p = 0.49), or (D) the number of flower buds lost while in the chamber (F(1,24) = 7.43, p = 0.01). The black points and bars show the average and error in each chamber. The number above each chamber’s data is the sample size. The colored points represent individual plants. The legend in the top left corner gives the night/day temperature for each chamber.)
The number of flower buds aborted per plant was significantly affected by the chamber temperature (Figure 3, F(1,24) = 7.43, p = 0.01). The two warmest chambers saw the greatest number of flower buds lost during the time in the chamber, with the greatest average number of flower buds aborted seen in 37°C treatment (mean number of flower buds aborted at 20°C: 4.5, 26°C: 2.8, 30°C: 5.8, 34°C: 27.6, 37°C: 57.3).
Discussion
Increasingly, winegrape diversity is suggested as a way for growers to cope with warming, but we know little about how experimental warming temperature differentially affects most varieties (Ollat et al., 2015, 2016; Wolkovich et al., 2017). Research to date has focused on very few (only 10 according to our literature review) varieties, but suggests responses vary depending on variety. For example, Greer and Weedon (2014) found a curvilinear ripening response to temperature (with warmer temperatures speeding development up to some high temperature, above which development slowed) across three varieties – but the temperature yielding the highest ripening varied for each variety (25, 35, and 40°C for Chardonnay, Semillion, and Merlot, respectively). Such variation is critical for growers who want to adapt to warming by shifting varieties, but to make useful variety recommendations we need more information on how temperature affects development across varieties and developmental stages. Our lab work on 50 varieties, however, highlights the challenges of growing diverse varieties for experimental research.
Effects of High Temperatures on Winegrape Flowering
Our lab work to examine how temperature affects flowering across diverse varieties failed to produce enough grapevines to study variety-specific effects. Yet, in pooling results across varieties, we found trends in line with previous studies.
Overall, we studied the effects of temperatures between a minimum of 17°C and maximum of 40°C (means of 20 to 37°C) on flowering for 26 winegrape plants. We found no directional relationship between temperature and soil moisture, stem length, leaf number, or the number of days it took to reach 10 or 50% flowering. Contrary to expectations of most phenological models (García de Cortázar-Atauri et al., 2010; Cuccia et al., 2014) and one previous growth chamber studies (Buttrose and Hale, 1973), we found that flowering phenology was not significantly delayed in either the coldest or warmest chambers. We expected development would slow (and thus phenology delay) at temperature extremes, especially at our upper temperature extreme of 37°C, however, phenology should generally advance until that extreme temperature. Our results suggest 37°C is not high enough to induce delays, a result in line with much of our literature review which found growth and phenology generally advanced up to 40°C (Table 1). Further, our results support previous work, which found that plants in the hotter treatments aborted a higher number of flowers than those in the cooler treatments (Greer and Weston, 2010). This abortion, because it translated to fewer observations of higher percentages of flowering (i.e., 50%), may have limited detection of slowed phenology at higher temperatures. Furthermore, our plants were only exposed to the higher temperatures during flowering, not before, which could have diminished potential differences in timing of phenology during that developmental phase.
The majority of literature on winegrape heat tolerance focuses on the effects of heat on berry ripening. In their 2010 study of Semillon winegrapes, Greer and Weston noted that plants treated with elevated temperatures at fruit set were much less vulnerable and suffered few ill-effects when compared with those treated at flowering, veraison, and mid-ripening. When heat-treated at fruit set, berry growth was unimpeded and sugar content increased normally. This could mean that winegrapes are more vulnerable to high temperatures during certain periods of development, i.e., flowering. If winegrapes are especially susceptible to heat during flowering, viticulturists will have to take extra precautions during this period to ensure the survival of the flowers through to fruit set.
Although we did not measure fruit-set, future studies may want to investigate how it could be affected by elevated temperatures during the flowering period. There could be a delay in response between the period of warming and the effects of high temperatures that was not seen in our experiment because the plants were heated during the developmental phase in which we were interested. Continuing observations through fruit-set could be an important next step to help understand more exactly how harvest yields will be impacted in a warming climate.
Utility of Lab-Grown Winegrape Plants for Future Research
Because the majority of the plants’ development did not form inflorescences (EL stage 12), sample sizes for our heat experiment were smaller than planned (each chamber had four to six plants). This meant there were not enough plants of each variety in each chamber to test for a difference in varietal response to the heat treatments, and instead we analyzed our findings across varieties (as most varieties were only represented in a single treatment). Still, it is important to note that we studied ten different varieties in the chambers, which greatly increased the genetic diversity of the experiment. It has been shown that controlled ecological experiments in labs that include greater genetic diversity are more easily replicated (Milcu et al., 2018).
Further, we found high variation in flowering success – plants with larger spurs were more likely to form inflorescence and flower and some varieties were far more successful in flowering than others. This suggests plants with greater carbohydrate reserves were more likely to develop inflorescence and flower, similar to the results of Eltom (2013) on the effects of girdling and leaf removal on inflorescence development, but with additional variation across varieties, as other studies have found (Lebon et al., 2005). Thus, future experiments may want to (at least initially) focus lab efforts on these more successful varieties and tease out high and low temperature limits to help guide further research.
The rate of development seen in the plants grown in the greenhouse was significantly correlated with that seen in the winegrapes grown in the Robert Mondavi Institute Vineyard, from which the cuttings in this experiment were taken (Figure 1). This suggests that the overall progression and timing of phenological development was not dramatically altered by the lab setting and supports the use of potted plants in the lab used alongside field data to better understand and predict winegrape responses to climate change. Our finding that plants with larger spurs were more likely to flower, however, suggests that our results regarding flower development in the greenhouse and flowering (and flower abortion) in the growth chambers should be interpreted cautiously.
Our vines, taken from field cuttings, were in only their first growing season, and this represents a major limitation of our study. We expect flowering success across varieties would be greater for older, larger vines, and our findings should be interpreted cautiously until further studies are completed on older vines. In the literature, studies vary in using <1 year-old potted cutting, to 3-to 5-year-old potted vines, to established vineyard plants. This diversity of vine age across studies that also vary treatments makes it difficult to attribute variation in findings to age, but our results suggest older vines may be most relevant and useful for studies on heat tolerance and warming effects.
While this study was unable to adequately address varietal differences in response to warming as a result of climate change, it provided valuable insight into challenges of variety-rich winegrape studies. Based on the outcome of our study, we recommend the following strategies to improve the success of similar future studies: (1) Use older vines or those with thicker diameters (which indirectly corresponds to greater carbohydrate reserves) to ensure a higher number of plants form inflorescences and undergo flowering. (2) Consider mesh bags to trap flowers; because we contained inflorescences in paper bags, we may have restricted air flow during a critical period of development, limiting photosynthesis. (3) Examine effects of gradual versus sudden temperature increases. Providing a transitional period for plants when they are moved into chambers and raising temperatures gradually could prevent shock or stress on the plants that could exacerbate flower abscission, but a more sudden temperature changes may be relevant for weather changes with climate change (Gouot et al., 2019).
Conclusion
Helping growers adapt to shifting terroirs requires research on a greater diversity of Vitis vinifera varieties across diverse temperature regimes. Here we showed that budburst and leafout phenology of 50 varieties grown in the field correlated with field-based phenology and that higher temperatures can negatively impact flowering. While heat treatments during flowering did not affect the phenology of the grapes we studied, we found a significant impact from the elevated temperatures on flower abortions, in line with previous studies, which could lead to substantial negative impacts on yield. Despite the difficulties we faced implementing a variety-rich experiment, lessons we learned can inform future studies to increase success and provide further guidance for academics and professionals alike. Our findings underscore the importance of modeling more than the plants’ phenology to fully understand the impacts climate change will have on the viticulture industry. As data across more diverse varieties and temperature regimes increases, it can help support mapping when and where different varieties may perform best as warming continues.
Data Availability Statement
Greenhouse and growth chamber datasets available at https://knb.ecoinformatics.org/view/urn%3Auuid%3A59f80d14-bc09-49a6-8143-0e2823bab9a2. Field datasets from UC Davis available at https://knb.ecoinformatics.org/view/doi:10.5063/F18G8J29.
Author Contributions
EW and NM performed the analysis and designed the methods for the experiment with input from IGCA, AP, and MW. NM collected the data and wrote the manuscript. EW, IGCA, AP, and MW edited the manuscript. All authors contributed to the article and approved the submitted version.
Funding
This research was funded by Harvard University.
Conflict of Interest
The authors declare that the research was conducted in the absence of any commercial or financial relationships that could be construed as a potential conflict of interest.
The reviewer, OF, declared a past co-authorship with one of the authors, MW, to the handling editor.
The reviewer, HF, declared a past co-authorship with one of the authors, IGCA, to the handling editor.
Acknowledgments
We thank R. Antolick for assistance with the literature review, E. Forrestel for taking cuttings and starting plants in the greenhouse, and S. Sutphin for data collection in the field in Davis, and three reviewers for comments that improved the manuscript.
References
Anderson, K. (2013). Which Winegrape Varieties are Grown Where?: a Global Picture. Adelaide: University of Adelaide Press.
Boursiquot, J. M., Dessup, M., and Rennes, C. (1995). Distribution des principaux caracteres phenologiques, agronomiques et technologiques chez Vitis vinifera L. Vitis 34, 31–35.
Buchmann, N., and Ehleringer, J. R. (1998). CO2 concentration profiles, and carbon and oxygen isotopes in C3 and C4 crop canopies. Agric. For. Meteorol. 89, 45–58. doi: 10.1016/S0168-1923(97)00059-2
Buttrose, M. S., and Hale, C. R. (1973). Effect of temperature on development of the grapevine inflorescence after bud burst. Am. J. Enol. Vitic. 24:14.
Cook, B. I., and Wolkovich, E. M. (2016). Climate change decouples drought from early wine grape harvests in France. Nat. Clim. Change 6, 715–719. doi: 10.1038/nclimate2960
Coombe, B. G. (1995). Growth stages of the grapevine: adoption of a system for identifying grapevine growth stages. Aust. J. Grape Wine Res. 1, 104–110. doi: 10.1111/j.1755-0238.1995.tb00086.x
Cuccia, C., Bois, B., Richard, Y., Parker, A. K., García de Cortázar-Atauri, I., Van Leeuwen, C., et al. (2014). Phenological model performance to warmer conditions: application to Pinot Noir in Burgundy. J. Int. Sci. Vigne Vin. 48, 169–178. doi: 10.20870/oeno-one.2014.48.3.1572
Duchêne, E. (2016). How can grapevine genetics contribute to the adaptation to climate change? OENO One 50:98. doi: 10.20870/oeno-one.2016.50.3.98
Duchêne, E., and Schneider, C. (2005). Grapevine and climatic changes: a glance at the situation in Alsace. Agron. Sustain. Dev. 25, 93–99. doi: 10.1051/agro:2004057
Edwards, E. J., Unwin, D., Kilmister, R., and Treeby, M. (2017). Multi-seasonal effects of warming and elevated CO2 on the physiology, growth and production of mature, field grown, Shiraz grapevines. OENO One 51:127. doi: 10.20870/oeno-one.2016.0.0.1586
Eltom, M. (2013). Influence of Temperature and Carbohydrate Availability on the Bunch Architecture of Vitis vinifera L. Sauvignon Blanc. Ph. D thesis, Lincoln University, Lincoln.
García de Cortázar-Atauri, I., Chuine, I., Donatelli, M., Parker, A., and van Leeuwen, C. (2010). “A curvilinear phenological model to study impacts of climate change on grapevine,” in Proceedings of “Agro2010 the XIth ESA Congress”, Montpellier, France, 907–908.
García de Cortázar-Atauri, I., Duchêne, E., Destrac-Irvine, A., Barbeau, G., Rességuier, L., de Lacombe, T., et al. (2017). Grapevine phenology in France: from past observations to future evolutions in the context of climate change. OENO One 51:1622. doi: 10.20870/oeno-one.2017.51.2.1622
Gouot, J. C., Smith, J., Holzapfel, B., and Barril, C. (2019). Single and cumulative effects of whole-vine heat events on Shiraz berry composition. OENO One 53, 171–187. doi: 10.20870/oeno-one.2019.53.2.2392
Greer, D., and Weedon, M. (2014). Temperature-dependent responses of the berry developmental processes of three grapevine (Vitis vinifera) cultivars. N. Z. J. Crop Hortic. Sci. 42, 233–246. doi: 10.1080/01140671.2014.894921
Greer, D. H., and Weedon, M. M. (2013). The impact of high temperatures on Vitis vinifera cv. Semillon grapevine performance and berry ripening. Front. Plant Sci. 4:491. doi: 10.3389/fpls.2013.00491
Greer, D. H., and Weston, C. (2010). Heat stress affects flowering, berry growth, sugar accumulation and photosynthesis of Vitis vinifera cv. Semillon grapevines grown in a controlled environment. Funct. Plant Biol. 37, 206–214. doi: 10.1071/FP09209
Hannah, L., Roehrdanz, P. R., Ikegami, M., Shepard, A. V., Shaw, M. R., Tabor, G., et al. (2013). Climate change, wine, and conservation. Proc. Natl. Acad. Sci. U.S.A. 110, 6907–6912. doi: 10.1073/pnas.1210127110
Jones, G. V. (2013). “Winegrape phenology,” in Phenology: An Integrative Environmental Science, ed. M. D. Schwartz (Berlin: Springer), 563–584. doi: 10.1007/978-94-007-6925-0_30
Kadir, S. (2006). Thermostability of photosynthesis of Vitis aestivalis and V. vinifera. J. Am. Soc. Hortic. Sci. 131, 476–483. doi: 10.21273/JASHS.131.4.476
Kliewar, W. M. (1977). Effect of high temperatures during the bloom-set period on fruit-set, ovule fertility, and berry growth of several grape cultivars. Am. J. Enol. Vitic. 28, 215–222.
Labbé, T. P. (2019). The longest homogenous series of grape harvest dates, Beaune 1354-2018, and its significance for the understanding of past and present climate. Clim. Past 65, 1485–1501. doi: 10.5194/cp-15-1485-2019
Lacombe, T. (2012). “Contribution à l’étude de l’histoire évolutive de la vigne cultivée (Vitis vinifera L.) par l’analyse de la diversité génétique neutre et de gènes d’intérêt,” in Thèse en Biodiversité et écologie, Institut National d’Etudes Supérieures Agronomiques de Montpellier, 94.
Lebon, G., Duchêne, E., Brun, O., and Clément, C. (2005). Phenology of flowering and starch accumulation in Grape (Vitis vinifera L.) cuttings and vines. Ann. Bot. 95, 943–948. doi: 10.1093/aob/mci108
Menzel, A., Sparks, T. H., Estrella, N., Koch, E., Aasa, A., Ahas, R., et al. (2006). European phenological response to climate change matches the warming pattern. Glob. Change Biol. 12, 1969–1976. doi: 10.1111/j.1365-2486.2006.01193.x
Milcu, A., Puga-Freitas, R., Ellison, A. M., Blouin, M., Scheu, S., Freschet, G. T., et al. (2018). Genotypic variability enhances the reproducibility of an ecological study. Nat. Ecol. Evol. 2, 279–287. doi: 10.1038/s41559-017-0434-x
Morales-Castilla, I., García de Cortázar-Atauri, I., Cook, B. I., Lacombe, T., Parker, A., van Leeuwen, C., et al. (2020). Diversity buffers winegrowing regions from climate change losses. Proc. Natl. Acad. Sci. U.S.A. 117, 2864–2869. doi: 10.1073/pnas.1906731117
Mortazavi, B., and Chanton, J. P. (2002). Carbon isotopic discrimination and control of nighttime canopy δ 18 O-CO2 in a pine forest in the southeastern United States: isotopic discrimination in a pine forest. Glob. Biogeochem. Cycles 16:8. doi: 10.1029/2000GB001390
Mozell, M. R., and Thach, L. (2014). The impact of climate change on the global wine industry: challenges & solutions. Wine Econ. Policy 3, 81–89. doi: 10.1016/j.wep.2014.08.001
Myles, S. (2013). Improving fruit and wine: what does genomics have to offer? Trends Genet. 29, 190–196. doi: 10.1016/j.tig.2013.01.006
Ollat, N., Quénol, H., Barbeau, G., van Leeuwen, C., Darriet, P., García de Cortázar-Atauri, I., et al. (2015). Adaptation to climate change: strategic issues to face for the French wine industry. Web Confer. 50:01020.
Ollat, N., Touzard, J.-M., and van Leeuwen, C. (2016). Climate change impacts and adaptations: new challenges for the wine industry. J. Wine Econ. 11, 139–149. doi: 10.1017/jwe.2016.3
Parker, A., García de Cortázar-Atauri, I., Chuine, I., Barbeau, G., Bois, B., Boursiquot, J.-M., et al. (2013). Classification of varieties for their timing of flowering and veraison using a modelling approach: a case study for the grapevine species Vitis vinifera L. Agric. For. Meteorol. 180, 249–264. doi: 10.1016/j.agrformet.2013.06.005
Parker, A. K., De Cortazar-Atauri, I. G., Van Leeuwen, C., and Chuine, I. (2011). General phenological model to characterise the timing of flowering and veraison of Vitis vinifera L. Aust. J. Grape Wine Res. 17, 206–216. doi: 10.1111/j.1755-0238.2011.00140.x
Petrie, P. R., and Clingeleffer, P. R. (2005). Effects of temperature and light (before and after budburst) on inflorescence morphology and flower number of Chardonnay grapevines (Vitis vinifera L.). Aust. J. Grape Wine Res. 11, 59–65. doi: 10.1111/j.1755-0238.2005.tb00279.x
Root, T. L., Price, J. T., Hall, K. R., Schneider, S. H., Rosenzweig, C., and Pounds, J. A. (2003). Fingerprints of global warming on wild animals and plants. Nature 421:57. doi: 10.1038/nature01333
Salazar-Parra, C., Aguirreolea, J., Sánchez-Díaz, M., Irigoyen, J., and Morales, F. (2010). Effects of climate change scenarios on Tempranillo grapevine (Vitis vinifera L.) ripening: response to a combination of elevated CO2 and temperature, and moderate drought. Plant Soil 337, 179–191. doi: 10.1007/s11104-010-0514-z
Schultz, H. R., and Jones, G. V. (2010). Climate induced historic and future changes in viticulture. J. Wine Res. 21, 137–145. doi: 10.1080/09571264.2010.530098
Sepúlveda, G., Kliewer, W. M., and Ryugo, K. (1986). Effect of high temperature on grapevines (Vitis vinifera L.). I. translocation of 14C-photosynthates. Am. J. Enol. Vitic. 37, 13–19.
Soar, C., Collins, M., and Sadras, V. (2009). Irrigated Shiraz vines (Vitis vinifera) upregulate gas exchange and maintain berry growth in response to short spells of high maximum temperature in the field. Funct. Plant Biol. 36, 801–814. doi: 10.1071/FP09101
Van Leeuwen, C., Destrac-Irvine, A., Dubernet, M., Duchêne, E., Gowdy, M., Marguerit, E., et al. (2019). An update on the impact of climate change in viticulture and potential adaptations. Agronomy 9:514. doi: 10.3390/agronomy9090514
Wang, J., Zhang, X., Su, L., Li, H., Zhang, L., and Wei, J. (2020). Global warming effects on climate zones for wine grape in Ningxia region, China. Theor. Appl. Climatol. 140, 1527–1536. doi: 10.1007/s00704-020-03170-y
Wolkovich, E. M., Burge, D. O., Walker, M. A., and Nicholas, K. A. (2017). Phenological diversity provides opportunities for climate change adaptation in winegrapes. J. Ecol. 105, 905–912. doi: 10.1111/1365-2745.12786
Zaka, S., Ahmed, L. Q., Escobar-Gutiérrez, A. J., Gastal, F., Julier, B., and Louarn, G. (2017). How variable are non-linear developmental responses to temperature in two perennial forage species? Agric. For. Meteorol. 232, 433–442. doi: 10.1016/j.agrformet.2016.10.004
Keywords: phenology, climate change, heat stress, flowering, lab conditions, Vitis vinifera subsp. vinifera
Citation: Merrill NK, García de Cortázar-Atauri I, Parker AK, Walker MA and Wolkovich EM (2020) Exploring Grapevine Phenology and High Temperatures Response Under Controlled Conditions. Front. Environ. Sci. 8:516527. doi: 10.3389/fenvs.2020.516527
Received: 16 December 2019; Accepted: 21 October 2020;
Published: 23 November 2020.
Edited by:
Luca Brillante, California State University, Fresno, United StatesReviewed by:
Osvaldo Failla, University of Milan, ItalyHelder Fraga, University of Trás-os-Montes and Alto Douro, Portugal
Antonello Bonfante, National Research Council (CNR), Italy
Copyright © 2020 Merrill, García de Cortázar-Atauri, Parker, Walker and Wolkovich. This is an open-access article distributed under the terms of the Creative Commons Attribution License (CC BY). The use, distribution or reproduction in other forums is permitted, provided the original author(s) and the copyright owner(s) are credited and that the original publication in this journal is cited, in accordance with accepted academic practice. No use, distribution or reproduction is permitted which does not comply with these terms.
*Correspondence: N. K. Merrill, nmerrill@uoregon.edu