The Adsorption Selectivity of Short and Long Per- and Polyfluoroalkyl Substances (PFASs) from Surface Water Using Powder-Activated Carbon


Abstract
:1. Introduction
2. Materials and Methods
2.1. Chemicals
2.2. Preparation of the PACs
2.3. Adsorption Experiments
2.4. Analysis
3. Results and Discussion
3.1. Properties of PACs
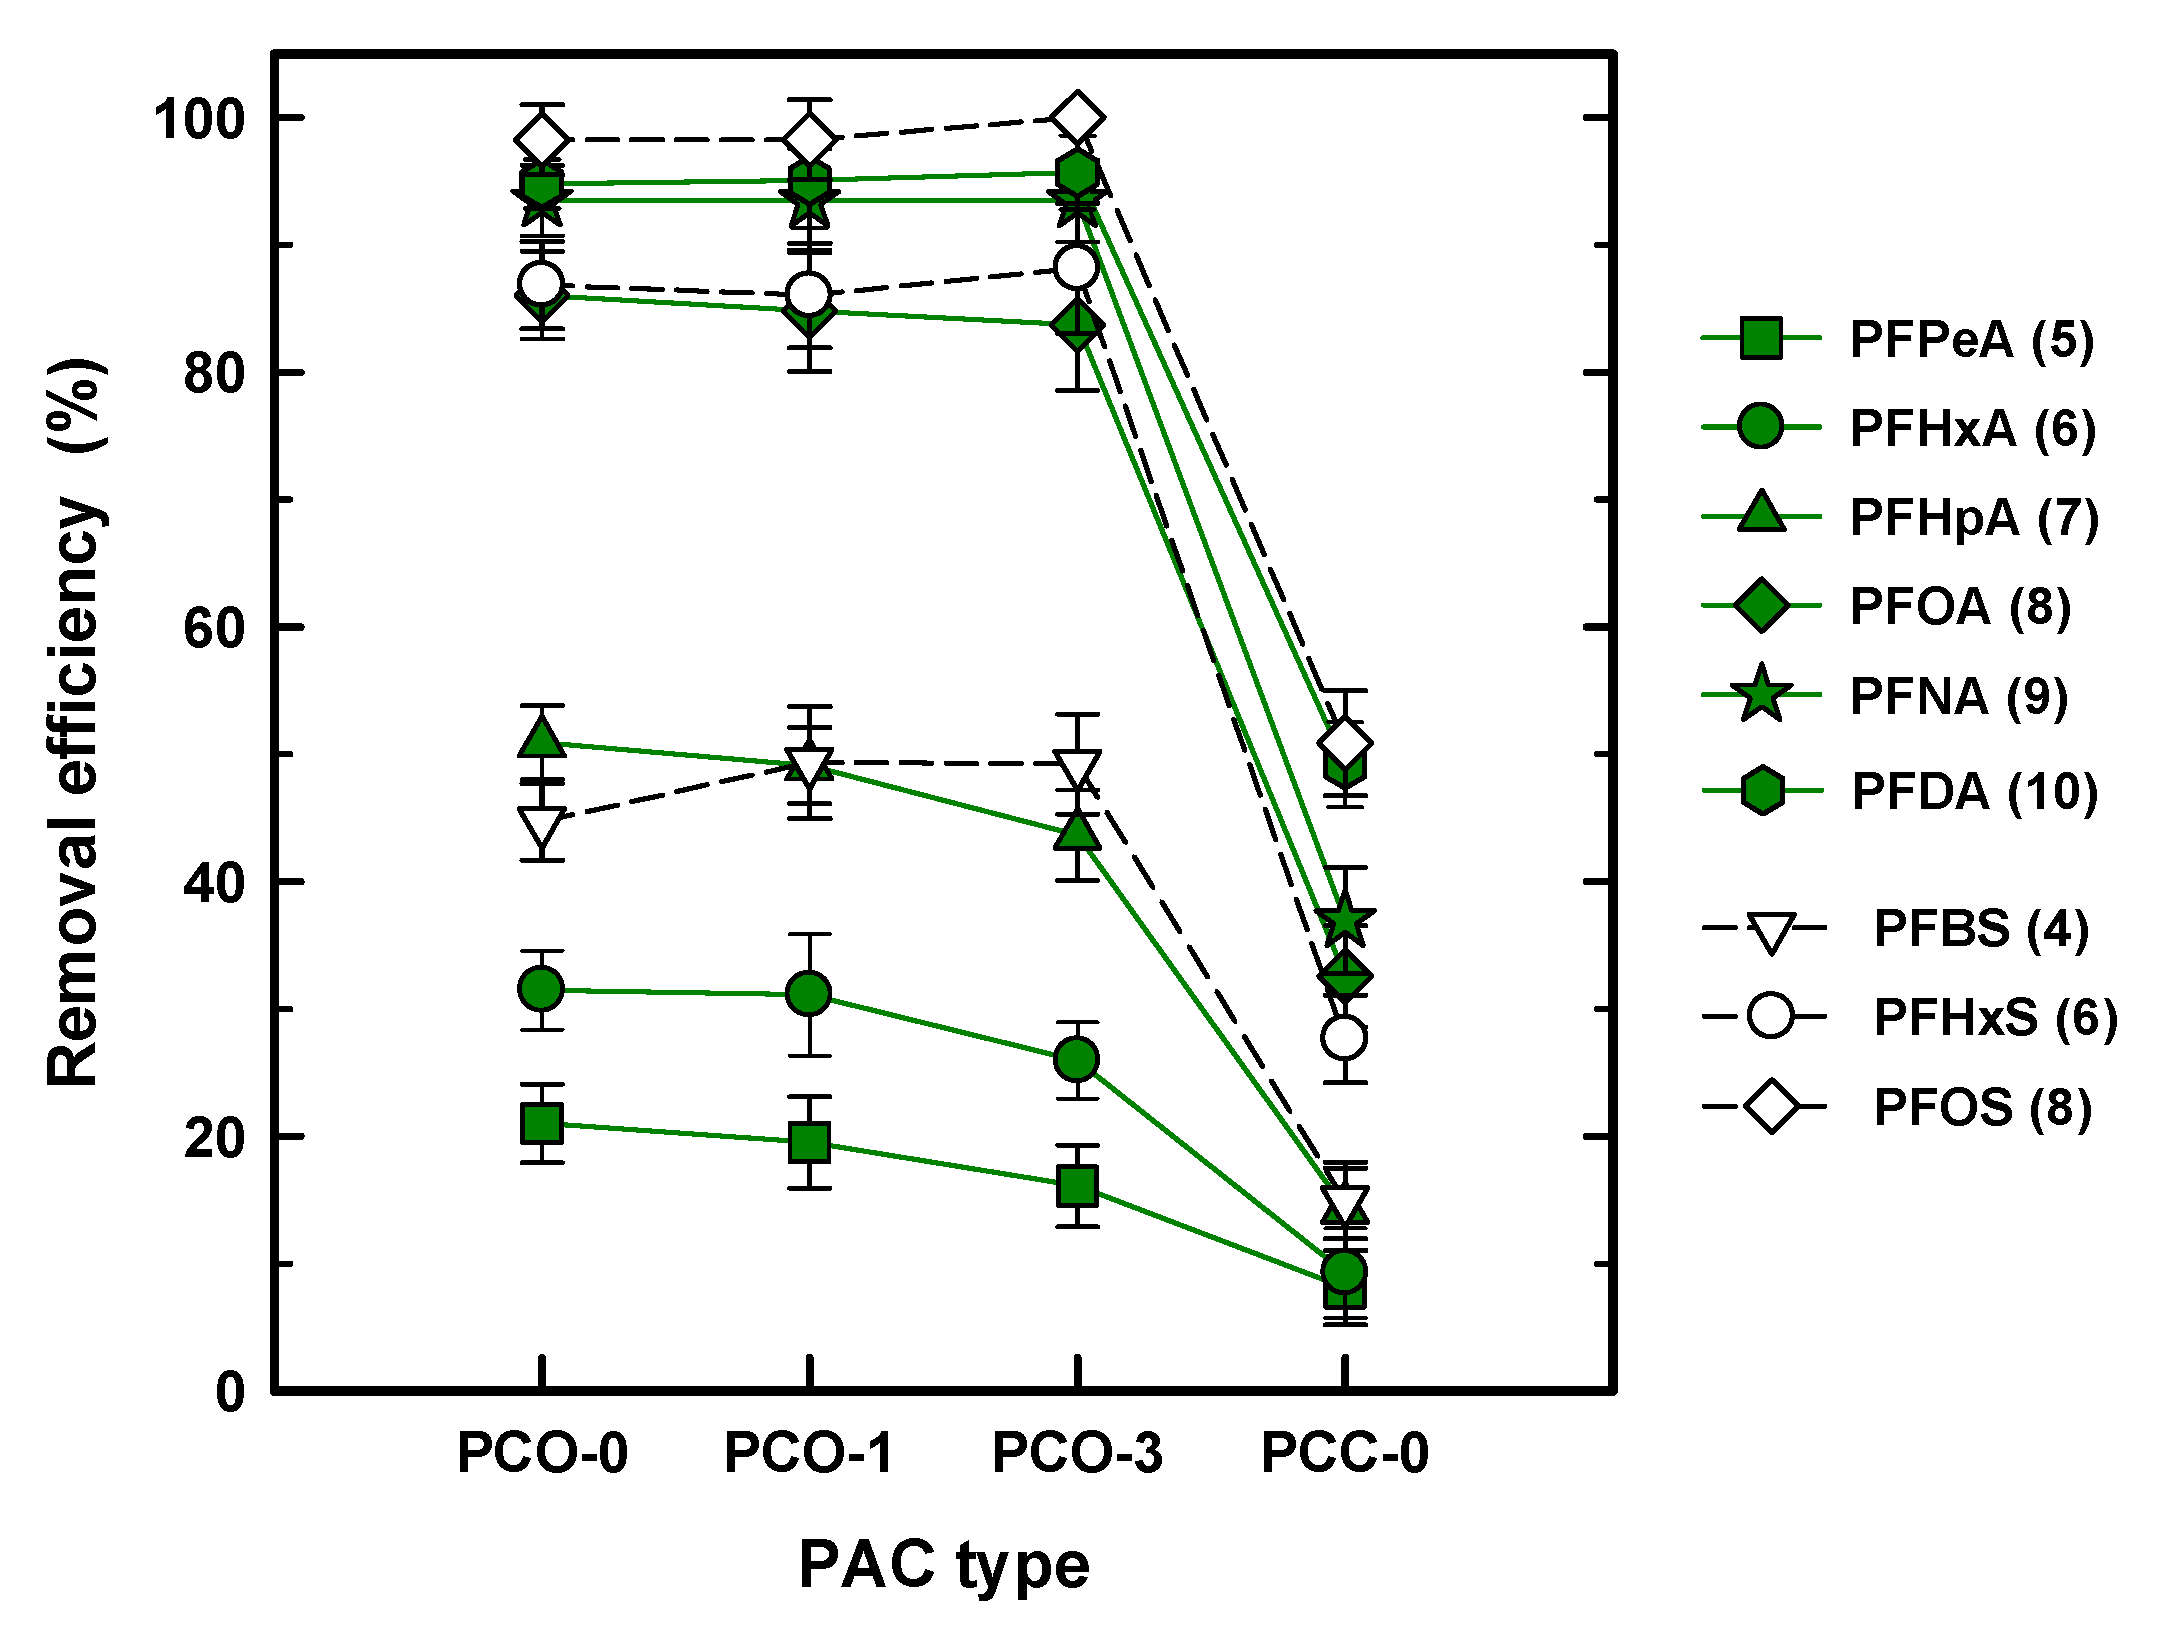
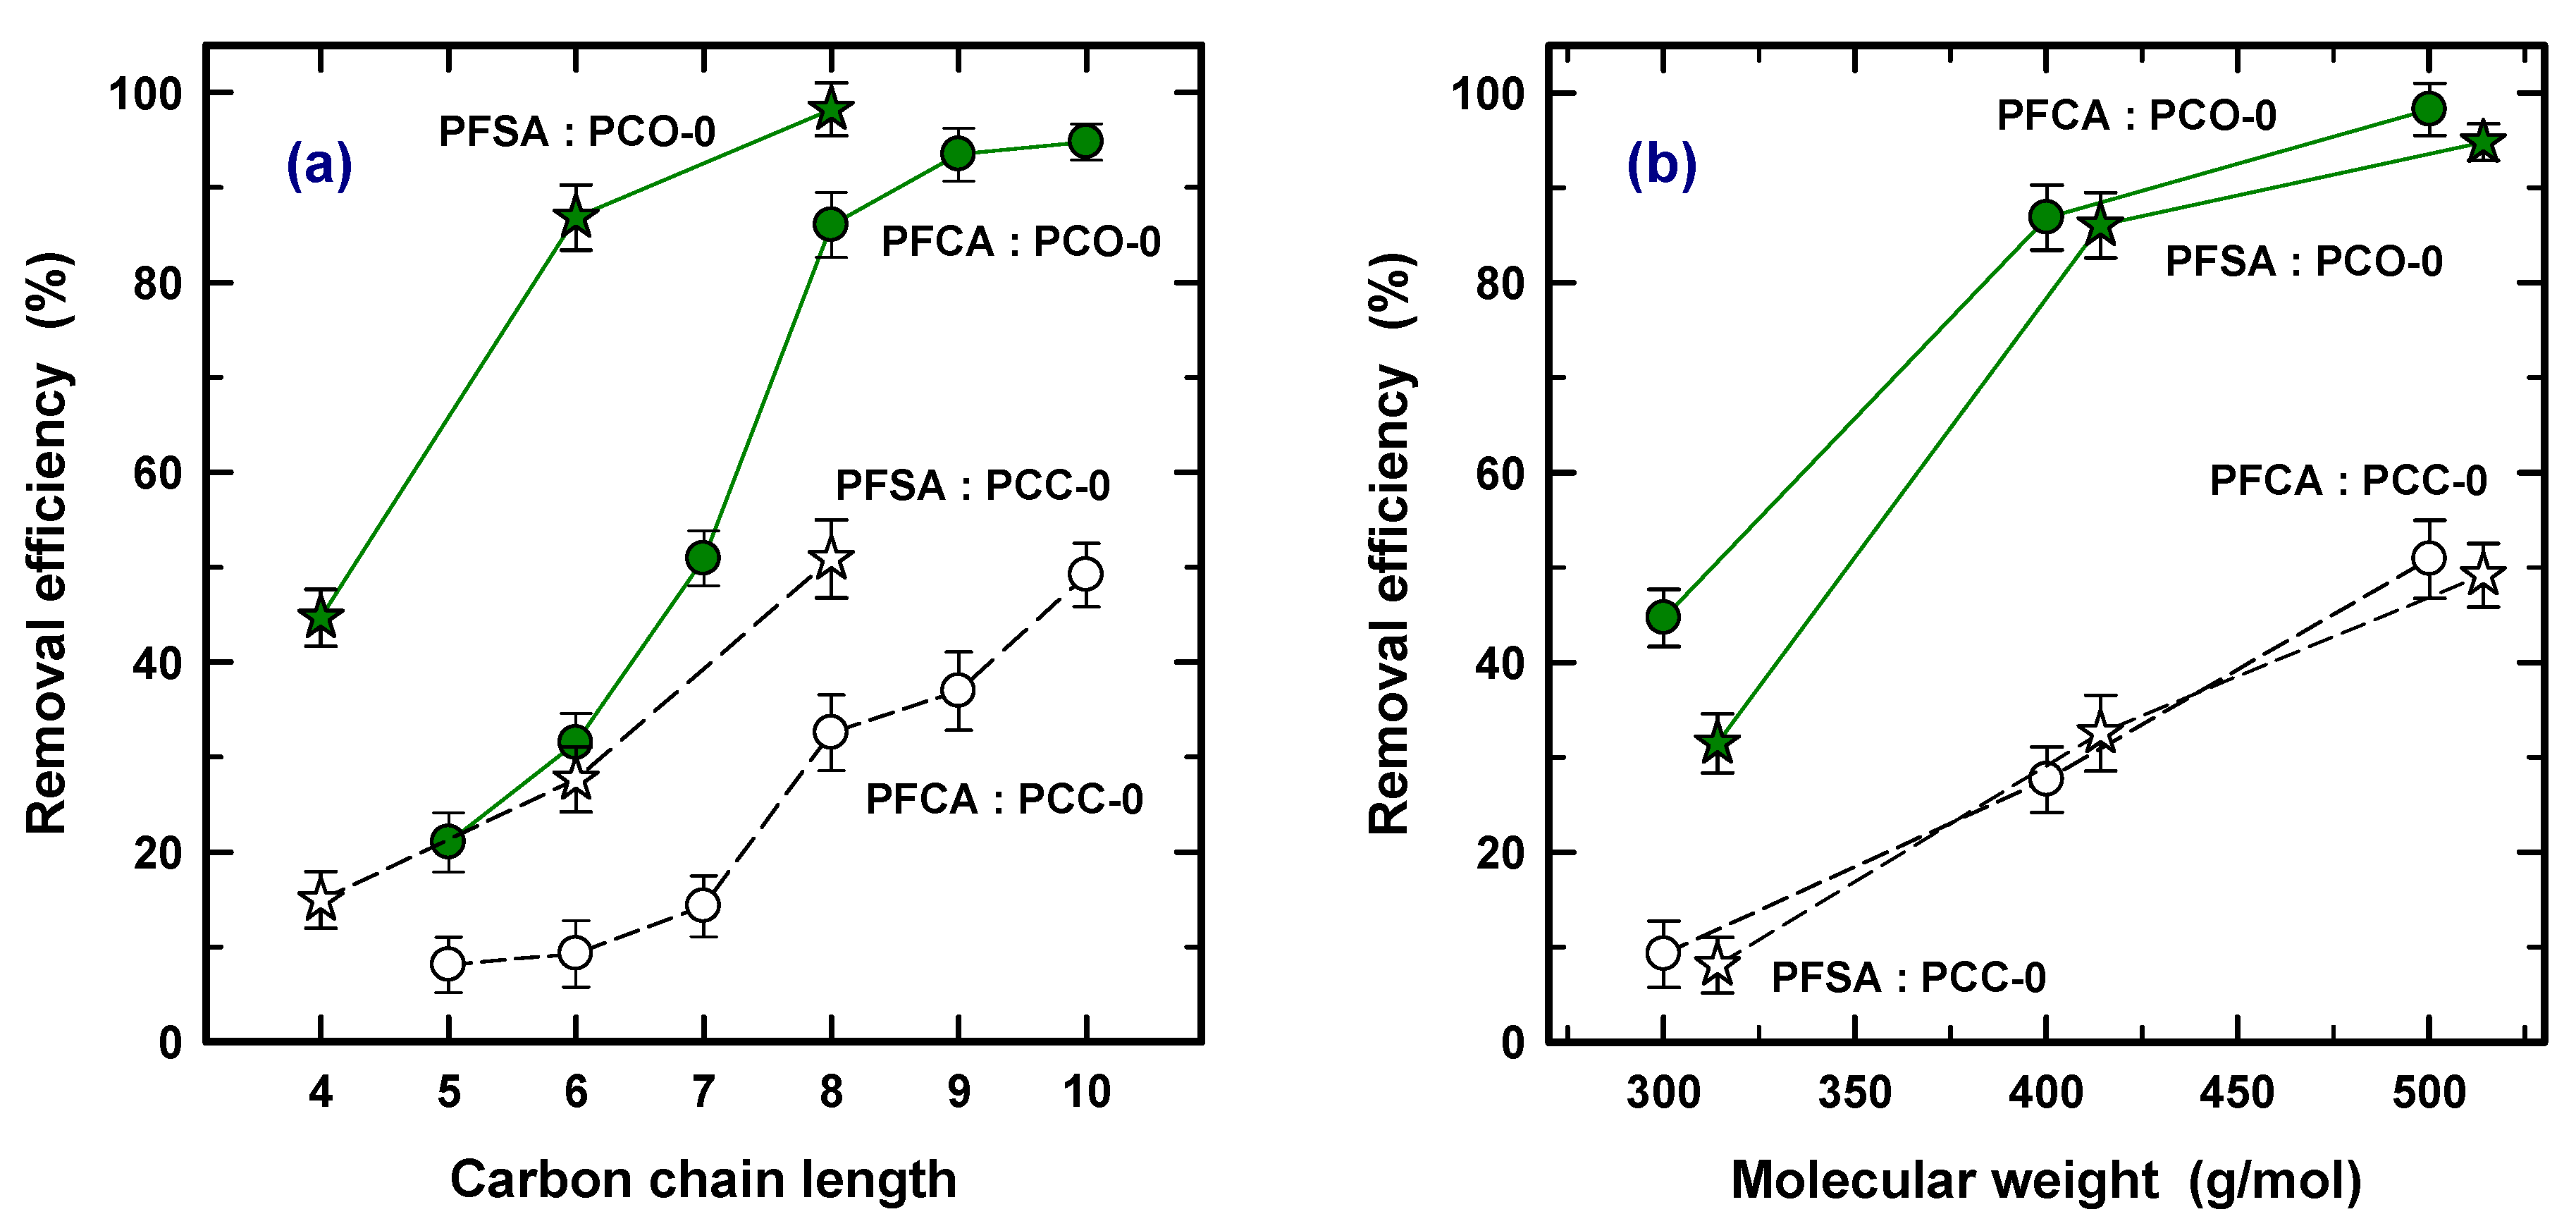
3.2. Removal Efficiency of the PFASs
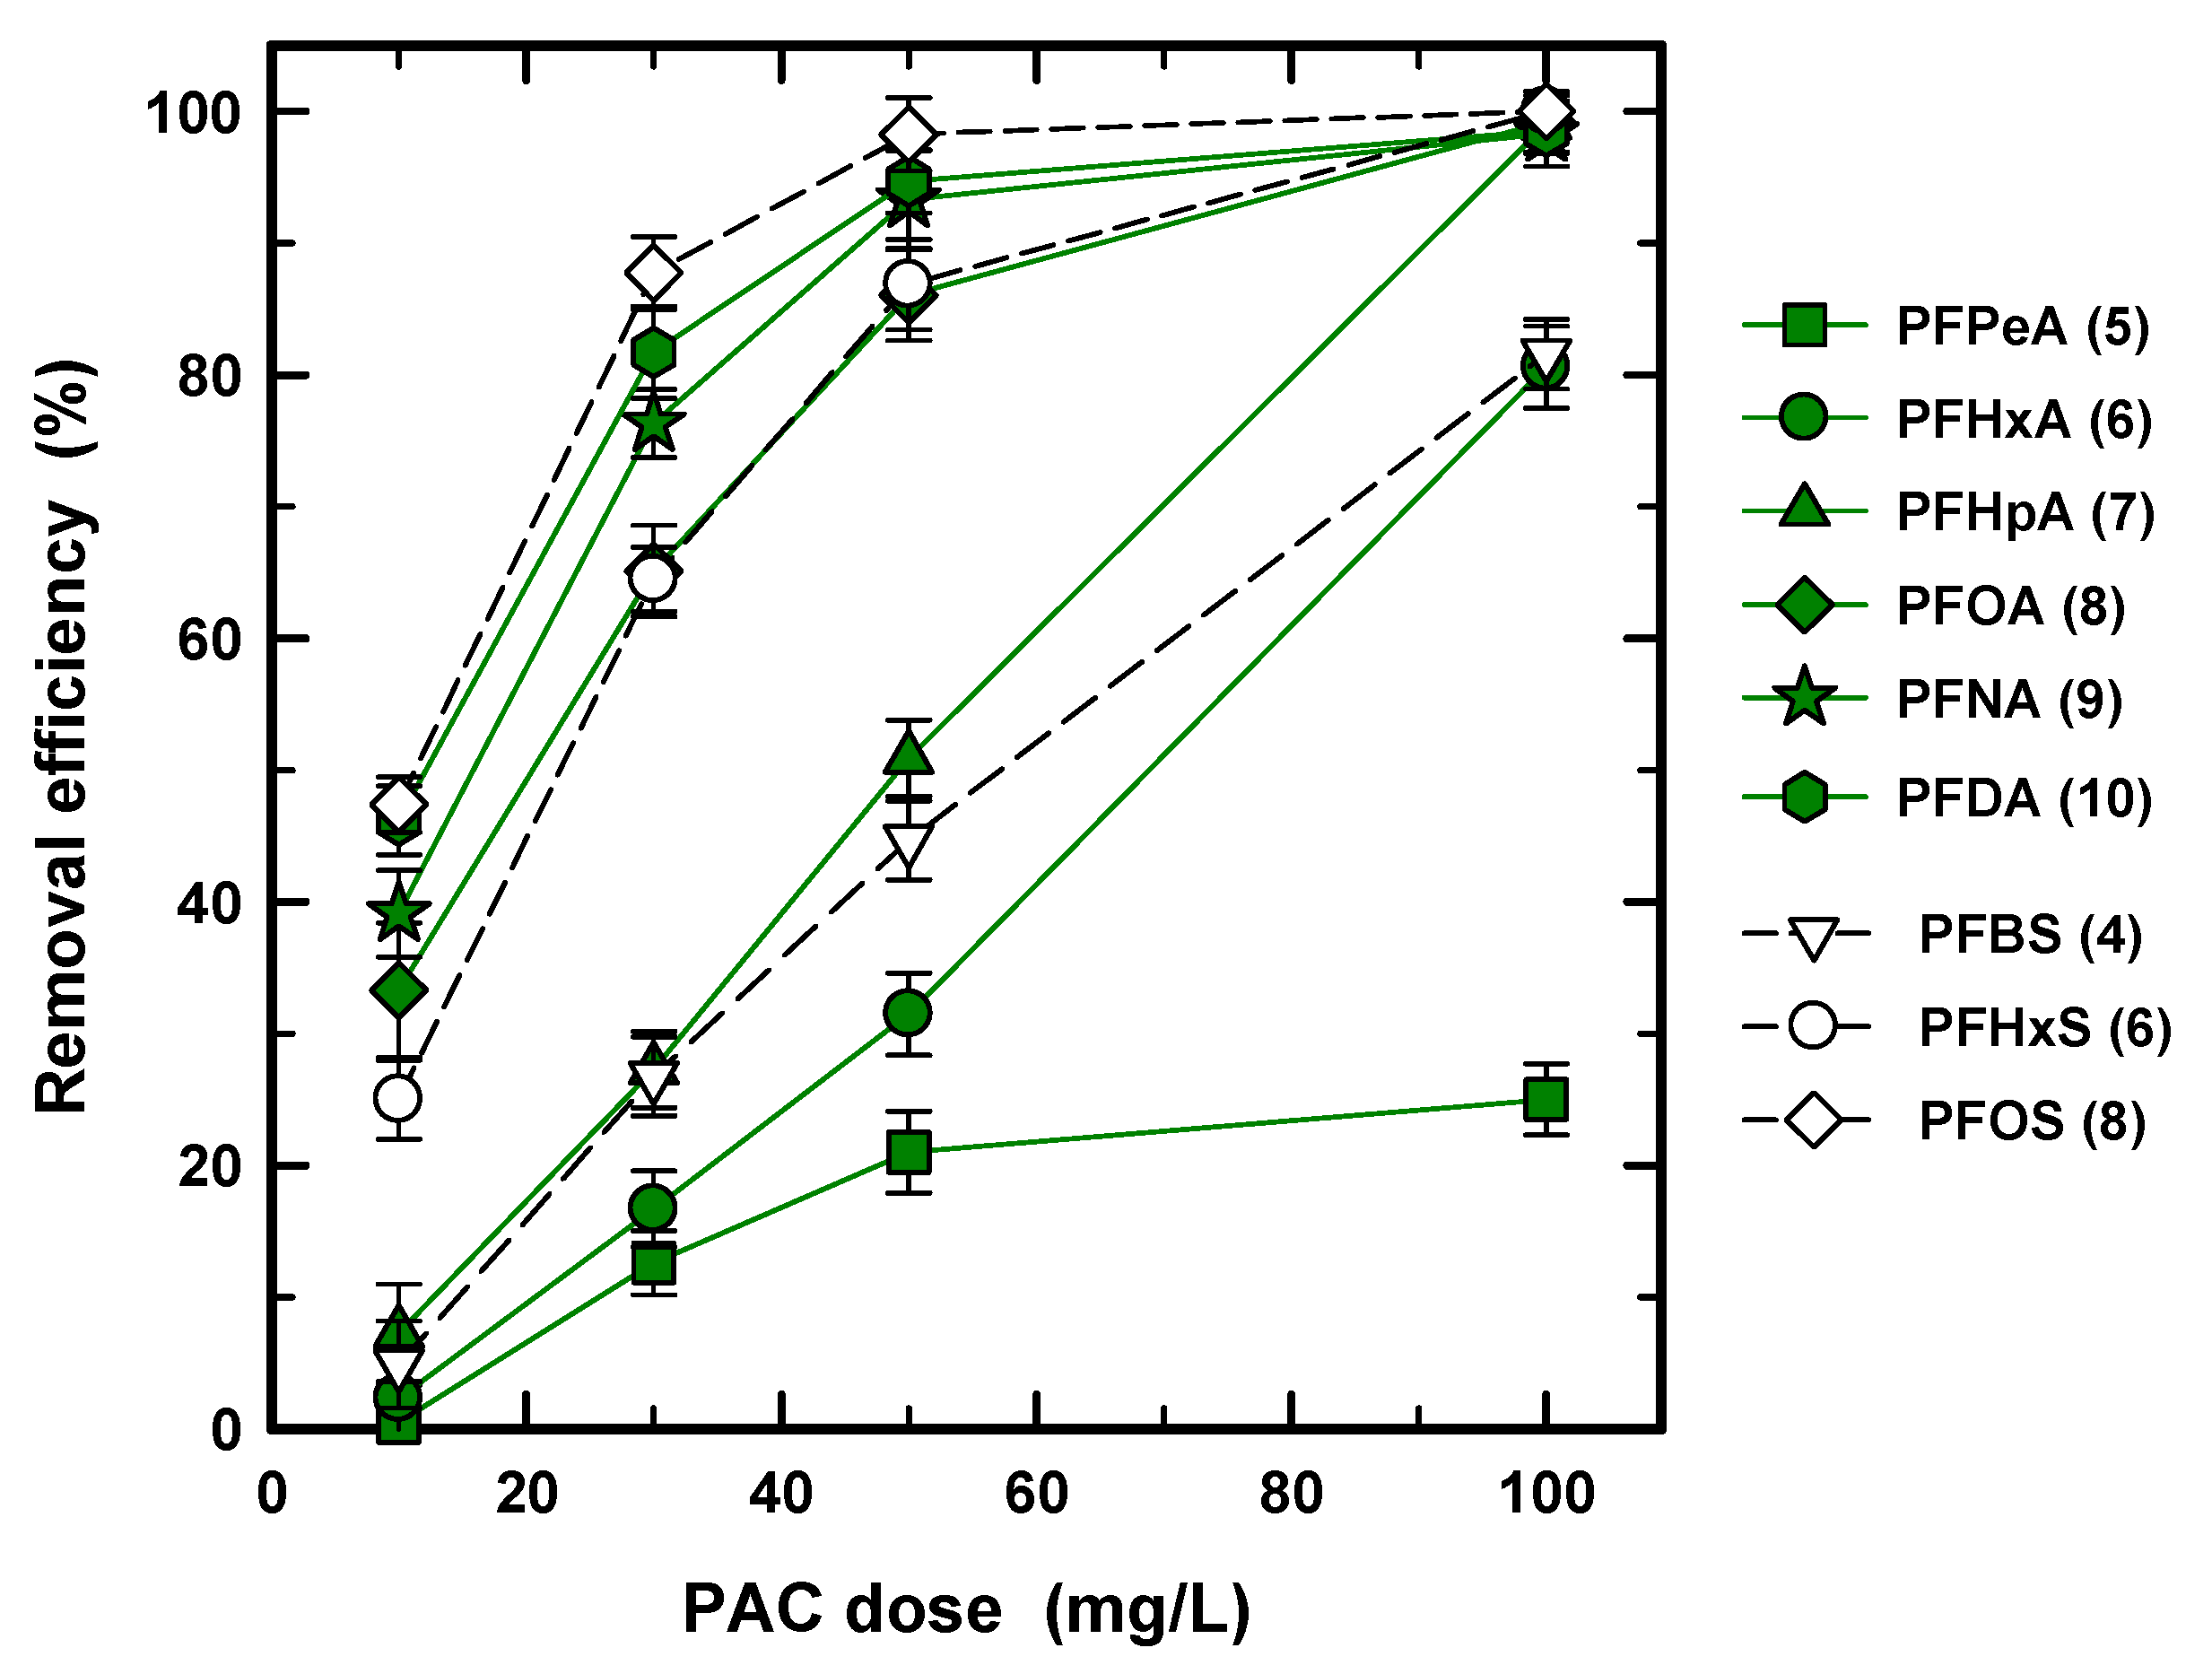
3.3. PAC Dosage
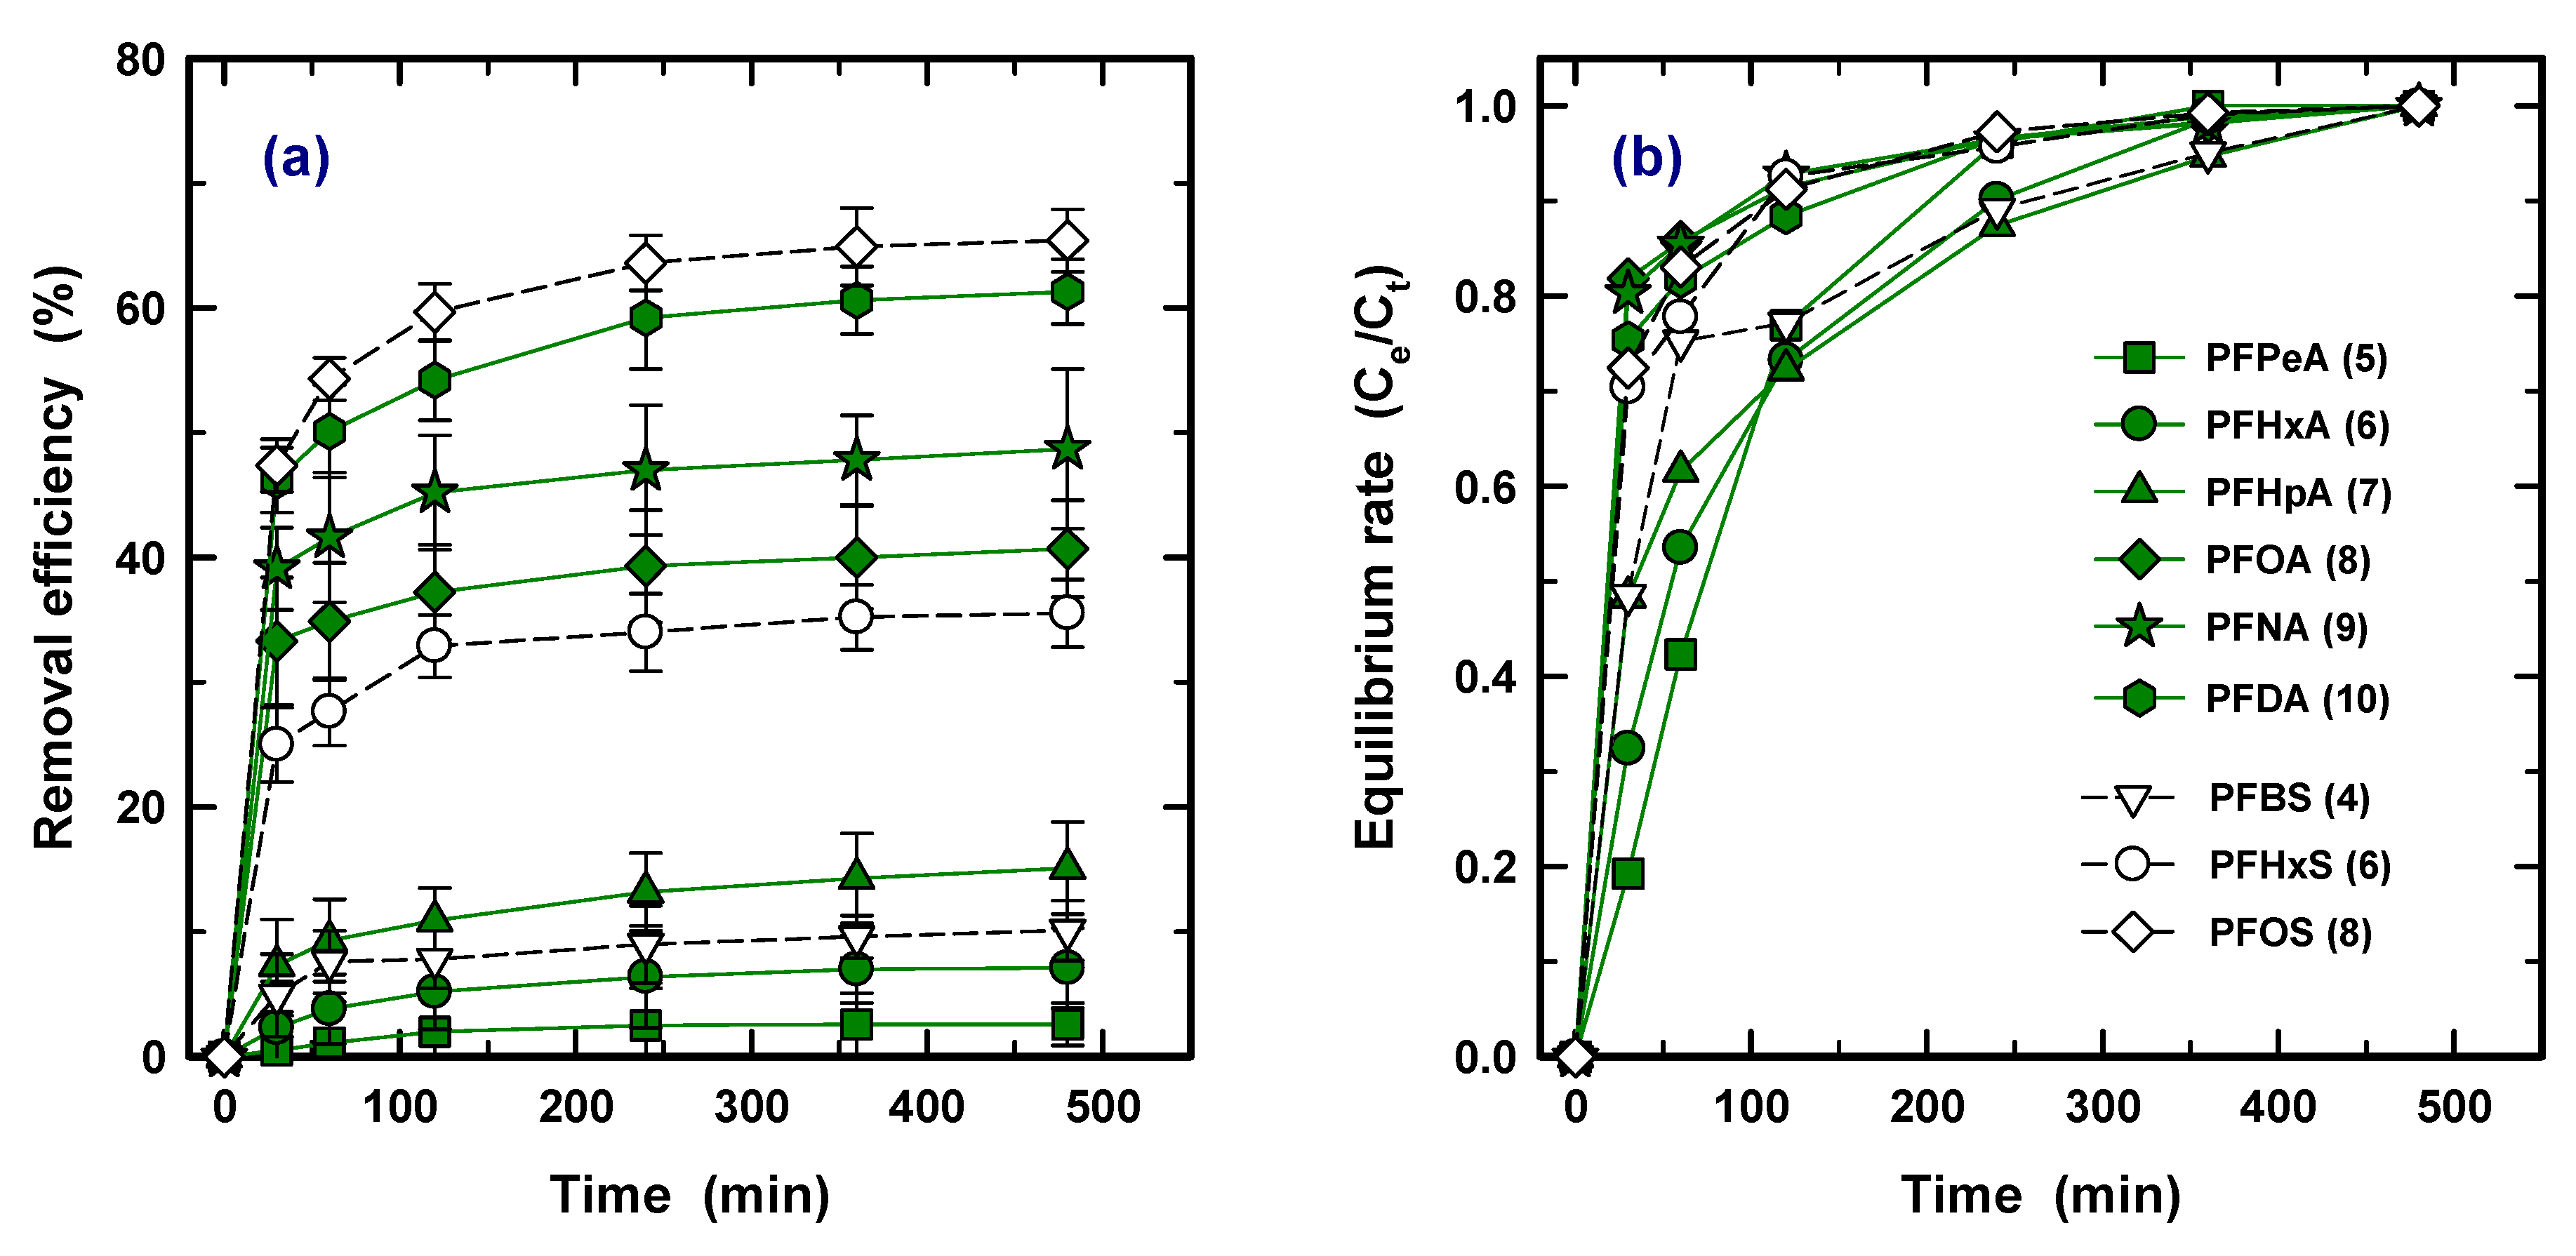
3.4. Kinetic
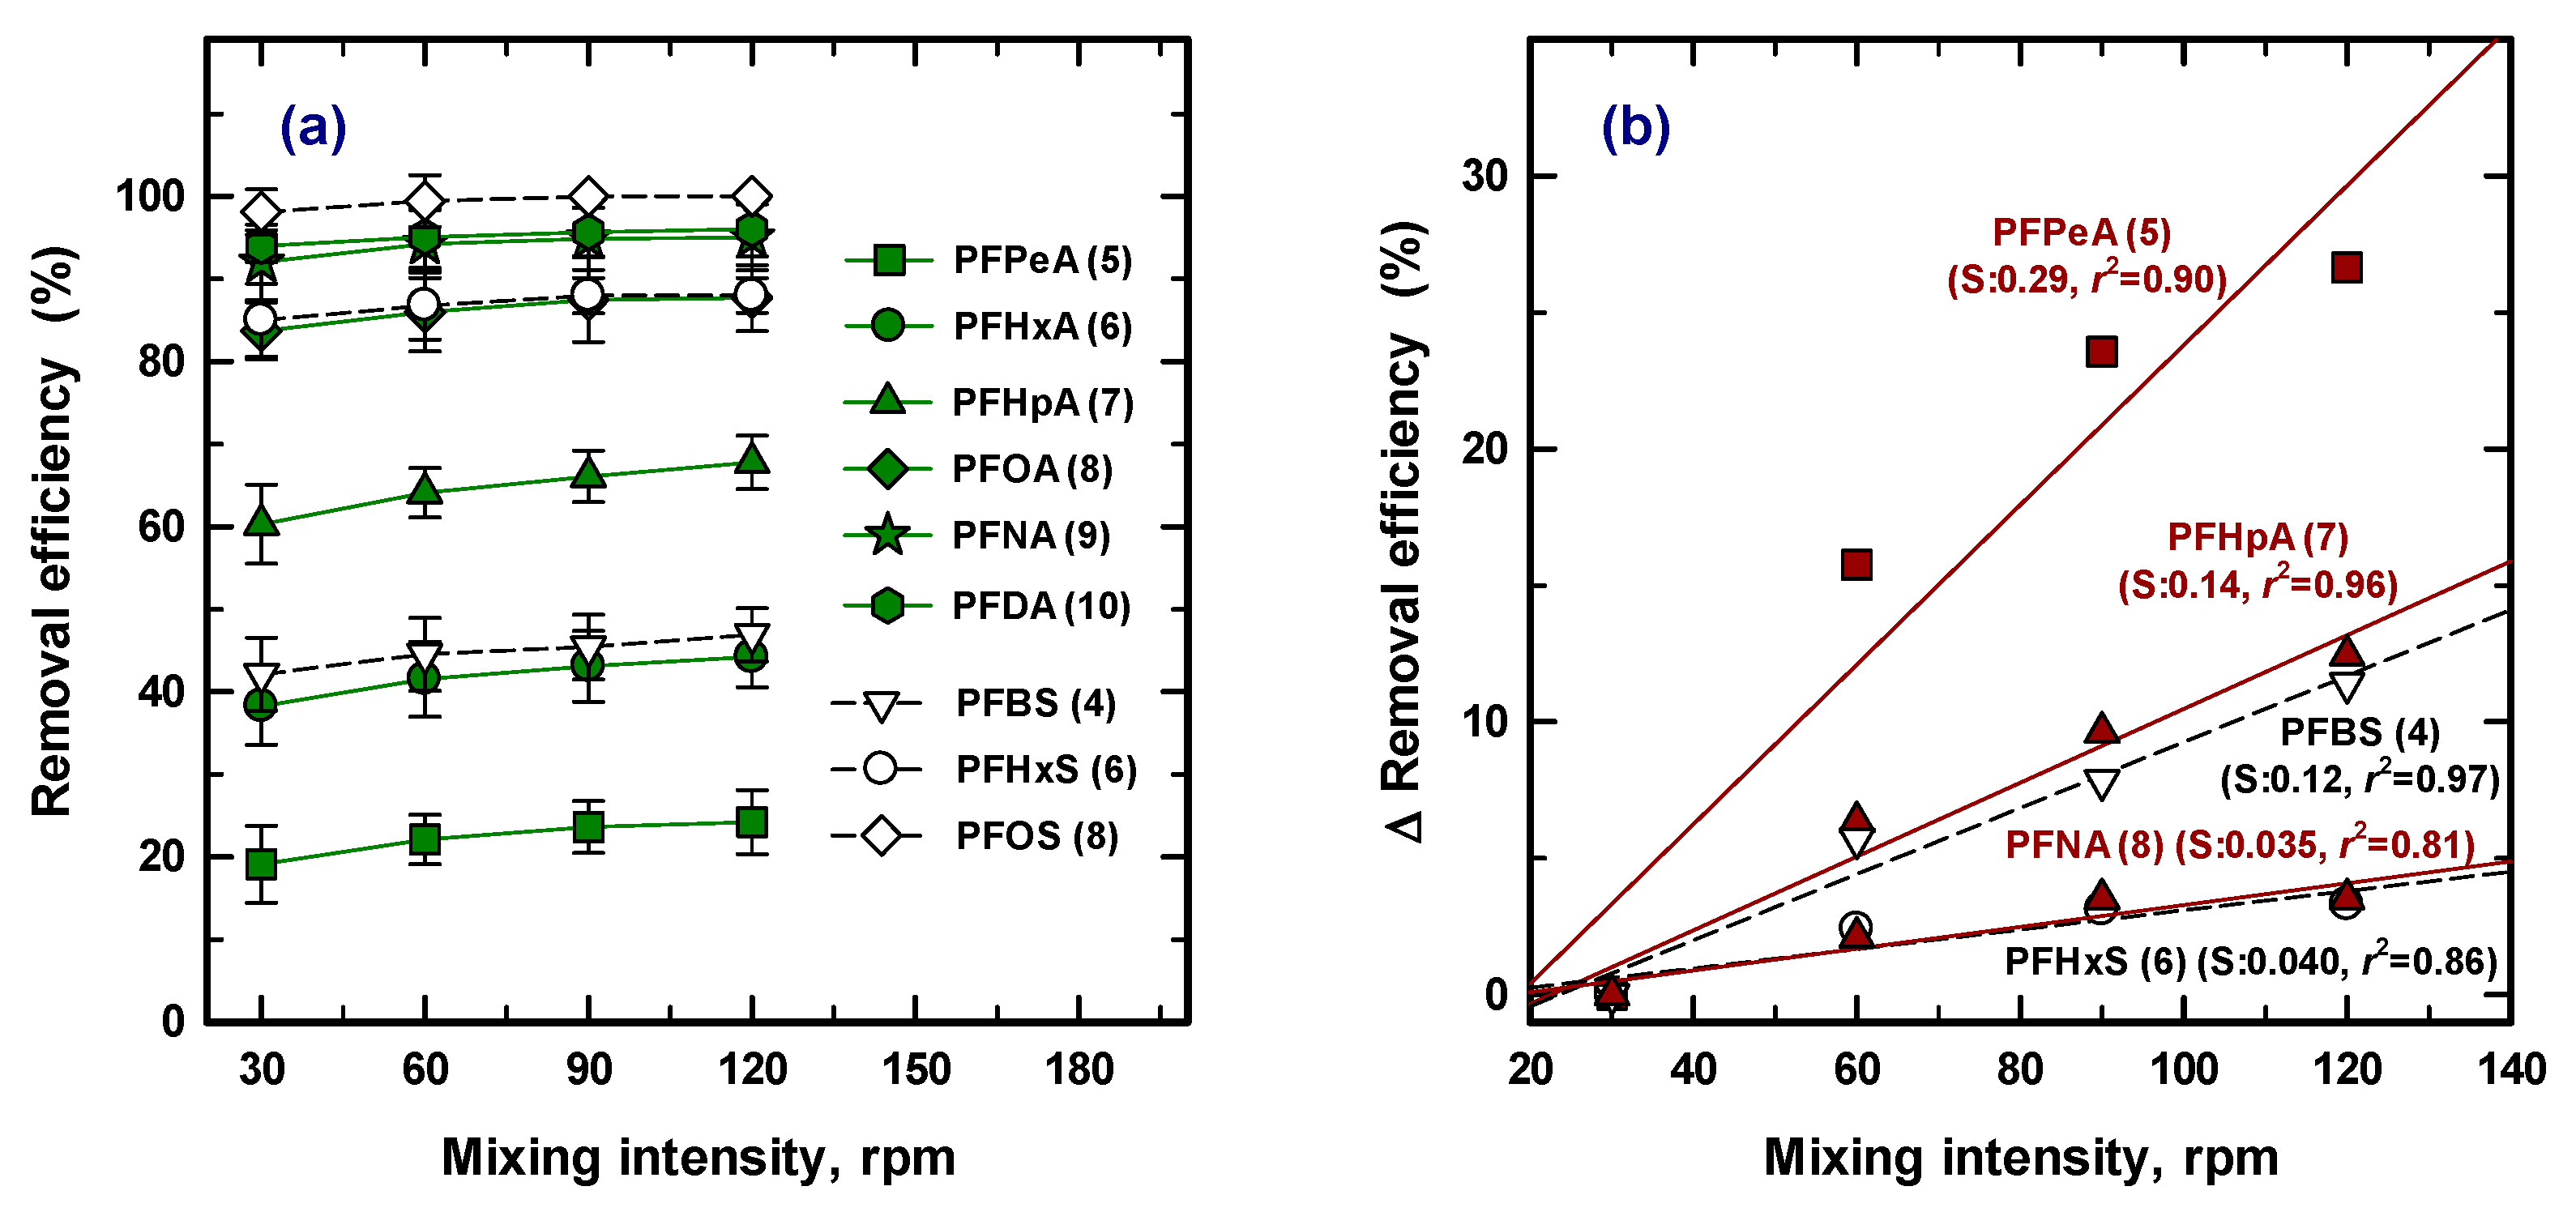
3.5. Mixing Intensity
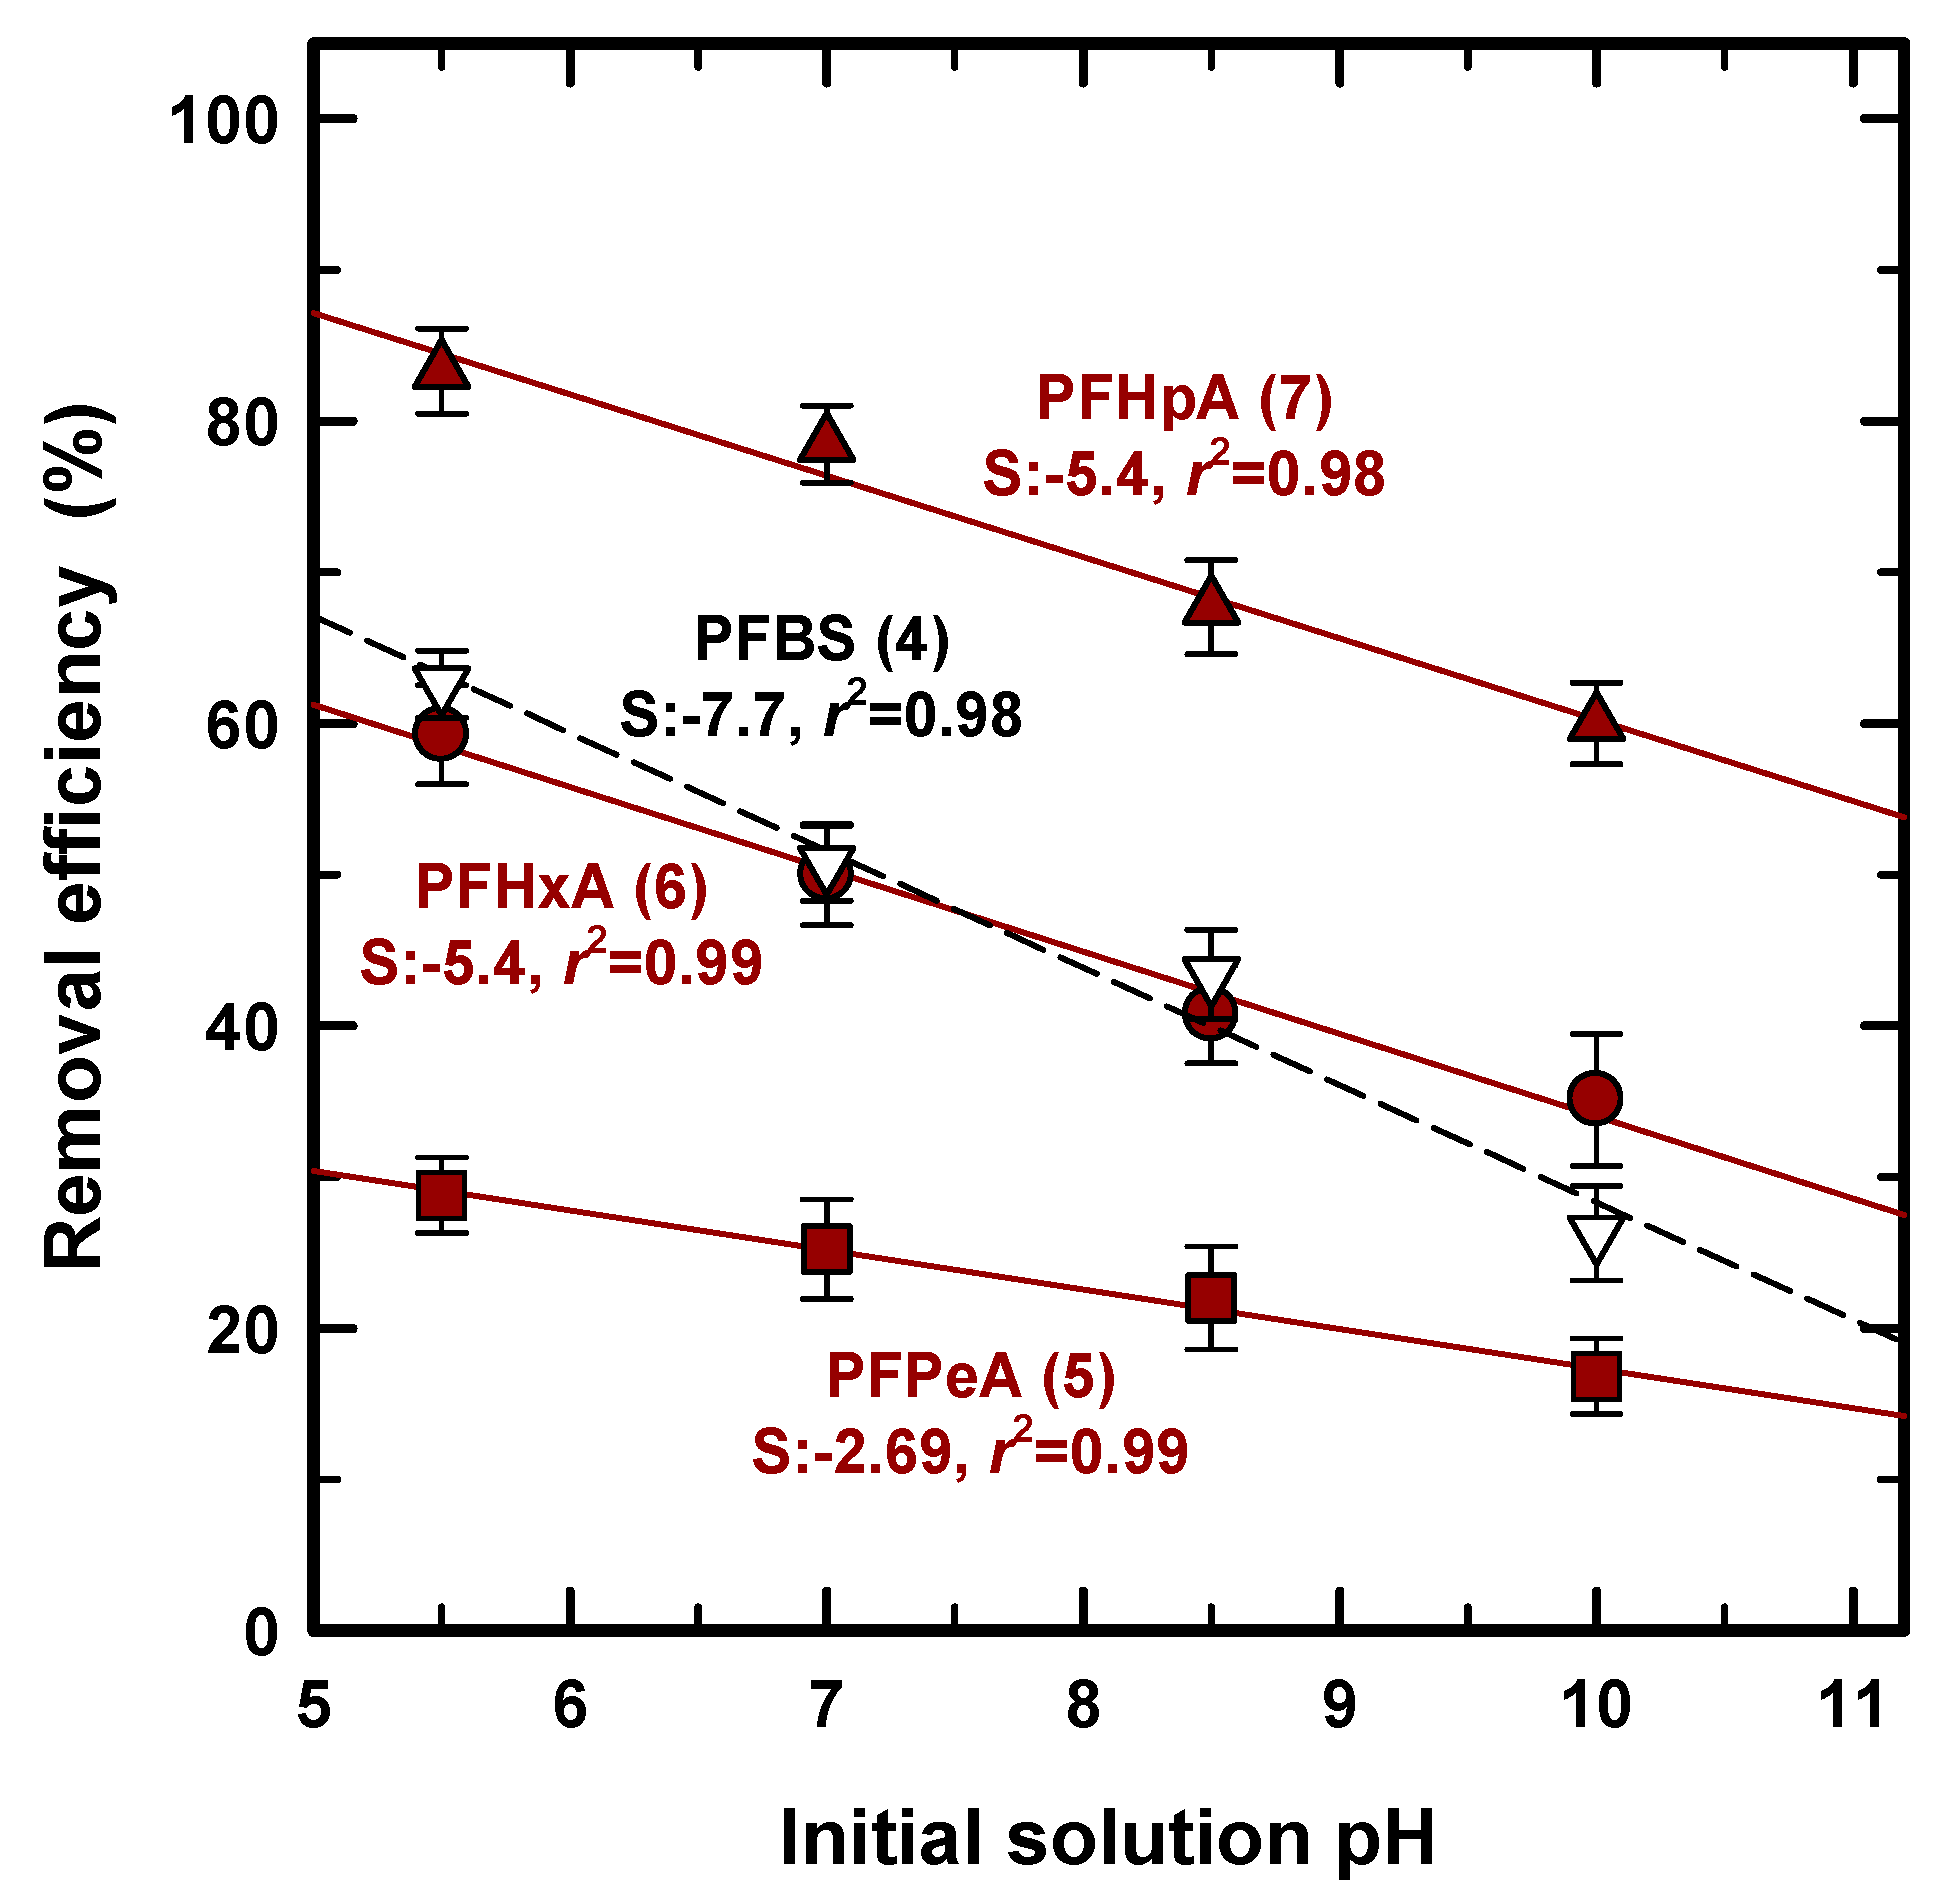
3.6. Effect of Solution pH
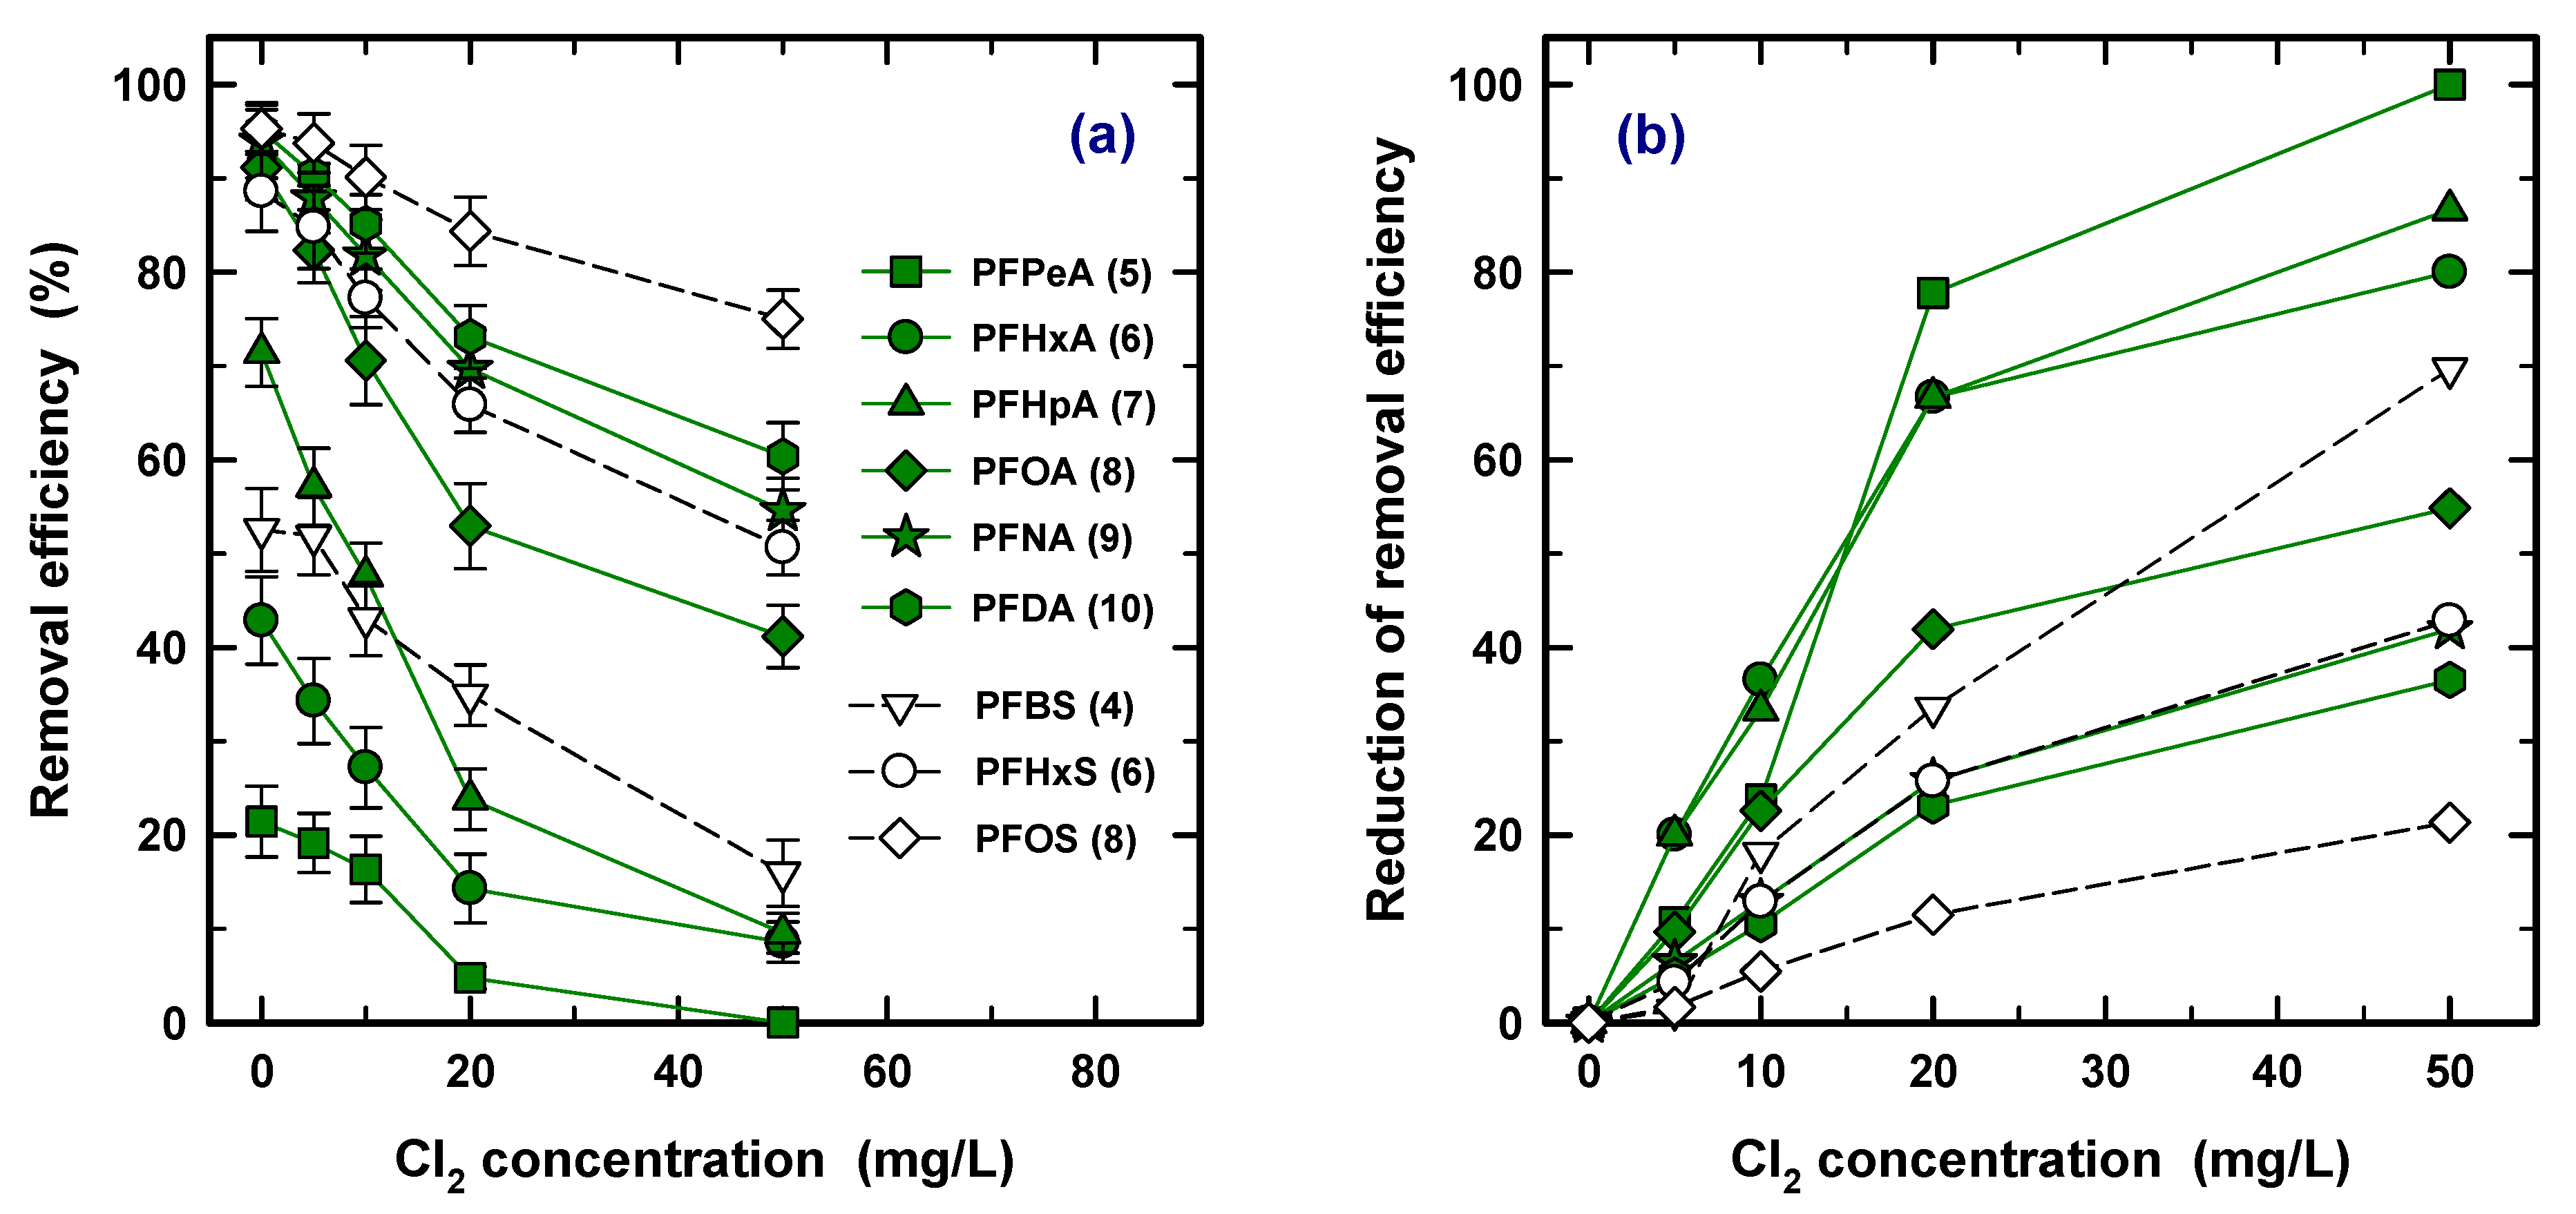
3.7. Effect of Chlorination
3.8. Selectivity of Each PFAS
4. Conclusions
Author Contributions
Funding
Conflicts of Interest
References
- Buck, R.C.; Franklin, J.; Berger, U.; Conder, J.M.; Cousins, I.T.; de Voogt, P.; Jensen, A.A.; Kannan, K.; Mabury, S.A.; van Leeuwen, S.P. Perfluoroalkyl and polyfluoroalkyl substances in the environment: Terminology, classification, and origins. Integr. Environ. Assess. Manag. 2011, 7, 513–541. [Google Scholar] [PubMed]
- Li, F.; Duan, J.; Tian, S.; Ji, H.; Zhu, Y.; Wei, Z.; Zhao, D. Short-chain per- and polyfluoroalkyl substances in aquatic systems: Occurrence, impacts and treatment. Chem. Eng. J. 2020, 380, 122506. [Google Scholar]
- US EPA. Risk Management for Per- and Polyfluoroalkyl Substances (PFASs) under TSCA. 2017. Available online: https://www.epa.gov/assessing-and-managing-chemicals-under-tsca/risk-management-and-polyfluoroalkyl-substances-pfass (accessed on 10 October 2020).
- Giesy, J.P.; Kannan, K. Global distribution of perfluorooctane sulfonate in wildlife. Environ. Sci. Technol. 2001, 35, 1339–1342. [Google Scholar] [PubMed]
- Hansen, K.J.; Clemen, L.A.; Ellefson, M.E.; Johnson, H.O. Compound-specific, quantitative characterization of organic fluorochemicals in biological matrices. Environ. Sci. Technol. 2001, 35, 766–770. [Google Scholar] [PubMed]
- Oyetade, A.; Varadwaj, G.B.B.; Nyamori, V.O.; Jonnalagadda, S.B.; Martincigh, B.S. A critical review of the occurrence of perfluoroalkyl acids in aqueous environments and their removal by adsorption onto carbon nanotubes. Rev. Environ Sci. Biotechnol. 2018, 17, 603–635. [Google Scholar]
- Moody, C.A.; Field, J.A. Perfluorinated surfactants and the environmental implications of their use in fire-fighting foams. Environ. Sci. Technol. 2000, 34, 3864–3870. [Google Scholar]
- Ahrens, L. Polyfluoroalkyl compounds in the aquatic environment: A review of their occurrence and fate. J. Environ. Monit. 2011, 13, 20–31. [Google Scholar]
- Kotthoff, M.; Müller, J.; Jürling, H.; Schlummer, M.; Fiedler, D. Perfluoroalkyl and polyfluoroalkyl substances in consumer products. Environ. Sci. Pollut. Res. 2015, 22, 14546–14559. [Google Scholar]
- Pramanik, B.K.; Pramanik, S.K.; Suja, F. A comparative study of coagulation, granular- and powdered-activated carbon for the removal of perfluorooctane sulfonate and perfluorooctanoate in drinking water treatment. Environ. Technol. 2015, 36, 2610–2617. [Google Scholar]
- Zhuo, Q.; Wang, J.; Niu, J.; Yang, B.; Yang, Y. Electrochemical oxidation of perfluorooctane sulfonate (PFOS) substitute by modified boron doped diamond (BDD) anodes. Chem. Eng. J. 2020, 379, 122280. [Google Scholar]
- Gomez-Ruiz, B.; Ribao, P.; Diban, N.; Rivero, M.J.; Ortiz, I.; Urtiaga, A. Photocatalytic degradation and mineralization of perfluorooctanoic acid (PFOA) using a composite TiO2 -rGO catalyst. J. Hazard. Mater. 2018, 344, 950–957. [Google Scholar] [PubMed] [Green Version]
- McCleaf, P.; Englund, S.; Ostlund, A.; Lindegren, K.; Wiberg, K.; Ahrens, L. Removal efficiency of multiple poly- and perfluoroalkyl substances (PFASs) in drinking water using granular activated carbon (GAC) and anion exchange (AE) column tests. Water Res. 2017, 120, 77–87. [Google Scholar] [PubMed]
- Woodard, S.; Berry, J.; Newman, B. Ion exchange resin for PFAS removal and pilot test comparison to GAC. Remediation 2017, 27, 19–27. [Google Scholar]
- Minnesota Pollution Control Agency. 3M Cottage Grove Site Proposed Cleanup Plan for PFCs; Minnesota Pollution Control Agency: St. Paul, MN, USA, 2009; Available online: https://www.pca.state.mn.us/sites/default/files/pfc3-04.pdf (accessed on 10 October 2020).
- Hansen, M.C.; Børresen, M.H.; Schlabach, M.; Cornelissen, G. Sorption of perfluorinated compounds from contaminated water to activated carbon. J. Soils Sediments 2010, 10, 179–185. [Google Scholar]
- Yu, Q.; Zhang, R.; Deng, S.; Huang, J.; Yu, G. Sorption of perfluorooctane sulfonate and perfluorooctanoate on activated carbons and resin: Kinetic and isotherm study. Water Res. 2009, 43, 1150–1158. [Google Scholar]
- Zaggia, A.; Conte, L.; Falletti, L.; Fant, M.; Chiorboli, A. Use of strong anion exchange resins for the removal of perfluoroalkylated substances from contaminated drinking water in batch and continuous pilot plants. Water Res. 2016, 91, 137–146. [Google Scholar]
- Park, M.; Wu, S.; Lopez, I.J.; Chang, J.Y.; Karanfil, T.; Snyder, S.A. Adsorption of perfluoroalkyl substances (PFAS) in groundwater by granular activated carbons: Roles of hydrophobicity of PFAS and carbon characteristics. Water Res. 2020, 170, 115364. [Google Scholar]
- Boehler, M.; Zwickenpflug, B.; Hollender, J.; Ternes, T.; Joss, A.; Siegrist, H. Removal of micropollutants in municipal wastewater treatment plants by powder-activated carbon. Water Sci. Technol. 2012, 66, 2115–2121. [Google Scholar]
- Stebel, E.K.; Pike, K.A.; Nguyen, H.; Hartmann, H.A.; Klonowski, M.J.; Lawrence, M.G.; Collins, R.M.; Hefner, C.E.; Edmiston, P.L. Absorption of short-chain to long-chain perfluoroalkyl substances using swellable organically modified silica. Environ. Sci. Water Res. Technol. 2019, 11, 1854–1866. [Google Scholar]
- Burns, D.C.; Ellis, D.A.; Li, H.; McMurdo, C.J.; Webster, E. Experimental pKa determination for perfluorooctanoic acid (PFOA) and the potential impact of pKa concentration dependence on laboratory-measured partitioning phenomena and environmental modeling. Environ. Sci. Technol. 2008, 42, 9283–9288. [Google Scholar]
- Goss, K.-U. The pKa values of PFOA and other highly fluorinated carboxylic acid. Environ. Sci. Technol. 2008, 42, 456–458. [Google Scholar]
- Das, D.; Samal, D.P.; Meikap, B.C. Preparation of activated carbon from green coconut shell and its characterization. J. Chem. Eng. Process Technol. 2015, 6, 1–7. [Google Scholar]
- Senevirathna, S.T.M.L.D.; Tanaka, S.; Fujii, S.; Kunacheva, C.; Harada, H.; Shivakoti, B.R.; Okamoto, B. A comparative study of adsorption of perfluorooctane sulfonate (PFOS) onto granular activated carbon, ion-exchange polymers and non-ion-exchange polymers. Chemosphere 2010, 80, 647–651. [Google Scholar] [PubMed]
- Liu, C.J.; Werner, D.; Bellona, C. Removal of per- and polyfluoroalkyl substances (PFASs) from contaminated groundwater using granular activated carbon: A pilot-scale study with breakthrough modeling. Environ. Sci. Water Res. Technol. 2019, 11, 1844–1853. [Google Scholar]
- Son, H.J.; Ryu, D.C.; Jang, S.H. Effect of pore structure change on the adsorption of NOM and THMs in water due to the increase of reactivation number of coal-based activated carbon. J. Korean Soc. Environ. Eng. 2010, 32, 965–972. [Google Scholar]
- San Miguel, G.; Lambert, S.D.; Graham, N.J. The regeneration of field-spent granular-activated carbons. Environ. Technol. 2002, 31, 2740–2748. [Google Scholar]
- Kim, S.-G.; Son, H.-J.; Jung, J.-M.; Ryu, D.-C.; Yoo, P.-J. Evaluation of drinking water treatment efficiency according to regeneration temperatures of granular activated carbon (GAC). J. Environ. Sci. Int. 2015, 24, 1163–1170. [Google Scholar]
- Kah, M.; Sigmund, G.; Xiao, F.; Hofmann, T. Sorption of ionizable and ionic organic compounds to biochar, activated carbon and other carbonaceous materials. Water Res. 2017, 124, 673–692. [Google Scholar]
- Gagliano, E.; Sgroi, M.; Falciglia, P.P.; Vagliasindi, F.G.A.; Roccaro, P. Removal of poly- and perfluoroalkyl substances (PFAS) from water by adsorption: Role of PFAS chain length, effect of organic matter and challenges in adsorbent regeneration. Water Res. 2020, 171, 115381. [Google Scholar]
- Saeidi, N.; Kopinke, F.-D.; Georgi, A. Understanding the effect of carbon surface chemistry on adsorption of perfluorinated alkyl substances. Chem. Eng. J. 2020, 381, 122689. [Google Scholar]
- Eschauzier, C.; Beerendonk, E.; Scholte-Veenendaal, P.; De Voogt, P. Impact of treatment processes on the removal of perfluoroalkyl acids from the drinking water production chain. Environ. Sci. Technol. 2012, 46, 1708–1715. [Google Scholar] [PubMed]
- Flores, C.; Ventura, F.; Martin-Alonso, J.; Caixach, J. Occurrence of perfluorooctane sulfonate (PFOS) and perfluorooctanoate (PFOA) in NE spanish surface waters and their removal in a drinking water treatment plant that combines conventional and advanced treatments in parallel lines. Sci. Total Environ. 2013, 461, 618–626. [Google Scholar] [PubMed]
- Vadivelan, V.; Kumar, K.V. Equilibrium, kinetics, mechanism, and process design for the sorption of methylene blue onto rice husk. J. Colloid Interf. Sci. 2005, 286, 90–100. [Google Scholar]
- Lagergreen, S. Zur theorie der sogenannten adsorption geloster stoffe. Zeitschrift fur Chemie und Industrie der Kolloide 1907, 2, 15. [Google Scholar]
- Ho, Y.S.; McKay, G. Sorption of dye from aqueous solution by peat. Chem. Eng. J. 1998, 70, 115–124. [Google Scholar]
- Lee, C.; Low, K.; Chung, L. Removal of some organic dyes by hexane-extracted spent bleaching earth. J. Chem. Technol. Biot. 1997, 69, 93–99. [Google Scholar]
- Du, Z.W.; Deng, S.B.; Chen, Y.G.; Wang, B.; Huang, J.; Wang, Y.J.; Yu, G. Removal of perfluorinated carboxylates from washing wastewater of perfluorooctanesulfonyl fluoride using activated carbons and resins. J. Hazard. Mater. 2015, 286, 136–143. [Google Scholar]
- Gao, Y.X.; Deng, S.B.; Du, Z.W.; Liu, K.; Yu, G. Adsorptive removal of emerging polyfluoroalky substances F-53B and PFOS by anion-exchange resin: A comparative study. J. Hazard. Mater. 2017, 323, 550–557. [Google Scholar]
- Kim, H.-G.; He, F.; An, B. The application of alginate coated iron hydroxide for the removal of Cu(II) and Phosphate. Appl. Sci. 2019, 9, 3835. [Google Scholar]
- An, B.; Kim, H.; Park, C.; Lee, S.-P.; Choi, J.-W. Preparation and characterization of an organic/inorganic hybrid sorbent (PLE) to enhance selectivity for As(V). J. Hazard. Mater. 2015, 289, 54–62. [Google Scholar]
- Wang, W.; Maimaiti, A.; Shi, H.; Wu, R.; Wang, R.; Li, Z.; Qi, D.; Yu, G.; Deng, S. Adsorption behavior and mechanism of emerging perfluoro-2-propoxypropanoic acid (GenX) on activated carbons and resins. Chem. Eng. J. 2019, 364, 132–138. [Google Scholar]
- Wu, T.; Wu, Z.; Ma, D.; Xiang, W.; Zhang, J.; Liu, H.; Deng, Y.; Tan, S.; Cai, X. Fabrication of few-layered porous graphite for removing fluorosurfactant from aqueous solution. Langmuir 2018, 34, 15181–15188. [Google Scholar] [PubMed]
- Krippner, J.; Brunn, H.; Falk, S.; Georgii, S.; Schubert, S.; Stahl, T. Effects of chain length and pH on the uptake and distribution of perfluoroalkyl substances in maize (Zea mays). Chemosphere 2014, 94, 85–90. [Google Scholar] [PubMed]
- Prevedouros, K.; Cousins, I.T.; Buck, R.C.; Korzeniowski, S.H. Sources, fate and transport of perfluorocarboxylates. Environ. Sci. Technol. 2006, 40, 32–44. [Google Scholar]
- Moroi, Y.; Yano, H.; Shibata, O.; Yonemitsu, T. Determination of acidity constants of perfluoroalkanoic acids. Bull. Chem. Soc. Jpn. 2001, 74, 667–672. [Google Scholar]
- Tobiason, J.E.; Nabi bidhendi, G.H.R.; Torabian, A.; Ghadimkhani, A.A.; Etemadi, H. Preozonation and prechlorination effects on TOC removal by nanofiltration in water treatment. Int. J. Environ. Res. 2008, 2, 269–274. [Google Scholar]
- Zhang, X.; Li, W.; Blatchley, E.R.; Wang, X.; Ren, P. UV/chlorine process for ammonia removal and disinfection by-product reduction: Comparison with chlorination. Water Res. 2015, 68, 804–811. [Google Scholar]
- Mahinroosta, R.; Senevirathana, L. A review of the emerging treatment technologies for PFAS contaminated soils. J. Environ. Manag. 2020, 255, 109896. [Google Scholar]
- Li, W.; Wu, R.; Duan, J.; Saint, C.P.; van Leeuwen, J. Impact of prechlorination on organophosphorus pesticides during drinking water treatment: Removal and transformation to toxic oxon byproducts. Water Res. 2016, 105, 1–10. [Google Scholar]
- Lee, J.-K.; Son, H.-J.; Kim, S.-G.; Hwang, Y.-D.; Ryu, D.-C. Effect of pH control, ozonation and coagulation on THMs formation in drinking water treatment process of the downstream of nakdong river. J. Koran Soc. Environ. Eng. 2017, 39, 105–111. [Google Scholar]


| Category | Compound Name | Chemical Formula | MW (a) (g/mol) | Log Kow | pKa |
|---|---|---|---|---|---|
| P F C A | Perfluoropentanoate (PFPeA, C5) | CF3(CF2)3COOH | 264.1 | 3.01 (b) | 0.34 (b) |
| Perfluorohexanoate (PFHxA, C6) | CF3(CF2)4COOH | 314.1 | 3.48 (c) | −0.16 (c) | |
| Perfluoroheptanoate (PFHpA, C7) | CF3(CF2)5COOH | 364.1 | 4.15 (c) | −2.29 (c) | |
| Perfluorooctanoate (PFOA, C8) | CF3(CF2)6COOH | 414.1 | 4.81 (c) | −0.5–4.2 (c) | |
| Perfluorononanoate (PFNA, C9) | CF3(CF2)7COOH | 464.1 | 5.48 (c) | −0.21 (c) | |
| Perfluorodecanoate (PFDA, C10) | CF3(CF2)8COOH | 514.1 | 6.51 (b) | −5.2 (b) | |
| P F S A | Perfluorobutane sulfonate (PFBS, C4) | CF3(CF2)3SO3H | 300.1 | 1.82 (c) | −3.31 (c) |
| Perfluorohexane sulfonate (PFHxS, C6) | CF3(CF2)5SO3H | 400.1 | 3.16 (c) | 0.14 (c) | |
| Perfluorooctane sulfonate (PFOS, C8) | CF3(CF2)7SO3H | 500.1 | 4.49 (c) | <1.0 (c) |
| Properties | Unit | Coal | Coconut | ||
|---|---|---|---|---|---|
| Virgin (PCO-0) | 1st Regeneration (PCO-1) | 3th Regeneration (PCO-3) | Virgin (PCC-0) | ||
| Primary micropore volume (<0.8 nm) | cm3/g | 0.151 (31%) (a) | 0.051 (10%) | 0.027 (5%) | 0.263 (54%) |
| Secondary micropore volume (0.8–2 nm) | cm3/g | 0.145 (30%) | 0.143 (27%) | 0.096 (19%) | 0.115 (23%) |
| Mesopore volume (2–50 nm) | cm3/g | 0.192 (39%) | 0.336 (63%) | 0.379 (76%) | 0.112 (23%) |
| Total volume (>50 nm) | cm3/g | 0.488 | 0.53 | 0.502 | 0.49 |
| Mean pore width | nm | 2.15 | 2.58 | 3.32 | 1.90 |
| BET surface area | m2/g | 1014 | 915 | 669 | 1133 |
| Model | Constant | PFPeA C5 | PFHxA C6 | PFHpA C7 | PFOA C8 | PFNA C9 | PFDA C10 | PFBS C4 | PFHxS C6 | PFOS C8 |
|---|---|---|---|---|---|---|---|---|---|---|
| P F O | qe | 0.00915 | 0.0127 | 0.0210 | 0.0634 | 0.0585 | 0.0491 | 0.0264 | 0.0388 | 0.0434 |
| K1 | 0.277 | 0.688 | 1.33 | 3.82 | 4.60 | 5.73 | 0.904 | 3.37 | 6.23 | |
| R2 | 0.986 | 0.993 | 0.893 | 0.633 | 0.730 | 0.703 | 0.905 | 0.837 | 0.865 | |
| P S O | qe | 0.371 | 0.848 | 1.53 | 4.01 | 4.83 | 6.11 | 1.02 | 3.63 | 6.671 |
| K2 | 0.0209 | 0.0154 | 0.0176 | 0.0361 | 0.0267 | 0.0149 | 0.0347 | 0.0184 | 0.0117 | |
| R2 | 0.970 | 0.999 | 0.970 | 0.917 | 0.960 | 0.932 | 0.938 | 0.959 | 0.993 |
| αA\B | PFPeA 5 | PFHxA 6 | PFHpA 7 | PFOA 8 | PFNA 9 | PFDA 10 | PFBS 4 | PFHxS 6 | PFOS 8 |
|---|---|---|---|---|---|---|---|---|---|
| PFPeA-5 | 1 | ||||||||
| PFHxA-6 | 2.86 | 1 | |||||||
| PFHpA-7 | 6.66 | 2.33 | 1 | ||||||
| PFOA-8 | 25.7 | 8.98 | 3.86 | 1 | |||||
| PFNA-9 | 35.6 | 12.4 | 5.34 | 1.38 | 1 | ||||
| PFDA-10 | 59.3 | 20.7 | 8.91 | 2.31 | 1.67 | 1 | |||
| PFBS-4 | 4.21 | 1.47 | 0.632 | 0.164 | 0.118 | 0.0709 | 1 | ||
| PFHxS-6 | 20.6 | 7.21 | 3.10 | 0.803 | 0.580 | 0.348 | 4.91 | 1 | |
| PFOS-8 | 70.8 | 24.7 | 10.6 | 2.75 | 1.99 | 1.19 | 16.8 | 3.43 | 1 |
Publisher’s Note: MDPI stays neutral with regard to jurisdictional claims in published maps and institutional affiliations. |
© 2020 by the authors. Licensee MDPI, Basel, Switzerland. This article is an open access article distributed under the terms and conditions of the Creative Commons Attribution (CC BY) license (http://creativecommons.org/licenses/by/4.0/).
Share and Cite
Son, H.; Kim, T.; Yoom, H.-S.; Zhao, D.; An, B. The Adsorption Selectivity of Short and Long Per- and Polyfluoroalkyl Substances (PFASs) from Surface Water Using Powder-Activated Carbon. Water 2020, 12, 3287. https://doi.org/10.3390/w12113287
Son H, Kim T, Yoom H-S, Zhao D, An B. The Adsorption Selectivity of Short and Long Per- and Polyfluoroalkyl Substances (PFASs) from Surface Water Using Powder-Activated Carbon. Water. 2020; 12(11):3287. https://doi.org/10.3390/w12113287
Chicago/Turabian StyleSon, Heejong, Taehoon Kim, Hoon-Sik Yoom, Dongye Zhao, and Byungryul An. 2020. "The Adsorption Selectivity of Short and Long Per- and Polyfluoroalkyl Substances (PFASs) from Surface Water Using Powder-Activated Carbon" Water 12, no. 11: 3287. https://doi.org/10.3390/w12113287