Neutron Star Properties: Quantifying the Effect of the Crust–Core Matching Procedure


CFisUC, Department of Physics, University of Coimbra, P-3004-516 Coimbra, Portugal
*
Author to whom correspondence should be addressed.
Universe 2020, 6(11), 220; https://doi.org/10.3390/universe6110220
Submission received: 19 October 2020
/
Revised: 18 November 2020
/
Accepted: 19 November 2020
/
Published: 23 November 2020
(This article belongs to the Special Issue Neutron Star Astrophysics)
Abstract
:The impact of the equation of state (EoS) crust-core matching procedure on neutron star (NS) properties is analyzed within a meta-modeling approach. Using a Taylor expansion to parametrize the core equation of state (EoS) and the SLy4 crust EoS, we create two distinct EoS datasets employing two matching procedures. Each EoS describes cold NS matter in a equilibrium that is thermodynamically stable and causal. It is shown that the crust-core matching procedure affects not only the crust-core transition but also the nuclear matter parameter space of the core EoS, and thus the most probable nuclear matter properties. An uncertainty of as much as 5% (8%) on the determination of low mass NS radii (tidal deformability) is attributed to the complete matching procedure, including the effect on core EoS. By restricting the analysis, imposing that the same set of core EoS is retained in both matching procedures, the uncertainty on the NS radius drops to 3.5% and below 1.5% for . Moreover, under these conditions, the crust-core matching procedure has a strong impact on the Love number , of almost 20% for stars and 7% for stars, but it shows a very small impact on the tidal deformability , below 1%.
1. Introduction
Neutron stars (NSs) are astrophysical objects made of cold super-dense neutron-rich nuclear matter. They are unique systems through which one can access the properties of the equation of state (EoS) of nuclear matter under extreme conditions of density and isospin asymmetry. Some NS observations have imposed strong constraints on the EoS of nuclear matter, in particular, the masses of the pulsars PSR J1614−2230 with [1,2,3], PSR J0348+0432 with [4], and the recently detected MSP J0740+6620 with [5]. The description of two solar mass pulsars requires a quite stiff EoS at large densities and may even inhibit the appearance of non-nucleonic degrees of freedom as discussed in e.g., [3,6]. However, many other works have shown that due to the rather limited number of constraints at high baryonic densities it is possible to predict NS with non-nucleonic degrees of freedom e.g., [7,8,9,10,11,12,13,14].
A strong constraint on the EoS would be set by the simutaneous measurement of the mass and radius of a NS. The already operating or programed missions NICER [15], Athena X-ray telescope [16], and the eXTP [17] aim precisely to measure the mass and radius of a NS with an uncertainty of the order of 5%. Recently, NICER has published their first results but the aimed accuracy was still not attained [18,19]. The gravitational waves (GWs) emitted during the coalescence of binary NS systems carry important information on the high density properties of the EoS. The GW170817 event has settled an upper bound of on the effective tidal deformability of the binary [20]. Under minimal assumptions about the nature of the compact objects, a follow up reanalysis of the GW170817 event gave [21]. Furthermore, the tidal deformability of a NS was estimated to be [20]. However, this last prediction did not require that the EoS of the NS is able to account for two solar mass stars.
With the possibility that stricter observational constraints will be set in the near future, it is important to be able to set uncertainties on the quantities calculated from theoretical models. One possible origin of these uncertainties on the determination of the star radius stems from the way NS EoS is built. Neutron star matter should be described by an unified EoS [22,23,24], where all density regions are calculated from the same nuclear interaction, see also [25,26,27]. However, non-unified EoS built piecewisely using distinct models for different density regions [28,29,30,31] are frequently used. To construct a non-unified EoS, it is important to determine how and where the different density segments are matched. In fact, it has been shown that the matching procedure of the crust EoS to the core EoS may give rise to uncertainties as large as 10% [26].
In order to determine the constraints set by the gravitational waves GW170817 detected from the merging of two NS and other observations, several studies have been performed that apply a huge set of meta-model EoS [29,30,32,33,34,35]. In these studies different approaches have been considered to glue the core EoS to the crust. The most frequently used method was been applied in [28] to parametrize a well known set of EoS calculated from different theoretical approaches by a finite number of politropic functions. For all the models the crust determined in [36], based on the Skyrme interaction SLy4, has been considered and matched to the core at the pressure-energy density point where both EoS cross.
In the present work, we want to quantify how the matching of the crust EoS with the core affects NS properties, such as the radius and the tidal deformability. We will generate two datasets of non-unified EoSs that are characterized by different core-crust matching procedures: the first one is based on the relation and the second one on the , where and are the core-crust chemical potential and the energy density at the transition, respectively. The first method uses a Maxwell construction, i.e., the transition occurs at constant baryonic chemical potential , while the transition happens at a constant energy density, , in the second method. This other method was the one applied in [28] to build politropic parameterizations of well known EoSs. An analysis of the matching effect on the consistency of the causal and thermodynamic properties of the EoS was performed in [26], and it was shown that the matching on the pressure-energy density plane is thermodynamically inconsistent. However, it may still be justified if the unprecision introduced is within the uncertainty of the approach. Other methods have been considered such as an interpolation between some fixed baryonic density inside the inner crust and the saturation density [29], but we will only investigate the first two presented above.
In order to undertake the present study, we use a Taylor expansion around the saturation density of symmetric nuclear matter for the core EoS, while for the crust we choose the SLy4 EoS [36], since this was the crust EoS used in most of the works that applied meta-models.
2. EoS Parametrization
We start from the generic functional form for the energy per particle of homogeneous nuclear matter
with
where . The baryon density is given by and is the asymmetry, with and being the neutron and proton densities, respectively. This approach of Taylor expanding the energy functional up to fourth order around the saturation density, , has been applied recently in several works [29,37,38,39].
The empirical parameters can be identified as the coefficients of the expansion. The isoscalar empirical parameters are defined as successive density derivatives of ,
whereas the isovector parameters measure density derivatives of ,
The corresponding empirical parameters are then
and
The saturation energy and saturation density being rather well constrained, we fix their values throughout this work: MeV and fm.
Each possible EoS is represented by a point in the 8-dimensional space of parameters. We use random sampling of models through a multivariate Gaussian with zero covariance:
where
In the present approach, as discussed in [29], no a priori correlations exist between the different parameters of the EoS. However, the requirement that every valid EoS must satisfy a set of experimental and observational constraints induces correlations among the parameters in the final set of EoS. The used parameters values and their standard deviations are listed in Table 1.
We impose the following conditions to get a valid EoS: (i) the pressure is an increasing function of density (thermodynamic stability); (ii) the speed of sound is smaller than the speed of light (causality); (iii) the EoS supports a maximum mass at least as high as [1,2,3,4] (observational constraint); and (iv) the symmetry energy is positive. This may be a too restrictive constraint and a more realistic one would be that the symmetry energy is positive for densities below the central density of the maximum mass star configuration. We consider, however, that the difference between both sets of EoS will not be significant. All EoS describe matter in -equilibrium at zero temperature.
Crust Matching Procedure
We are going to compare two crust-core matching procedures used in the literature for obtaining the neutron star matter EoS. The first one consists in doing the matching in the diagram, i.e., by requiring , where is transition baryonic chemical potential. The second method matches the crust and core EoSs in the diagram, i.e., by requiring , where denotes de transition energy density. We further require that the crust-core transition occurs below fm, which is consistent with the range of core-crust transition densities for a large set of nuclear models [40].
3. Results
Using the same initial probability distribution function, we start by sampling an EoS as and analyze whether: (i) the above conditions are met and (ii) a matching with the crust is possible. If both conditions are met, the is taken as a valid EoS for equilibrated neutron star matter and added to the dataset.
3.1. Empirical Parameters Distribution
In this first section, the sampling procedure is independently done for each matching procedure, i.e., we are not testing if a sampled EoS gives a valid matching within both procedures. Instead, both matching procedures are tested on different and independently sampled EoSs. This way, we are able to study if the matching procedure affects the most probable set of parameters, i.e., the final distributions of the empirical parameters.
The final sets we have generated are made of 1326 and 1410 EoSs using the and procedures, respectively. The parameters statistics of both sets are given in Table 2. The mean values of the isoscalar properties are close, while the isovector show some differences. We show the density distribution of the isovectors properties in Figure 1. The main difference occurs for , where the procedure (blue) predicts lower values. It is already clear that the most probable EoS depends on the selected matching method. It is highly improbable that a specific core EoS will glue with a crust within both procedures.
The histograms for the transition densities, , are shown in Figure 2. The values are concentrated at low densities for , while they spread over the whole density range for (additionally, we have imposed fm as lower bound). In fact, if we soften the constraint fm to fm, it would still result in similar low values for , while it would be highly clustered around for . Therefore, both methods give consistently different transition densities for the crust-core transition. Moreover, under the matching procedure, the dataset statistics for the empirical parameters strongly depends on the constraint imposed on .
In Figure 3, we show how the empirical parameters are correlated for each matching procedure. In the left panel, the upper triangular part indicates the correlation coefficient (the correlations are calculated via the Pearson coefficient ) for , while the bottom part represents the . The correlation difference between both matching procedures is shown in the right panel. Is it clear that the matching procedure gives rise to substantial differences in the correlations between parameters, probably due to the differences occurring in the distribution of parameters. The major distinctions are seen in some of the stronger correlations, i.e., and , while the smaller correlation difference happens for the weaker one, . Note, however, that the strongest correlation is for both sets.
The predictions obtained from these two sets of models for the NS radius (left), Love number (center), and tidal deformability are shown in Figure 4 as a function of the NS mass. The top panels show the mean (solid lines), two times the standard deviation (filled regions), and max/min values (dashed lines), where the color identifies the matching procedure: Blue for and red for . The middle panel shows the difference between means , with and denoting the mean values for the and matching procedures sets, respectively. The bottom panels show the relative difference (%), defined by , where . We are analyzing how far is the average prediction of each set from each other.
The difference on the average predictions decreases as more massive NSs are considered. The average deviation between both predictions on the NS radius is of 5% for a NS, and it decreases to <2 % for a NS. For a NS, the difference is smaller than km on average. The Love number predictions show the highest discrepancy: 18% and 6% for a and NS, respectively. The deviations on the predictions can be as high as 8%. These deviations reflect the different regions span by each set, or, more precisely, the gap between the most probable regions, since the matching procedure affects the core EoS. Therefore, when a similar statistical approach is used for generating a core EoS, the matching procedure choice carries the above uncertainties on the NS properties.
The effective tidal deformability of a binary system is the leading tidal parameter of the gravitational-wave signal from a NS merger. It is given by
where is the binary mass ratio and and represent the tidal deformability (mass) of the primary and the secondary NS in the binary, respectively. The GW170817 event provides an upper bound of (low spin-prior) [21], while the binary mass ratio is bounded as [21]. The binary chirp mass,
is a another quantity that is measured with a great accuracy from the gravitational-wave signal. It was measured to be [21] for the GW170817 event.
In Figure 5, we have determined the effective tidal deformability, , of all binary systems compatible with and . Both sets of EoSs show very similar results: A small weak dependence of on q (as already noted in [30,41]), and the deviations due to the crust matching procedure, as measured by the difference on their mean value predictions, are below 6%. This result indicates that when a dataset of EoS is constructed, from a nuclear EoS modeling or a meta-modeling approach, with a specific crust-core matching procedure, an uncertainty as high as 6% must be taken into account in the predictions.
Let us stress that the uncertainties discussed above result from two different contributions: (i) the crust-core matching procedure itself and (ii) the implication that the crust-core matching procedure has on the allowed parametrization space of the core EoS (see Table 2 for the differences). The two contributions are entangled in the present analysis. In the next section we will consider the first one alone.
3.2. Isolating the Matching Procedure Effect
In this section, we isolate the impact of the matching procedure on the NS properties. For that, we are interested in finding a set of EoS that simultaneously allows for a crust-core transition within both matching procedures. From the previous section, we have learned, however, that it is quite unlikely that a specific EoS sampled from the initial probability distribution would enable a crust-core matching within both procedures, as the considerable difference on the parameters distribution and correlations seems to indicate. In other words, the overlap region between the two final probability distributions is very small, indicating that, once an hadronic EoS is chosen, it is unlikely that both matching procedures are possible. However, by drawing a considerable number of EoS samples from the initial probability distribution, we were able to construct a set of 55 EoS that satisfy both matching procedures.
In Figure 6, we show the mean, and some other statistics, of the prediction difference for NS radius (left), Love number (center), and tidal deformability . Let us point out that in Figure 4 we have defined (e.g.) as the absolute difference between means, , and in Figure 6, we are considering for the prediction difference and , where , for the relative difference. Thus, denotes here the average radii difference instead of the difference on the radii averages as in the last section.
We see that the discrepancy on the NS radius prediction lies between 2.5% and 5% corresponding to ∼0.34 km and ∼0.68 km for , and it decreases to 1% and 2% corresponding to 0.1 km and 0.25 km for . The Love number is the quantity that shows the highest prediction difference, with almost 20 for and 7% for . On the other hand, regardless of the NS mass, the crust-core matching method has only a small impact on the , lower than 1%. Considering that , where is the star compactness, the quite small value is surprising when compared with both and . This result rises from a cancellation effect between and C due to the non-trivial dependence of on C and on the EoS [27,42,43]. Despite the sensitivity of and R on the matching procedure for the same core EoS, the tidal deformability shows no such degree of sensitivity. From this analysis, when considering a non-unified EoS approach in describing neutron star matter, we are able to attribute a prediction error that arises solely from crust-core matching procedure.
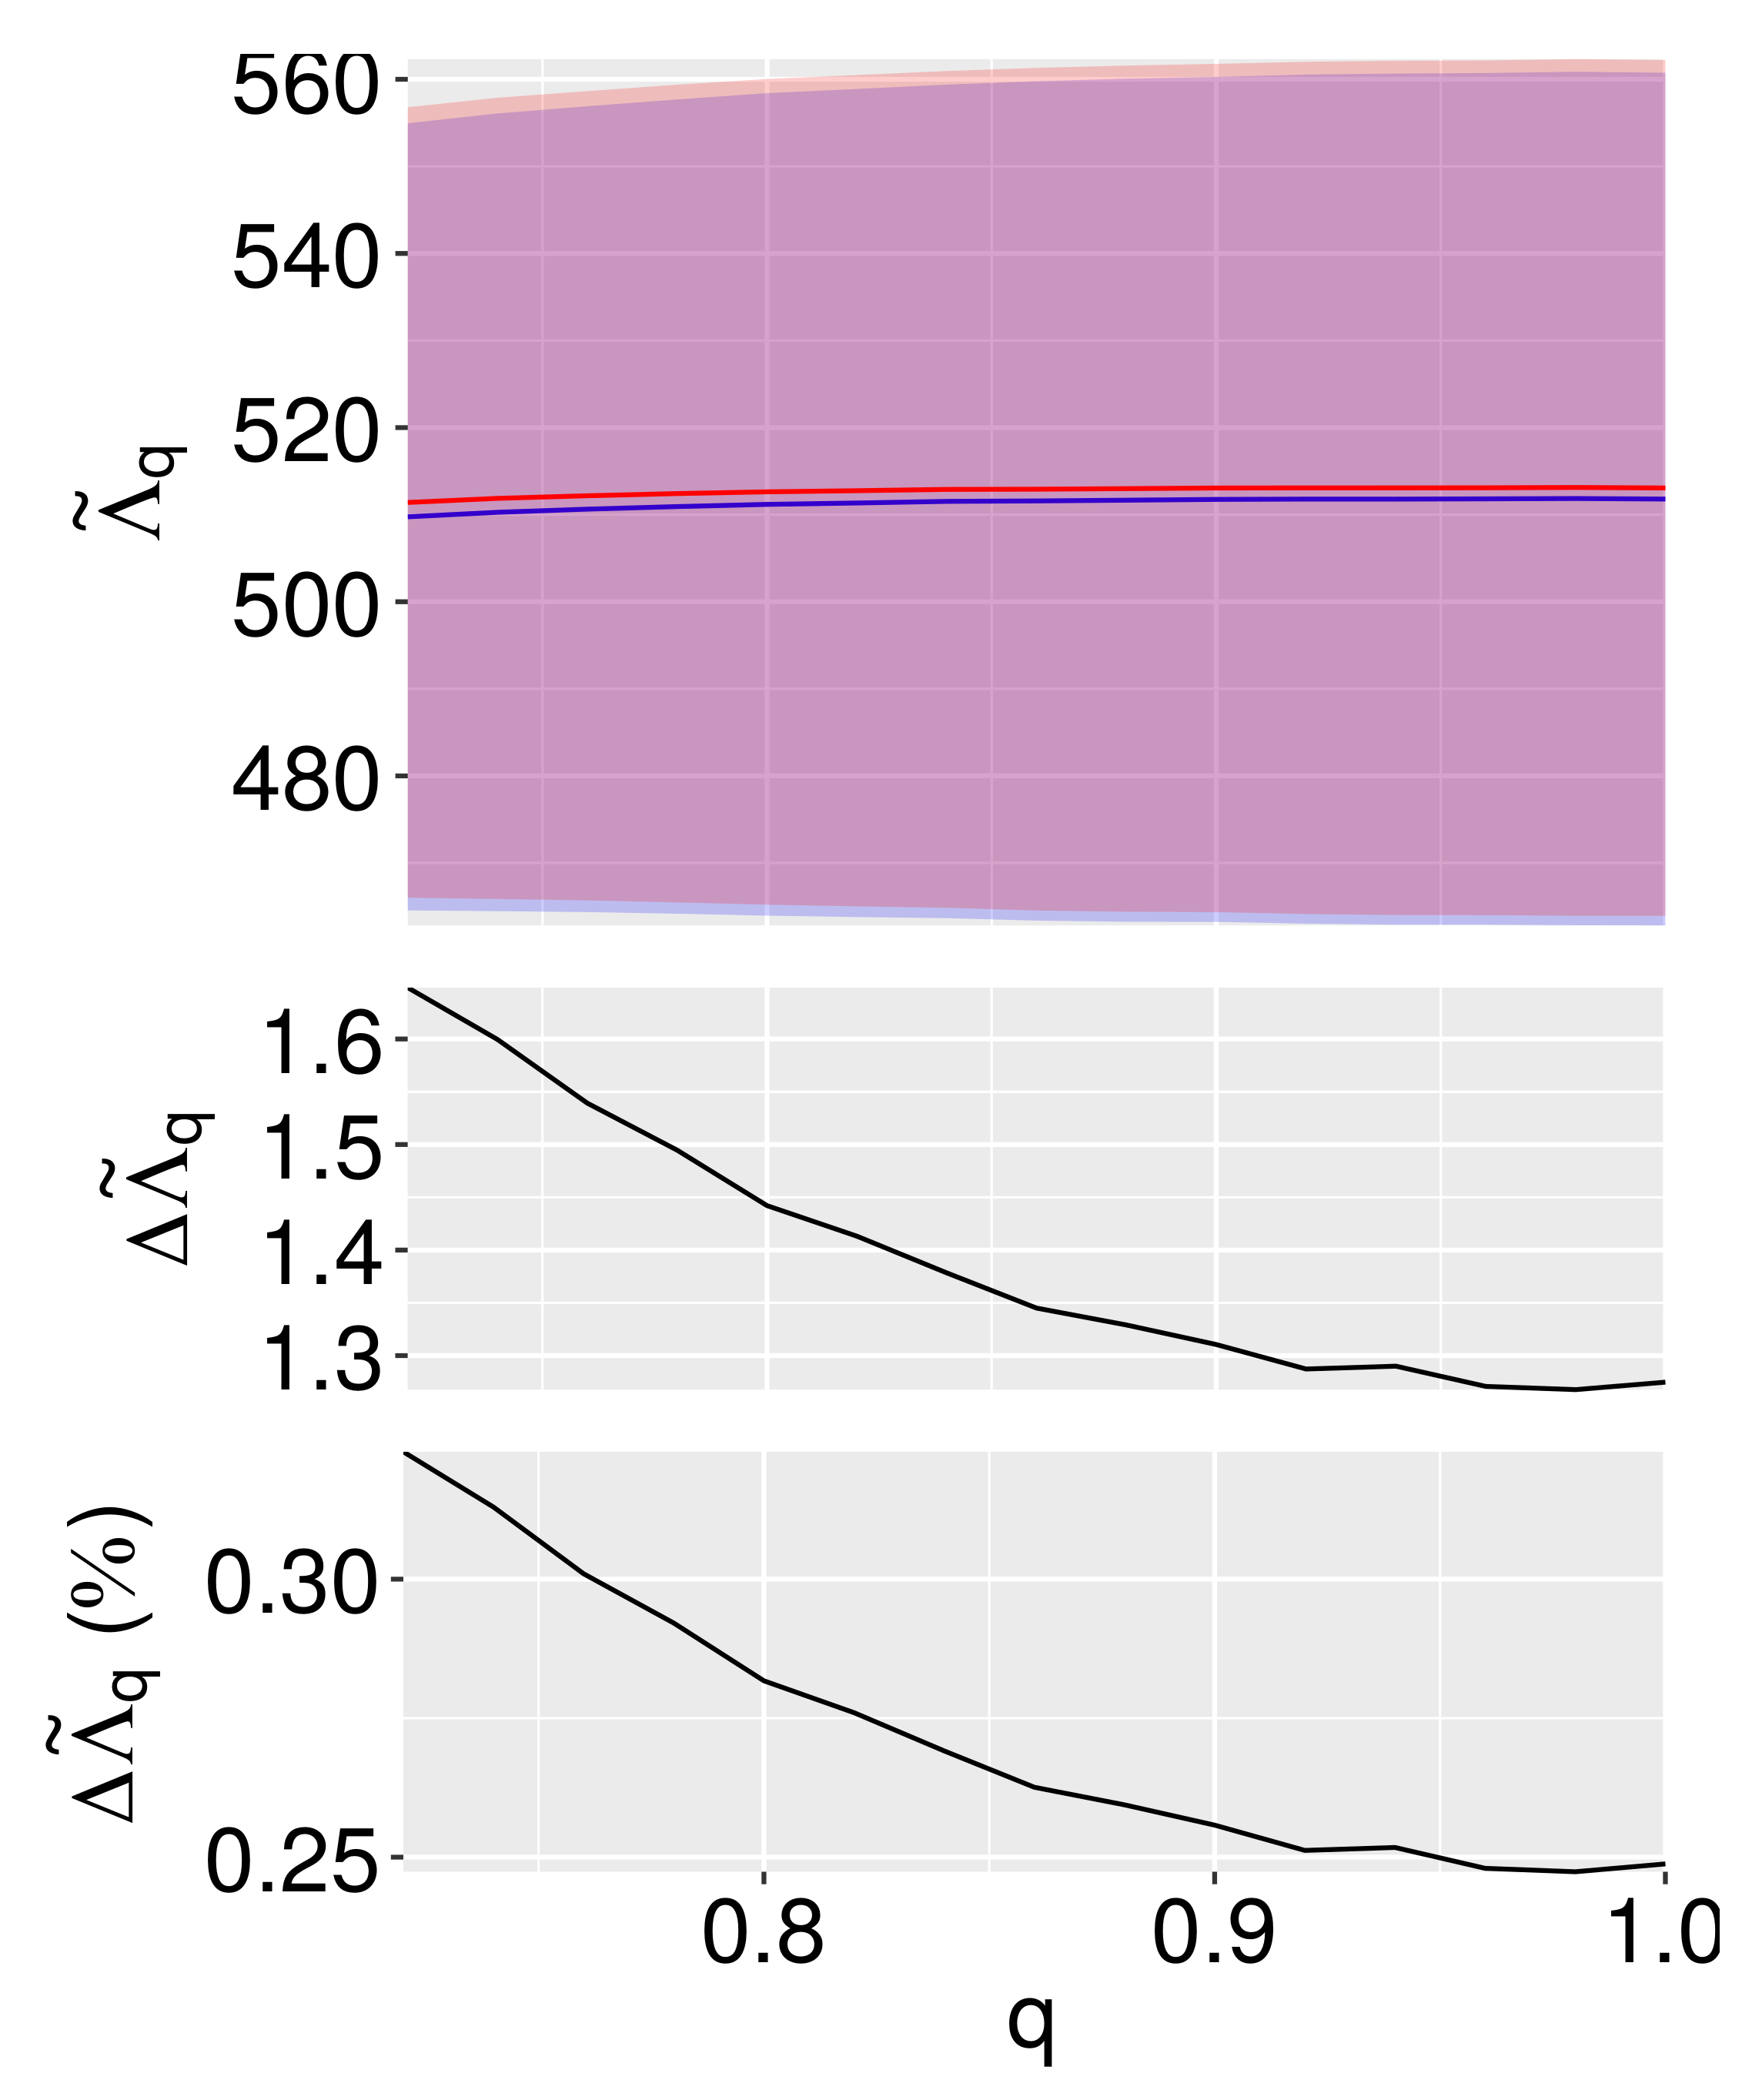
Finally, in Figure 7, we display the prediction difference for as a function of q (fixing and ). The crust-core matching procedure has only a marginal impact on the effective tidal deformability of NS binaries, which are compatible with the GW170817 event.
We conclude that NS properties predicted from a non-unified EoS approach, where a crust is added under a certain matching procedure, carry a systematic uncertainty, which includes the influence of the matching procedure on the accepted core EoS. An uncertainty of ∼5% was determined in the present study for the radius of NSs with masses below 1.4 .
4. Conclusions
We have analyzed the impact of the EoS crust-core matching procedure on the NS properties. We have generated two distinct EoS datasets employing two matching procedures used in the literature, where the matchings are done in the and planes. The core EoS was determined from a Taylor expansion approach, in which the energy functional is expanded in a Taylor series around the saturation density. Different core EoSs were generated through random sampling of the empirical parameters via a multivariate Gaussian with zero covariance. To get a valid EoS, we then impose thermodynamic stability, causality, and a maximum star mass of 1.97 to each sampled EoS.
In the first part, we have concluded that, when meta-modeling is used to generate a set of all possible nuclear matter EoS, the crust-core matching procedure affects the output EoS parameter space, and thus the NS properties will show distinct statistics concerning their properties. When considering the difference between the mean values of each dataset, we saw that the impact of the crust-core matching procedure on the NS properties decreases as more massive NSs are considered: an uncertainty of ∼5% was obtained for a and below 2% for a NS. The Love number predictions show a discrepancy of 18% and 6% for and NS, respectively. The deviations on the predictions can be as high as 8% for a NS but go down to a value below 4% for . We notice that the uncertainty introduced in the calculation of the radius for stars with a mass is of the order of the uncertainty that NICER aims to attain in the future observations.
In the second part, we isolate the impact of the matching procedure by building a dataset of core EoSs that allows for both matching procedures under the applied constraints, i.e., fm. We concluded that uncertainty in the NS radius prediction is in between 0.34 km and 0.68 km for , and it decreases for 0.1 km and 0.25 km for . The Love number shows the highest prediction difference, with almost 20% for and 7% for . However, the crust-core matching method shows a very small impact on the (below 1%). This conclusion is consistent with the results obtained in [27,42,43], when the analysis of the effect of the crust is done taking a fixed core EoS. Likewise, the effective tidal deformability values of the of NS binaries, compatible with the GW170817 event, show almost no effect from the crust-core matching procedure.
Let us mention that the EoS parameters in Equations (2) and (3) are seen as unknown parameters to be extracted from astrophysical observations, and not the Taylor coefficients from any energy density functional of nuclear matter [44]. We interpret our EoS as metamodels, and while the nuclear matter parameters of the lower order expansion terms may have a direct relation with the nuclear matter properties constrained by experimental measurements, the parameters connected to the higher order terms should be considered as effective parameters that will be constrained by the astrophysical observations [37,44].
Author Contributions
Conceptualization, M.F. and C.P.; methodology, M.F. and C.P.; software, M.F.; writing—original draft preparation, M.F. and C.P.; writing—review and editing, M.F. and C.P. All authors have read and agreed to the published version of the manuscript.
Funding
This work was partly supported by Fundação para a Ciência e Tecnologia, Portugal, under the projects UID/FIS/04564/2016 and POCI-01-0145-FEDER-029912 with financial support from POCI, in its FEDER component, and by the FCT/MCTES budget through national funds (OE), and by PHAROS COST Action CA16214.
Conflicts of Interest
The authors declare no conflict of interest. The funders had no role in the design of the study; in the collection, analyses, or interpretation of data; in the writing of the manuscript, or in the decision to publish the results.
Abbreviations
The following abbreviations are used in this manuscript:
| NS | Neutron Star |
| EoS | Equation of State |
| NICER | Neutron star Interior Composition Explorer |
| GW | Gravitational Waves |
| eXTP | enhanced X-ray Timing and Polarimetry |
| neutron-proton-electron-muon |
References
- Arzoumanian, Z.; Brazier, A.; Burke-Spolaor, S.; Chamberlin, S.; Chatterjee, S.; Christy, B.; Cordes, J.M.; Cornish, N.J.; Crawford, F. The NANOGrav 11-year Data Set: High-precision timing of 45 Millisecond Pulsars. Astrophys. J. Suppl. 2018, 235, 37. [Google Scholar] [CrossRef] [Green Version]
- Fonseca, E.; Pennucci, T.T.; Ellis, J.A.; Stairs, I.H.; Nice, D.J.; Ransom, S.M.; Demorest, P.B.; Arzoumanian, Z.; Crowter, K.; Dolch, T. The NANOGrav Nine-year Data Set: Mass and Geometric Measurements of Binary Millisecond Pulsars. Astrophys. J. 2016, 832, 167. [Google Scholar] [CrossRef]
- Demorest, P.; Pennucci, T.; Ransom, S.; Roberts, M.; Hessels, J. Shapiro Delay Measurement of A Two Solar Mass Neutron Star. Nature 2010, 467, 1081–1083. [Google Scholar] [CrossRef] [PubMed]
- Antoniadis, J.; Freire, P.C.C.; Wex, N.; Tauris, T.M.; Lynch, R.S.; van Kerkwijk, M.H.; Kramer, M.; Bassa, C.; Dhillon, V.S.; Driebe, T.; et al. A Massive Pulsar in a Compact Relativistic Binary. Science 2013, 340, 448. [Google Scholar] [CrossRef] [Green Version]
- Cromartie, H.T.; Fonseca, E.; Ransom, S.M.; Demorest, P.B.; Arzoumanian, Z.; Blumer, H.; Brook, P.R.; DeCesar, M.E.; Dolch, T.; Ellisothers, J.A.; et al. Relativistic Shapiro delay measurements of an extremely massive millisecond pulsar. Nat. Astron. 2019. [Google Scholar] [CrossRef] [Green Version]
- Vidana, I.; Logoteta, D.; Providencia, C.; Polls, A.; Bombaci, I. Estimation of the effect of hyperonic three-body forces on the maximum mass of neutron stars. EPL 2011, 94, 11002. [Google Scholar] [CrossRef] [Green Version]
- Bednarek, I.; Haensel, P.; Zdunik, J.; Bejger, M.; Manka, R. Hyperons in neutron-star cores and two-solar-mass pulsar. Astron. Astrophys. 2012, 543, A157. [Google Scholar] [CrossRef] [Green Version]
- Weissenborn, S.; Chatterjee, D.; Schaffner-Bielich, J. Hyperons and massive neutron stars: Vector repulsion and SU(3) symmetry. Phys. Rev. C 2014, 85, 065802, Erratum in 2014, 90, 019904. [Google Scholar] [CrossRef] [Green Version]
- Drago, A.; Lavagno, A.; Pagliara, G.; Pigato, D. Early appearance of Δ isobars in neutron stars. Phys. Rev. C 2014, 90, 065809. [Google Scholar] [CrossRef]
- Benic, S.; Blaschke, D.; Alvarez-Castillo, D.E.; Fischer, T.; Typel, S. A new quark-hadron hybrid equation of state for astrophysics—I. High-mass twin compact stars. Astron. Astrophys. 2015, 577, A40. [Google Scholar] [CrossRef] [Green Version]
- Câmara Pereira, R.; Costa, P.; Providência, C. Two-solar-mass hybrid stars: A two model description with the Nambu-Jona-Lasinio quark model. Phys. Rev. D 2016, 94, 094001. [Google Scholar] [CrossRef]
- Fortin, M.; Avancini, S.; Providência, C.; Vidaña, I. Hypernuclei and massive neutron stars. Phys. Rev. C 2017, 95, 065803. [Google Scholar] [CrossRef]
- Ferreira, M.; Câmara Pereira, R.; Providência, C. Neutron stars with large quark cores. Phys. Rev. D 2020, 101, 123030. [Google Scholar] [CrossRef]
- Ferreira, M.; Câmara Pereira, R.; Providência, C. Quark matter in light neutron stars. Phys. Rev. D 2020, 102, 083030. [Google Scholar] [CrossRef]
- Arzoumanian, Z.; Gendreau, K.C.; Baker, C.L.; Cazeau, T.; Hestnes, P.; Kellogg, J.W.; Kenyon, S.J.; Kozon, R.P.; Liu, K.C.; Manthripragada, S.S.; et al. The neutron star interior composition explorer (NICER): Mission definition. In Proceedings of the SPIE 2014, Montreal, QC, Canada, 25–27 June 2014; Society of Photo-Optical Instrumentation Engineers (SPIE) Conference Series. Volume 9144, p. 914420. [Google Scholar] [CrossRef]
- Motch, C.; Wilms, J.; Barret, D.; Becker, W.; Bogdanov, S.; Boirin, L.; Corbel, S.; Cackett, E.; Campana, S.; de Martino, D.; et al. The Hot and Energetic Universe: End points of stellar evolution. arXiv 2013, arXiv:1306.2334. [Google Scholar]
- Watts, A.L.; Yu, W.; Poutanen, J.; Zhang, S.; Bhattacharyya, S.; Bogdanov, S.; Ji, L.; Patruno, A.; Riley, T.E.; Bakala, P.; et al. Dense matter with eXTP. Sci. China Phys. Mech. Astron. 2019, 62, 29503. [Google Scholar] [CrossRef] [Green Version]
- Miller, M.C.; Lamb, F.K.; Dittmann, A.J.; Bogdanov, S.; Arzoumanian, Z.; Gendreau, K.C.; Guillot, S.; Harding, A.K.; Ho, W.C.G.; Lattimer, J.M.; et al. PSR J0030+0451 Mass and Radius from NICER Data and Implications for the Properties of Neutron Star Matter. Astrophys. J. 2019, 887, L24. [Google Scholar] [CrossRef] [Green Version]
- Riley, T.E.; Watts, A.L.; Bogdanov, S.; Ray, P.S.; Ludlam, R.M.; Guillot, S.; Arzoumanian, Z.; Baker, C.L.; Bilous, A.V.; Chakrabarty, D.; et al. A NICER View of PSR J0030+0451: Millisecond Pulsar Parameter Estimation. Astrophys. J. 2019, 887, L21. [Google Scholar] [CrossRef] [Green Version]
- Abbott, B.P.; Abbott, R.; Abbott, T.D.; Acernese, F.; Ackley, K.; Adams, C.; Adams, T.; Addesso, P.; Adhikari, R.X.; Adya, V.B.; et al. GW170817: Measurements of neutron star radii and equation of state. Phys. Rev. Lett. 2018, 121, 161101. [Google Scholar] [CrossRef] [Green Version]
- Abbott, B.P.; Abbott, R.; Abbott, T.D.; Acernese, F.; Ackley, K.; Adams, C.; Adams, T.; Addesso, P.; Adhikari, R.X.; Adya, V.B.; et al. Properties of the binary neutron star merger GW170817. Phys. Rev. 2019, X9, 011001. [Google Scholar] [CrossRef] [Green Version]
- Potekhin, A.; Fantina, A.; Chamel, N.; Pearson, J.; Goriely, S. Analytical representations of unified equations of state for neutron-star matter. Astron. Astrophys. 2013, 560, A48. [Google Scholar] [CrossRef] [Green Version]
- Sharma, B.; Centelles, M.; Viñas, X.; Baldo, M.; Burgio, G. Unified equation of state for neutron stars on a microscopic basis. Astron. Astrophys. 2015, 584, A103. [Google Scholar] [CrossRef]
- Pearson, J.; Chamel, N.; Potekhin, A.; Fantina, A.; Ducoin, C.; Dutta, A.; Goriely, S. Unified equations of state for cold non-accreting neutron stars with Brussels–Montreal functionals—I. Role of symmetry energy. Mon. Not. R. Astron. Soc. 2019, 481, 2994–3026, Erratum in 2019, 486, 768. [Google Scholar] [CrossRef] [Green Version]
- Pais, H.; Providência, C. Vlasov formalism for extended relativistic mean field models: The crust-core transition and the stellar matter equation of state. Phys. Rev. C 2016, 94, 015808. [Google Scholar] [CrossRef]
- Fortin, M.; Providencia, C.; Raduta, A.R.; Gulminelli, F.; Zdunik, J.L.; Haensel, P.; Bejger, M. Neutron star radii and crusts: Uncertainties and unified equations of state. Phys. Rev. 2016, C94, 035804. [Google Scholar] [CrossRef] [Green Version]
- Ji, F.; Hu, J.; Bao, S.; Shen, H. Effects of nuclear symmetry energy and equation of state on neutron star properties. Phys. Rev. C 2019, 100, 045801. [Google Scholar] [CrossRef] [Green Version]
- Read, J.S.; Lackey, B.D.; Owen, B.J.; Friedman, J.L. Constraints on a phenomenologically parameterized neutron-star equation of state. Phys. Rev. 2009, D79, 124032. [Google Scholar] [CrossRef] [Green Version]
- Margueron, J.; Hoffmann Casali, R.; Gulminelli, F. Equation of state for dense nucleonic matter from metamodeling. II. Predictions for neutron star properties. Phys. Rev. 2018, C97, 025806. [Google Scholar] [CrossRef] [Green Version]
- Carson, Z.; Steiner, A.W.; Yagi, K. Constraining nuclear matter parameters with GW170817. Phys. Rev. D 2019, 99, 043010. [Google Scholar] [CrossRef] [Green Version]
- Raithel, C.; Özel, F.; Psaltis, D. Tidal deformability from GW170817 as a direct probe of the neutron star radius. Astrophys. J. 2018, 857, L23. [Google Scholar] [CrossRef]
- Annala, E.; Gorda, T.; Kurkela, A.; Vuorinen, A. Gravitational-Wave Constraints on the Neutron-Star-Matter Equation of State. Phys. Rev. Lett. 2018, 120, 172703. [Google Scholar] [CrossRef] [PubMed] [Green Version]
- De, S.; Finstad, D.; Lattimer, J.M.; Brown, D.A.; Berger, E.; Biwer, C.M. Tidal Deformabilities and Radii of Neutron Stars from the Observation of GW170817. Phys. Rev. Lett. 2018, 121, 091102, Erratum in 2018, 121, 259902. [Google Scholar] [CrossRef] [PubMed] [Green Version]
- Tews, I.; Margueron, J.; Reddy, S. Critical examination of constraints on the equation of state of dense matter obtained from GW170817. Phys. Rev. 2018, C98, 045804. [Google Scholar] [CrossRef] [Green Version]
- Most, E.R.; Weih, L.R.; Rezzolla, L.; Schaffner-Bielich, J. New Constraints on Radii and Tidal Deformabilities of Neutron Stars from GW170817. Phys. Rev. Lett. 2018, 120, 261103. [Google Scholar] [CrossRef] [Green Version]
- Douchin, F.; Haensel, P. A unified equation of state of dense matter and neutron star structure. Astron. Astrophys. 2001, 380, 151. [Google Scholar] [CrossRef] [Green Version]
- Margueron, J.; Hoffmann Casali, R.; Gulminelli, F. Equation of state for dense nucleonic matter from metamodeling. I. Foundational aspects. Phys. Rev. 2018, C97, 025805. [Google Scholar] [CrossRef] [Green Version]
- Margueron, J.; Gulminelli, F. Effect of high-order empirical parameters on the nuclear equation of state. Phys. Rev. 2019, C99, 025806. [Google Scholar] [CrossRef] [Green Version]
- Ferreira, M.; Fortin, M.; Malik, T.; Agrawal, B.; Providência, C. Empirical constraints on the high-density equation of state from multimessenger observables. Phys. Rev. D 2020, 101, 043021. [Google Scholar] [CrossRef] [Green Version]
- Ducoin, C.; Margueron, J.; Providencia, C.; Vidana, I. Core-crust transition in neutron stars: Predictivity of density developments. Phys. Rev. 2011, C83, 045810. [Google Scholar] [CrossRef] [Green Version]
- Ferreira, M.; Providência, C. Effect of the crust on neutron star empirical relations. Phys. Rev. D 2020, 102, 103003. [Google Scholar] [CrossRef]
- Piekarewicz, J.; Fattoyev, F. Impact of the neutron star crust on the tidal polarizability. Phys. Rev. C 2019, 99, 045802. [Google Scholar] [CrossRef] [Green Version]
- Perot, L.; Chamel, N.; Sourie, A. Role of the crust in the tidal deformability of a neutron star within a unified treatment of dense matter. Phys. Rev. C 2020, 101, 015806. [Google Scholar] [CrossRef] [Green Version]
- Zhang, N.B.; Li, B.A.; Xu, J. Combined Constraints on the Equation of State of Dense Neutron-rich Matter from Terrestrial Nuclear Experiments and Observations of Neutron Stars. Astrophys. J. 2018, 859, 90. [Google Scholar] [CrossRef]
Figure 1.
Probability density functions for , , and using both crust matching procedures: (blue) and (red).
Figure 1.
Probability density functions for , , and using both crust matching procedures: (blue) and (red).

Figure 2.
Crust–core transition densities, , for the (left) and (right) matching procedures. The blue dashed line represents the mean value.
Figure 2.
Crust–core transition densities, , for the (left) and (right) matching procedures. The blue dashed line represents the mean value.

Figure 3.
Left panel: Correlations between parameters for (bottom triangle) and (upper triangle) crust matching procedures. Right panel: Correlation difference from the crust matching procedures.
Figure 3.
Left panel: Correlations between parameters for (bottom triangle) and (upper triangle) crust matching procedures. Right panel: Correlation difference from the crust matching procedures.

Figure 4.
Top panels: Mean value (solid line), mean value (filled region), and maximum/minimum values (dashed lines) for the NS radius (left), Love number (center), and (right). The color identifies the matching procedure: Blue for and red for Middle panels: Difference between mean values, , where . Bottom panels: Relative difference (%), defined by , where .

Figure 5.
Top panels: Effective tidal deformability of the binary, , as a function of q for . The mean (solid line), (filled region), and max/min values (dashed lines) are shown for each dataset, (blue) and (red). Middle panels: Difference between mean values, . Bottom panels: Relative difference (%), defined by , where .

Figure 6.
Prediction difference in NS radius (left), Love number (center), and (right). Top panels: Mean difference values (solid line), , where and N is the number of models, (filled region), and maximum/minimum values (dashed lines); Bottom panels: Relative difference (%), defined by , where .
Figure 6.
Prediction difference in NS radius (left), Love number (center), and (right). Top panels: Mean difference values (solid line), , where and N is the number of models, (filled region), and maximum/minimum values (dashed lines); Bottom panels: Relative difference (%), defined by , where .

Figure 7.
Effective tidal deformability of the binary, , as a function of q for . The mean (solid line), (filled region), and max/min values (dashed lines) are shown for each dataset, (blue) and (red).
Figure 7.
Effective tidal deformability of the binary, , as a function of q for . The mean (solid line), (filled region), and max/min values (dashed lines) are shown for each dataset, (blue) and (red).


Table 1.
The mean and standard deviation of the multivariate Gaussian, where is the variance of the parameter . Our equation of states (EoSs) are sampled using the initial distribution for assuming that there are no correlations among the parameters. All the quantities are in units of MeV.
Table 1.
The mean and standard deviation of the multivariate Gaussian, where is the variance of the parameter . Our equation of states (EoSs) are sampled using the initial distribution for assuming that there are no correlations among the parameters. All the quantities are in units of MeV.
| 32 | 60 | 230 | −100 | 300 | |
| 2 | 15 | 20 | 100 | 400 |
Table 2.
The mean and standard deviation (std) of the empirical parameters. All the quantities are in units of MeV.
Table 2.
The mean and standard deviation (std) of the empirical parameters. All the quantities are in units of MeV.
| mean | std | mean | std | |
|---|---|---|---|---|
| 225.32 | 17.47 | 227.75 | 19.24 | |
| −83.20 | 30.26 | −83.69 | 34.93 | |
| 33.18 | 1.84 | 31.41 | 1.90 | |
| 61.89 | 8.14 | 77.70 | 7.47 | |
| −26.63 | 30.45 | −32.32 | 37.07 | |
Publisher’s Note: MDPI stays neutral with regard to jurisdictional claims in published maps and institutional affiliations. |
© 2020 by the authors. Licensee MDPI, Basel, Switzerland. This article is an open access article distributed under the terms and conditions of the Creative Commons Attribution (CC BY) license (http://creativecommons.org/licenses/by/4.0/).
Share and Cite
MDPI and ACS Style
Ferreira, M.; Providência, C. Neutron Star Properties: Quantifying the Effect of the Crust–Core Matching Procedure. Universe 2020, 6, 220. https://doi.org/10.3390/universe6110220
AMA Style
Ferreira M, Providência C. Neutron Star Properties: Quantifying the Effect of the Crust–Core Matching Procedure. Universe. 2020; 6(11):220. https://doi.org/10.3390/universe6110220
Chicago/Turabian StyleFerreira, Márcio, and Constança Providência. 2020. "Neutron Star Properties: Quantifying the Effect of the Crust–Core Matching Procedure" Universe 6, no. 11: 220. https://doi.org/10.3390/universe6110220
Note that from the first issue of 2016, this journal uses article numbers instead of page numbers. See further details here.