Quantification of Solute Composition in H2O-NaCl-CaCl2 Solutions Using Cryogenic 2D Raman Mapping


1
School of Earth Sciences and Resources, China University of Geosciences, Beijing 100083, China
2
Department of Geology, University of Regina, Regina, SK S4S 0A2, Canada
*
Author to whom correspondence should be addressed.
Minerals 2020, 10(11), 1043; https://doi.org/10.3390/min10111043
Submission received: 11 August 2020
/
Revised: 16 November 2020
/
Accepted: 21 November 2020
/
Published: 23 November 2020
(This article belongs to the Special Issue Mineral, Fluid, and Melt Inclusions—Analysis, Interpretation, and Application)
Abstract
:Various analytical techniques have been developed to determine the solution composition of fluid inclusions, including destructive, non-destructive, single-inclusion, and bulk-inclusion methods. Cryogenic Raman spectroscopy, as a non-destructive and single-inclusion method, has emerged as a potentially powerful tool of quantitative analysis of fluid inclusion composition. A method of point analysis using cryogenic Raman spectroscopy has been previously proposed to quantitatively estimate the solute composition of H2O-NaCl-CaCl2 solutions, but there are uncertainties related to heterogeneity of frozen fluid inclusions and potential bias in the processing of Raman spectra. A new method of quantitative analysis of solute composition of H2O-NaCl-CaCl2 solutions using Raman mapping technology is proposed in this study, which can overcome the problems encountered in the point analysis. It is shown that the NaCl/(NaCl + CaCl2) molar ratio of the solution, X(NaCl, m), can be related to the area fraction of hydrohalite over hydrohalite plus antarcticite, Fhydrohalite, by the equation X(NaCl, m) = 1.1435 Fhydrohalite − 0.0884, where Fhydrohalite = hydrohalite area/(hydrohalite area + antarcticite area). This equation suggests that the molar fraction of a salt component may be estimated from the fraction of the Raman peak area of the relevant hydrate. This study has established a new way of estimating solute composition of fluid inclusions using cryogenic Raman mapping technique, which may be extended to other solutions.
1. Introduction
Analysis of solute composition is an important part of fluid inclusion studies, which can yield indispensable information about the composition, temperature and pressure conditions of geological fluids [1]. Fluid inclusion solute composition may be analyzed with various methods, including single-inclusion, bulk-inclusion, destructive, and non-destructive analyses, among which the most commonly used ones include microthermometry, decrepitation-SEM-EDS, LA-ICP-MS, and bulk leachate ICP-MS [1,2]. As a non-destructive and single-inclusion analytical method, the most successful use of Raman spectroscopy in fluid inclusion studies has been mainly in the analysis of volatiles, with relatively limited application in solute analysis due to the non-sensitivity of monoatomic cations such as Na+, K+, Ca2+, and Mg2+ to Raman [3]. However, it has been shown that salt hydrates with various numbers of H2O molecules in the crystal structure at low temperatures are sensitive to Raman [4], and thus cryogenic Raman spectroscopy has been increasingly used to study the solute composition of fluid inclusions [5,6,7,8]. A number of cryogenic Raman studies have been conducted for the H2O-NaCl-CaCl2 system, which represents a common type of geologic fluid [1,9,10]. Various hydrates including hydrohalite (NaCl·2H2O), antarcticite (CaCl2·6H2O), -tetrahydrate (-CaCl2·4H2O), -tetrahydrate (-CaCl2·4H2O), and sinjarite (CaCl2·2H2O) formed from H2O-NaCl-CaCl2 solutions show distinct Raman peaks [5,11,12,13,14,15], which have been used to provide qualitative and semi-quantitative estimation of the solute composition [6,11,14,15,16].
In a few recent studies, we attempted to quantitatively determine the solute composition of H2O-NaCl-CaCl2 solutions with cryogenic Raman spectroscopy [17,18]. We froze a series of H2O-NaCl-CaCl2 solutions with known compositions and randomly selected a few spots for Raman spectroscopic analyses, with the aim to establish a quantitative relationship between the intensity of the peaks and the composition of the solutions [17]. Although a quantitative relationship was successfully established, its applicability is compromised by three problems: (1) the disequilibrium behaviors (especially the failure of nucleation of hydrates) is common during freezing [11,17,19], which is a barrier for the application of the cryogenic Raman method to natural fluid inclusions; (2) errors and bias may be introduced in the process of baseline truncation due to the presence of residual interstitial solution between ice and hydrate crystals, and (3) the distribution of hydrates and ice is typically inhomogeneous across the fluid inclusions [17,19]. Although these problems may be alleviated by averaging multiple point analyses [17,18,20], a more robust method with less artificial interference is desirable.
In this study, we tackle the above-discussed problems by introducing the confocal Raman microscopy mapping technique, which has been widely applied in many research fields including materials science [21,22], geoscience [23,24,25], and pharmacology [26]. The advantages of submicrometer resolution, fast data acquisition, and high spatial resolution enable this technique to be a powerful tool for 2D and 3D quantitative mapping within a short time [22,27]. We set up a set of criteria diagnostic of different hydrates, map the distribution of the hydrates as well as ice, use the areas of the different phases to calculate the composition of the solution, specifically the NaCl/(NaCl + CaCl2) molar ratio or XNaCl, and compare the calculated composition with the actual solution composition in order to establish a quantitative relationship between them. Since the densities of NaCl·2H2O (1.6 g/cm3) and CaCl2·6H2O (1.7 g/cm3) are similar, their molar ratios are expected to be similar to the volume ratios, which can be approximated by area fractions estimated from Raman mapping. Therefore, a linear correlation between the NaCl·2H2O area fraction and the molar concentration of the solutions is expected.
2. Materials and Methods
2.1. Preparation of H2O-NaCl-CaCl2 Solutions and Synthetic Fluid Inclusions
A total of 11 solutions, with a salinity of 15 wt. % NaCl + CaCl2 and different NaCl/(NaCl + CaCl2) ratios (XNaCl), were prepared from sodium chloride (lot TG29AZEMS; EMD Chemicals Inc., Savannah, GA, USA), calcium chloride (lot ZH2631NFAE; VWR International, West Chester, PE, USA) and deionized water. All the solutions fall in the field where ice is the last-melting phase in the phase diagram [28]. The solutions were labeled from #1 to #11 with the molar fraction of NaCl (X(NaCl, m) = m(NaCl)/[m(NaCl) + m(CaCl2)], where m is molarity) decreased continuously from 1.0 to 0.0 at an increment of 0.1 (Table 1).
The solutions were loaded into silica capillary tubes with an inner diameter of 50 μm, an outer diameter of 300 μm and a length of about 1 cm, and the tubes were then sealed by fusion using the method of Chou et al. (2008) [30]. According to the previous studies [17,19], the solutions with the composition at the eutectic point (solution of #10) of the H2O-NaCl-CaCl2 system commonly failed to nucleate crystals with detectable hydrates peaks. Therefore, alumina powder (0.05 µm) was added to solution #10, as the alumina powder will facilitate the nucleation of hydrate crystals [17]. A droplet of the alumina-solution mixture, with alumina particles floating in the solution, was placed between two small pieces (about 5–10 mm wide) of thin (~120 µm) glass, making a sandwiched solution film of about 50 µm thick.
2.2. Data Acquisition
A Linkam THM600 heating–freezing stage mounted on an Olympus BX 51 microscope (Olympus, Melville, NY, USA) was connected with a Raman spectroscope. To achieve complete freezing of the solution, various cooling/heating rates and cyclic cooling–heating processes were used [19]. The capillary samples were initially cooled rapidly to −185 °C at a rate of 30 °C/min, heated to −100 °C at a rate of 30 °C/min, then to around −60 °C at 2 °C/min, and finally to −185 °C again at a rate of 30 °C/min.
The Raman analysis was carried out with a HORIBA LabRAM laser Raman spectroscope at the Geofluids Laboratory of the Institute of Geology and Geophysics, Chinese Academy of Sciences. The excitation laser wavelength is 532 nm, and the scanning area is 35 × 80 μm. A 50× long working distance objective (NA = 0.5) was used for Raman measurement and the confocal pinhole was set as 100 μm. Under this condition, the diameter of laser beam was about 1μm and the depth of analytical volume was about 2 μm. The scanning step was set at 1.0 × 1.0 μm, corresponding to 2800 analytical points (Figure 1) with an exposure time of 1 s and 1 acquisition per point.
2.3. Data Processing
The Raman data were treated for baseline subtraction and image processing using the software HORIBA Labspec 6 (V 6.4.4.16, HORIBA, Ltd., Montpellier, France), and the area fraction were calculated using the software Image J (V 1.52, National Institutes of Health, Bethesda, MA, USA). The detailed procedures were explained as follows.
2.3.1. Recognition of Representative Peaks
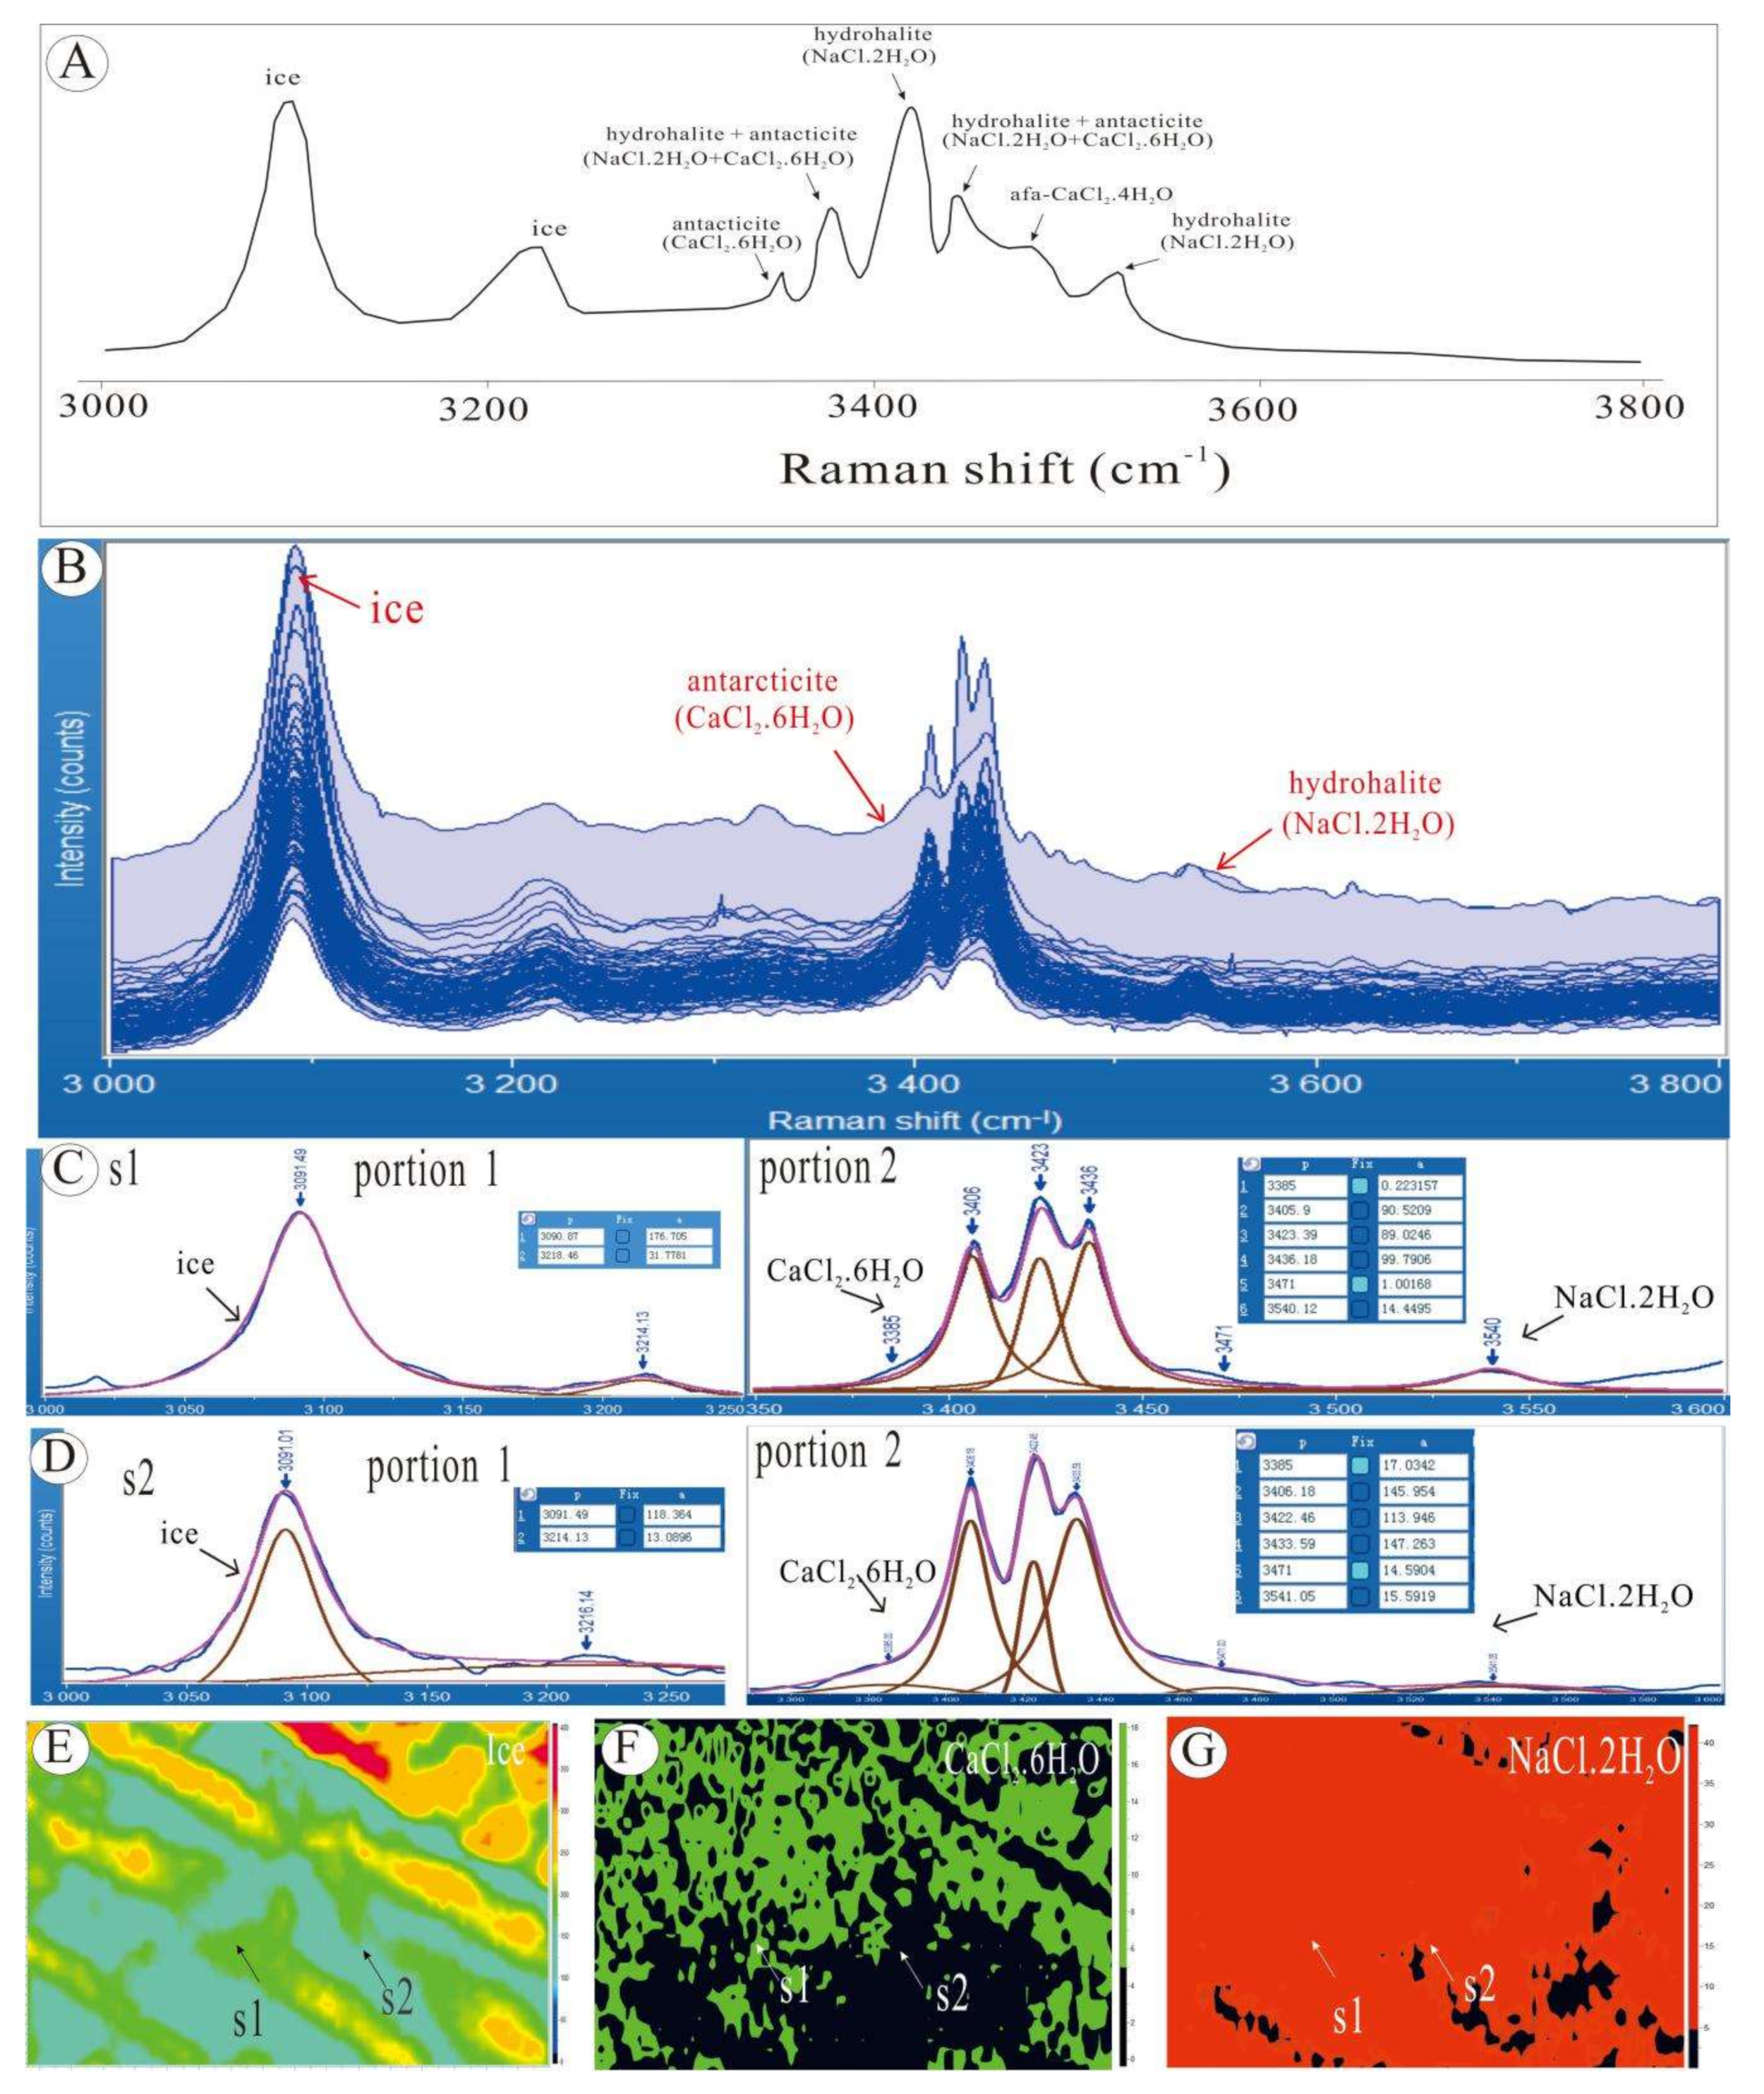
According to previous studies [11,12,14,15,17], ice has two characteristic peaks—i.e., 3090 cm−1 and 3216 cm−1—and hydrohalite has two characteristic peaks at 3422 cm−1 and 3537 cm−1. Apart from two peaks for combined antarcticite and hydrohalite (3405–3408 cm−1 and 3434–3437 cm−1), there are two peaks (3385 cm−1 and 3471 cm−1) exclusively attributed to CaCl2 hydrates (Figure 2A) [17]. In this paper, the relatively more prominent peak of antarcticite (CaCl2·6H2O) at 3385 cm−1 was selected as representative of CaCl2 hydrates. Collectively, peaks at 3090 cm−1, 3385 cm−1, and 3537 cm−1 were regarded as indicating ice, antarcticite, and hydrohalite, respectively (Figure 2B).
2.3.2. Curve-Fitting of the Spectra
Two portions of the spectra—i.e., 3000–3250 cm−1 and 3350–3600 cm−1—were truncated from the original Figure 2C,D) and processed separately:
- (a)
- Under the menu of “Processing”, click on two points connecting the start and end of each portion to make a straight baseline subtraction;
- (b)
- Under the menu of “Analysis”, select peaks of 3090 cm−1 and 3216 cm−1 to do curve fitting in portion 1 (note peak 3090 cm−1 is the representative peak of ice), and select peaks of 3385 cm−1, 3405 cm−1, 3422 cm−1, 3437 cm−1, 3471 cm−1, and 3537 cm−1 to do curve fitting in portion 2 (note peak 3385 cm−1 and 3537 cm−1 are representative peaks of antarcticite and hydrohalite, respectively).
The center of each peak to be fitted was input by users in the “Peak Table” (Figure 2C,D). The centers of two shoulder peaks of 3385 cm−1 and 3471 cm−1 are fixed, while the other peaks are allowed to float within 3 cm−1. The GaussLor function is applied for the curve fitting process. All the treatments are applied to each spectrum and each sample automatically. The peak intensity of individual analytical points can be found under the menu of ‘Analysis- > Peak table’.
2.3.3. Transformation of Distribution Maps
The distribution maps of the hydrates and ice (Figure 2E–G and Figure 3) were constructed based on the presence or absence of the solid phases as indicated by their characteristic Raman peaks. For antarcticite and hydrohalite, at a given point, if the intensity of the characteristic peak is higher than five counts, the solid phase is considered to be present; otherwise, it is considered to be absent. Under the menu of “Display- > Histogram”, which displays the intensity distribution of a certain peak, the scale bars are set to black when the peak intensity is lower than the threshold values as specified above, and to color (green for antarcticite, and red for hydrohalite) when the peak intensity is higher than the threshold values. Since ice appears at each point of each sample with high counts, the scale bars were set as graded colors under the menu “Palette- > Jet”, which displays different colors according to different peak intensities and thus reflect the distribution patterns of freezing. All these settings and criteria were applied to each point by Labspec 6 for each sample.
It should be noted that any given point of analysis may be counted as a single phase, mixture of two phases, or mixture of three phases, depending on whether or not the corresponding peaks were detected. For example, at point s1, the spectrum shows the presence of ice and hydrohalite but absence of antarcticite (Figure 2C), and this is reflected by the green color in the map for ice (Figure 2D), red color for hydrohalite (Figure 2G), and black for antarcticite (Figure 2F). At point s2, the spectrum shows the presence of ice, hydrohalite as well as antarcticite (Figure 2D), and this is reflected by the turquoise color in the map for ice (Figure 2E), red color for hydrohalite (Figure 2G), and green color for antarcticite (Figure 2F).
2.3.4. Calculation of Area Fraction
The areas of antarcticite and hydrohalite were calculated from the distribution maps of the two solid phases (Figure 3) using the software Image J. The hydrohalite area fraction, i.e., the ratio of hydrohalite area/(hydrohalite area + antarcticite area), was calculated from these area data (Table 2), and the results for all the samples were compared to the compositions of the corresponding solutions to determine their relationship (Table 2 and Figure 4).
3. Results
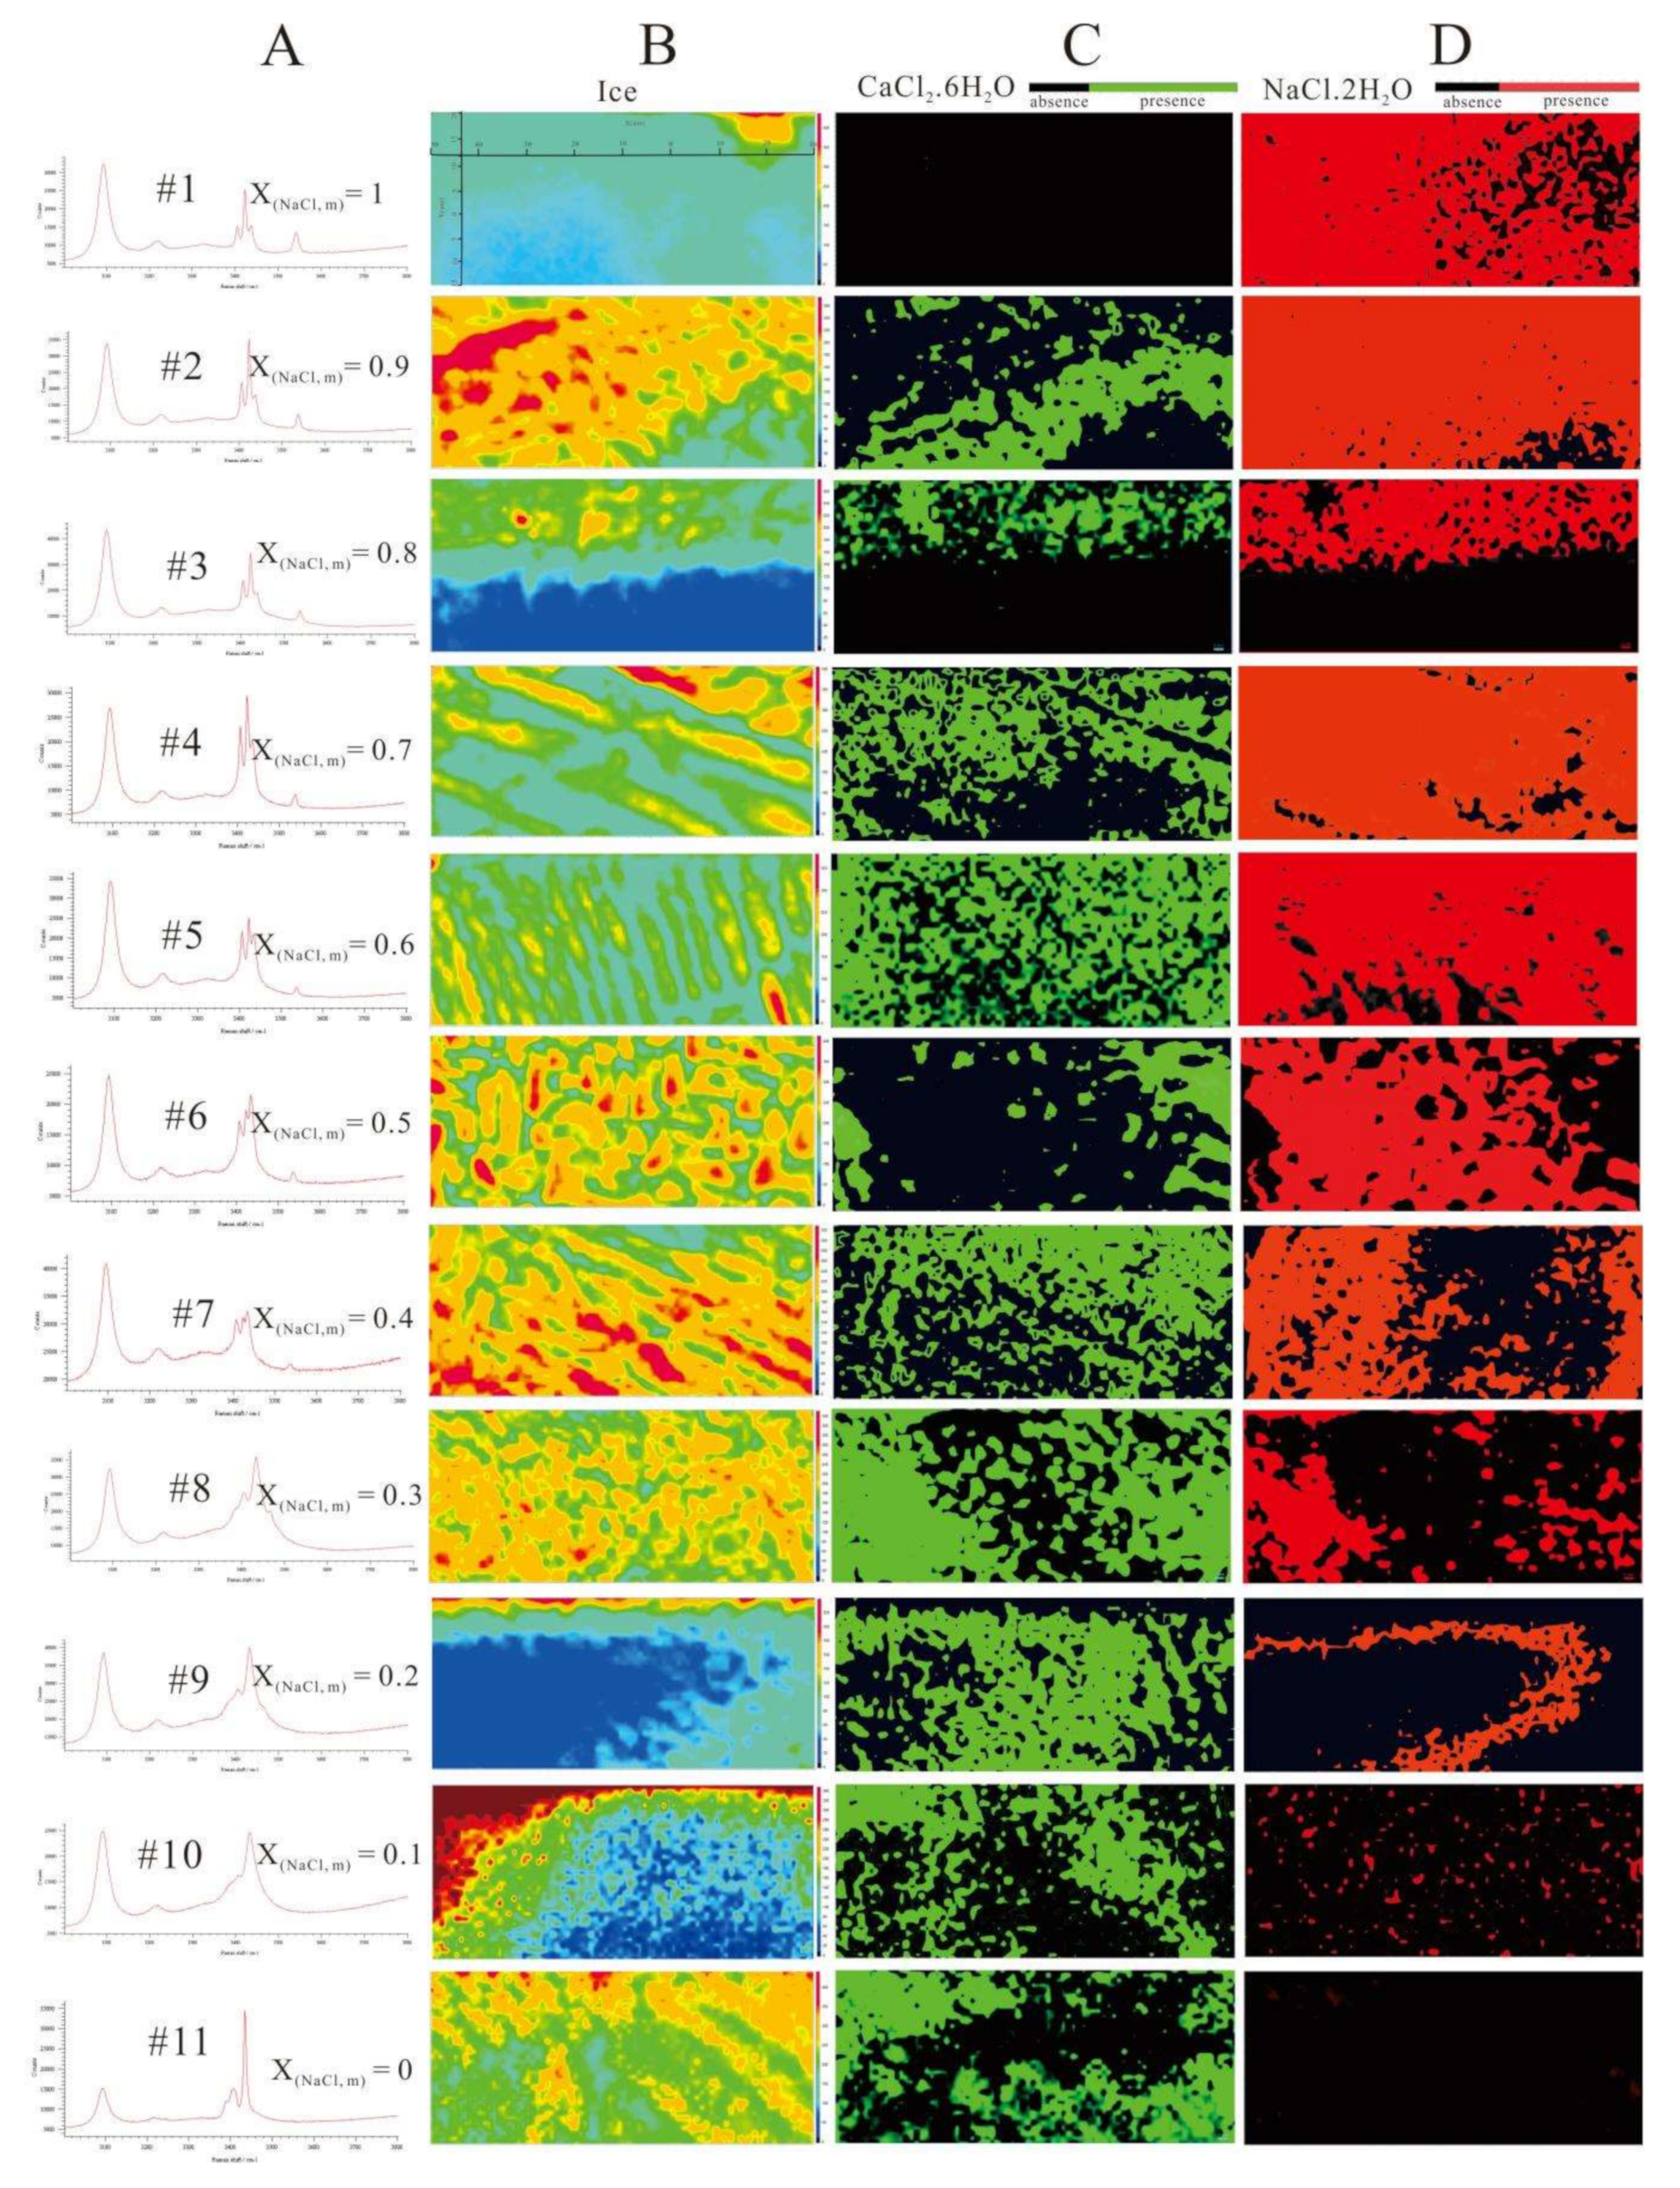
The results of the high-resolution run—i.e., with 1.0 μm × 1.0 μm steps and a total of 2800 analytical points for each sample—are shown in Figure 3 and Table 2. The representative spectra, and the color maps for ice, antarcticite and hydrohalite for each sample are shown in Figure 3B–D, respectively. All the analyses were done on the capillary samples except #10, for which only the alumina-spiked solution sandwiched between thin glasses yielded valid hydrate peaks.
The 2D maps (Figure 3B–D) reveal significant heterogeneity and anisotropy of the solid phases. Most of the samples show that ice, antarcticite and hydrohalite are not homogeneously distributed across the map area. Anisotropic habits are demonstrated by various oriented shapes in the map of ice including the form of ripples (Figure 3(B4,B5,B7)), worms (Figure 3(B6,B8), and fish skeletons (Figure 3(B11)). It is also noticeable that two or three solid phases may overlap at a given point, indicating the nature of these maps, i.e., relative abundance of the solid phases rather than actual distribution of crystals.
The data of hydrohalite area fraction, Fhydrohalite, which is equal to the ratio of hydrohalite area/(hydrohalite area + antarcticite area) as estimated by IMAGE J, are listed in Table 2. These data are plotted against the actual XNaCl molar values of individual samples in Figure 4, and as expected, they show a positive correlation. A well-defined linear correlation equation (R2 = 0.8938) was regressed from these data as
Fhydrohalite = 0.8745 X(NaCl, m) + 0.0773
Rearranging Equation (1), X(NaCl, m) can be expressed as
which is the equation that we are looking for to calculate the X(NaCl, m) values from the hydrohalite fraction estimated by Raman mapping.
X(NaCl, m) = 1.1435 Fhydrohalite − 0.0884
4. Discussion and Conclusions
A previous attempt to quantitatively determine the solution composition of H2O-NaCl-CaCl2 solutions using cryogenic Raman spectroscopic point analysis [17] encountered the limitation caused by inhomogeneous distribution of hydrates and ice, as also revealed in this study, and potential bias introduced in baseline subtraction. These problems are overcome in this study by using the Raman mapping technique. By collecting spectra using the confocal Raman with high spatial resolution (0.5–1 µm) [31] and spectral resolution (<1 cm−1), the quality of the obtained spectra was improved [31]. By covering a large area of 35 × 80 μm, which is much larger than typical fluid inclusions, the effect of heterogeneous distribution of hydrates and ice is minimized. Furthermore, by making straight baseline subtraction in a fixed interval, the potential bias caused by adjusting the curved baseline in the point analysis method [17] is eliminated.
It has been noted earlier that the Raman maps (Figure 2 and Figure 3) do not represent the actual distribution of ice, antarcticite, and hydrohalite crystals, because there may be signals of more than one solid phase detected at a given point. The overlap of Raman signals is unavoidable because of the small grain size of the solid phases in fluid inclusions. However, the Raman maps may nevertheless reflect the relative abundance of the hydrates of NaCl and CaCl2. The almost one-to-one relationship between Fhydrohalite and X(NaCl, m) shown in Equation (2) essentially confirms this hypothesis. The slight deviation of the regression line from the origin (Figure 4) is likely due to analytical uncertainties as well as the minor difference between the density of NaCl·2H2O (1.6 g/cm3) and CaCl2·6H2O (1.7 g/cm3). Therefore, Equation (2) can be confidently used to quantify the solute composition of H2O-NaCl-CaCl2 solutions. Furthermore, it can be postulated that the method used in this study may be extended to estimate the solute composition of other types of solutions, if relevant experiments like this study can be conducted to confirm the quantitative relationships between solute composition and hydrate area fraction.
In the practice of analysis of natural fluid inclusions using the method established in this study, the size of fluid inclusions should be larger than 10 μm. In addition, three procedures may be taken to increase the success rate. First of all, it is necessary to repeat several runs of heating-freezing process to facilitate the nucleation of hydrates [19,32], and cultivate hydrates by finding an optimum combination of cooling and warming rates and temperatures [19] for each sample. Secondly, reducing the scanning step (i.e., increasing the density of scanning points) is critical to overcome the problem of overlapping of neighboring solid phases. Thirdly, during the scanning process, prolonging the exposure time as well as increasing the acquisition time can improve the quality of the peaks of hydrates. In a certain sample, the increase of exposure and acquisition time will equally increase the intensities of all the peaks, therefore, it will not influence the area calculation of hydrates.
In conclusion, we have established a new method to estimate the solute composition of H2O-NaCl-CaCl2 solutions with the cryogenic Raman mapping technique. The mapping method has the advantage over the point analysis method in that it overcomes the problems caused by heterogeneity and baseline subtraction bias. The equation established in this study can be reliably used to calculate the solute composition of H2O-NaCl-CaCl2 solutions. The cryogenic Raman mapping method may be extended to quantify the solute composition of other types of solutions, and potentially becomes a powerful tool of solute analysis of fluid inclusions.
Author Contributions
H.C. and G.C. designed the project; H.C. performed the analyses, data collection, and data analysis; H.C. wrote and organized the paper, with a careful discussion and revision by G.C. and C.X. All authors have read and agreed to the published version of the manuscript.
Funding
This study was funded by National Natural Science Foundation of China (41702094).
Acknowledgments
We thank Huang Liangliang from Institute of Geology and Geophysics, Chinese Academy of Sciences, and Ding Xin and Miao Peng from Horiba Scientific Company (Beijing) for providing Raman instrument and technical support. Constructive review by three anonymous reviewers has improved the paper.
Conflicts of Interest
The authors declare that they have no known competing financial interests or personal relationships that could have appeared to influence the work reported in this paper.
References
- Roedder, E. Fluid inclusions. Rev. Mineral. 1984, 12, 644. [Google Scholar]
- Roedder, E.; Bodnar, R.J. Fluid inclusion studies of hydrothermal deposits. In Geochemistry of Hydrothermal Ore Deposits, 3rd ed.; Barnes, H.L., Ed.; John Wiley & Sons: New York, NY, USA, 1997; pp. 657–698. [Google Scholar]
- Frezzotti, M.L.; Tecce, F.; Casagli, A. Raman spectroscopy for fluid inclusion analysis. J. Geochem. Explor. 2012, 112, 1–20. [Google Scholar] [CrossRef]
- Franks, F. Water, a Comprehensive Treatise. In Water in Crystalline Hydrates Aqueous Solutions of Simple Noneletrolytes; Plenum Press: New York, NY, USA, 1973; Volume 2, p. 661. [Google Scholar]
- Dubessy, J.; Audeoud, D.; Wilkins, R.; Kosztolanyi, C. The use of the Raman microprobe Mole in the determination of the electrolytes dissolved in the aqueous phase of fluid inclusions. Chem. Geol. 1982, 37, 137–150. [Google Scholar] [CrossRef]
- Dubessy, J.; Boiron, M.C.; Moissette, A.; Monnin, C.; Stretenskaya, N. Determination of water, hydrates and pH in fluid inclusions by micro-Raman spectrometry. Eur. J. Mineral. 1992, 4, 885–894. [Google Scholar] [CrossRef] [Green Version]
- Bakker, R.J. Raman spectra of fluid and crystal mixtures in the system H2O, H2O-NaCl and H2O-MgCl2 at low temperatures: Applications to fluid inclusion research. Can. Mineral. 2004, 42, 1283–1314. [Google Scholar] [CrossRef]
- Ni, P.; Ding, J.; Rao, B. In situ cryogenic Raman spectroscopic studies on the synthetic fluid inclusions in the systems H2O and NaCl-H2O. Chin. Sci. Bull. 2006, 51, 108–114. [Google Scholar] [CrossRef]
- Crawford, M.L. Phase equilibria in aqueous fluid inclusions. Fluid Incl. Appl. Petrol. 1981, 6, 75–100. [Google Scholar]
- Bodnar, R.J. Introduction to aqueous-electrolyte fluid inclusions. Fluid Incl. Anal. Interpret. 2003, 32, 81–100. [Google Scholar]
- Samson, I.M.; Walker, R.T. Cryogenic Raman spectroscopic studies in the system NaCl-CaCl2-H2O and implications for low-temperature phase behavior in aqueous fluid inclusions. Can. Mineral. 2000, 38, 35–43. [Google Scholar] [CrossRef] [Green Version]
- Ni, P.; Ding, J.; Dubessy, J.; Zhang, T. Application of in situ cryogenic Raman spectroscopy to analyze synthetic fluid inclusions in the systems CaCl2-H2O and MgCl2-H2O II: Phase transformation behaviour at lower temperatures. Acta Petrol. Sin. 2008, 24, 1968–1974. [Google Scholar]
- Ding, J.; Ni, P.; Dubessy, J.; Zhang, T. Application of in situ cryogenic Raman spectroscopy to analyze synthetic fluid inclusions in the systems CaCl2-H2O and MgCl2-H2O I: Cryogenic Raman spetra. Acta Petrol. Sin. 2008, 24, 1961–1967. [Google Scholar]
- Baumgartner, M.; Bakker, R.J. CaCl2-hydrate nucleation in synthetic fluid inclusions. Chem. Geol. 2009, 265, 335–344. [Google Scholar] [CrossRef]
- Baumgartner, M.; Bakker, R.J. Raman spectra of ice and salt hydrates in synthetic fluid inclusions. Chem. Geol. 2010, 275, 58–66. [Google Scholar] [CrossRef]
- Dubessy, J.; L’Homme, T.; Boiron, M.C.; Rull, F. Determination of chlorinity in aqueous fluids using Raman spectroscopy of the stretching band of water at room temperature: Application to fluid inclusions. Appl. Spectrosc. 2002, 56, 99–106. [Google Scholar] [CrossRef]
- Chi, G.; Chu, H.; Scott, R.; Chou, I.-M. A new method for determining fluid compositions in the H2O-NaCl-CaCl2 system with cryogenic Raman spectroscopy. Acta Geol. Sin. 2014, 88, 1169–1182. [Google Scholar] [CrossRef]
- Chu, H.; Chi, G. Determining fluid composition in the H2O-NaCl-CaCl2 system with cryogenic Raman spectroscopy: Application to natural fluid inclusions. Acta Geol. Sin. 2015, 89, 894–901. [Google Scholar]
- Chu, H.; Chi, G.; Chou, I.-M. Freezing and melting behaviors of H2O-NaCl-CaCl2 solutions in fused silica capillaries and glass-sandwiched films: Implications for fluid inclusion studies. Geofluids 2016, 16, 518–532. [Google Scholar] [CrossRef] [Green Version]
- Chi, G.; Haid, T.; Quirt, D.; Fayek, M.; Blamey, N.; Chu, H. Petrography, fluid inclusion analysis and geochronology of the End uranium deposit, Kiggavik, Nunavut, Canada. Miner. Depos. 2017, 52, 211–232. [Google Scholar] [CrossRef]
- Gandhi, A.C.; Hung, H.; Shih, P.; Cheng, C.; Ma, Y.; Wu, S. In situ confocal Raman mapping study of a single Ti-assisted ZnO nanowire. Nanoscale Res. Lett. 2010, 5, 581–586. [Google Scholar] [CrossRef] [Green Version]
- Ilchenko, O.; Pilgun, Y.; Kutsyk, A.; Bachmann, F.; Slipets, R.; Todeschini, M.; Okeyo, P.O.; Poulsen, H.F.; Boisen, A. Fast and quantitative 2D and 3D orientation mapping using Raman microscopy. Nat. Commun. 2019, 10, 1–10. [Google Scholar] [CrossRef] [Green Version]
- Korsakov, A.V.; Dieing, T.; Golovin, A.V.; Toporski, J. Raman imaging of fluid inclusions in garnet from UHPM rocks (Kokchetav massif, Northern Kazakhstan). Spectrochim. Acta Part A 2011, 80, 88–95. [Google Scholar] [CrossRef] [PubMed]
- Heim, C.; Lausmaa, J.; Sjovall, P.; Toporski, J.; Dieing, T.; Simon, K.; Hansen, B.T.; Kronz, A.; Arp, G.; Reitner, J.; et al. Ancient microbial activity recorded in fracture fillings from granitic rocks (Aspo Hard Rock Laboratory, Sweden). Geobiology 2012, 10, 280–297. [Google Scholar] [CrossRef] [PubMed]
- Yesiltas, M.; Jaret, S.; Young, J.; Wright, S.P.; Glotch, T.D. Three-dimensional raman tomographic microspectroscopy: A novel imaging technique. Earth Space Sci. 2018, 5, 380–392. [Google Scholar] [CrossRef]
- Kann, B.; Windbergs, M. Chemical imaging of drug delivery systems with structured surfaces–a combined analytical approach of confocal Raman microscopy and optical profilometry. AAPS J. 2013, 15, 505–510. [Google Scholar] [CrossRef] [PubMed] [Green Version]
- Everall, N. Optimising image quality in 2D and 3D confocal Raman mapping. J. Raman Spectrosc. 2014, 45, 133–138. [Google Scholar] [CrossRef]
- Steele-MacInnis, M.; Bodnar, R.J.; Naden, J. Numerical mode to determine the composition of H2O-NaCl-CaCl2 fluid inclusions based on microthermometric and microanalytical data. Geochim. Cosmochim. Acta 2011, 75, 21–40. [Google Scholar] [CrossRef] [Green Version]
- Chi, G.; Ni, P. Equations for calculation of NaCl/(NaCl + CaCl2) ratios and salinities from hydrohalite-melting and ice-melting temperatures in the H2O-NaCl-CaCl2 system. Acta Petrol. Sin. 2007, 23, 33–37. [Google Scholar]
- Chou, I.-M.; Song, Y.; Burruss, R.C. A new method for synthesizing fluid inclusions in fused silica capillary containing organic and inorganic material. Geochim. Cosmochim. Acta 2008, 72, 5217–5231. [Google Scholar] [CrossRef]
- HORIBA Jobin Yvon S.A.S. (HORIBA Scientific Company). What Is Confocal Raman Microscopy? Available online: https://www.horiba.com/cn-/scientific/products/raman-spectroscopy/raman-academy/raman-faqs/ (accessed on 16 October 2020).
- Haynes, F.M. Determination of fluid inclusion composition by sequential freezing. Econ. Geol. 1985, 80, 1436–1439. [Google Scholar] [CrossRef]
Figure 1.
Microscopic image of frozen solution of a capillary sample with a squeezed bubble at −185 °C, showing scanning area (the green rectangle) with 2800 shooting points (green dots).
Figure 1.
Microscopic image of frozen solution of a capillary sample with a squeezed bubble at −185 °C, showing scanning area (the green rectangle) with 2800 shooting points (green dots).

Figure 2.
(A) Peaks of hydrates and ice between 3000–3800 cm−1; (B) Raman spectra of 2800 points with representative peaks of hydrates and ice (3090 cm−1 for ice, 3385 cm−1 for antarcticite, and 3537 cm−1 for hydrohalite, respectively); (C) Curve fitting and peak intensities of a spectrum at point S1; note that the representative peak of antarcticite is absent as indicated by the intensity value (0.223157 counts) of peak 3385 cm−1. Blue lines stand for the original spectrum, pink lines stand for the spectrum after curve-fitting, and brown lines stand for individual peaks contributing to the total spectrum; (D) Curve fitting and peak intensities of a spectrum at point S2; note that the representative peak of antarcticite is present as indicated by the intensity value (17.0342 counts) of peak 3385 cm−1. The meaning of the lines is the same as those in Picture C; (E–G) Distribution maps of ice, antarcticite, and hydrohalite. Black represents absence of the solid phase, and color (graded color for ice, green for antarcticite, and red for hydrohalite) represents presence of the solid phase. Note, more than one solid phase may be detected at any given analytical points (e.g., S1 and S2).

Figure 3.
Cryogenic 2D Raman mapping (2800 points) of synthetic samples (capillary sample #1–9 and #11, and sandwiched sample #10). (A1–A11) Representative Raman spectra of each sample, showing NaCl molar fraction of the solution; (B1–B11) Distribution of ice; (C1–C11) Distribution of antarcticite; (D1–D11) Distribution of hydrohalite. Black represents absence of the solid phase, and color (graded color for ice, green for antarcticite, and red for hydrohalite) represents presence of the solid phase.

Figure 4.
Correlation between X(NaCl, m) of the actual solutions and NaCl·2H2O area fraction values estimated from cryogenic 2D Raman mapping. Blue dots stand for capillary samples (#1–9 and #11), and a red dot represents sandwiched sample (#10).
Figure 4.
Correlation between X(NaCl, m) of the actual solutions and NaCl·2H2O area fraction values estimated from cryogenic 2D Raman mapping. Blue dots stand for capillary samples (#1–9 and #11), and a red dot represents sandwiched sample (#10).


Table 1.
Compositions of H2O-NaCl-CaCl2 solutions used in this study.
| Sample No. | Salinity (wt. %) | X(NaCl, m) | X(NaCl, wt) | Tmhh-predicted (°C) |
|---|---|---|---|---|
| #1 | 15 | 1 | 1.00 | −21.2 |
| #2 | 15 | 0.9 | 0.83 | −22.7 |
| #3 | 15 | 0.8 | 0.68 | −24.2 |
| #4 | 15 | 0.7 | 0.56 | −25.7 |
| #5 | 15 | 0.6 | 0.44 | −27.8 |
| #6 | 15 | 0.5 | 0.35 | −29.8 |
| #7 | 15 | 0.4 | 0.26 | −32.8 |
| #8 | 15 | 0.3 | 0.18 | −36.5 |
| #9 | 15 | 0.2 | 0.12 | −41.0 |
| #10 | 15 | 0.1 | 0.06 | −52.0 |
| #11 | 15 | 0 | 0.00 | −50.0 |
X(NaCl, m) = m(NaCl)/[m(NaCl) + m(CaCl2)], where m is molarity; X(NaCl, wt) = wt(NaCl)/[wt(NaCl) + wt(CaCl2)], where wt is weight; Tmhh-predicted—Predicted hydrohalite-melting temperature calculatedwith the equation from Chi and Ni (2007) [29].
Table 2.
Correlation of NaCl·2H2O area fractions to actual X(NaCl, m) values
| Sample NO. | X(NaCl, m) | NaCl·2H2O Area (%) | CaCl2·6H2O Area(%) | NaCl·2H2O Area Fraction |
|---|---|---|---|---|
| #1 | 1 | 87.4 | 0 | 1 |
| #2 | 0.9 | 94.2 | 35.3 | 0.73 |
| #3 | 0.8 | 36.9 | 15.9 | 0.70 |
| #4 | 0.7 | 95.3 | 43.7 | 0.69 |
| #5 | 0.6 | 88.7 | 58.6 | 0.60 |
| #6 | 0.5 | 66.1 | 20.4 | 0.76 |
| #7 | 0.4 | 51.1 | 50.9 | 0.50 |
| #8 | 0.3 | 28.3 | 63.5 | 0.31 |
| #9 | 0.2 | 15.0 | 53.9 | 0.22 |
| #10 | 0.1 | 7.1 | 39.6 | 0.15 |
| #11 | 0 | 0 | 33.9 | 0 |
X(NaCl, m) = m(NaCl)/[m(NaCl) + m(CaCl2)], where m is molarity; Area (%) — calculated using the software Image J; NaCl·2H2O Area Fraction = NaCl·2H2O Area /(NaCl·2H2O Area + CaCl2·6H2O Area).
Publisher’s Note: MDPI stays neutral with regard to jurisdictional claims in published maps and institutional affiliations. |
© 2020 by the authors. Licensee MDPI, Basel, Switzerland. This article is an open access article distributed under the terms and conditions of the Creative Commons Attribution (CC BY) license (http://creativecommons.org/licenses/by/4.0/).
Share and Cite
MDPI and ACS Style
Chu, H.; Chi, G.; Xue, C. Quantification of Solute Composition in H2O-NaCl-CaCl2 Solutions Using Cryogenic 2D Raman Mapping. Minerals 2020, 10, 1043. https://doi.org/10.3390/min10111043
AMA Style
Chu H, Chi G, Xue C. Quantification of Solute Composition in H2O-NaCl-CaCl2 Solutions Using Cryogenic 2D Raman Mapping. Minerals. 2020; 10(11):1043. https://doi.org/10.3390/min10111043
Chicago/Turabian StyleChu, Haixia, Guoxiang Chi, and Chunji Xue. 2020. "Quantification of Solute Composition in H2O-NaCl-CaCl2 Solutions Using Cryogenic 2D Raman Mapping" Minerals 10, no. 11: 1043. https://doi.org/10.3390/min10111043
Note that from the first issue of 2016, this journal uses article numbers instead of page numbers. See further details here.