Article

Influence of Nitrogen Management Regimes on Milling Recovery and Grain Quality of Aromatic Rice in Different Rice Production Systems

1
Department of Agronomy, University of Agriculture, Faisalabad 38040, Pakistan
2
Department of Botany, University of Agriculture, Faisalabad 38040, Pakistan
3
Department of Botany, Division of Science and Technology, University of Education, Lahore 54770, Punjab, Pakistan
4
Botany and Microbiology Department, College of Science, King Saud University, Riyadh l1451, Saudi Arabia
5
Department of Botany, S.P. College, Maulana Azad Road, Srinagar, Jammu and Kashmir, Pune 190001, India
*
Authors to whom correspondence should be addressed.
Agronomy 2020, 10(11), 1841; https://doi.org/10.3390/agronomy10111841
Submission received: 7 October 2020 / Revised: 10 November 2020 / Accepted: 19 November 2020 / Published: 23 November 2020
(This article belongs to the Special Issue Cereal Biofortification: Strategies, Challenges and Benefits)

Abstract

:
To examine the effect of nitrogen (N) management regimes on rice quality in different rice production systems, a field experiment was conducted in 2017 and 2018. The experimental treatments comprised of two production systems (transplanted rice: TPR and dry direct-seeded rice: DDSR) and six N management treatments (0, 50, 100, and 150 kg N ha−1 as basal, and 100 and 150 kg N ha−1 in three splits which were regarded as N1, N2, N3, N4, N5, and N6, respectively). The results revealed that the rice quality attributes, i.e., broken rice recovery, abortive kernel, bursting, and curling were increased by 8%, 14%, 8%, and 14%, respectively, under DDSR than TPR. In the case of N management, split application of N reduced the chalky kernel (44%), abortive kernel (23%), opaque kernel (31%), bursting (24%), and curling (31%), while kernel protein contents, water absorption ratio, cooked grain length, and elongation ratio were increased by 41%, 88%, 25%, and 26%, respectively, as compared to the basal application of N. In short, DDSR cultivation reduced the appearance and cooking quality traits but white head rice recovery and nutritional quality were comparable to TPR. However, N application in splits either in DDSR or in TPR potentially improved the grain quality of rice compared with the basal application.

1. Introduction

Rice (Oryza sativa L.) is a major staple crop fulfilling the daily caloric requirements of more than 3.5 billion people around the globe [1]. However, due to an emphasis on ensuring global food security, most studies focus on increasing grain yield and less so on improving grain quality [2]. Rice grain quality characteristics play an imperative role in dictating its market value and also have a strong influence on consumer attraction [3]. Under improving economic development and living standards, more consumers prefer high-quality produce [4]. Thus, improving rice quantity is not important to increase farmer profitability, but also to ensure consumer satisfaction [5].
Milling recovery, nutritional, cooking and eating, and appearance characteristics are four main aspects to evaluate the rice grain quality [6]. Values for each aspect of grain quality vary from region to region due to the difference in culture and eating habits [7]. Previous studies highlighted that grain quality is genetically controlled [5], for example, Zhao et al. [8] reported that the GS9 gene controls the appearance quality and grain shape, while the Wx gene governs the cooking and eating quality of rice [9]. Nevertheless, genetic background governs the rice grain quality, crop management practices, climatic conditions, and soil characteristics are also important factors that influence rice grain quality [2,10]. Among crop management practices, production systems, water management, and Nitrogen (N) management are key factors influencing rice grain quality [2].
Given the increasing cost of production, water scarcity, and labor unavailability, an increasing number of growers are shifting their rice production systems from conventional transplanted rice (TPR) to direct-seeded rice (DSR) [11,12]. However, how this change in production systems may influence rice grain quality is not yet understood. This shift in the rice production system influences the nutrients availability and their transformation along with soil moisture contents that vary the crop performance and nutrient use efficiency, specifically N use efficiency [13]. Furthermore, availability and losses of N trail unlike pathway under DSR and TPR [14] as ammonium is the dominant available form of N in TPR, while nitrate in DSR [15]. Mahajan et al. [16] highlighted that the N management pattern for TPR is not suitable for DSR because in TPR basal application of N is more common along with continuous flooding [17,18], while in DSR, anaerobic and aerobic cycles are practiced to reduce the total water inputs [19], so N management may vary. In DSR, the application of a higher basal dose augmented the N losses via leaching, surface runoff, and nitrification [15,20,21]. Similarly, Sommer et al. [22] revealed that the unjudicial use of N in TPR resulted in N losses via volatilization and denitrification. Losses of N from the rice system not only hampered the NUE but also resulted in acidification, eutrophication, and environmental pollution [23,24,25].
Previous research indicated that the cultivation of DSR increased rice grain quality by reducing the accumulation of heavy metals like mercury and arsenic in grains [12]. Furthermore, the N application also substantially influences rice quality [2]. Increasing the N rate reduces chalky kernel percentage [4] and kernel amylose content, and significantly increases milling recovery, protein content, and water absorption ratio [26,27]. Rehman et al. [28] suggested that the strategy of split application of N resulted in maximizing N uptake that ultimately increased the harvest index while reducing the N losses. Perez et al. [29], Wopereis-Pura et al. [30], and Dou et al. [4] have also highlighted that split application of N increases milling recovery, appearance, and nutritional quality, respectively. Furthermore, Wopereis-Pura et al. [30] reported that in the split application of N, an additional dose of N, i.e., 30 kg ha−1 at a later growth stage not only increased the yield but also improved milling recovery and grain quality of rice.
Although, DSR is the best alternative to TPR, however, this shift in the production system may affect grain quality characters of aromatic rice [31]. Similarly, how the N application pattern influences the grain quality of TPR and DSR in a comparative study is yet to unveil. Therefore, in this study, on-farm field experiments were conducted to explore the effect of different production systems and N management patterns on rice grain milling recovery, appearance, cooking, and nutritional value of aromatic rice. This study would also provide an insight to comprehend the influence of N management pattern on grain quality of DSR that is a promising alternative to TPR. Therefore, we hypothesized that the split application of N can improve the rice grain milling recovery, appearance, cooking, and nutritional traits of DSR as well as of TPR.

2. Materials and Methods

2.1. Experimental Details

Two years field experiment was conducted in 2017 and 2018 at the Student Research Farm, Department of Agronomy, University of Agriculture, Faisalabad, Punjab Province, Pakistan (31.25° N, 73.06° E and 184.4 m altitude) on a medium alkaline, non-saline, sandy clay loam soil (Lyallpur series). The experimental soil had an average low organic matter (1.6 g kg−1), low bulk density (1.5 g cm−3), medium alkaline soil pH (7.7), total N (0.045 g kg−1), available P (13.5 mg kg−1), exchangeable K (168.25 mg kg−1), and deficient zinc (1.77 mg kg−1). The seed of the cultivar “Chenab basmati-2016” was obtained from Rice Research Institute, Kala Shah Kaku, Lahore.
A randomized complete block design (RCBD) with a split-plot arrangement was used to evaluate the influence of N management pattern and production systems on rice milling and grain quality in the semiarid to the tropical climate of Punjab, Pakistan. The weather data of the experimental location during the crop duration is represented in Table 1. Thrice replicated experimental treatments were comprised of two production systems, i.e., dry direct-seeded rice (DDSR) and transplanted rice (TPR) that were randomized in main plots and six N treatments: N1 = 0 kg N ha−1, N2 = 50 kg N ha−1 as basal, N3 = 100 kg N ha−1 as basal, N4 = 150 kg N ha−1 as basal, N5 = 100 kg N ha−1 in three splits, and N6 = 150 kg N ha−1 in three splits were allocated and randomized in sub-plots. Rice seeds were treated with fungicides (Topsin M®) before sowing and then the treated seeds were sown on a well-prepared seedbed (to accomplish DDSR sowing) and nursery plots (for TPR) on 7th and 27th June of 2017 and 2018, respectively. Rice seedlings (30–35 days old) were transplanted on 11th and 27th July of 2017 and 2018 as indicated in Table S1. Two seedlings per hill were transplanted at a spacing of 22.5 × 22.5 cm in the experimental units of size 24 m2 (8 m long, 3 m wide, 13 rows), while DDSR has sown in 22.5 cm apart rows. Productive tiller density was significantly higher (26%) in DDSR treatment as compared to TPR as indicated in the first part of this study [32].
Urea, single superphosphate (SSP), and murate of potash (MOP) were broadcasted as N, P, and K sources, respectively. The complete dose of P, K, and the basal dose of N fertilizers were applied before sowing and transplanting of DDSR and TPR treatments, respectively. In split application treatments, N fertilizer was applied as 40% basal (before sowing DDSR and transplanting TPR), 30% top-dressed at effective tillering stage (30 days after sowing DDSR and 20 days after transplanting TPR), and the remaining 30% was applied at panicle initiation (PI) stage. Similarly, zinc sulfate, as a source of Zn, was top-dressed at the effective tillering stage of both systems. To prevent fertilizer contamination between adjacent experimental units, each experimental unit was irrigated separately and between each experimental unit double bund of 1.5 m width and 30 cm height was formed and compacted as a buffer zone.
Dry direct-seeded and TPR crop was irrigated according to alternate wetting and drying technique as reported by Ishfaq et al. [11] while weeds were controlled by using stale seedbed technique along with pre-emergence (Oxadiargyl®) and post-emergence (ethoxysulfuron-methyl®) herbicides application. Insects and diseases were managed by following the guidelines of Bayer crop science, Pakistan as detailed by Ishfaq et al. [11]. Rice crop was harvested manually and left in the field to dry. When paddy moisture content was dropped to 14%, the crop was threshed manually.

2.2. Sampling and Measurement

2.2.1. Milling Recoveries

Clean and dried paddy samples (2 kg) of each experimental unit were stored at ambient temperature (25 °C). Paddy (500 g) from each sample was dehusked using a husker machine (SATAKE, Type THU 35B). The Brown-rice (BR) percentage of a milled-rice sample was calculated on a weight basis. Rice length grader (STAKE Type TRG 05B, Japan) was used to obtain the brown head rice (BHR) and brown broken rice (BBR). Brown head rice was defined as kernels with three-quarters or longer of their original length. Both BBR and BHR samples were passes through rice polisher (STAKE Type TMO 5C) to get the white rice (WR), whereas rice grader (WESORT) was used to get the percentage of white head rice (WHR) and white broken rice (WBR).

2.2.2. Kernel Appearance Quality Traits

Kernel’s appearance quality traits (opaqueness, abortive, and normal kernel) were determined according to the procedure detailed by Akbar et al. [33]. Kernel length and width of 50 normal kernels were measured using a digital Vernier caliper (0–150 mm) and to determine the kernel length to width ratio. The percentage of chalky kernels was calculated by positioning 50 dehulled rice kernels on a transparent glass plate in front of a light bulb and separating them from normal kernels

2.2.3. Kernel Nutritional Value

Kernel protein contents were measured by multiplying kernel N content with a correction factor of 5.95 as per the criteria of AOAC [34]. The Micro-Kjeldhal method was used to measure N contents in rice kernels.

2.2.4. Cooking Quality

Kernel amylose contents were determined following a modified procedure of Juliano et al. [35]. Kernel water absorption ratio was measured by using the following formula.
Kernel   water   absorption   ratio = Weight   of   cooked   rice Weight   of   raw   rice
The bursting and curling percentage of rice kernel upon cooking was measured by counting the burst and curled kernel after cooking. The cooked grain length of 20 cooked kernels was measured by using a micro-scale (stainless steel ruler with mm) and the average cooked grain length was compared to uncooked kernel length. The elongation ratio was calculated by dividing the length of cooked kernels by the length of uncooked kernels which was measured before cooking.

2.3. Statistical Analysis

Fisher’s analysis of variance (ANOVA) was performed using statistics 10, a computer program (student version) on randomized complete block design with the split-plot arrangement, while treatment means were separated at p ≤ 0.05 using Tukey’s (HSD) test [36]. Data for each year were analyzed separately. All figures were created with sigma plot software (10.0) and bar graphs are indicating the treatment means and standard error bars.

3. Results

3.1. Milling Recovery Traits

Percentage of milling recovery traits, i.e., BR, BHR, BBR, WHR, and WBR, were substantially affected by both production systems and N management pattern, except BBR in 2018 and WBR in 2017 were not influenced by PS. However, the interactive effect of production systems and N management patterns did not influence any milling recovery trait across the year (Table 2). It was recorded that percentage of BR, BHR, and WHR was significantly reduced by 0.6%, 3%, and 4%, respectively, in DDSR as compared to TPR, while the percentage of BBR and WBR remained the highest, i.e., 6% and 10% higher, respectively, in DDSR as compared to TPR. However, the percentage of WR in DDSR was statistically comparable to TPR. Regarding the N management pattern, the application of N increased the milling recoveries as compared to control treatment. Similarly, increasing N rate either in basal treatments (N2-N4) or in split application treatments (N5 and N6) increased all milling recoveries. However, the split application of N gave the highest percentage of BR, BHR, WR, and WHR, while it reduced the BBR and WBR recoveries (Table 2). Moreover, the N5 treatment gave the highest recovery of BR, BHR, WR, and WHR across the years and increased by 5%, 12%, 8%, and 19%, respectively, in comparison to the N3 treatment.

3.2. Appearance Quality Traits

The production system affected the percentage of the chalky kernel in 2017, kernel length, and kernel length to width ratio in 2018, and the percentage of abortive kernels in both years (Table 3). Similarly, N management patterns influence the percentage of chalky kernels, abortive kernels, and opaque kernels in both years of study, while kernel length and kernel width only in 2017 (Table 3). In the case of interaction, interactive effects of the production system and N management pattern only influenced the chalky kernels in 2017 and opaque kernels in 2018, while all other interactive effects were remained non-significant (Table 3). Results showed that the cultivation of DDSR either produced the statistically similar chalky kernels (the year 2018) and kernel length to width ratio (the year 2017) or a higher percentage of the chalky kernel (the year 2017) and kernel with lower length to width ratio (the year 2018). However, the percentage of opaque kernel and kernel width of DDSR was comparable to TPR in both years. By contrast, DDSR increased the percentage of the abortive kernel by 14% as compared to TPR (Table 3). Regarding the N management pattern, increasing N rate either in basal or in splits improved the all appearance quality traits of aromatic rice as compared to control treatment. However, on average the split application of N reduced the chalky kernel by 44% in N6 in N5 as compared to the basal application of N in N4 and N3. Similarly, the split application of N reduced the abortive kernels by 20% in N6 and by 27% in N5 as compared to the basal application of N in N4 and N3, respectively. Likewise, split application of N reduced the opaque kernels by 33% in N6 and by 29% in N5 as compared to the basal application of N in N4 and N3, respectively. By contrast, the split application of N increased the kernel length by 4% (in N6) and 6% (in N5) and kernel width by 2% (in N6) and 3% (in N5) as compared to the basal application of N in N4 and N3, respectively.

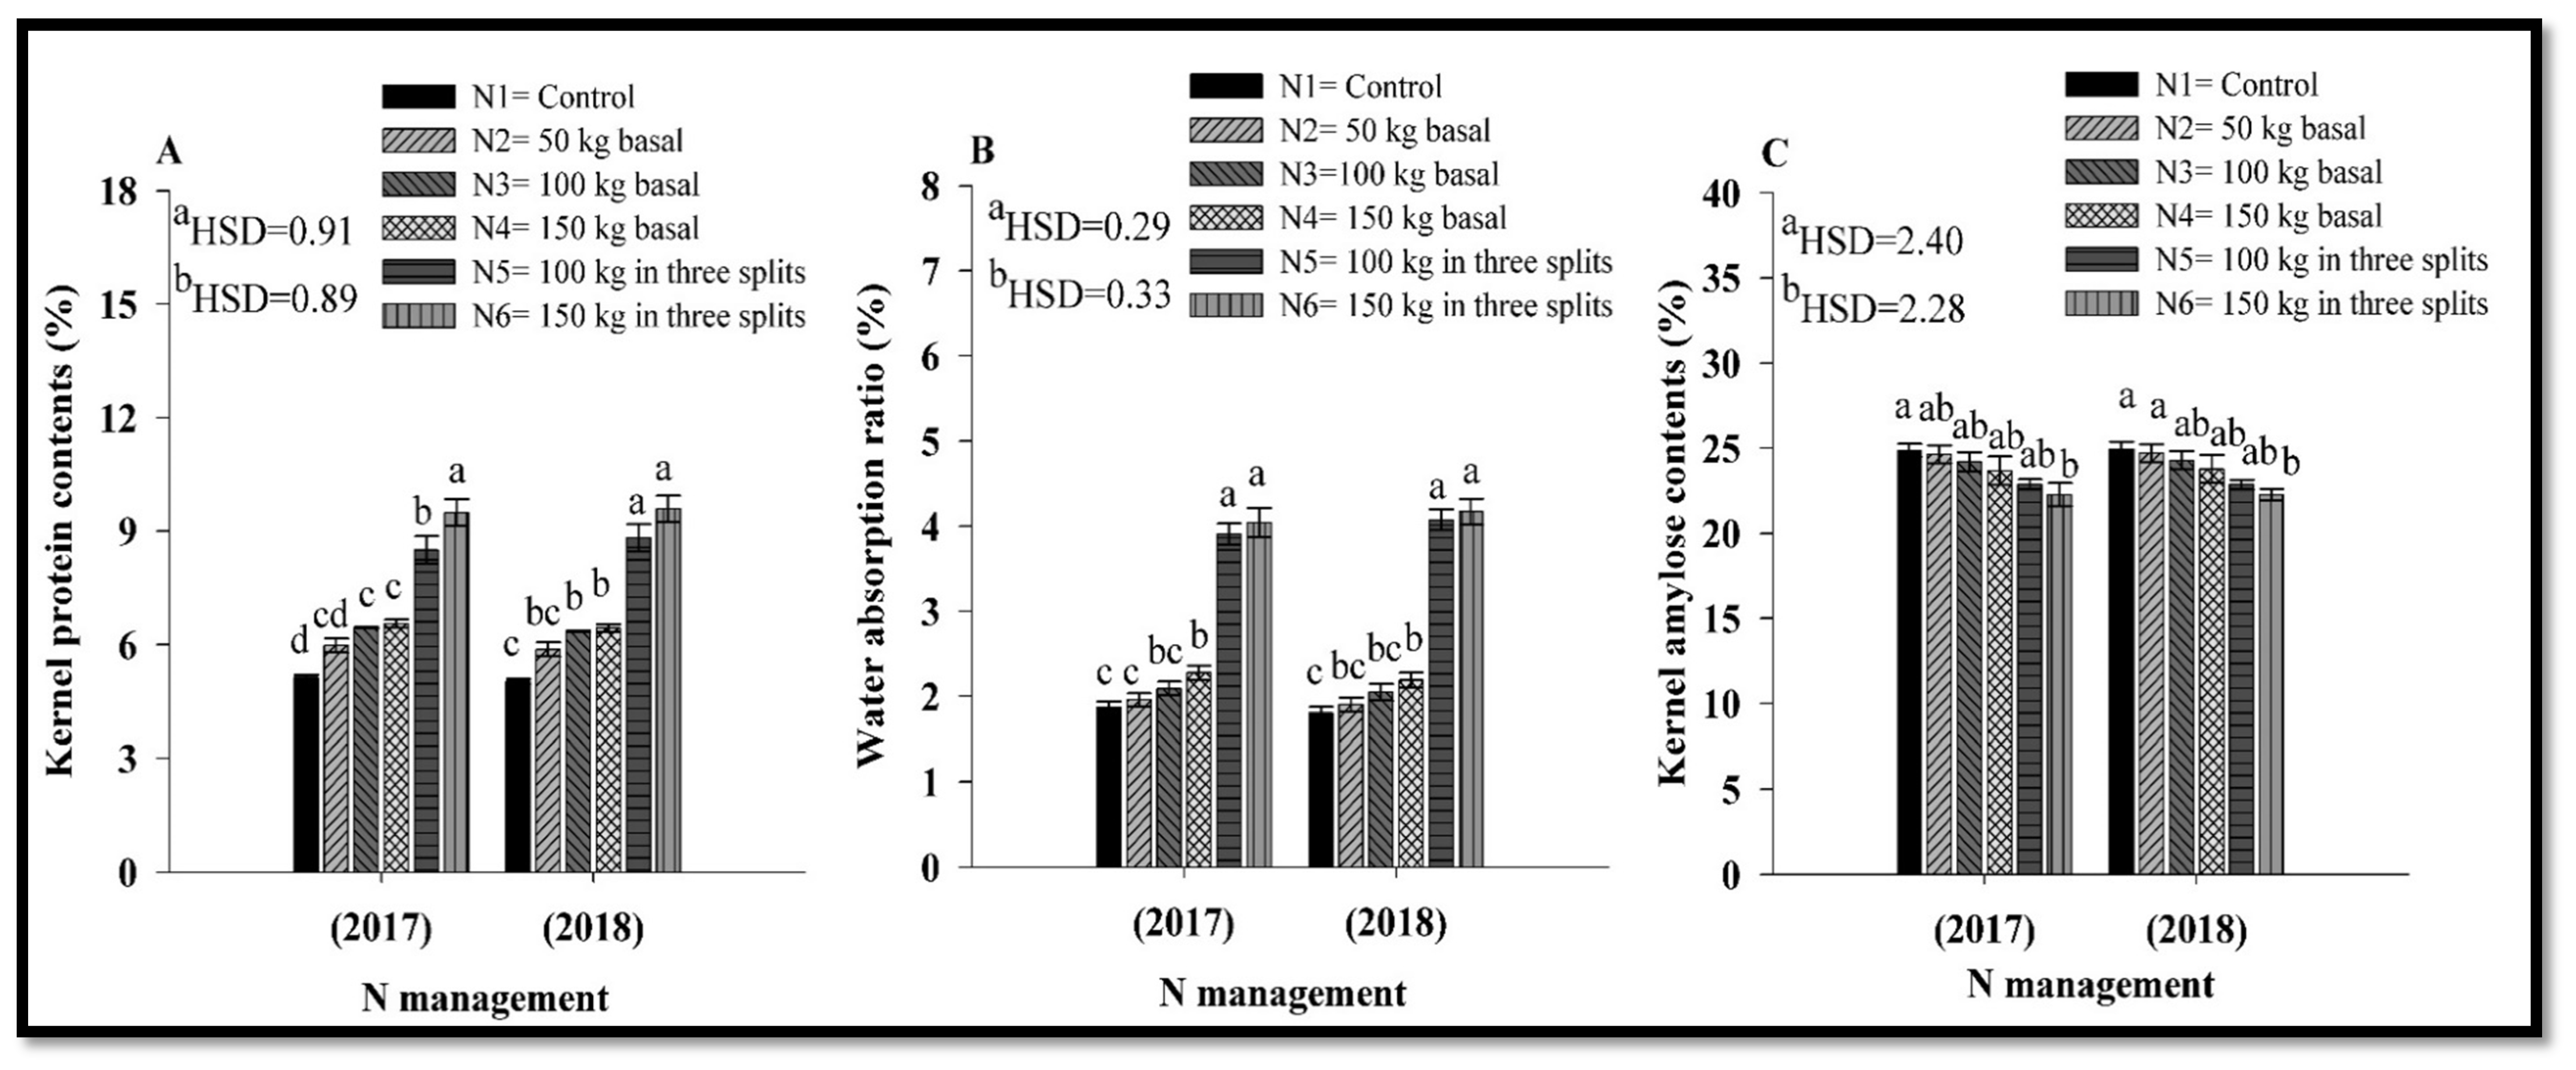
3.3. Kernel Protein Contents

The kernel protein content was substantially influenced by the N management pattern; however, the production system and interactive effect of the production system and N management pattern did not influence the protein contents significantly (Table S2). Moreover, the kernel protein content (%) increased with increasing N rate; however, the split application of N showed a pronounced increase in protein contents. On average, the split application of N increased kernel protein contents by 41% in comparison to the basal application of N (Figure 1A).

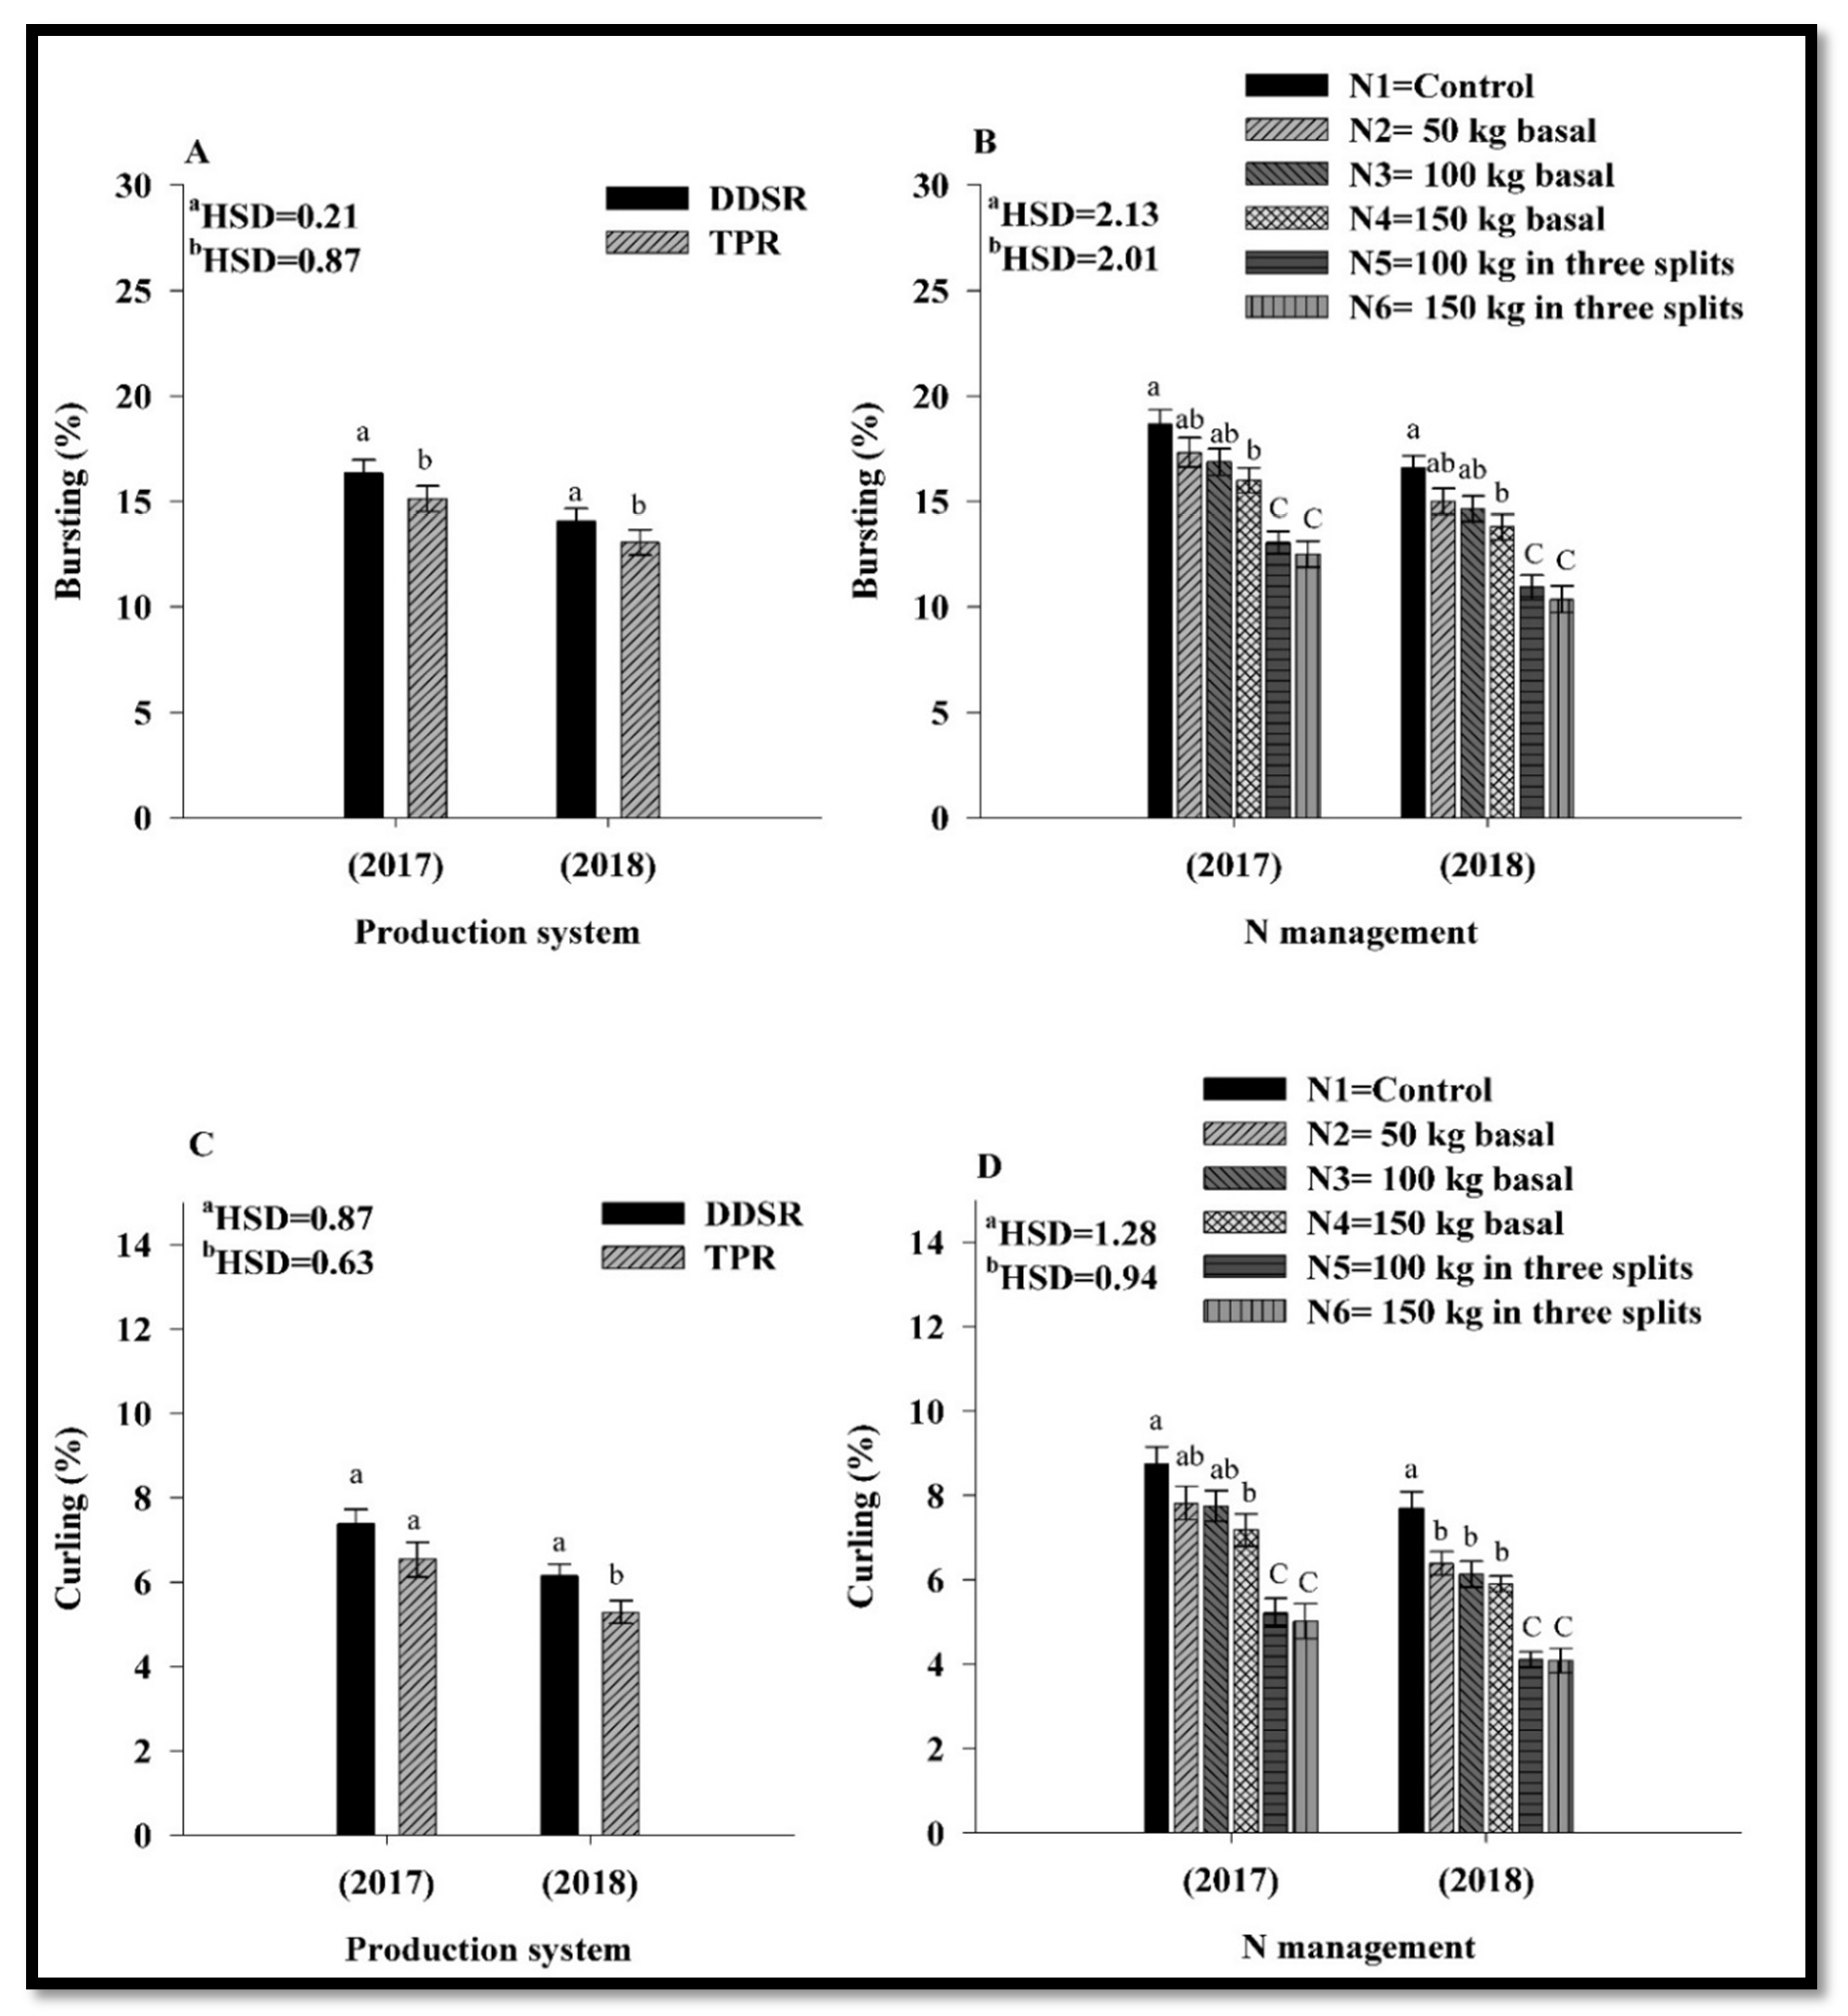
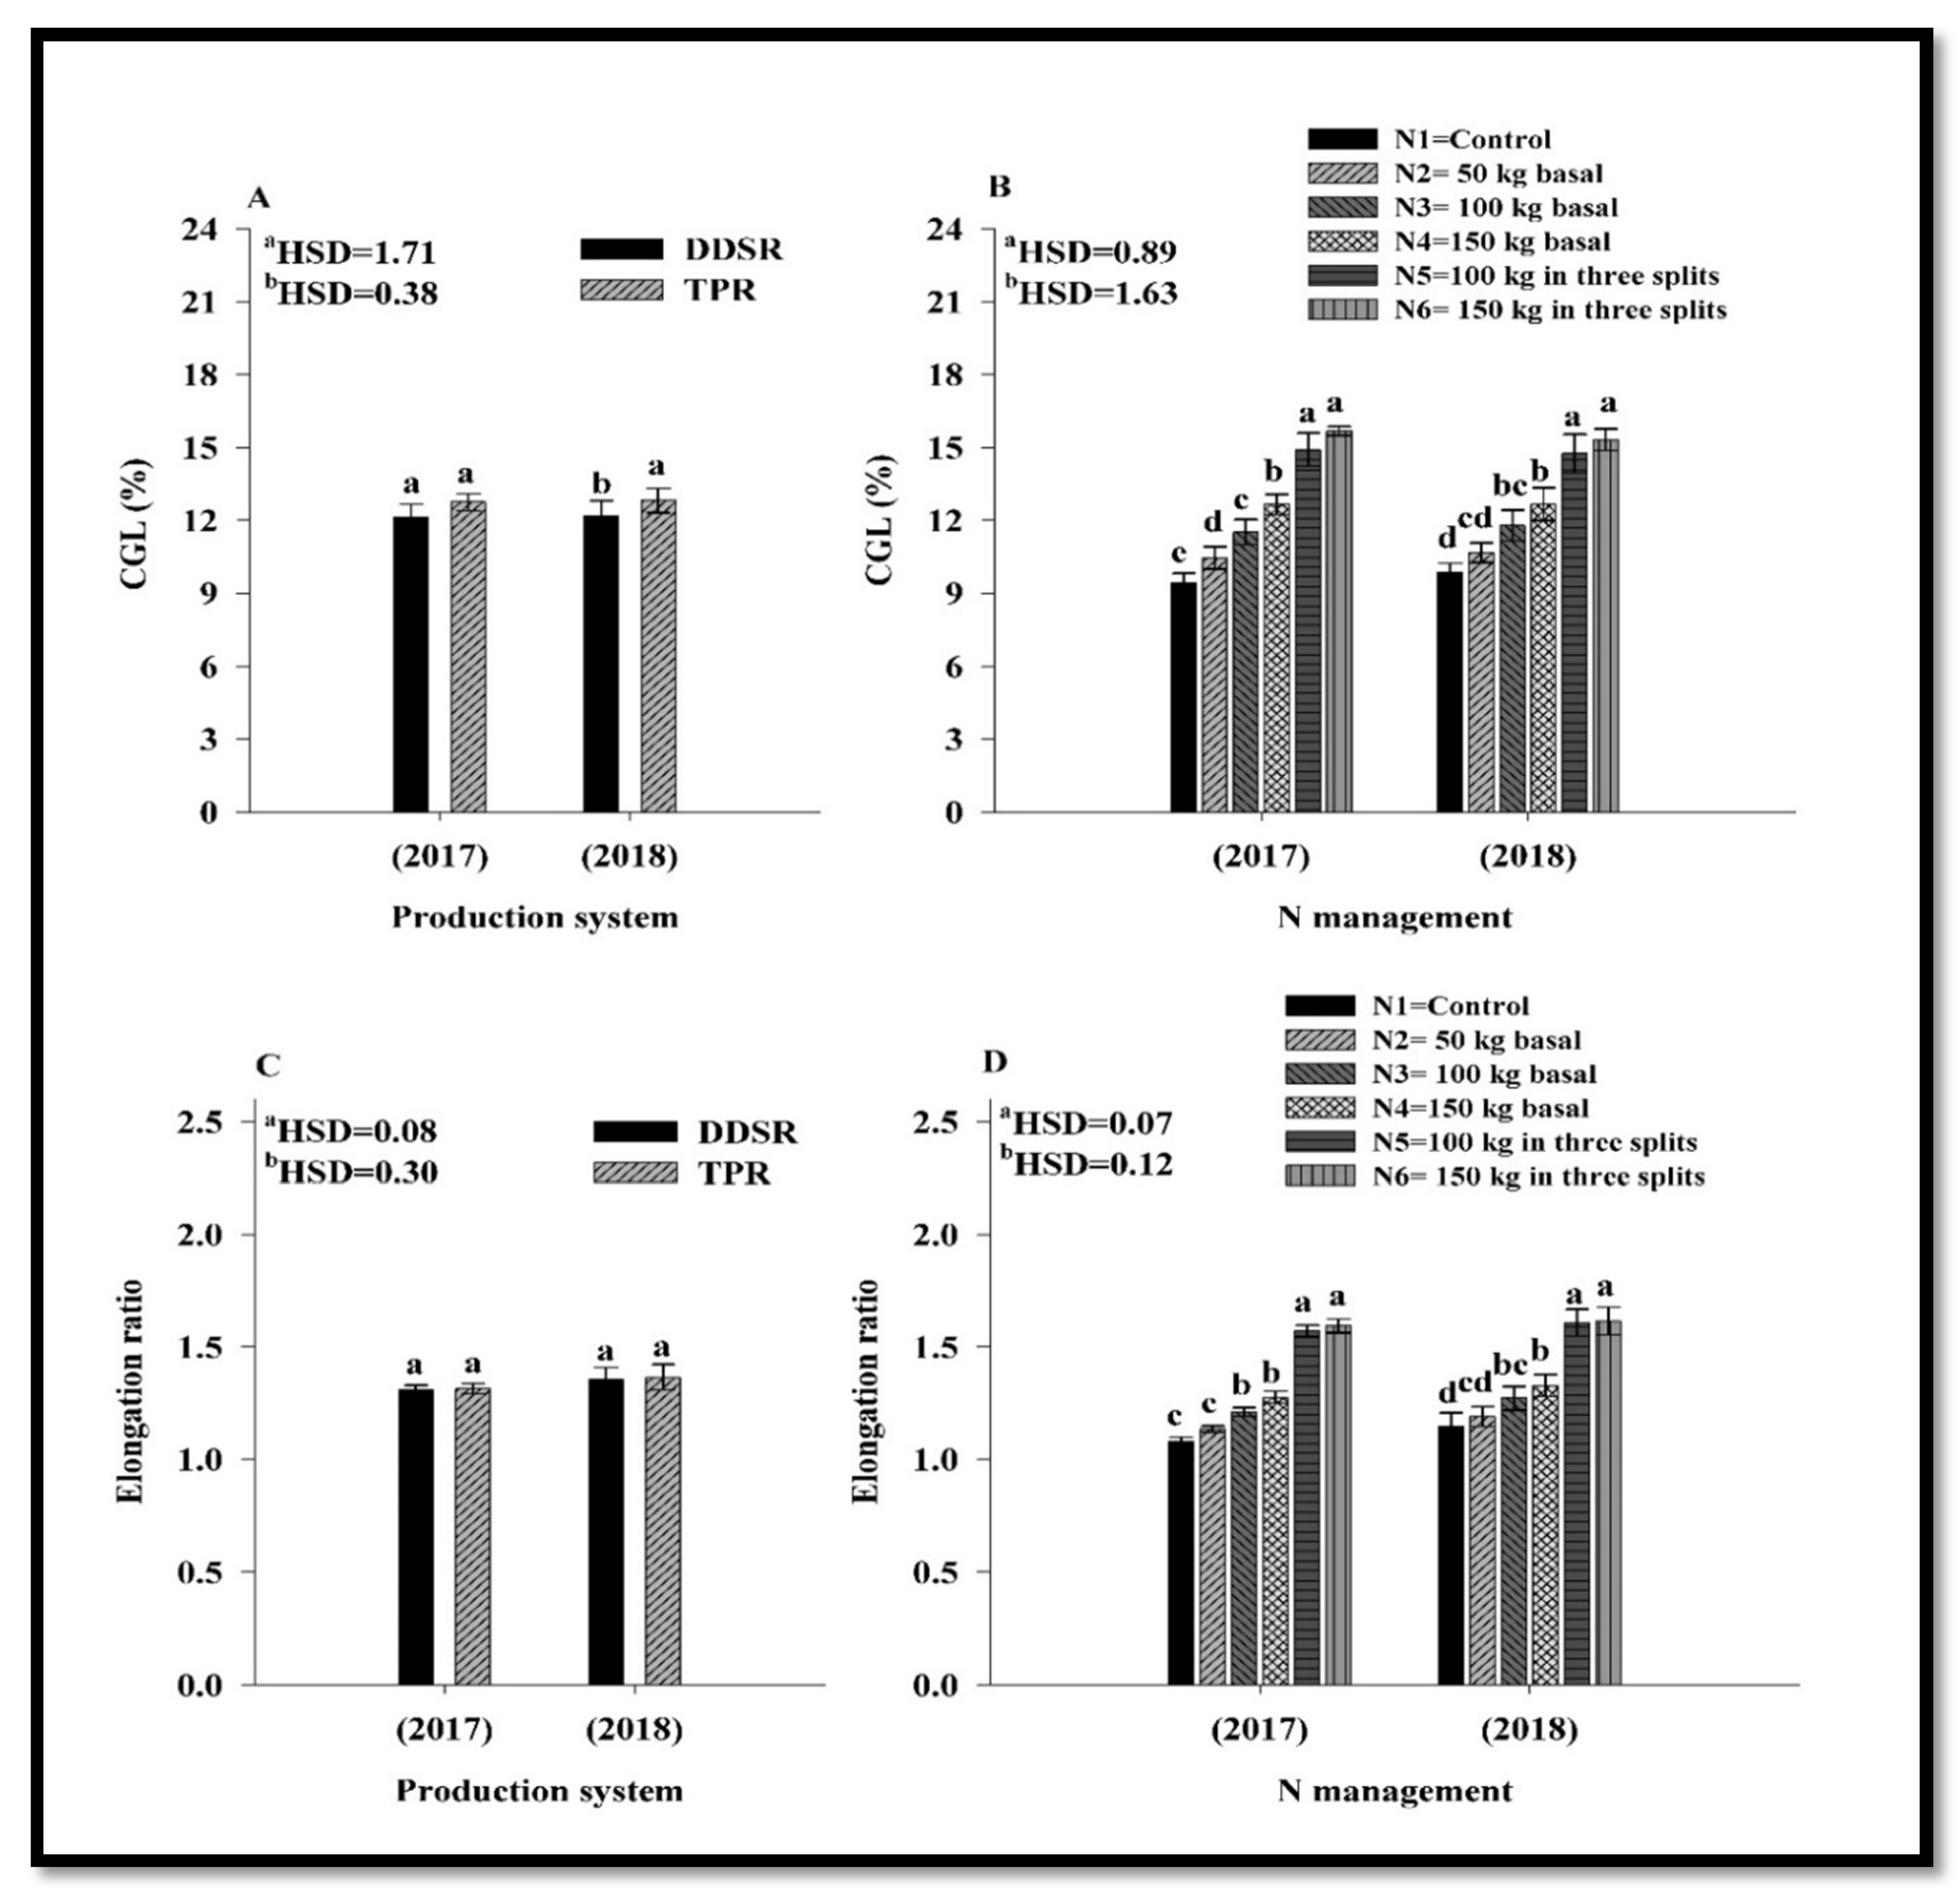
3.4. Cooking Quality

Among cooking quality traits, water absorption ratio, amylose contents, cooked grain length were not influenced by the production system; however, the production system influenced the bursting percentage in both years while curling percentage and elongation ratio were influenced only in 2018. Regarding N treatments, the cooking quality traits were influenced substantially in both years but the interactive effect of the production system and N treatments were found non-significant (Table S2). The water absorption ratio increased (Figure 1B), while kernel amylose contents decrease with increasing N rate either in basal treatments or in split application treatments (Figure 1C). Regardless of N rate, the split application of N increased the water absorption ratio by 88%, while decreased the kernel amylose contents by 6% as compared to basal N application.
Among cooking quality traits, DDSR cultivation increased the percentage of bursting (8%) and curling (14%) (Figure 2A,C). Regarding N management pattern, increasing N rate either in basal treatments (N2–N4) or in the split application of N (N5 and N6) decreased the percentage of bursting as well as curling and increased the cooked grain length and elongation ratio. Regardless of N rate, split application of N decreased the bursting percentage by 24% (Figure 2B) and curling percentage by 31% (Figure 2D). Contrarily, DDSR cultivation, reduced the cooked grain length (5%) as compared to TPR (Figure 3A,C). while cooked grain length and elongation ratio were increased by 25% (Figure 2B) and 26% (Figure 2D), respectively, in split application of N as compared to basal application of N.

4. Discussion

The findings of this study sustained the hypothesis that the split application of N can improve the rice grain milling recovery, appearance, cooking, and nutritional traits of DSR as well as TPR (Table 2 and Table 3; Figure 1, Figure 2 and Figure 3).

4.1. Milling Recoveries

The outcome of this study revealed that white rice recovery, water absorption ratio, kernel biochemical traits (protein contents and amylose contents), and elongation ratio were statistically similar in both systems. However, appearance and cooking quality traits were inferior for DDSR as compared to TPR. Regarding the N management pattern, the split application of N not only increased the milling recoveries but also increased the appearance, biochemical, and cooking quality of aromatic rice.
Milling recovery of rice is an important quality trait that dictates the market value of rice, which can be assessed by BR, BHR, husk, BBR, bran, WBR, and WHR. The finding of the current study indicated that DDSR gave a comparable percentage of white rice; however, the percentage of BR, BHR, and WHR was significantly higher in the TPR system. Higher recovery percentage in the TPR system can be attributed to lower panicle density with better grain filling rate while in DDSR higher panicle density and intraspecific competition influenced the grain filling rate and panicle development. Similarly, Zhou et al. [2] indicated that among the agronomic practices, planting density is an important practice that influences not only the growth and yield but also grain quality. However, he also explained that the influence of planting density on total milled rice and head rice recovery could be genotype-dependent.
Regardless of the management pattern, increasing the N rate either in DDSR or in TPR increased the milling recoveries [6,26]. However, the highest increase in milling recovery due to the split application of N might be attributed to an increase of protein content in the endosperm caused by N application [26]. As higher protein contents in the endosperm help to reduce grain breakage during milling and the further increase of protein makes rice grain harder to breakage and resulted in higher milling recoveries. Similarly, Perez et al. [29] discussed that with increasing N rate head rice recovery, as well as other milling recoveries, increased. Moreover, higher milling recovery under split application of N might be attributed to increased assimilate translocation to grain, better grain filling, and ultimately improved milling recoveries [2,6]. Furthermore, higher milling recoveries in the split application of N can be attributed to N application at the PI stage; it is also explained by Perez et al. [29] and Wopereis-Pura et al. [30] that an N application at a later growth stage not only increased the yield but also improved milling recovery and grain quality.

4.2. Appearance Quality

The appearance quality traits of rice grain not only attract consumers but also bring a higher price. Rice grain dimensions, chalky kernel percentage, and kernel opaqueness are appearance quality determining traits [6]. In this study, kernel appearance quality was significantly influenced by the production system and N management pattern (Table 3). Zhou et al. [2] explained that, besides genetic diversity of breeding, improvement in grain quality could be brought by management practices specifically by planting density and N management.
Amongst appearance traits, the percentage of chalky kernels, opaque kernel, and abortive kernels were substantially higher in DDSR in comparison to TPR that might be attributed to more intraspecific plant competition for nutrients under higher tiller density of DDSR [2]. Similarly, the shading effect and reduced photosynthesis rate under higher plating density of DDSR also reduced the aptitude to synthesize starch in the developing endosperm [37] and resulted in increased chalkiness and chalky percentage due to disordered amyloplast development [2]. Whereas the main reason behind higher percentages of the opaque and abortive kernel in DDSR might be boron (B) deficiency [31] because B availability may reduce under the aerobic condition of paddy fields due to higher redox potential and fluctuating soil pH [38].
Regarding N management, increasing the N rate (specifically in split application treatments) decreased the percentage of chalky kernels ([4], Table 3). Dou et al. [4] stated that N application at a later growth stage decreased the chalky kernel percentage and chalkiness. The morphological study of Xi et al. [39] revealed that loosely packing of starch granules under accelerated grain filling rate develop an opaque part that is chalkiness [40]. In this study, a reduction in the chalky kernel percentage may be relevant to proper assimilate translocation. Split application of N fertilizer lowered the grain filling rate at the early stage of grain filling and provided sufficient N assimilation for protein accumulation, and it was also confirmed by Dou et al. [4] who discussed that N application at heading improved the N metabolism in comparison to carbon metabolism that led to slower starch accumulation. Similarly, reduction in opaque and abortive kernel percentage while improving the kernel length and kernel width might be attributed to better assimilate translocation and partitioning to grains due to the application of N fertilizer in splits and at later growth stage [30].

4.3. Protein Contents

The production system did not influence the protein contents besides having different tiller density and similar findings were reported by Zhou et al. [2] who discussed that different tiller densities did not influence the protein contents of the rice kernel. By contrast, Xu et al. [41] reported that protein contents of milled rice showed a significant increase under reduced planting density. However, in both years of experimentation, protein contents increased with increasing N rate but a significant increase in protein contents was observed under the split application of N fertilizers. The higher protein contents under the split application of N could be attributed to increased N uptake (by 42%) as compared to the only basal application of N [32]. Whereas, when N was applied only as basal dose, it increased the N losses and resulted in lower N uptake and ultimately lower protein content. According to Yuan et al. [42], the most favorable rice protein is with abundant lysine including other essential amino acids and it is also excellent nutrition for the human diet. Previous studies of Leesawatwong et al. [26] and Champagne et al. [27] reported that protein contents of rice increased with an increasing N rate that might be attributed to an increase in main storage protein (glutelin) concentrated in the outer cell layer of endosperm. Similarly, Ning et al. [43] discussed that the application of N fertilizer increased the fraction of glutelin, albumin, globulin, and prolamin. Therefore, N fertilization increased the rice-protein quality and nutritional value of rice because glutelin is lysine-rich protein [44].

4.4. Cooking Quality

It is found that increasing the N rate increased the water absorption ratio and this increase was substantially higher under split application of N fertilizer. A positive correlation was recorded between protein contents and the water absorption ratio; this was in agreement with the finding of Farooq et al. [45], who stated that water absorption ratio increased with increasing protein content in rice kernels because proteins are hygroscopic and, as a result, they enhanced the water uptake. By contrast, amylose contents decreased with increasing N rate either in basal treatments or in split application treatments that are also reported by Zhou et al. [2]. In rice endosperm, two groups of starch granules, A- and B-type, are evident. Generally, in comparison to B-type, the starch granule of A-type possesses higher total and apparent amylose contents [46]. Therefore, increasing the N fertilization reduced the fraction of A-type starch granules, and thus total amylose contents reduced, while in the case of the production system, no significant influence on amylose contents, water absorption ratio, and elongation ratio was observed even having different tiller density which is in agreement with the finding of Zhou et al. [2], who discussed that varying planting density did not affect the amylose content. However, on average production system influence the percentages of bursting, curling, and cooked grain length (Figure 2 and Figure 3). A higher percentage of bursting and curling and lower cooked grain length in DDSR was comparatively higher than TPR that might be attributed to reduced availability of B in the aerobic condition of direct seeding [38]. Rehman et al. [47] also discussed that the application of B nutrition improved the milling returns and cooking quality by reducing the bursting, curling, and kernel elongation ratio. Regarding N management, split application of N increased the cooked grain length and elongation ratio while reducing the percentages of bursting and curling that might be attributed to proper assimilate translocation, grain filling, and partitioning. Higher bursting and curling percentages in this study might be due to the use of raw paddy for milling because Chauhan et al. [1] highlighted that parboiled and steamed rice improved the cooking quality of rice by reducing the percentage of bursting and curling as compared to raw paddy.

5. Conclusions

In conclusion, the rice quality aspects, i.e., milling, appearance, nutritional, cooking of rice grain quality, percentage of white rice, opaque kernel, kernel width, kernel protein, water absorption ratio, and amylose contents, were not influenced by the production system. However, the DDSR cultivation may reduce some traits of appearance (chalky kernels, abortive kernels, and kernel length) and cooking quality (bursting and curling) traits as compared to TPR. On the other hand, the application of N fertilizer led to a substantial increase in all rice grain quality attributes. Similarly, increasing N rate either in basal treatments or in the split application of N improved the rice grain quality. Split application of N either in DDSR or in TPR improved the milling recoveries, nutritional values, cooking and appearance quality of aromatic rice, significantly in comparison to basal application of N. Overall, cultivation of DDSR in a combination of split application of N fertilizer has potential to improve all four aspects of rice grain quality. However, the overuse and unjudicial application of nitrogenous fertilizers may lead to higher greenhouse gas emissions, eutrophication, soil acidification, and groundwater contamination.

Supplementary Materials

The following are available online at https://www.mdpi.com/2073-4395/10/11/1841/s1, Table S1: Detail of crop husbandry practices during rice crop season in 2017 and 2018. Table S2: Variance components, the mean sum of square values and Tukey’s HSD values (p ≤ 0.05) for biochemical and cooking quality traits of aromatic rice under different nitrogen management pattern and production systems.

Author Contributions

N.A., S.H., and P.A. conceived and designed the experiments; M.I, Z.B., and K.M. carried out experiments; M.I., U.Z., M.N.A., and U.A. analyzed the data and drafted the work; M.A. and P.A. wrote the manuscript. S.H., M.N.A., and P.A. revised the manuscript. All authors contributed to the manuscript and agreed to the published version of the manuscript. All authors have read and agreed to the published version of the manuscript.

Funding

The APC was funded through RSP-2020/180.

Acknowledgments

The authors acknowledge the University of Agriculture Faisalabad for the support during research. Research in MNA and PA lab is supported by Researchers Supporting Project Number (RSP-2020/180), King Saud University, Riyadh, Saudi Arabia.

Conflicts of Interest

The authors declare no conflict of interest.

References

  1. Chauhan, B.S.; Jabran, K.; Mahajan, G. Rice Production Worldwide; Springer International Publishing: Cham, Switzerland, 2017. [Google Scholar] [CrossRef]
  2. Zhou, C.; Huang, Y.; Jia, B.; Wang, Y.; Wang, Y.; Xu, Q.; Li, R.; Wang, S.; Dou, F. Effects of cultivar, nitrogen rate, and planting density on rice-grain quality. Agronomy 2018, 8, 246. [Google Scholar] [CrossRef] [Green Version]
  3. Li, M.; Ashraf, U.; Tian, H.; Mo, Z.; Pan, S.; Anjum, S.A.; Duan, M.; Tang, X. Manganese-induced regulations in growth, yield formation, quality characters, rice aroma and enzyme involved in 2-acetyl-1-pyrroline biosynthesis in fragrant rice. Plant Physiol. Biochem. 2016, 103, 167–175. [Google Scholar] [CrossRef]
  4. Dou, Z.; Tang, S.; Li, G.H.; Liu, Z.H.; Ding, C.Q.; Chen, L.; Wang, S.H.; Ding, Y.F. Application of nitrogen fertilizer at heading stage improves rice quality under elevated temperature during grain-filling stage. Crop Sci. 2017, 57, 2183–2192. [Google Scholar] [CrossRef] [Green Version]
  5. Tong, C.; Chen, Y.L.; Tang, F.F.; Xu, F.F.; Huang, Y.; Chen, H.; Bao, J.S. Genetic diversity of amylose content and RVA pasting parameters in 20 rice accessions grown in Hainan, China. Food Chem. 2014, 161, 239–245. [Google Scholar] [CrossRef]
  6. Gu, J.F.; Chen, J.; Chen, L.; Wang, Z.Q.; Zhang, H.; Yang, J.C. Grain quality changes and responses to nitrogen fertilizer of japonica rice cultivars released in the Yangtze River Basin from the 1950s to 2000s. Crop J. 2015, 3, 285–297. [Google Scholar] [CrossRef] [Green Version]
  7. Lyon, B.G.; Champagne, E.T.; Vinyard, B.T.; Windham, W.R. Sensory and instrumental relationships of texture of cooked rice from selected cultivars and postharvest handling practices. Cereal Chem. 2000, 77, 64–69. [Google Scholar] [CrossRef]
  8. Zhao, D.S.; Li, Q.F.; Zhang, C.Q.; Zhang, C.; Yang, Q.Q.; Pan, L.X.; Ren, X.Y.; Lu, J.; Gu, M.H.; Liu, Q.Q. GS9 acts as a transcriptional activator to regulate rice grain shape and appearance quality. Nat. Commun. 2018, 9, 1240. [Google Scholar] [CrossRef]
  9. Cao, X.M.; Sun, H.Y.; Wang, C.G.; Ren, X.J.; Liu, H.F.; Zhang, Z.J. Effects of late-stage nitrogen fertilizer application on the starch structure and cooking quality of rice. J. Sci. Food Agric. 2017, 98, 2332–2340. [Google Scholar] [CrossRef]
  10. Ishfaq, M.; Akbar, N.; Zulfiqar, U.; Ali, N.; Ahmad, M.; Anjum, S.A.; Farooq, M. Influence of water management techniques on milling recovery, grain quality and mercury uptake in different rice production systems. Agric. Water Manag. 2020, 243, 106500. [Google Scholar] [CrossRef]
  11. Ishfaq, M.; Akbar, N.; Anjum, S.A.; Haq, A. Growth, yield and water productivity of dry direct seeded and transplanted aromatic rice under different irrigation management regimes. J. Integr. Agric. 2020, 19, 2–19. [Google Scholar] [CrossRef]
  12. Ishfaq, M.; Farooq, M.; Zulfiqar, U.; Hussain, S.; Akbar, N.; Nawaz, A.; Anjum, S.A. Alternate wetting and drying: A water-saving and ecofriendly rice production system. Agric. Water Manag. 2020, 241, 106363. [Google Scholar] [CrossRef]
  13. Mahajan, G.; Chauhan, B.S.; Timsina, J.; Singh, P.P.; Singh, K. Crop performance and water and nitrogen use efficiencies in dry seeded rice in response to irrigation and fertilizer amounts in Northwest India. Field Crops Res. 2012, 134, 59–70. [Google Scholar] [CrossRef]
  14. Prasad, R. Aerobic rice systems. Adv. Agron. 2011, 111, 207–247. [Google Scholar] [CrossRef]
  15. Zhang, Y.; Liu, H.; Guo, Z.; Zhang, C.; Sheng, J.; Chen, L.; Luo, Y.; Zheng, J. Direct-seeded rice increases nitrogen runoff losses in south eastern China. Agric. Ecosyst. Environ. 2018, 251, 149–157. [Google Scholar] [CrossRef]
  16. Mahajan, G.; Chauhan, B.S.; Gill, M.S. Optimal nitrogen fertilization timing and rate in dry-seeded rice in northwest India. Agron. J. 2011, 103, 1676–1682. [Google Scholar] [CrossRef]
  17. Li, J.; Zhang, H.; Dong, Y.; Ni, X.; Yang, B.; Gong, J.; Chang, Y.; Dai, Q.; Huo, Z.; Xu, K.; et al. Effects of cultivation methods on yield, growth stage and utilization of temperature and illumination of rice in different ecological regions. Sci. Agric. Sin. 2011, 44, 2661–2672. [Google Scholar]
  18. Yang, L.; Wang, Y.; Kobayashi, K.; Zhu, J.; Huang, J.; Yang, H.; Wang, Y.; Dong, G.; Liu, G.; Han, Y.; et al. Seasonal changes in the effects of free-air CO2 enrichment (FACE) on growth, morphology and physiology of rice root at three levels of nitrogen fertilization. Glob. Chang. Biol. 2008, 14, 1–10. [Google Scholar] [CrossRef]
  19. Kumar, V.; Ladha, J.K. Direct seeding of rice: Recent developments and future research needs. Adv. Agron. 2011, 111, 297–413. [Google Scholar] [CrossRef]
  20. Ju, X.T.; Xing, G.X.; Chen, X.P.; Zhang, S.L.; Zhang, L.J.; Liu, X.J.; Cui, Z.L.; Yin, B.; Christie, P.; Zhu, Z.L.; et al. Reducing environmental risk by improving N management in intensive Chinese agricultural systems. Proc. Natl. Acad. Sci. USA 2009, 106, 3041–3046. [Google Scholar] [CrossRef] [Green Version]
  21. Lagomarsino, A.; Elio Agnelli, A.; Ferrara, R.M.; Adviento-Borbe, M.A.; Linquist, B.; Gavina, G.; Ravaglia, S. Green-house gas emissions from rice fields under different water management. In Proceedings of the EGU General Assembly Conference, Vienna, Austria, 7–12 April 2013; Available online: http://adsabs.harvard.edu/abs/2013EGUGA (accessed on 15 August 2019).
  22. Sommer, S.G.; Schjoerring, J.K.; Denmead, O.T. Ammonia emission from mineral fertilizers and fertilized crops. Adv. Agron. 2004, 82, 557–622. [Google Scholar]
  23. Garnett, T.; Conn, V.; Kaiser, B.N. Root based approaches to improving nitrogen use efficiency in plants. Plant Cell Environ. 2009, 32, 1272–1283. [Google Scholar] [CrossRef] [PubMed]
  24. Erisman, J.W.; Sutton, M.A.; Galloway, J.; Klimont, Z.; Winiwarter, W. How a century of ammonia synthesis changed the world. Nat. Geosci. 2008, 1, 636–639. [Google Scholar]
  25. Guo, J.H.; Liu, X.J.; Zhang, Y.; Shen, J.L.; Han, W.X.; Zhang, W.F.; Christie, P.; Goulding, K.W.T.; Vitousek, P.M.; Zhang, F.S. Significant acidification in major Chinese croplands. Science 2010, 327, 1008–1010. [Google Scholar] [CrossRef] [PubMed] [Green Version]
  26. Leesawatwong, M.; Jamjod, S.; Kuo, J.; Dell, B.; Rerkasem, B. Nitrogen fertilizer increases seed protein and milling quality of rice. Cereal Chem. 2005, 82, 588–593. [Google Scholar] [CrossRef] [Green Version]
  27. Champagne, E.T.; Bett-Garber, K.L.; Thomson, J.L.; Fitzgerald, M.M. Unrevealing the impact of nitrogen nutrition on cooked rice flavour and texture. Cereal Chem. 2009, 86, 274–280. [Google Scholar] [CrossRef] [Green Version]
  28. Rehman, H.U.; Basra, S.M.A.; Wahid, A. Optimizing nitrogen-split application time to improve dry matter accumulation and yield in dry direct seeded rice. Int. J. Agric. Biol. 2013, 15, 41–47. [Google Scholar]
  29. Perez, C.M.; Bourne, M.C.; Juliano, B.O. Measuring hardness distribution of cooked rice by single-grain puncture. J. Texture Stud. 1996, 27, 1–13. [Google Scholar] [CrossRef]
  30. Wopereis-Pura, M.M.; Watanabe, H.; Moreira, J.; Wopereis, M.C.S. Effect of late nitrogen application on rice yield, grain quality and profitability in the Senegal River valley. Eur. J. Agron. 2002, 17, 191–198. [Google Scholar] [CrossRef]
  31. Sarwar, N.; Ali, H.; Irfan, M.; Akhter, M.T.; Ali, M.T. Boron nutrition under intermittent flooding and drying condition seems sustainable nutrient management technique in rice. Cercet. Agron. Mold. 2016, 49, 17–27. [Google Scholar] [CrossRef] [Green Version]
  32. Ishfaq, M.; Akbar, N.; Zulfiqar, U.; Ali, N.; Jabran, K.; Nawaz, M.; Farooq, M. Influence of Nitrogen Fertilization Pattern on Productivity, Nitrogen Use Efficiencies, and Profitability in Different Rice Production Systems. J. Soil Sci. Plant Nutr. 2020, 1–17. [Google Scholar] [CrossRef]
  33. Akbar, N.; Ehsanullah; Jabran, K.; Ali, M.A. Weed management improves yield and quality of direct seeded rice. Aust. J. Crop Sci. 2011, 5, 688–694. [Google Scholar]
  34. AOAC. Official Methods of Analysis, 18th ed.; Association of Official Analytical Chemists: Arlington, VA, USA, 2006; Volume 19, pp. 1006–1101. [Google Scholar]
  35. Juliano, B.O.; Perez, C.M.; Blakeney, A.B.; Castillo, T.; Kongseree, N.; Laignelet, B.; Lapis, E.T.; Murty, V.V.S.; Paule, C.M.; Webb, B.D. International cooperative testing on the amylose content of milled rice. Starch-Stärke 1981, 33, 157–162. [Google Scholar]
  36. Steel, R.G.D.; Torrie, J.H.; Dickey, D.A. Principles and Procedures of Statistics; McGraw Hill Co. Inc.: New York, NY, USA, 1997. [Google Scholar]
  37. Ishimaru, T.; Horigane, A.K.; Ida, M.; Iwasawa, N.; San-oh, Y.A.; Nakazono, M.; Nishizawa, N.K.; Masumura, T.; Kondo, M.; Yoshida, M. Formation of grain chalkiness and changes in water distribution in developing rice caryopses grown under high-temperature stress. J. Cereal Sci. 2009, 50, 166–174. [Google Scholar] [CrossRef]
  38. Gao, X.J.; Hu, X.; Wang, S.P.; He, B.G. Nitrogen losses from flooded rice field. Pedosphere 2002, 12, 151–156. [Google Scholar]
  39. Xi, M.; Zhao, Y.L.; Lin, Z.M.; Zhang, X.C.; Ding, C.Q.; Tang, S.; Liu, Z.H.; Wang, S.H.; Ding, Y.F. Comparison of physicochemical characteristics between white-belly and white-core rice grains. J. Cereal Sci. 2016, 69, 392–397. [Google Scholar] [CrossRef]
  40. Tsukaguchi, T.; Iida, Y. Effects of assimilate supply and high temperature during grain-filling period on the occurrence of various types of chalky kernels in rice plants (Oryza sativa L.). Plant Prod. Sci. 2008, 11, 203–210. [Google Scholar] [CrossRef]
  41. Xu, C.M.; Wang, D.Y.; Shao, G.S.; Zhang, X.F. Effects of transplanting density and nitrogen fertilizer rate on yield formation and grain quality of super high yielding rice Zhongzao 22. Chin. J. Rice Sci. 2008, 22, 507–512. [Google Scholar]
  42. Yuan, L.; Zhang, Z.C.; Cao, X.C.; Zhu, S.C.; Zhang, X.; Wu, L.H. Responses of rice production, milled rice quality and soil properties to various nitrogen inputs and rice straw incorporation under continuous plastic film mulching cultivation. Field Crops Res. 2014, 155, 164–171. [Google Scholar] [CrossRef]
  43. Ning, H.F.; Liu, Z.H.; Wang, Q.S.; Lin, Z.M.; Chen, S.J.; Li, G.H.; Wang, S.H.; Ding, Y.F. Effect of nitrogen fertilizer application on grain phytic acid and protein concentrations in japonica rice and its variations with genotypes. J. Cereal Sci. 2009, 50, 49–55. [Google Scholar] [CrossRef]
  44. Juliano, B.O.; Antonio, A.A.; Esmama, B.V. Effects of protein content on the distribution and properties of rice protein. J. Sci. Food Agric. 1973, 24, 295–306. [Google Scholar] [CrossRef]
  45. Farooq, M.; Kobayashi, N.; Wahid, A.; Ito, O.; Basra, S.M.A. Strategies for producing more rice with less water. Adv. Agron. 2009, 101, 351–388. [Google Scholar] [CrossRef]
  46. Shinde, S.V.; Nelson, J.E.; Huber, K.C. Soft wheat starch pasting behavior in relation to A- and B-granule content and composition. Cereal Chem. 2003, 80, 91–98. [Google Scholar] [CrossRef]
  47. Rehman, A.; Farooq, M.; Rashid, A.; Nadeem, F.; Stuerz, S.; Asch, F.; Bell, R.W.; Siddique, K.H.M. Boron nutrition of rice in different production systems. A review. Agron. Sustain. Dev. 2018, 38, 1–25. [Google Scholar] [CrossRef] [Green Version]
Figure 1. Influence of nitrogen management pattern on water absorption ratio (A) and biochemical traits (B,C) of aromatic rice during 2017 and 2018; HSD = honestly significant difference; a HSD = 2017; b HSD = 2018; Bars are treatment means ± standard errors; Values sharing different lettering for a parameter above the bar are different significantly (p ≤ 0.05) by the Tukey’s HSD test within the same year.
Agronomy 10 01841 g001
Figure 2. Influence of nitrogen management pattern on bursting (A,B) and curling (C,D) of aromatic rice under different production systems during 2017 and 2018; DDSR = dry direct-seeded rice; TPR = transplanted rice; HSD = honestly significant difference; a HSD = 2017; b HSD = 2018; Bars are treatment means ± standard errors; Values sharing different lettering for a parameter above the bar are different significantly (p 0.05) by the Tukey’s HSD test within the same year.
Agronomy 10 01841 g002
Figure 3. Influence of nitrogen management pattern on CGL = cooked grain length (A,B) and elongation ratio (C,D) of aromatic rice under different production systems during 2017 and 2018; DDSR = dry direct-seeded rice; TPR= transplanted rice; HSD = honestly significant difference; a HSD = 2017; b HSD = 2018; Bars are treatment means ± standard errors; Values sharing different lettering for a parameter above the bar are different significantly (p 0.05) by the Tukey’s HSD test within the same year.
Agronomy 10 01841 g003
Table 1. Weather data during the rice season of 2017 and 2018.
MonthTemperature °CRelative Humidity b (%)Monthly Average Sunshine c (h)Rainfall d (mm)
Monthly Maximum aMonthly Minimum aMonthly Mean a
201720182017201820172018201720182017201820172018
June39.839.827.327.933.533.944.556.58.59.3841.692.0
July38.538.028.928.033.733.070.070.207.007.9117195
August38.139.028.629.533.434.268.967.47.8708.566.005.4
September36.737.224.425.630.631.467.765.108.808.735.641.7
October35.032.619.218.727.125.668.264.407.58.810.000.00
November24.127.111.812.718.019.984.674.63.656.6801.500.6
a Monthly average maximum, average minimum, and average mean temperature during the whole month; b Monthly average relative humidity; c Average sunshine hours; d Total monthly rainfall; Source: Meteorological Cell, University of Agriculture Faisalabad, Pakistan.
Table 2. Influence of different nitrogen levels and management techniques on milling recoveries of aromatic rice under conventional (TPR) and conservation (DDSR) production systems in 2017 and 2018.
Treatment Brown Rice (%)Brown Head Rice (%)Brown Broken Rice (%)White Rice (%) White Head Rice (%) White Broken Rice (%)
201720182017201820172018201720182017201820172018
Production system (PS)
Dry direct-seeded rice (DDSR)78.2 a76.5 b58.4 b54.7 b19.8 a21.7 a69.1 a63.8 a44.9 b43.9 b24.1 a19.9 a
Transplanted rice (TPR)77.8 b77.9 a59.6 a57.0 a18.2 b20.9 a69.3 a64.6 a44.8 a47.2 a22.6 a17.4 b
HSD (p ≤ 0.05) 0.240.941.091.161.321.991.241.470.981.162.201.84
Nitrogen management (NM)
N1 (0 kg ha−1 N = Control)75.2 e71.1 e48.5 e49.7 d26.7 a21.5 a,b65.1 d56.1 c38.7 d36.6 e26.4 a19.5 a,b
N2 (50 kg ha−1 N as basal)76.4 d75.3 d55.5 d52.8 cd20.9 b22.4 a68.2 c60.9 b42.1 a40.5 d26.1 a20.4 a
N3 (100 kg ha−1 N as basal)77.7 c76.9 c,d58.3 c54.9 bc19.4 b22.0 a,b69.4 b63.0 b45.1 b43.3 c24.3 ab19.8 a,b
N4 (150 kg ha−1 N as basal)78.6 bc78.3 bc62.8 b56.2 b15.8 c22.1 a,b69.7 b64.0 b46.2 b45.7 b23.6 b18.4 a,b
N5 (100 kg ha−1 N in three splits)80.7 a81.1 a65.0 a61.2 a15.7 b19.8 b71.9 a71.1 a52.2 a53.2 a19.8 c17.9 a,b
N6 (150 kg ha−1 N in three splits)79.4 b80.5 a,b64.1 a,b60.4 a15.5 b20.1 a,b70.9 a69.8 a51.0 a53.9 a19.9 c15.9 b
HSD (p ≤ 0.05) 0.992.681.363.231.912.551.163.382.292.202.484.22
Analysis of variance-------------
Sourcedf------------
PS1*****ns nsns ***ns *
NM5**********************
PS × NM5ns ns ns ns ns ns nsns ns ns ns ns
df = Degree of freedom; - = Not applicable; ns = Not significant at p > 0.05; *= Significant at p < 0.05; **= Significant at p < 0.01; HSD = honestly significant difference; Values sharing different lettering for a parameter are different significantly (p ≤ 0.05) by the Tukey’s HSD test.
Table 3. Influence of different nitrogen levels and management techniques on kernel appearance quality traits of aromatic rice under conventional (TPR) and conservation (DDSR) production systems in 2017 and 2018.
Treatment Chalky Kernel (%)Abortive Kernel (%)Opaque Kernel (%)Kernel Length (%)Kernel Width (%)Kernel Length to Width Ratio
201720182017201820172018201720182017201820172018
Production system (PS)
Dry direct-seeded rice (DDSR)19.7 a18.1 a10.6 a13.6 a8.57 a11.2 a9.34 a9.18 b1.70 a1.83 a5.55 a5.02 b
Transplanted rice (TPR)16.3 b14.6 a9.41 b11.9 b8.10 a9.45 a10.0 a9.68 a1.81 a1.84 a5.60 a5.26 a
HSD (p ≤ 0.05) 3.435.481.140.590.982.560.910.290.260.041.090.17
Nitrogen management (NM)
N1 (0 kg ha−1 N = Control)26.5 a24.6 a15.5 a15.7 a12.8 a17.6 a8.75 d8.82 a1.45 c1.79 a6.10 a4.94 a
N2 (50 kg ha−1 N as basal)23.5 a20.2 b12.7 b14.2 a,b9.00 b14.1 b9.17 c,d9.08 a1.61 b,c1.82 a5.77 a4.99 a
N3 (100 kg ha−1 N as basal)19.2 b18.1 b10.4 c13.0 b,c8.32 b9.87 c9.53 b,c9.42 a1.80 a,b1.84 a5.47 a5.13 a
N4 (150 kg ha−1 N as basal)17.8 b16.4 b9.25 c11.7 b,c7.92 b9.61 d9.94 a,b9.59 a1.86 a1.85 a5.44 a5.19 a
N5 (100 kg ha−1 N in three splits)10.8 c10.1 c6.37 d10.8 c6.13 c6.84 d10.3 a9.75 a1.90 a1.86 a5.36 a5.26 a
N6 (150 kg ha−1 N in three splits)10.1 c9.07 c5.78 d11.1 c 5.80 c5.89 d10.5 a9.91 a1.91 a1.87 a5.32 a5.31 a
HSD (p ≤ 0.05) 3.724.301.762.531.452.170.651.290.230.090.990.71
Analysis of variance
Sourcedf
PS1*ns ***ns ns ns*ns ns ns *
NM5**************ns **ns ns ns
PS × NM5*ns ns ns ns *nsns ns ns ns ns
df = Degree of freedom; ns = Not significant at p > 0.05; * = Significant at p < 0.05; ** = Significant at p < 0.01; HSD = honestly significant difference; Values sharing different lettering for a parameter are different significantly (p ≤ 0.05) by the Tukey’s HSD test.
Publisher’s Note: MDPI stays neutral with regard to jurisdictional claims in published maps and institutional affiliations.

