Aerobic Rice with or without Strategic Irrigation in the Subtropics


1
Institute for Future Farming System, Central Queensland University, Rockhampton, QLD 4702, Australia
2
Centre for Agricultural Innovation, Department of Jobs, Precincts and Regions, Agriculture Victoria Research, 110 Natimuk Rd, Horsham, VIC 3400, Australia
*
Author to whom correspondence should be addressed.
Agronomy 2020, 10(11), 1831; https://doi.org/10.3390/agronomy10111831
Submission received: 28 October 2020
/
Revised: 18 November 2020
/
Accepted: 19 November 2020
/
Published: 21 November 2020
(This article belongs to the Section Innovative Cropping Systems)
Abstract
:Modern rice varieties adapted to aerobic (dryland) conditions have expanded to new rice growing systems thanks to their plasticity in adapting to rainfed and irrigated conditions. This is important because, as water becomes scarce in paddy rice regions (as it is already in Australia), there will be a move towards tropical to subtropical dryland rainfed rice with attendant problems of drought and low temperature. To assess rice adaptability in the wet season of the semi-arid subtropical conditions of coastal central Queensland, field experiments were established for a late season (in January) planting in 2014 and early season planting in November 2015 with 13 varieties developed by Australian Agriculture Technologies (AAT) Ltd were seeded in a vertisol soil. This was to assess their adaptation to rainfed conditions and their response to strategic irrigation. Water scarcity and low temperature prior to and at flowering were important factors constraining yield. Early flowering varieties in the late season planting escaped the otherwise cold and drought stress during the reproductive stage and had higher yields. In the second year, earlier planting made possible with strategic irrigation avoided the low temperature constraint on yield, but without follow-up strategic irrigation, yields were still low. The average yield of varieties increased from 1.5 times (AAT 4) to 16.3 times (AAT 15) with strategic irrigation compared with rainfed yields averaged across years. The increase in yield with strategic irrigation was associated with a greater leaf area index, spikelet fertility, and instantaneous water use efficiency during flowering. Strategic irrigation concentrated roots in the top 15 cm, but differences in yield between varieties under rainfed conditions were not related to root properties. It is important to consider variations in flowering time, yield potential, and drought patterns when developing rice varieties for rainfed semi-arid tropical conditions, as well as when quantifying the benefits of strategic irrigation.
1. Introduction
Rice (Oryza sativa L.) is predominantly grown in the tropical lowlands as a flood irrigated paddy crop mainly with indica ecotypes. In water-scarce areas in many countries, rice is also grown as an upland crop (or aerobic rice) mainly with japonica ecotypes. Aerobic rice is grown in soil often kept below water saturation.
Improving water productivity for rice production is a global driver for the rice industry. Non-flooded irrigation for rice production systems has been seen as an effective way of improving water productivity, particularly when moving rice production to new regions with limited water. Despite being considered low yielding, some adapted aerobic rice varieties can produce a high yield with a high harvest index (HI) when grown without nutrient deficiency and/or drought [1]. Aerobic rice under such practices has already shown promise with yields of 6–7 t/ha in China [2]. Indeed, some improved aerobic good-yielding rice varieties have been identified for the Huang-Huai-Hai River plains of China, with a yield of 7 t/ha on irrigated drylands [3].
Aerobic rice is, nevertheless, generally lower yielding than lowland paddy rice. De Datta et al. [4] tested the variety IR20 under aerobic conditions with irrigation in the Philippines and achieved 55% more water savings than in traditional flooded systems, but yield was compromised from 7.9 t/ha down to 3.4 t/ha. However, upland rice reportedly has a greater fractal abundance of roots than paddy rice, allowing for greater water extraction by aerobic rice from dry and subsurface soils [5].
The pivotal role of photosynthesis in determining biomass and yield underlies the importance of photosynthesis as a prime trait for the selection of productive rice varieties under both well-watered and drought conditions. For all the detractions of using measures of leaf photosynthesis as a determinant of yield, [6] argued for the close link between increases in leaf photosynthesis and yield. For rice, higher rates of photosynthesis and stomatal conductance lead to higher yields across genotypes under water stress environments [7].
Water use efficiency (WUE) is another major physiological trait used for the identification and improvement of rice varieties under water-limiting conditions. WUE in the physiological sense at the leaf level can be measured instantaneously as the ratio of net photosynthesis rate (A) to transpiration (E), also known as transpiration efficiency (TE), and by carbon isotope discrimination (CID) [7,8]. CID is generally used as a measure of the longer-term integrative WUE, particularly in C3 species [9]. However, although much attention has been directed toward breeding for WUE per se, little advance has been made [10] and alternative recommendations, based upon modelling exercises, to ‘save’ water from the vegetative period to be used for reproductive growth have been made. While partial stomatal closure, conditioned either (a) when the vapour pressure deficit rises beyond a given cue or (b) when less than one-third of transpirable water remains in the soil, increases yield with greater water availability during reproductive growth [10], the possibility that redistributed non-structural carbohydrates stored during the vegetative period can contribute to some form of drought tolerance cannot be discarded.
Nevertheless, it is still essential to understand the effect and mechanisms of water deficit on leaf gas exchange, i.e., photosynthesis (A), transpiration (E), and on plant growth for targeted breeding and selection of tolerant varieties for dryland field conditions [11]. Various studies have reported that drought has a significant effect on A, stomatal conductance (gs), and E [12,13]. Besides the all-important effect of drought at the time of flowering on seed set in rice [14], the grain filling period is particularly important in terms of carbon storage for grain yield as most of the CO2 assimilation from the photosynthetically active flag leaf is stored in mature grains [15,16]. Therefore, conditions that limit the photosynthetic rate of the flag leaf limit grain yield [17]. The penalty of drought during the grain filling stage is significantly reduced photosynthesis and yield; hence, much varietal screening for drought tolerance within crops is focused on traits that ameliorate terminal drought stress [18]. Among these, improved rooting and water extraction patterns may be included.
Indeed, trait-based selection for enhanced water extraction and maintenance of positive tissue turgor through greater water extraction from where soil water is available is widely recognised as one approach to enhance yield under water-limited conditions for rice [19]. Close links between a deeper root system, photosynthetic efficiency, and lower drought susceptibility were evident using a large number of mutagenized rice lines [19], as was found among land races of rice [20] and other crop species (e.g., chickpea—[21]; maize—[22]). Likewise, use of canopy temperature [23] or high carbon isotope discrimination [24] as proxies for gains from deep rooting during drought stress has been reported.
However, in spite of the search to address terminal drought, there are arguments for saving soil water (as for storing carbohydrate and redistributing it to grain after flowering) for use during grain filling (i.e., reducing E, meaning that integrated through the crop WUE is inversely proportional to productivity). This is a conservative approach, ‘the conductance type’ of Impa et al. [25]. There are also arguments for using all water, quickly choosing varieties with a greater biomass per unit of water transpired, which would hasten growth and, proportionally, productivity (i.e., variation in the WUE is proportional to photosynthetic rate, ‘the capacity type’). Both improve WUE, but with differing consequences; the latter being better suited for early maturing varieties that cover the soil soon after sowing and reduce the evaporation component of ET, and the former for later varieties with reduced exploitation of soil water reserves until after flowering. It is known that genetic diversity exists for water use efficiency (WUE), which is necessary for selection; hence, the yield penalty with reduced access to water can vary between varieties [25].
Other factors to contend with for rice production in the semi-arid tropical lowlands are those of irregular distribution of rainfall and the occurrence of low temperature as crops flower and mature at the end of summer. With a rainfed crop established at the onset of summer rains, the sowing date may be so delayed that reproductive stages take place when temperatures are lower than the physiological limit, leading to infertility and loss of yield potential [26]. The effects of low temperature on pollen sterility are similar to those of drought [27] and attempts to improve the tolerance to low temperature if rice cultivation is to extend to the wet season in the semi-arid tropics are also called for. Supplementary, or strategic, irrigation when rainfall is insufficient may allow for earlier sowings and avoidance of late season low temperatures as rice is pushed to the limits of its low temperature tolerance.
Australian Agricultural Technologies (AAT) Limited has obtained some improved tropical aerobic varieties bred in Australia. The yield potential, WUE, water productivity, and physiological basis for any field tolerance to drought of these AAT varieties under rainfed and strategic irrigation conditions are not known. Preliminary trials conducted under controlled environments and in pots/tubs on assessment of coleoptile length, response to leaf blast [28], and response to drought, particularly on transpiration efficiency and leaf and root traits, suggest a significant difference between these varieties. To test the hypothesis that strategic irrigation will enable successful rainfed rice production in the semi-arid tropics, with a view to extending commercial production to such regions, field experiments were carried out at Alton Downs, Queensland during 2014 and 2015.
2. Materials and Methods
2.1. Site Description and Weather
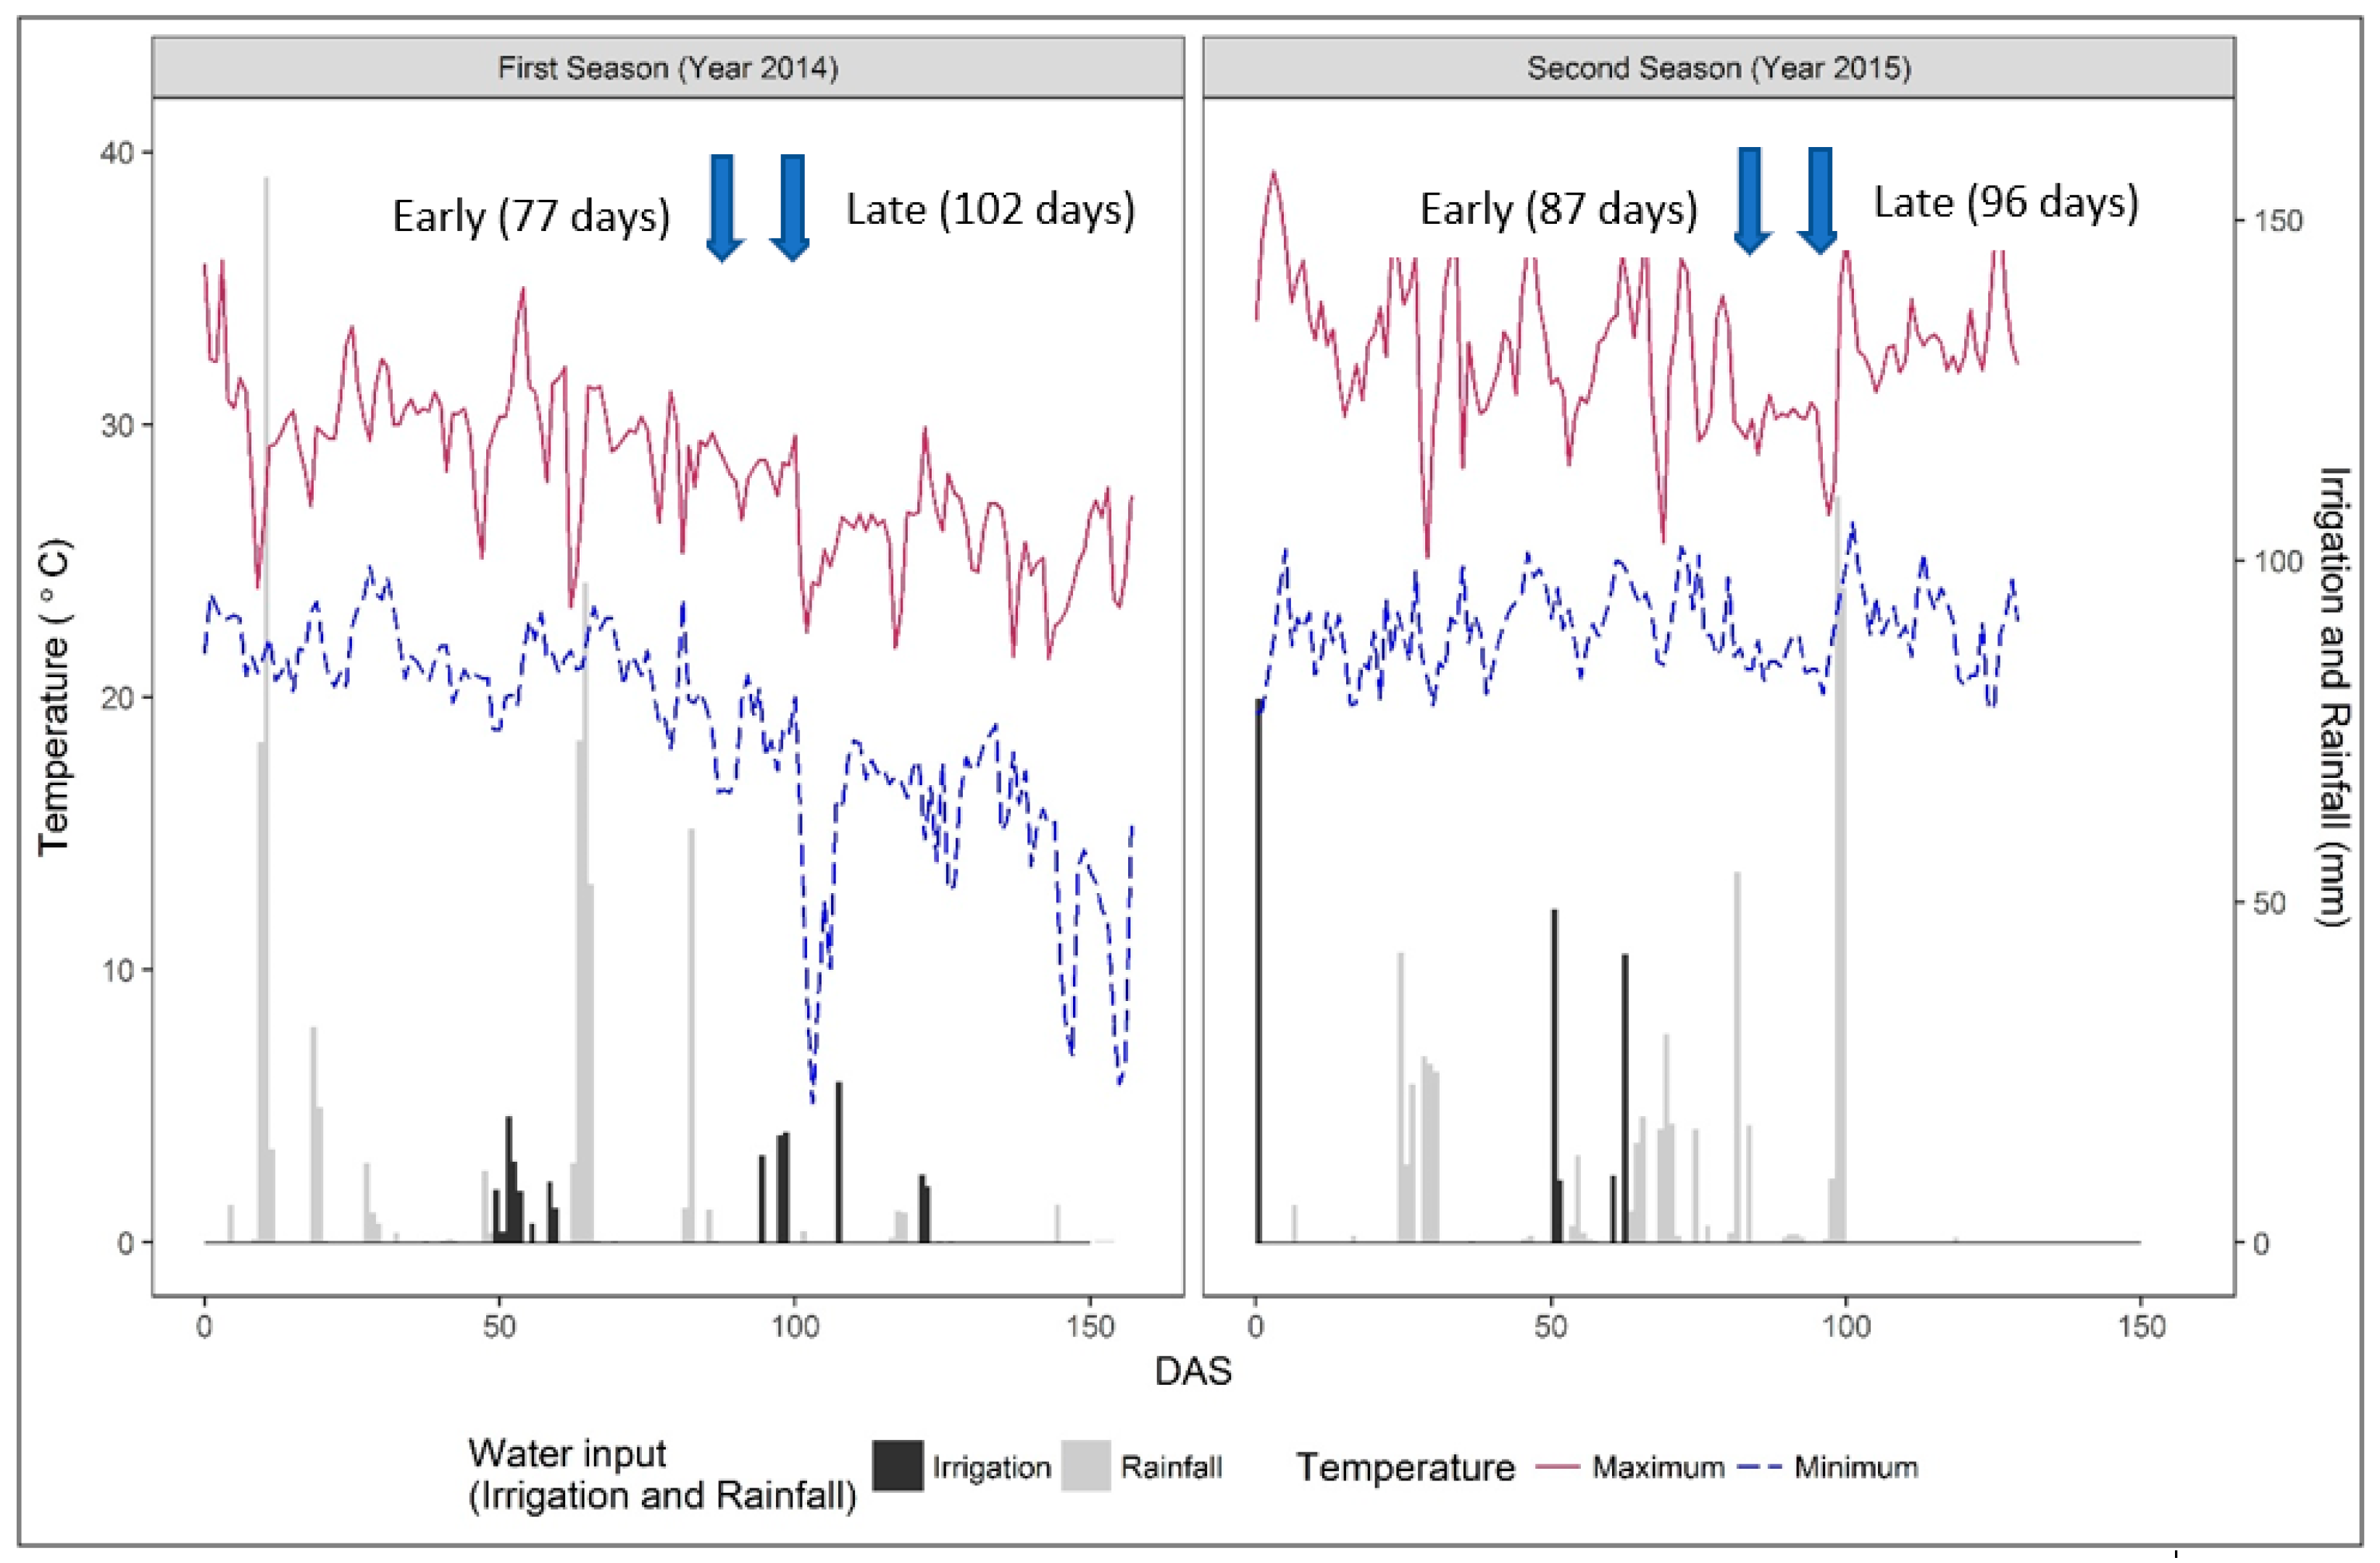
The experiment was conducted over two years on a farmer’s field at Alton Downs, Queensland (23°18′14″S Latitude, 150°21′24″E longitude, and 22 m above sea level). The site has a subtropical climate characterised by distinct wet and dry seasons. The warm, wet season is from December to March, while from June to September, it is cooler and drier. The soil of the experimental site is a heavy clay (self-mulching black cracking clay or vertisol). In the first trial, sowing was on 22 January in 2014 following a 99 mm rainfall and final harvest was on 22 June (referred to as a late planting). In the second trial, using strategic irrigation (an initial irrigation of 0.79 ML to establish the crop, for there was only 6.6 mm rainfall in the two weeks preceding seeding) to advance the sowing date, the sowing was on 14 November 2015 and final harvest was on 23 March 2015 (referred to as an early planting). Total rainfall received during the experimental period was 639 mm and 593 mm for the 2014 and 2014/15 seasons, respectively (Figure 1), whereas the long-term average annual rainfall is 800 mm [29]. Data on maximum and minimum air temperatures, evapotranspiration (ETo), and relative humidity (RH) were obtained from the Australian Bureau of Meteorology, Rockhampton Aerodrome weather station (15 km aerial distance from the site) and the former are presented in Figure 1.
2.2. Experimental Design and Treatments
A strip-plot design with two blocks was used [30]. The two irrigation treatments (rainfed and strategic irrigation) were assigned as main plots and 13 varieties were assigned as sub plots. Soil moisture was measured using a calibrated Micro-Gopher system (Data Flow Systems Ltd, Christchurch, New Zealand), the probe of which consists of a capacitance sensor. Strategic irrigation (SI) was applied with surface drip irrigation (scheduling based on visual observation of crop water stress—mid-day temporary wilting, which coincides with the soil moisture at a depth of 20–30 cm reaching the refill value (21 mm/100 mm) [31]), in order to bring the soil moisture to field capacity (43 mm/100 mm). Irrigation was supplied by Netafim Streamline TM Model 22060 with emitter flow rate of 1.6 L/h and emitter spacing at 25 cm, four drip lines per plot. Each variety was planted in a 25 m × 3.75 m plot at 25 cm row spacing. In each plot, one sample plot (2 m × 1 m) was marked for experimental data recording and sample plot harvest for yield assessment. Data are presented for the sample plot harvest for the Yanmar combine harvester (Okayama, Japan), which lost on average 20% of yield from each plot, mainly because immature grains in late varieties were not machine harvested.
2.3. Crop Management
The crop was directly seeded in a well-prepared seed bed, at a rate of 40 kg/ha by a tractor-mounted seed dibbler. The field was fertilised as is common for most rainfed crops in the region with a pre-planting basal application at 5 cm depth of 100:29:76 kg NPK/ha using Incitec Pivot Ltd Crop King fertiliser (Gibson Island, Murrarie, QLD, Australia). Weeds were controlled using commercial herbicides available on the market. A tank mix of Clomazone (Megister®) @ 0.4 L/ha plus pendimethalin Stomp® 440 @ 2.5 L/ha plus paraquat 250 g/L (Gramoxone® 250) @ 0.8 L/ha was applied after sowing rice seeds. Similarly, Dicamba 500 g/L (Kamba®500) @ 0.4 to 0.56 L/ha was applied during the early tillering stage to control broad leaf weed growth. Intensive manual weeding was also performed on three occasions each year, in order to remove weeds not controlled by herbicides.
2.4. Rice Varieties
Seven long grain late maturing (indica) and six medium grain early maturing (japonica) grain type rice varieties were trialled (Table 1). These varieties were developed in north Queensland and the Northern Territory by Dr. Isaac Lasik from wild and cultivated germplasm of rice under the old defunct ‘Humpty Doo Project’. The details of the pedigree of these varieties are maintained by AAT.
2.5. Crop and Yield Parameters
Two days before the harvest, plant height (from ground level to base of the panicle) and the occurrence of effective tillers were estimated by counting panicles and tiller numbers per sample hill, five per plot [32] (Bioversity International et al., 2007). Five panicle samples were selected from the five hills and the grain from each of those panicles was collected in paper bags. The remaining grains from the five hills were threshed and collected in a large cotton bag, and the straw (stem plus leaves) was also collected and oven-dried and weighed. Numbers of filled and unfilled spikelets from the five sample panicles collected from the sample hills were separated by water (floating = unfilled) to determine the spikelet fertility percentage. The percentage filled grains and 1000 grain weights were measured following the method of [33].
The crop was manually harvested using a sickle to ground level when grain moisture was c. 14%. The sample plot harvest was threshed manually and the grain was dried (as was the straw) and weighed to determine yield and HI. Grain yield was adjusted to 12% moisture content and presented as t/ha.
2.6. Above-Ground Development, Growth, and Gas Exchange Parameters
Flag leaf area (five leaves per plot) at flowering was calculated in cm2 from the formula proposed by [34].
where
- L = length of flag leaf in centimetres;
- B = breadth of flag leaf from widest portion in centimetres;
- C = constant factor, which is 0.74 for the flag leaf of rice.
The heading (herein considered as ≡ flowering, with anthesis occurring one to five days after heading) dates were recorded when 50% of plants in a plot showed the panicle base emerged out of the flag leaf collar. The number of days to grain ripening (maturity) was recorded when 85% of grains on panicles were mature.
A Ceptometer (model AccuPAR LP-80, Decagon Devices, Pullman, WA, USA) was used to measure canopy light interception and gave an estimation of the leaf area index (LAI). Measurements were recorded three times during each crop season, i.e., on 84 days after sowing (DAS), 103 DAS, and 133 DAS in 2014, and on 82 DAS, 110 DAS, and 123 DAS in 2015.
A chlorophyll meter ((SPAD-502, developed by Soil Plant Analysis Development (SPAD) Section, Minolta Camera Co., Osaka, Japan)) was used to obtain chlorophyll values measured as SPAD units on the uppermost fully expanded leaf. SPAD readings were taken from three locations on each of five leaves per plot on three occasions on 85 DAS, 102 DAS, and 133 DAS in 2014, and on two occasions on 79 DAS and 111 DAS in 2015.
Leaf gas exchange parameters were measured using a portable infrared gas analyser (IRGA) (ADC Bioscience, Hoddesdon, UK) on sunny days between 09:00 and 15:00. Measurements were made on three occasions at 83 DAS, 103 DAS, and 133 DAS in 2014, and four occasions at 51 DAS, 82 DAS, 95 DAS, and 110 DAS in 2015. Photosynthetic measurement was taken on the third or fourth fully expanded topmost leaves (from apex) (Kumar et al., 2013) [35], from one randomly selected plant in each plot. Photosynthetically active radiation (PAR), relative humidity (RH), air temperature, air CO2 concentration, and flow rate were recorded. Instantaneous WUE was calculated as the ratio between A and E. Measurements of A, gs, E, and WUE taken around the flowering stage were used for correlation analysis with other parameters.
2.7. Root Parameters
Root samples were collected only in 2015, on the second day of harvesting rice from the centre of a random hill in the middle row of each sample plot, using a 4 cm diameter and 120 cm length sampling core. The core samples, one per plot, were separated into depths of 0–15 cm, 15–30 cm, 30–60 cm, and 60–100 cm. Soil samples were soaked in a sodium lignosulfonate solution (20 mL/L water) for 6 h and placed over a 1 mm sieve to wash and remove soil from root samples with running water. All samples were stored in separate containers with water until scanning. The scanner (HP ScanJet 8200 (Milton, Queensland, Australia) was set at 300 dpi for root imaging. Scanned root images were analysed for total root length and root diameter using Delta T software (Cambridge, UK). After scanning, the roots were dried at 65 °C to estimate dry weight.
The root morphological parameters root diameter (RD), root weight density (RWD) (mg cm−3), and root length density (RLD) (mm cm−3) were calculated using the formulae as described by Yang et al. (2004) [36].
2.8. Water Productivity
Water applications to the plots were measured with water meters. Total water received as irrigation water and rainfall was added to calculate the total water input. Water productivity was then calculated using grain yield recorded from sample plots at 12% moisture divided by the total water input.
2.9. Data Analysis
A two-way analysis of variance (ANOVA) was undertaken according to [30]. The experiment was repeated in the second year, so the error was divided in four levels, i.e., year, year × irrigation, year × variety, and year × irrigation × variety. All analyses were performed using GenStat 16th edition. The interaction effects are presented and, where there was no interaction, the main effects only are presented.
The means were compared by Fisher’s protected ‘least significant difference’ (LSD) test, or with Duncan’s multiple range tests. The significance level was set at 5% in all comparisons. Correlation analysis was carried out to determine the relationships between yield and yield parameters and physiological parameters.
3. Results
3.1. Weather Parameters, Irrigation Inputs, and Soil Moisture Dynamics
Most rainfall in the 2014 season occurred during the first 85 DAS, and in 2015, it rained until 99 DAS. Severe Tropical Cyclone Marcia was a Category 3 cyclone when it hit Alton Downs, resulting in a peak rainfall of 109.4 mm at 98 DAS (20 February 2015) and 96 mm at 99 DAS. Strategic irrigation comprised 1.5 ML/ha, i.e., 150 mm in 2014, and 1.89 ML/ha, i.e., 189 mm in 2015, applied as 14 and 5 events in 2014 and 2015, respectively (Figure 1). In 2015, pre-planting of 0.79 ML/ha was applied, permitted early planting, and following the cyclone, no strategic irrigation was necessary.
The mean air temperatures in the late planted 2014 and in the early planted 2015 crop were 23.5 °C and 27.5 °C, respectively. Temperature ranged from a maximum of 36.0 °C to a minimum of 5.1 °C in 2014, while in 2015, it ranged from 39.3 °C to 19.4 °C. The temperature gradually decreased from April to the end of June in 2014 (c. 70 to 150 DAS—Figure 1), while through the 2015 season, it did not markedly decline. Relative humidity averaged 70% and 68% in 2014 and 2015, respectively. Evapotranspiration (ETo) averaged 4.2 mm/d in 2014 and 5.9 mm/d in 2015 and ranged from 1 to 8.4 mm/d and 1.7 to 8.3 mm/d in 2014 and 2015, respectively, declining during the growing period, more so during the late planted season (data not presnted).
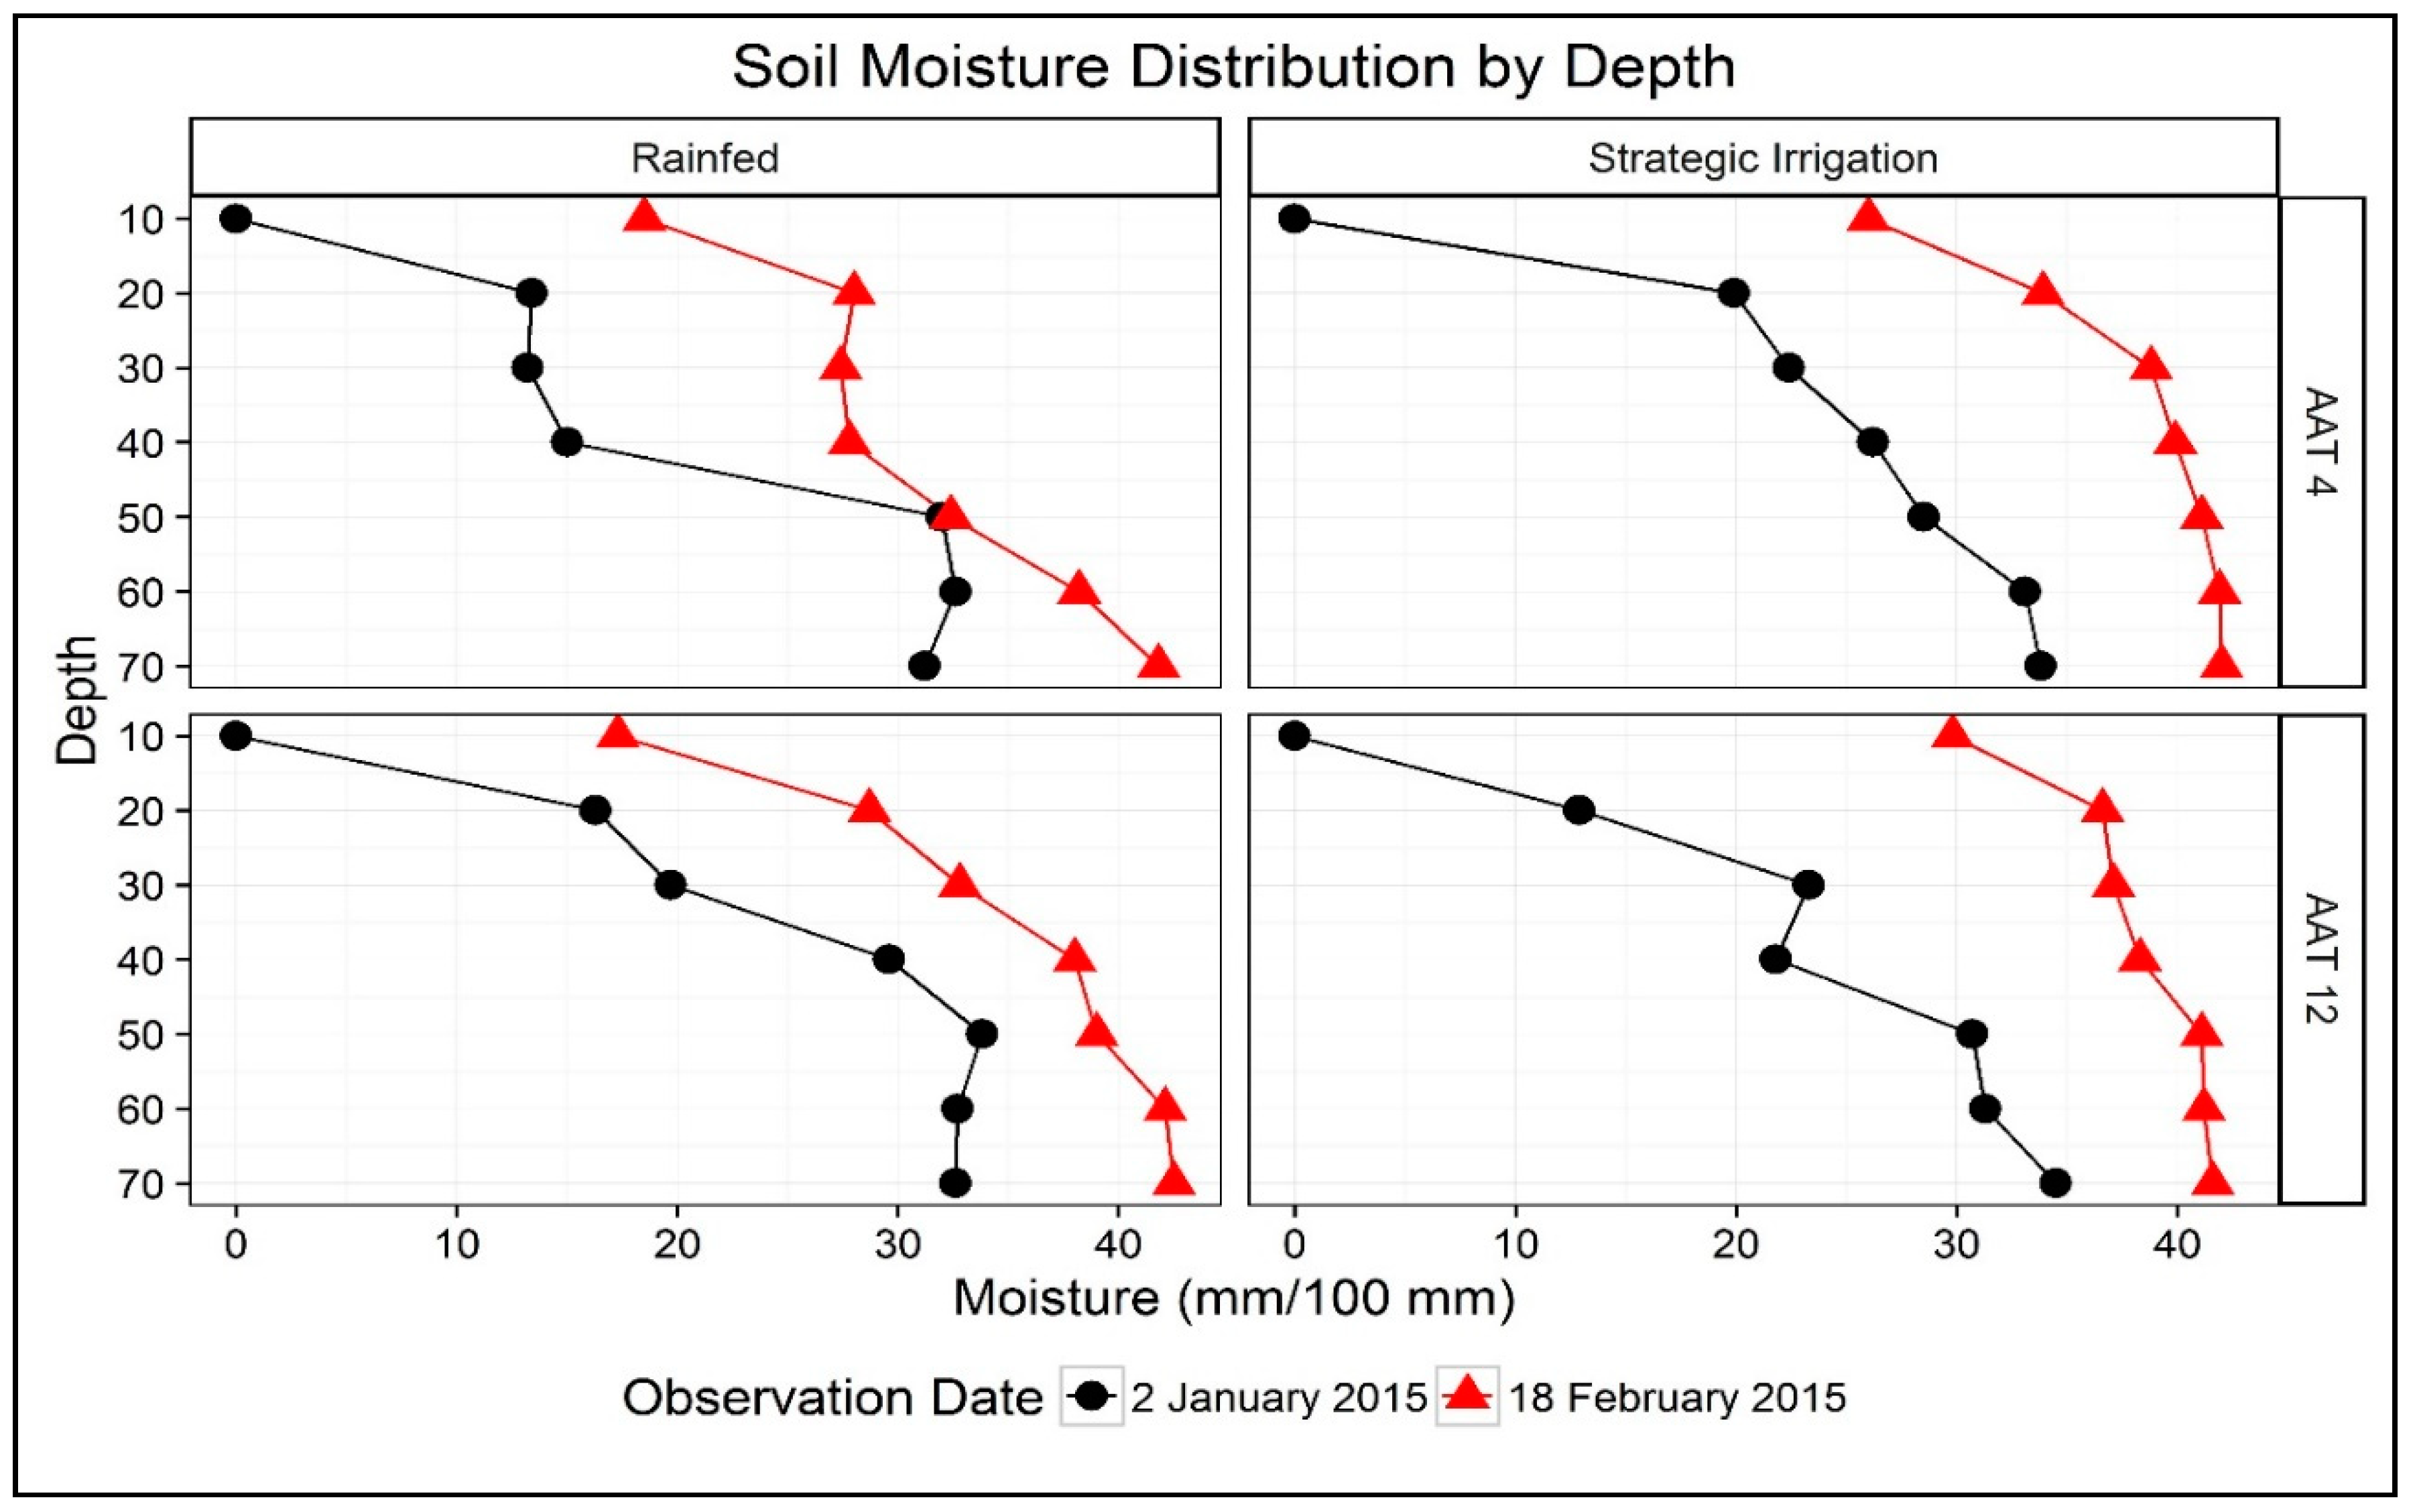
Representative soil moisture measurements taken on 2 January (49 DAS) and 18 February (96 DAS) of 2015 showed greater soil moisture with strategic irrigation and an increasing trend of soil moisture with depth from 10 cm to 50 cm in both rainfed and strategic irrigation treatments, in both an early variety (AAT 4) and a late variety (AAT 12—Figure 2). There was also a tendency in the rainfed treatment for the early variety to draw down soil water more effectively than the late variety.
3.2. Above-Ground Growth and Development and Gas Exchange Parameters
3.2.1. Days to Flowering
Late flowering varieties were on average later in the late planted 2014 (102 DAS) crop as compared with the earlier planted 2015 (96 DAS) crop, whereas earlier flowering varieties were later in 2015 (87 DAS) as compared with 2014 (77 DAS). Mean days to flowering was significantly earlier in 2014 (90 DAS) than in 2015 (92 DAS) (p = 0.002). On average, over both years, early varieties flowered at 82 DAS and late varieties at 99 DAS. Flowering of the late varieties in the late planted 2014 coincided with a period when the minimum temperature fell below 10 °C (Figure 1).
3.2.2. Leaf Area Index
The LAI (presented as at flowering) was significantly higher with strategic irrigation as compared with the rainfed treatment (Table 2). The effect of strategic irrigation on LAI was greater in 2015 than in 2014. Variety LAI depended on the year of experiment. Early flowering varieties (AAT 3, AAT 4, AAT 6, and AAT 19) had significantly higher LAI in the earlier planted 2015 crop compared with the later planted 2014 crop, while all the late varieties had significantly higher LAI in 2014 as compared with 2015 (Table 2).
3.2.3. Leaf Chlorophyll Concentration
Leaf chlorophyll concentration expressed as SPAD readings was not affected by either variety or irrigation in either year (data not presented). The leaf chlorophyll concentration declined significantly over time from flowering to grain filling to maturity (e.g., 47.4 ± 0.62 at 85 DAS, 46 ± 0.56 at 102 DAS, and 34.6 ± 0.83 at 133 DAS in 2014).
3.2.4. Leaf Gas Exchange Parameters and Instantaneous Water Use Efficiency (WUE)
There was no effect of variety nor irrigation on leaf transpiration at any stage in either year (data not presented), except for irrigation at 103 DAS in 2014, i.e., during the flowering period (LSD0.05 = 0.0684), where, surprisingly, transpiration was lower (2.0 mmol/m2/s) in the strategic irrigation treatment compared with 2.4 mmol/m2/s for the control.
Neither variety nor the irrigation treatment had significant effects on stomatal conductance at any stage (data not presented), although there was a tendency (p = 0.051) for gs to be higher in the strategic irrigation treatment at 95 DAS in 2015 (0.12 mol/m2/s vs. 0.05 mol/m2/s for the rainfed treatment).
Photosynthetic rate (A) of the varieties and irrigation treatments did not vary significantly except between irrigation treatments during flowering at 95 DAS in 2015 (p = 0.004), and at the later maturity stage at 133 DAS in 2014 (p = 0.017) (Table 3), when the rate was greater in both instances for the strategic irrigation treatment.
WUE was affected by variety and by year, but no interaction was significant (data not presented). Late varieties AAT 16 (2.73 µmol CO2/mmol H2O) and AAT 12 (2.74 µmol CO2/mmol H2O) had significantly lower WUE (p = 0.017) during the flowering stage compared with other varieties (ranging from 2.96 to 4.13 µmol CO2/mmol H2O), while significantly higher WUE (p = 0.004) was recorded in year 2014 as compared with 2015 (4.24 vs. 2.58 µmol CO2/mmol H2O, respectively). WUE was sizeably greater for strategic irrigation compared with the rainfed treatment (4.17 vs. 2.69 µmol CO2/mmol H2O), but the difference did not quite reach significance (p = 0.064).
3.3. Root Parameters
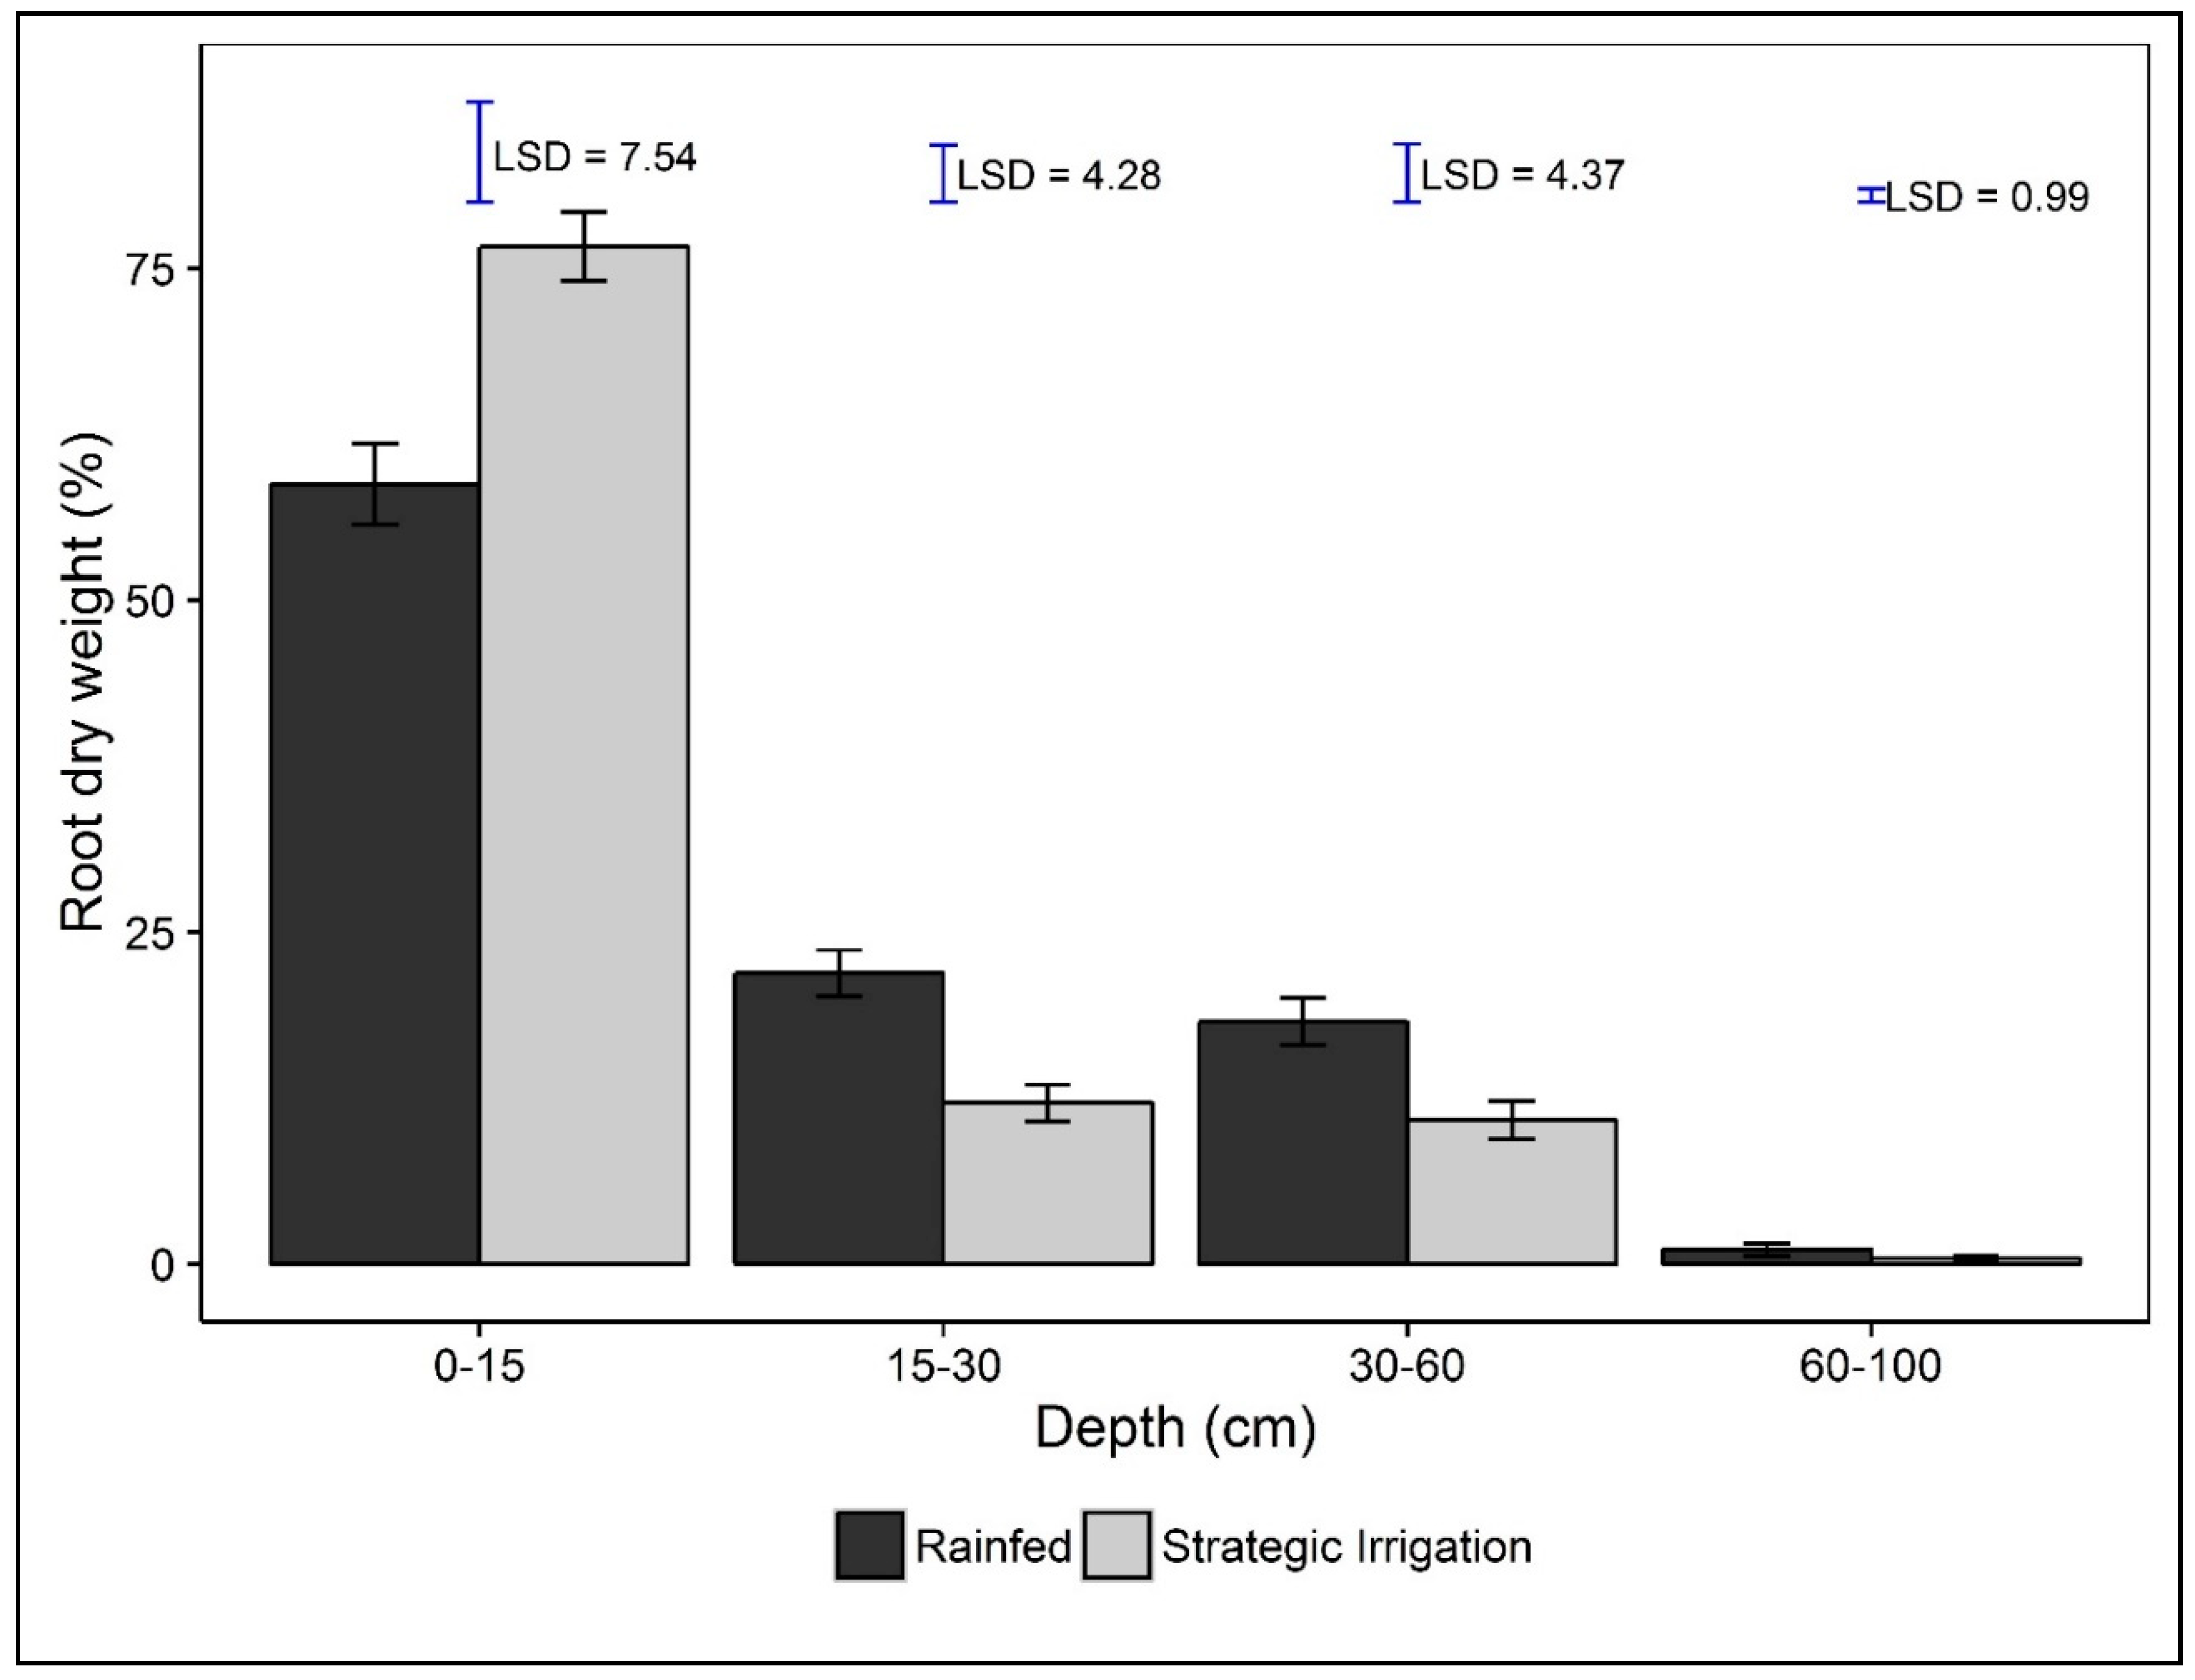
Root parameters were only measured in 2015 and differed among irrigation treatments and varieties; no interactions were significant (Table 4). At the shallowest depth (0–15 cm), RLD was greater for strategic irrigation than if rainfed (108.9 ± 11.03 vs. 76.7 ± 7.10 mm/cm3, p = 0.042) Treatments did not influence other root parameters at that depth. However, under the rainfed treatment, plants invested more heavily in root biomass at a depth of 15–60 cm (Figure 3).
Varieties differed in their RLD, RD, and RWD at a depth of 30–60 cm (Table 4), but these were not significant at other depths. Varieties AAT 12 (15.0 mm/cm3) and AAT 17 (14.2 mm/cm3) had the highest RLD, while variety AAT 6 (4.4 mm/cm3) had the lowest RLD at a depth of 30–60 cm (LSD 0.05 = 3.097). Variety AAT 6 (0.35 mm) had largest root diameter, while AAT 18 (0.19 mm) and AAT 19 (0.19 mm) had the smallest root diameter (LSD 0.05 = 0.1001). Variety AAT 6 (0.08 mg/cm3) had the lowest RWD, while AAT 17 (0.29 mg/cm3) had the highest RWD at a depth of 30–60 cm (LSD 0.05 = 0.0806).
3.4. Yield and Its Components
3.4.1. Straw and Aboveground Biomass Yields
There was no difference between the late planted 2014 or early planted 2015 crop in mean straw or aboveground biomass (straw—5.29 vs. 5.14 in 2014 and 2015, respectively; aboveground biomass—7.61 vs. 7.70 t/ha in 2014 and 2015, respectively). Varieties differed significantly for straw yield (range 4.15 to 6.05; LSD = 0.795 t/ha), but not for aboveground biomass (range 7.17 to 8.21 t/ha; p = 0.56) and strategic irrigation had no significant effect for straw yield, but raised aboveground biomass significantly (8.91 vs. 6.05 t/ha; LSD 0.05 = 1.50), with the effect being largely due to increased grain weight with irrigation. There were no significant interactions between varieties and irrigation for either variable.
3.4.2. Sample Plot Grain Yields
For grain yields each of irrigation and variety, the interaction year by variety and year by irrigation were significant (Table 1). The earlier sowing, i.e., that in 2015, led to a non-significant (p = 0.10) increase in yield and to a greater absolute response to strategic irrigation, and the late varieties yielded relatively more in 2015 than in 2014. Later flowering showed a yield penalty in both irrigated and rainfed treatments, although under rainfed conditions, later flowering had a more prominent negative effect on yield (Table 1).
3.4.3. Harvest Index
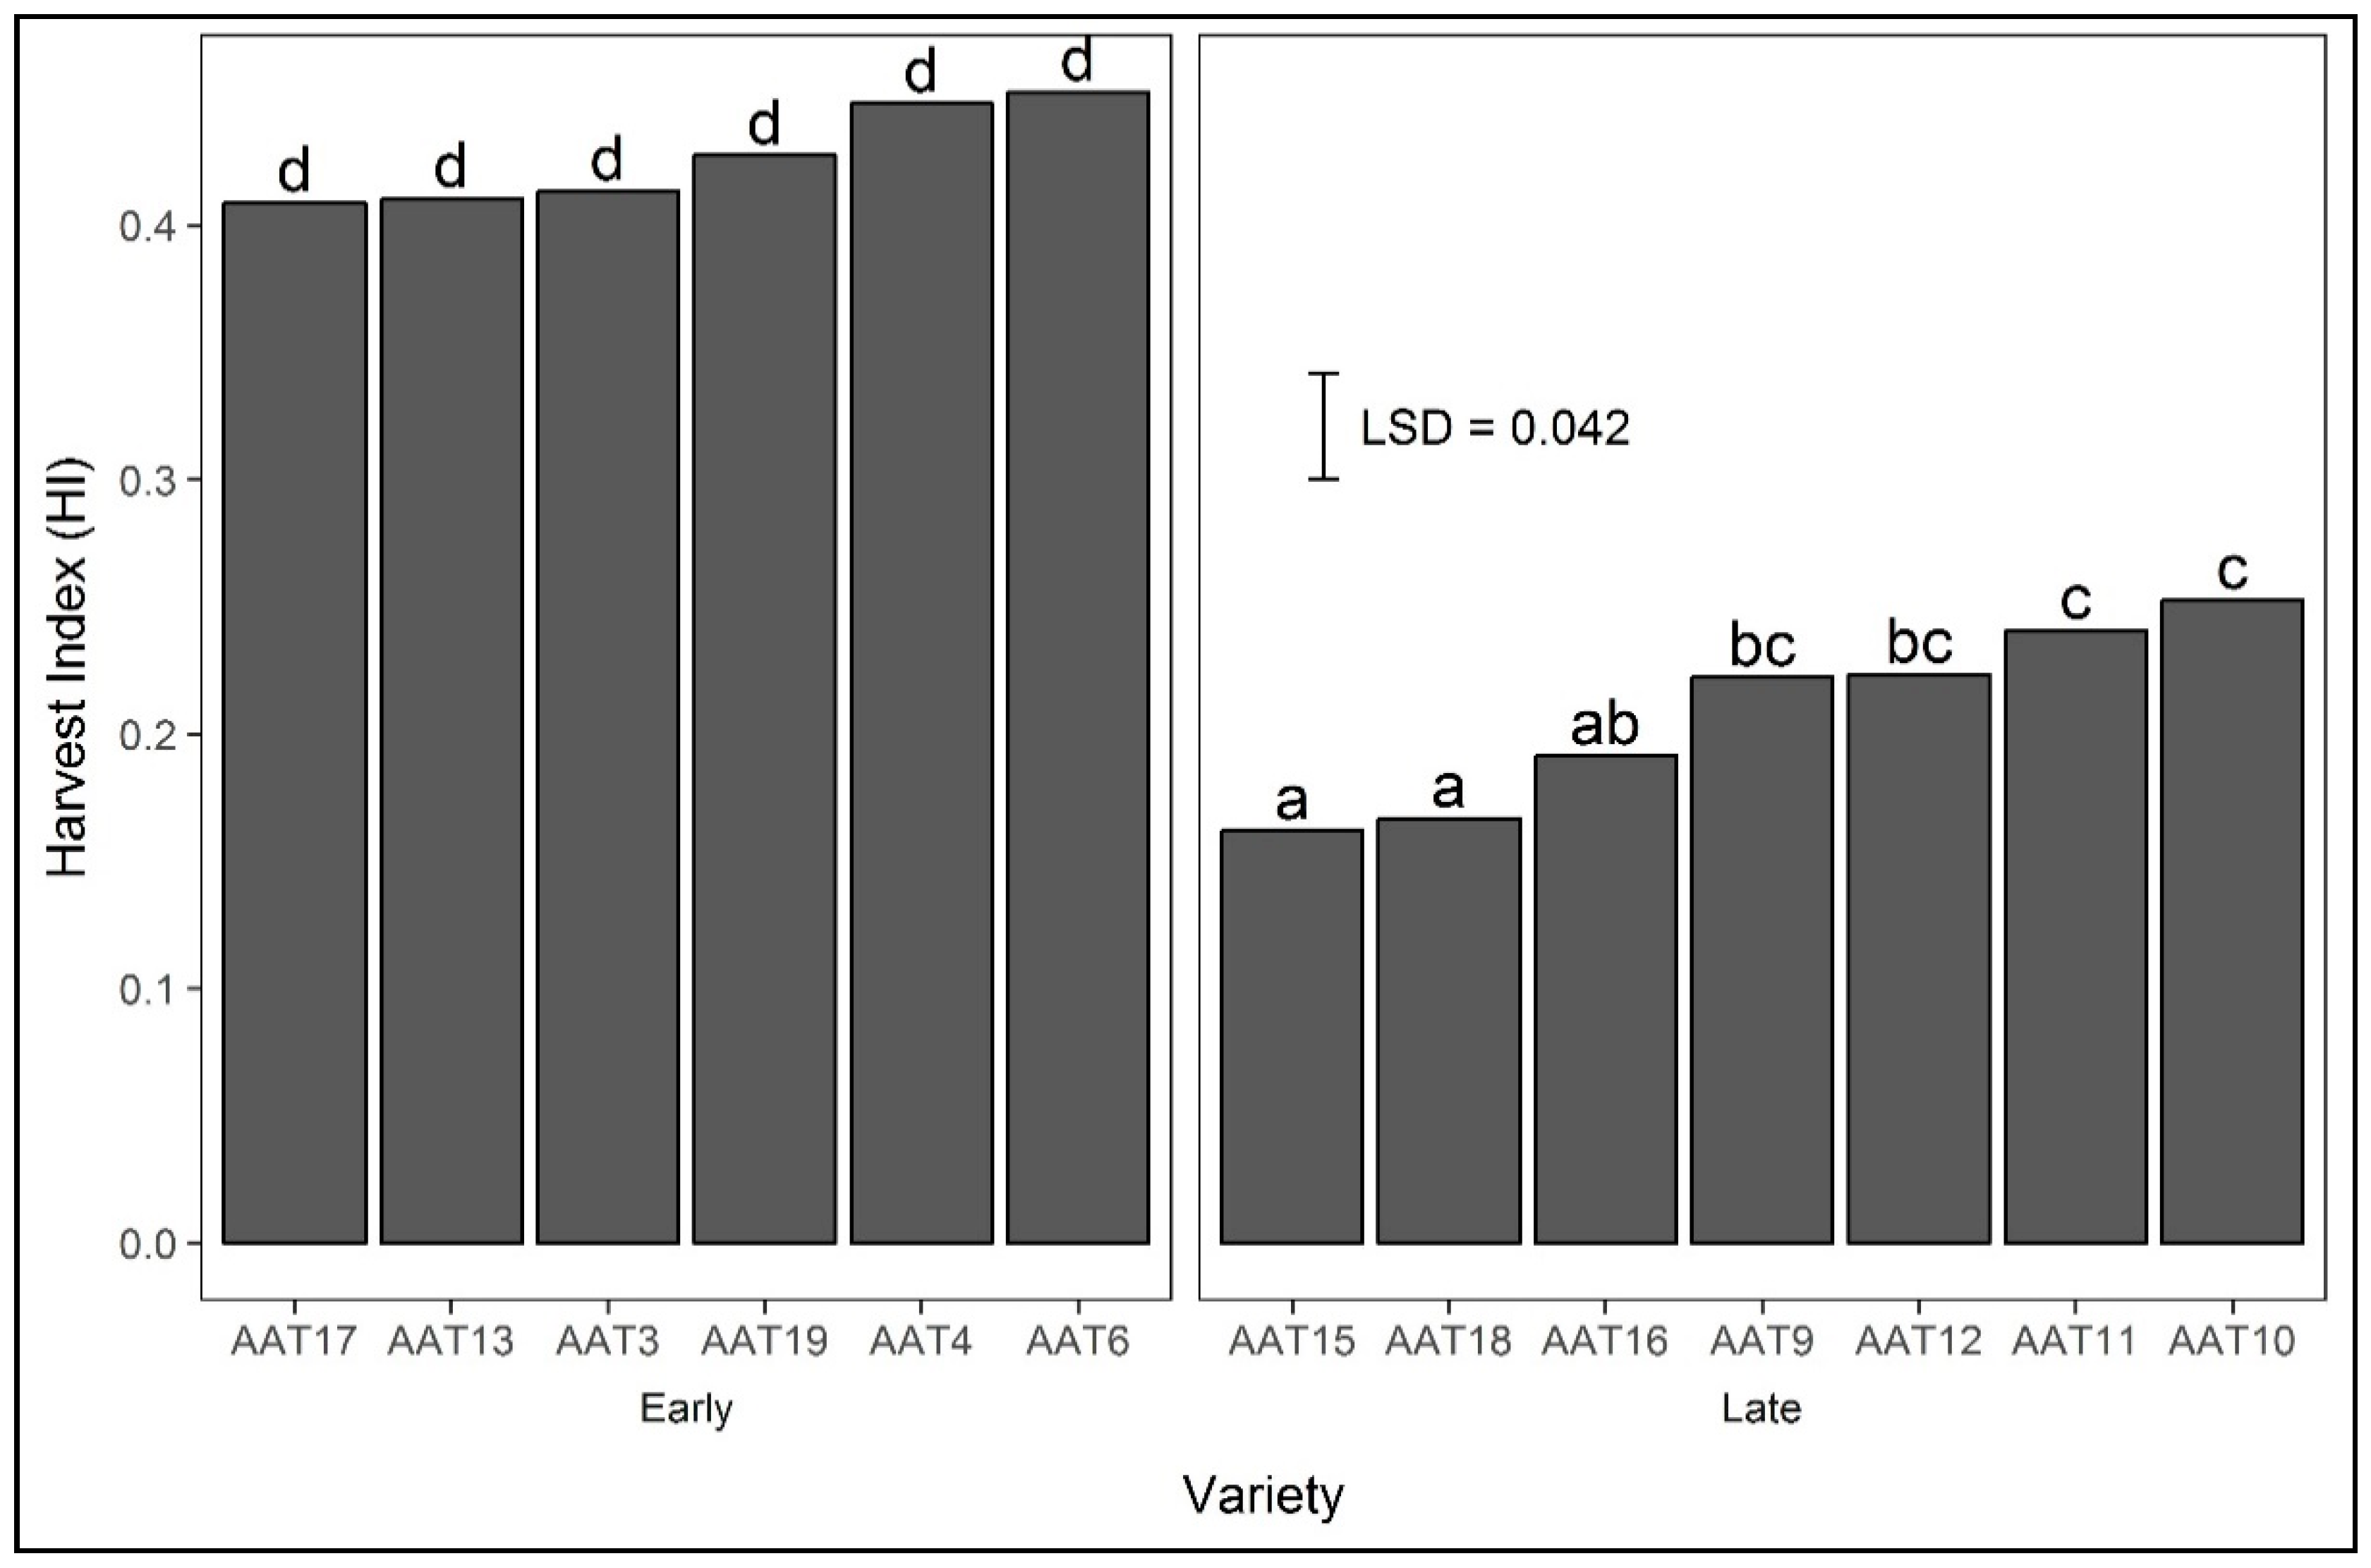
Harvest index was on average greater in 2015 (0.38) than in 2014 (0.29) (LSD 0.05 = 0.041), greater with strategic irrigation (0.41) than rainfed (0.26) (LSD 0.05 = 0.063), and differed between varieties (Figure 4). Late varieties had a lower HI than early varieties (Figure 4), particularly under rainfed conditions (data not presented).
3.4.4. Yield Attributing Parameters
There were significantly more spikelets per panicle in 2014 than in 2015, and with strategic irrigation, and the number differed significantly between varieties. The difference between varieties in spikelets per panicles depended on the year of experiment (p = 0.004); in general, late varieties had many more spikelets per panicle in 2014 than in 2015, whereas early varieties differed less between years (Table 5).
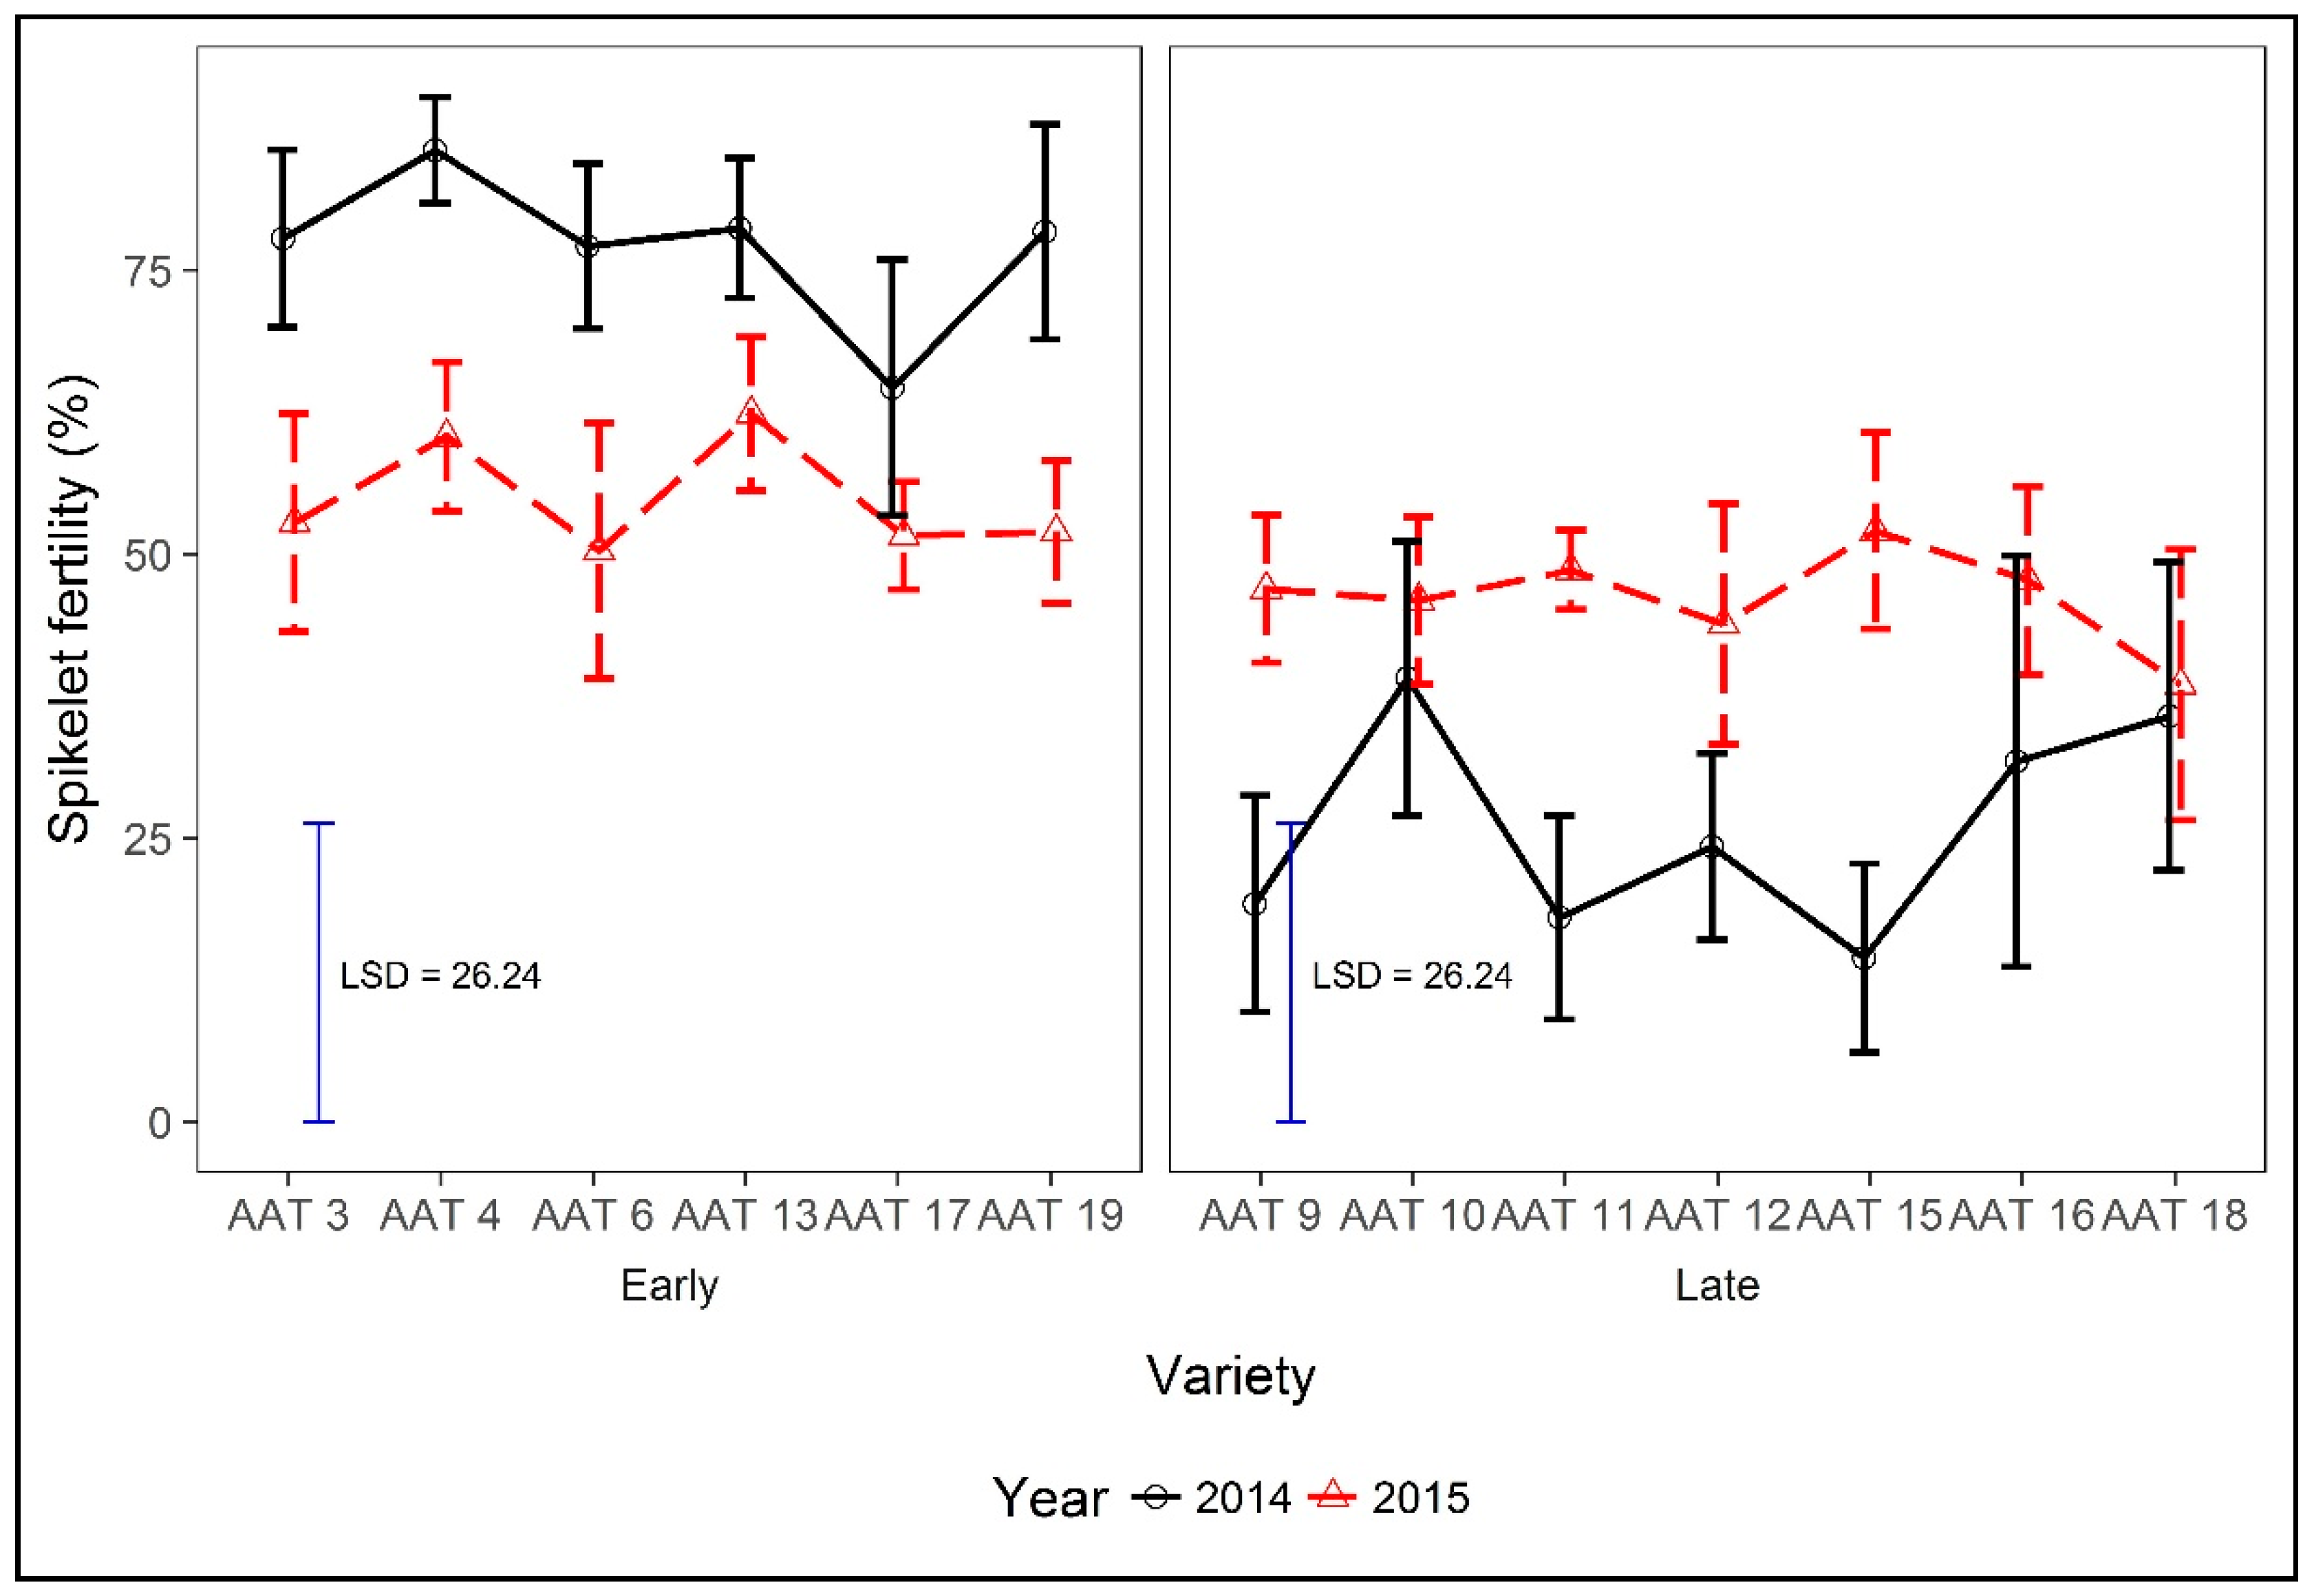
Spikelet fertility differed in absolute terms between irrigation treatments, with across year means of 42% and 58% under rainfed and irrigated conditions, respectively, but the difference did not reach significance. The only significant interaction was between varieties and year (p = 0.006); the fertility percentage of most late varieties was higher in the earlier planted 2015 season than in the later planted 2014 season, whereas that of early varieties was greater in the earlier planted 2014 season (Figure 5).
The 1000 grain weight differed significantly between varieties and was significantly greater with the irrigation treatment (p = 0.009—Table 6), but did not differ between years. Irrigation resulted in a greater increase in 1000 grain weight for late than early varieties, and in 2015 compared with 2014.
The numbers of effective tillers per plant differed between years, varieties, and irrigation (data not presented). Significantly more effective tillers per plant were recorded in 2014 (6.3/plant) as compared with 2015 (4.8/plant) (LSD0.05 = 0.862), and with irrigation than without (6.5 vs. 4.6/plant, LSD0.05 = 1.812). Early varieties AAT 3 and AAT 4 produced significantly more effective tillers per plant (7.4 and 7.7) compared with other varieties (which ranged from 3.9 to 6.5), and in general, the numbers of effective tillers per plant were greater for the earlier than later varieties (data not presented).
3.5. Water Productivity
Water productivity varied significantly by variety, year x variety, irrigation, and year x irrigation (data not presented). Water productivity did not differ between years (0.37 t/ML in 2015 as compared with 0.35 t/ML in 2014, LSD0.05 = 0.11). Strategic irrigation significantly increased the water productivity, with mean water productivity across the years being higher in strategic irrigation (0.49 t/ML) as compared with rainfed conditions (0.23 t/ML) (LSD0.05 = 0.104). All varieties recorded increased water productivity with strategic irrigation, except for AAT 4 (data not presented). The varietal water productivity depended significantly on the irrigation treatment (p = 0.017), and a greater response to strategic irrigation was evident in later varieties (data not presented).
4. Discussion
In summary, all three variables—planting time, maturity class, and strategic irrigation—significantly influenced rice grain yield in the subtropical summer of central Queensland, Australia. Late planting exposed especially the late maturity varieties (i.e., japonica) to unfavourable low temperatures around flowering, and in general, early (i.e., indica) varieties performed better in early and late plantings. Strategic irrigation favoured late varieties if planted early or early varieties whether planted early or late. Final yields were influenced by specific effects of each of the three variables—planting time, maturity class, and strategic irrigation—on phenology, light capture and use in photosynthesis, rooting patterns, spikelet fertility, and other yield determining attributes, all of which also affected water productivity. These effects are discussed in detail below.
4.1. Influence of Planting Time, Maturity Class, and Strategic Irrigation and Phenology on Yields
Firstly, the late planting (i.e., after mid-January) in 2014 resulted in late varieties being subjected to low temperature at flowering and, under the rainfed treatment, to low water availability and to the ensuing exposure to terminal drought, which was more evident in late than early varieties. The similarity between drought- and cold-induced pollen sterility in rice has been reported earlier [27], both stresses disturbing sugar metabolism and tapetum function in anthers. The lower soil moisture during flowering and grain filling of rainfed later varieties also hampers panicle exertion, spikelet fertility, and grain filling [37]. However, yields for the later varieties were low even with strategic irrigation, which minimised the effect of terminal drought, but had no effect on the low-temperature induced sterility. In contrast, early varieties avoided the debilitating effects of low temperature around flowering and, to a lesser extent, low soil moisture during grain filling, hence yields exceeded those of late cultivars, and more so with strategic irrigation.
Others, such as [26], have reported a similar yield penalty with exposure to low temperatures with late planting of sprinkler irrigated rice under south-eastern Queensland conditions (latitude 27.5 °S). Indeed, when rice is exposed to low temperatures prior to and at flowering, the fertility of panicles is reduced, as is grain set per panicle [38]. Microspore and pollen grain formation, which are negatively affected by temperatures below 18 °C [39], take place between 10 and 12 days before anthesis [40] or 5 and 9 days before heading, and even short periods of low temperature (i.e., 15–18 °C for 8–10 d, or 12–13 °C for 3–5 d) at that time can negatively affect fertility because of reduced total pollen production. In our study, the late planting of 2014 exposed late varieties to low night temperatures not before, but around, heading (Figure 1) (below 15 °C for 7 days from 101 DAS to 107 DAS and below 10 °C for 4 days and below 5 °C for 1 day within the same period). This resulted in less grain set with lower fertility percentage (18-35%, Figure 5) and subsequent loss of yield potential compared with 2015 when temperatures around heading did not drop below 20 °C (Figure 1) and percentage fertility was c. 50%. This loss of yield potential in 2014 accords well with the data presented by [41] for irrigated dryland rice in NW Uzbekistan and with [40], who reported that brief low temperature exposure at anthesis was almost as damaging as the same low temperature during microsporogenesis. An analysis of the likelihood of a two-day period of temperatures less than 13 °C in central Queensland, as occurred in April of 2014, with negative effects on spikelet fertility, shows that, over the past 35 years, such an occurrence in April is likely in 20% of the years, whereas in May, almost all years recorded such a low temperature for two consecutive days. Temperatures of 17 °C or less for five consecutive days occurred in c. 30% of years in April, and in all 35 years in May, illustrating the risks of low temperate impacts on fertility in late plantings. Hence the imperative of planting before the solstice to avoid the risks of low temperature around flowering. However, assuming 50 mm rainfall is necessary to allow for germination and 10 days’ growth [42], successful sowing and crop establishment without strategic irrigation would only be possible in October in 22% of years over the period 1985–2019, in 26% in November, and in 45% in December (and 25% in January). However, only for sowings in December in 1990, November and December in 2010, and January in 2013 (i.e., four sowing in 35 years) were follow-up rains of 750 mm achieved (approximately that received with rainfall plus irrigation in both years of experiments and herein considered necessary for a rainfed crop), thus emphasising the need for strategic irrigation.
Secondly, and in contrast to the late-planted 2014 crop, rice varieties during the earlier-planted 2015 crop were not exposed to low temperature before, during, or beyond heading (Figure 1). Nevertheless, in the rainfed treatment, all varieties were exposed to lesser water availability and yields of rainfed varieties were on average only 33% of those with strategic irrigation (Table 1). When comparing late and early flowering varieties, in the absence of a late cold stress and with strategic irrigation, their yields were more similar (4.56 t/ha for early and 3.93 t/ha for late varieties). However, grain yields of rainfed late varieties were considerably less than those with strategic irrigation (83% less), indicative of the drought effect on their yields (Table 1). The effect was more likely related to drought effects on grain set, for at least two reasons. First, there was no significant effect of strategic irrigation on straw yield (although, in 2015, the absolute effect was a 24% increase with strategic irrigation, and a concomitant strong influence on LAI at flowering, Table 2), and second, grain filling should not have been influenced by strategic irrigation, for there was no irrigation applied after the 98 and 99 DAS cyclone (although 1000 grain weight was 11% greater with strategic irrigation, possibly because of the greater reallocation of pre-flowering stem carbohydrate reserves to growing grains). Similar yields of late flowering varieties to early flowering varieties under strategic irrigation in the semiarid tropics of central Queensland were possible, provided that cold stress is avoided.
Thirdly, differences in flowering time between varieties in both years within each of the two maturity classes were negligible and were not responsible for differences in yield between varieties within a maturity class.
Fourthly, the irrigation treatment did not influence days to flowering (data not presented), in line with the data of [43], who found flowering to be delayed by only 3 days by drought. This is in contrast to the findings of [44], who reported that drought stress has a strong (by up to 10 days) delaying effect on flowering time.
As a facultative short-day plant [45], the rice crops would be expected to differ in their time to flower between years with different sowing dates, with fewer days to flower as daylengths shorten when sown after the solstice. Indeed, in the hot tropics, where temperature is relatively constant throughout the year, days to flower is entirely dependent upon daylength [46]. However, in the semi-arid tropics, with a marked cool season, days to flower is not only dependent upon daylength, but also on temperature; cooler temperatures slow development according to the universal temperature effect [37]. As a consequence, the late planting in 2014 would have subjected plants to shorter and shortening daylengths before and at the time of panicle initiation (c. 12 h, at 6–8 weeks after sowing) compared with a relative stable c. 13.5 h at the summer solstice, 6–8 weeks after sowing in 2015, and indeed, for early varieties, flowering was earlier by 11 days in 2014 (Table 7). However, for late varieties, those generally considered as more photoperiod sensitive [47], the reverse was evident (i.e., 8 d later in 2014). This may have been because of the greater low temperature sensitivity of the later indica varieties, for it is well known that japonica can develop at temperatures 2–3 °C lower than indica varieties [48], although [47] report little difference in temperature sensitivity between late and early varieties. Later flowering indica varieties have a longer basal vegetative period (BVP), that is, the duration from sowing to the start of photosensitivity [49], in part responsible for their ‘lateness’, and lower temperature during this period might have delayed development even further, even though indica varieties in general are more photosensitive and would have had a shortened photosensitive phase. Likewise, the period after the photosensitive period [49] might have been lengthened as a result of low temperatures, resulting in a longer duration to flower than in the pre-solstice sowing. Thus, the low temperature delay was greater than the short-day hastening to flowering. The number of days to flower was less for early varieties in 2014 (the planting with shorter daylength overall), and the growing degree days to flowering were also less and much less for the early varieties. Earlier sowing (before the summer solstice in 2014/15) would be expected to delay flowering, leading to a greater number of growing degree days (GDDs) for a flowering event than if sown after the solstice. This was supported by data from our study for both sets of varieties (Table 7). The greater difference of GDDs in 2014 between early varieties and late varieties can be attributed to the interaction between the greater sensitivity of late varieties to the low temperature conditions caused by late planting as compared with the response to temperature in the 2015 sowing. Further studies on the physiological responses of this germplasm to photoperiod and temperature may reveal the mechanisms for control of flowering date and interaction between them for Queensland. As [39] reported in their study in the Riverina region of Australia, the growth duration of the crop was shortened and intercepted radiation was lessened when rice sowing was late (i.e., around or after the summer solstice), and they suggest choosing and sowing new varieties with a greater daylength sensitivity, leading to a greater likelihood that reproductive development take place before any later debilitating effect of low temperature, and thus availing of a wider planting window. A similar response to this was observed in early varieties in Alton Downs, Queensland and the early varieties are thus more suitable for a wider planting window, reducing year to year variation in flowering date and the demand for water during crop growth.
4.2. Effects of Planting Time, Maturity Class, and Strategic Irrigation on Light Capture and Use and the Influence on Yields
Even though strategic irrigation had next to no effect on time to heading, it did have a strong positive effect on leaf area expansion and LAI at flowering and on yield, more so in 2015 than in 2014 (Table 1 and Table 2). The later (6 d) flowering and thus longer growth duration of late varieties with the later 2014 planting (Table 7) led to greater LAI than in 2015 (Table 2), but because of the overriding effect of fertility on yield in 2014, subject to low temperature and in the rainfed treatment to low water availability, there was no relationship across years between LAI and yield. In 2015, when fertility of the late varieties was not suppressed by low temperature, yield was related to LAI (r = 0.79 **). This is in agreement with [50,51], who reported that LAI measured during flowering was directly related to rice grain yield. Differences between varieties in LAI within the early or late flowering group were not due to maturity within a class, but due most likely to genetic differences, and differences between varieties in LAI between years were not related to yield. For example, varieties AAT 3, 4, 6, 19 had greater LAI in 2015 (Table 2), but yields were the same in 2015 and 2014 (Table 1), and others, e.g., AAT 17, had similar LAI at flowering in each year, but differed in yield between years.
Certainly, strategic irrigation raised soil moisture compared with rainfed conditions prior to flowering (e.g., Figure 2); therefore, the positive effect of strategic irrigation on LAI measured at flowering (and presumably on pre-flowering biomass) was significant (Table 2). Irrigation likewise significantly raised the number of effective tillers, which ultimately contributed to the higher LAI, but irrigation did not influence the total number of tillers (6.6 tillers per plant for rainfed and 6.8 tillers per plant with strategic irrigation).
Flag leaf area is considered important for yield as it is an important factor determining the photosynthetic output by influencing the photosynthetic area; indeed, [52] reported a significant correlation between yield and flag leaf area, but such a relationship was not noted in our experiments. Smaller leaves had higher A during the flowering stage (r = −0.38 ***). Across years, however, flag leaf area was positively correlated with quantity of strategic irrigation (r = 0.52 ***) and negatively with instantaneous WUE (r = −0.50 ***) during the flowering stage.
Across years, varieties, and irrigation treatments, there was significant positive correlation between yield and gas exchange parameters measured at flowering, e.g., for A (r = 0.60 ***), gs (r = 0.50 ***), and E (r = 0.40 ***). Similar correlations were evident when analysing the within-year data, more so for 2015. For example, the correlation between yield and A was r = 0.64 *** for 2014 and r = 0.74 *** for 2015, although the effect was mainly due to differences between with or without strategic irrigation. We did not find intrinsic differences between the late flowering japonica and early flowering indica varieties in rates of photosynthesis, in agreement with [53], but in contrast with the results of [54]. Centritto et al. [7] reported that drought stress is significantly correlated with the effects on A, as varieties with higher photosynthesis and conductance, presumably because they could access more soil water reserves, were more productive under all moisture conditions. Indeed, being able to maintain mesophyll, and not stomatal, conductance under water deficits largely determined tolerance to drought [55]. One of our promising high yielding varieties, AAT 3, had a higher A during the flowering and grain filling period in both strategic irrigation and rainfed treatments in both years. Enhanced instantaneous water use efficiencies in our study across years, irrigation treatments, and varieties were associated with a high A (r = 0.79 ***) rather than a low E (r = 0.02 ns). The higher WUE was thus due to higher A than a reduced E, akin to the ‘capacity’ types of [25]. The higher WUE at the cooler time of the year in 2014 when WUE was measured (at flowering time, Figure 1) was presumably due to the lower vapour pressure deficit (VPD), but in contrast, later varieties that would have flowered in a slightly lower temperature and VPD regime than earlier varieties had similar or lower WUE. QTLs have been identified for rice photosynthesis rates using an indica/japonica double haploid cross [56], a good starting point for selecting for high rates of photosynthesis. In a study using lines from an introgression line population [57], virtual ideotypes improved A and transpiration efficiency (TE, i.e., instantaneous water use efficiency) by 17 and 25%, respectively, over the best investigated, and their analysis showed the possibility of simultaneously improving A and TE.
4.3. Effects of Planting Time, Maturity Class, and Strategic Irrigation on Root Growth and the Influence on Yields
Root properties represented by greater root length density and deeper root systems are considered as target traits for drought tolerance [58]. Chang and Vergara [59] reported that a long and deep root system correlated with drought tolerance in upland or aerobic rice varieties. In our study, in 2015, rooting traits were quantified, and all varieties were deep rooted and had root systems reaching deeper than 60 cm.
Root characteristics such as root dry weight (RDW) at 0–15 cm were more closely correlated with yield (RDW and yield, r = 0.48 ***), HI (RDW and HI, r = 0.60 ***), and water productivity (RDW and water productivity, r = 0.80 ***) when we analysed the combined data for strategic irrigation and rainfed, but not when analysing the responses under rainfed conditions only. The strong correlation between irrigation applied and RDW at 0–15 cm (r = 0.80 ***) is directly due to the effect of water supply to that region. At 0–15 cm, roots of the irrigated crop could access more moisture supplied through surface drip irrigation, receiving 1.89 ML/ha more than from rainfed conditions in 2015 (Figure 1). This favoured yield for the irrigated crop by confining and expanding more of its roots for better water extraction in the topsoil (at 0–15 cm, Figure 3), resulting in a significant contribution to yield. This agrees with data of [60], who showed that, when watered or re-watered from the surface, rice plants in pots took up very little water from the subsoil. They suggested that water uptake for the subsoil occurred only when water in the topsoil was less than −190 kPa. Such development plasticity triggered by mild drought stress is important in enhancing the efficiency of water uptake and biomass production in rice [61].
4.4. Effects of Planting Time, Maturity Class, and Strategic Irrigation on Spikelet Fertility, and Other Yield Determining Attributes and the Influence on Yields
The number of spikelets per panicle and the number of panicles per plant are determined well before flowering, but the fertility of spikelets, in particular functional pollen, is determined during the 10 days before and around flowering. Strategic irrigation did improve the number of spikelets per panicle (Table 5), in accordance with the data of [63], and averaged over both years increased spikelet fertility of all varieties, on average by 36%.
With the later, cooler, planting in 2014, on average, the total number of effective tillers per plant and number of spikelets per panicle were greater than in 2015, the latter by three times. Large numbers of spikelets per panicle have been reported to reduce the amount of pollen per anther [64], which might also reduce the fertility of spikelets. Moreover, late flowering varieties, across both years and irrigation treatments, although having more spikelets per panicle than early varieties, had greater numbers of unfilled grains per panicle (data not presented) and a lower harvest index (Figure 4). Early varieties had slightly higher spikelet fertility in 2014 than in 2015 (Figure 5). Early varieties in 2014 flowered at 76 DAS and received rainfall up until 85 DAS (during flowering), whereas in 2015, early varieties flowered in 87 DAS and received rainfall only until 83 DAS. The next rainfall in 2015 was at 97 DAS, hence flowering and post-flowering drought stress may have reduced fertility somewhat in 2015. For late varieties in 2014, a shortage of rainfall during the flowering stage (Figure 1) created drought, as evidenced by the rainfall record of only 11.6 mm from 100 to 130 DAS. In contrast, in 2015, 174.4 mm of rainfall was recorded for the same growth stage.
The onset of drought during the flowering stage of late varieties had an effect on spikelet sterility and grain filling. The correlation across varieties years and treatments between spikelet fertility and grain yield was highly significant in both years (r = 0.73 *** in 2014 and r = 0.53 *** in 2015), as was the correlation between yield and harvest index (r = 0.93 *** in 2014 and r = 0.81 *** in 2015). Spikelet sterility of up to 73% has been reported by [65], while [66] reported up to 98% sterility due to terminal drought. Our values for early varieties were not so affected. Early varieties such as AAT 4 recorded up to 90% and 85% fertility under rainfed condition in 2014 and 2015, respectively, compared with late varieties such as AAT 15, which recorded 1.4% fertility under rainfed conditions in 2014 and 39% in 2015. The harvest index was, therefore, highly influenced by spikelet fertility (compare data in Figure 4 and Figure 5). In addition to the effects on pollen fertility, the lower spikelet fertility under rainfed conditions could also be due to a reduced assimilate availability and slower panicle exertion due to water stress, leading to fewer grains setting and a high proportion of abortion, as reported by [67,68].
The effect of planting time on 1000 grain weight was not significant (Table 6), in contrast to the effect of planting time on number of numbers of effective tillers per plant (4.8 vs. 6.3 /plant, up by 31% in late planted 2014) and yield (2.32 vs. 2.80 t/ha, up by 21% in early planted 2015). Likewise, the effect of irrigation treatment on 1000 grain weight was conservative (strategic irrigation raised it, albeit significantly by 7%, from 22.4 to 24.0 g/1000 grains), compared with its effects on numbers of effective tillers per plant (4.6 vs. 6.5 /plant, up by 41%) and yield (1.405 vs. 3.715 t/ha, up by 164%). Late indica varieties in general had lower 1000 grain weight (c. 21 vs. c. 27 g), as reported earlier in the literature (e.g., [69]). The values were consistent across years and irrigation treatments and may reflect the contribution of remobilised non-structural carbohydrates from stems to developing grains, capitalising upon conditions that favour pre-heading growth [70].
When there is the occurrence of late season drought during flowering and grain filling under rainfed conditions, as in 2014, early flowering varieties have an advantage over late varieties and escape the drought. The varieties with delayed flowering (i.e., with a long BVP and more sensitive to the cold) were more susceptible to drought stress and recorded greater decreases in grain yield and HI compared with early varieties (Table 1 and Figure 4). Prolonged drought under rainfed conditions resulted in lower yield and a decreased HI in late varieties as compared with early varieties. A similar relationship of reduction in HI with the onset of terminal drought in late flowering varieties was reported, showing a subsequent reduction in yield. As expected, based on the differential responses of straw yield (raised by 22%) and aboveground biomass (raised by 55%) to strategic irrigation, strategic irrigation raised HI consistently in both years (from 0.22 to 0.36 in 2014 and from 0.29 to 0.46 in 2015), with late varieties benefitting more from strategic irrigation than early varieties, especially in the late planted 2014 (data not presented).
Yields with strategic irrigation in the current study of the semi-arid tropics of central Queensland were similar to those of [71], who recorded grain yield of 4.0–5.7 t/ha under irrigated aerobic conditions in the dry season in the Philippines. During wet seasons with supplemental sprinkler irrigation [72], centre pivot [73], flooded irrigation [74], piped irrigation [75], or under rainfed condition [76], yields of more than 8 t/ha have been recorded, albeit with soil moisture content maintained at close to field capacity, whereas our strategic irrigation treatments were allowed to dry out to temporary wilting before strategic irrigation was supplied.
5. Conclusions
We thus conclude that acceptable rice grain yields up to 5 t/ha can be achieved with strategic irrigation when enabling early season sowing and avoidance of late season detrimental cool temperatures. Yields were related to the rates of leaf photosynthesis, but this was due to higher yields and rates of photosynthesis in the strategic irrigation treatment. Under rainfed conditions, differences in root properties between varieties were not related to grain yield. Late low temperatures are the biggest constraint to the successful production of rice in the semi-arid tropics of central Queensland and most likely elsewhere with similar climates, and to avoid these early planting is essential. Thus, in 33 of the past 35 years, strategic irrigation would be necessary to establish an early crop and to supply sufficient water through crop growth. Rainfed early maturing varieties would be able to avoid harmful cool temperatures just prior to and during flowering, and to avoid later season drought, but yields would rarely exceed 3 t/ha. Those of late maturing varieties would barely reach 1 t/ha without, yet exceed 4 t/ha with strategic irrigation.
Author Contributions
Conceptualization, S.P.B., D.J.M., and S.S.; methodology, X.X.; software, X.X.; validation, S.P.B., D.J.M., and S.S.; formal analysis, S.S.; investigation, S.S. and S.P.B.; resources, S.P.B.; data curation, S.P.B.; writing—original draft preparation, S.S.; writing—review and editing, S.P.B. and D.J.M.; visualization, D.J.M.; supervision, S.P.B.; project administration, S.P.B.; funding acquisition, S.P.B. All authors have read and agreed to the published version of the manuscript.
Funding
The scholarship to SS for this research was provided by CQUniversity and Agriventis Technologies Pty Ltd., then AAT.
Acknowledgments
The seed materials for trials were all accessed from AAT. Thanks are due to collaborating grower, Peter Foxwell, for his help and support by hosting and managing irrigation for the trials.
Conflicts of Interest
The authors declare no conflict of interest. The funders had no role in the design of the study; in the collection, analyses, or interpretation of data; in the writing of the manuscript; or in the decision to publish the results.
References
- George, T.; Magbanua, R.; Order, W.; Van Keer, K.; Trébuil, G.; Reoma, V. Upland rice response to phosphorus fertilization in Asia. Agron. J. 2001, 93, 1362–1370. [Google Scholar] [CrossRef]
- Huaqi, W.; Bouman, B.; Zhao, D.; Changgui, W.; Moya, P. Aerobic rice in northern China: Opportunities and challenges. In Water-Wise Rice Production; Bouman, B.A.M., Hengsdijk, H., Hardy, B., Bindraban, P.S., Tuong, T.P., Ladha, J.K., Eds.; International Rice Research Institute: Los Baños, Philippines, 2002; pp. 143–154. [Google Scholar]
- George, T.; Magbanua, R.; Garrity, D.P.; Tubana, B.S.; Quiton, J. Rapid yield loss of rice cropped successively in aerobic soil. Agron. J. 2002, 94, 981–989. [Google Scholar] [CrossRef]
- Datta, S.K.; Krupp, H.K.; Alvarez, E.I.; Modgal, S.C. Water management in flooded tropical rice. In Water Management in Philippine Irrigation Systems: Research and Operations; International Rice Research Institute: Los Baños, Philippines, 1973; pp. 1–18. [Google Scholar]
- Wang, H.; Siopongco, J.; Wade, L.J.; Yamauchi, A. Fractal analysis on root systems of rice plants in response to drought stress. Env. Exp. Bot. 2009, 65, 338–344. [Google Scholar] [CrossRef]
- Long, S.P.; Zhu, X.G.; Naidu, S.L.; Ort, D.R. Can improvement in photosynthesis increase crop yields? Plant Cell Environ. 2006, 29, 315–330. [Google Scholar] [CrossRef] [PubMed]
- Centritto, M.; Lauteri, M.; Monteverdi, M.C.; Serraj, R. Leaf gas exchange, carbon isotope discrimination, and grain yield in contrasting rice genotypes subjected to water deficits during the reproductive stage. J. Exp. Bot. 2009, 60, 2325–2339. [Google Scholar] [CrossRef] [PubMed]
- Dingkuhn, M.; Farquhar, G.; De, D.S.; O’Toole, J.; Datta, S. Discrimination of 13C among upland rices having different water use efficiencies. Aust. J. Agric. Res. 1991, 42, 1123–1131. [Google Scholar] [CrossRef]
- Xu, Y.; This, D.; Pausch, R.C.; Vonhof, W.M.; Coburn, J.R.; Comstock, J.P.; McCouch, S.R. Leaf-level water use efficiency determined by carbon isotope discrimination in rice seedlings: Genetic variation associated with population structure and QTL mapping. Theor. Appl. Genet. 2009, 118, 1065–1081. [Google Scholar] [CrossRef]
- Sinclair, T.R. Effective water use required for improving crop growth rather than transpiration efficiency. Front. Plant Sci. 2018, 9, 1442. [Google Scholar] [CrossRef]
- Serraj, R.; Dimayuga, G.; Gowda, V.; Guan, Y.; He, H.; Impa, S.; Liu, D.; Mabesa, R.; Sellamuthu, R.; Torres, R. Drought-resistant rice: Physiological framework for an integrated research strategy. In Drought Frontiers in Rice: Crop Improvement for Increased Rainfed Production; Serraj, R., Bennett, J., Hardy, B., Eds.; World Scientific Publishing: Los Banos, Philippines, 2008; pp. 139–170. [Google Scholar]
- Chaves, M. Effects of water deficits on carbon assimilation. J. Exp. Bot. 1991, 42, 1–16. [Google Scholar] [CrossRef]
- Lawlor, D.W.; Cornic, G. Photosynthetic carbon assimilation and associated metabolism in relation to water deficits in higher plants. Plant Cell Env. 2002, 25, 275–294. [Google Scholar] [CrossRef] [Green Version]
- Ekanayake, I.J.; De Datta, S.K.; Steponkus, P.L. Spikelet sterility and flowering response of rice to water stress at anthesis. Ann. Bot. 1989, 63, 257–264. [Google Scholar] [CrossRef]
- Murchie, E.H.; Chen, Y.; Hubbart, S.; Peng, S.; Horton, P. Interactions between senescence and leaf orientation determine in situ patterns of photosynthesis and photoinhibition in field-grown rice. Plant Physiol. 1999, 119, 553–564. [Google Scholar] [CrossRef] [PubMed] [Green Version]
- Yoshida, S. Fundamentals of Rice Crop Science; International Rice Research Institute: Los Baños, Philippines, 1981. [Google Scholar]
- Dingkuhn, M.; De, D.S.; Dorffling, K.; Javellana, C.; Datta, S. Varietal differences in leaf water potential, leaf net CO2 assimilation, conductivity and water use efficiency in upland rice. Aust. J. Agric. Res. 1989, 40, 1183–1192. [Google Scholar] [CrossRef]
- Kashiwagi, J.; Krishnamurthy, L.; Gaur, P.M.; Upadhyaya, H.D.; Varshney, R.K.; Tobita, S. Traits of relevance to improve yield under terminal drought stress in chickpea (Cicer arietinum L.). Field Crops Res. 2013, 145, 88–95. [Google Scholar] [CrossRef] [Green Version]
- Reddy, S.H.; Kambalimath, S.K.; Singhal, R.K.; Chikkakariyappa, M.K.; Muthurajan, R.; Rajanna, M.P.; Sreevathsa, R.; Sevanthi, A.M.; Mohapatra, T.; Sarla, N.; et al. Allele-specific analysis of single parent backcross populationidentifies HOX10 transcription factor as a candidate gene regulating rice root growth. Physiol. Plant 2019, 166, 596–611. [Google Scholar] [CrossRef] [Green Version]
- Ekanayake, I.J.; O’Toole, J.C.; Garrity, D.P.; Masajo, T.M. Inheritance of root characters and their relations to drought resistance in rice. Crop Sci. 1985, 25, 927–933. [Google Scholar] [CrossRef]
- Kumar, N.; Nandwal, A.S.; Waldia, R.S.; Singh, S.; Devi, S.; Sharma, K.D.; Kumar, A. Drought tolerance in chickpea as evaluated by root characteristics, plant water status, membrane integrity and chlorophyll fluorescence techniques. Exp. Agric. 2012, 48, 378–387. [Google Scholar] [CrossRef]
- Hund, A.; Ruta, N.; Liedgens, M. Rooting depth and water use efficiency of tropical maize inbred lines, differing in drought tolerance. Plant Soil 2009, 318, 311–325. [Google Scholar] [CrossRef] [Green Version]
- Hirayama, M.; Wada, Y.; Nemoto, H. Estimation of drought tolerance based on leaf temperature in upland rice breeding. Breed. Sci. 2006, 56, 47–54. [Google Scholar] [CrossRef] [Green Version]
- White, J.W.; Castillo, J.A.; Ehleringer, J. Associations between productivity, root growth and carbon isotope discrimination in Phaseolus vulgaris under water deficit. Funct. Plant Biol. 1990, 17, 189–198. [Google Scholar] [CrossRef]
- Impa, S.; Nadaradjan, S.; Boominathan, P.; Shashidhar, G.; Bindumadhava, H.; Sheshshayee, M. Carbon isotope discrimination accurately reflects variability in WUE measured at a whole plant level in rice. Crop Sci. 2005, 45, 2517–2522. [Google Scholar] [CrossRef]
- Fukai, S.; Inthapan, P. Growth and yield of rice cultivars under sprinkler irrigation in south-eastern Queensland. 1. Effects of sowing time. Aust. J. Exp. Agric. 1988, 28, 237–242. [Google Scholar] [CrossRef]
- Oliver, S.N.; Van Dongen, J.T.; Alfred, S.C.; Mamun, E.A.; Zhao, X.; Saini, H.S.; Fernandes, S.F.; Blanchard, C.L.; Sutton, B.G.; Geigenberger, P.; et al. Cold-induced repression of the rice anther-specific cell wall invertase gene OSINV4 is correlated with sucrose accumulation and pollen sterility. Plant Cell Env. 2005, 28, 1534–1551. [Google Scholar] [CrossRef]
- Challagulla, V.; Bhattarai, S.; Midmore, D. In-vitro vs in-vivo inoculation: Screening for resistance of Australian rice genotypes against blast fungus. Rice Sci. 2015, 22, 132–137. [Google Scholar] [CrossRef] [Green Version]
- Bureau of Meteorology. Climate data online. Bureau of Meteorology, Australian Government, 2016. Available online: https://www.ncdc.noaa.gov/cdo-web/ (accessed on 23 September 2018).
- Gomez, K.A.; Gomez, A.A. Statistical Procedures for Agricultural Research, 2nd ed.; John Wiley & Sons: New York, NY, USA, 1984. [Google Scholar]
- Gardner, E.A.; Coughlan, K.J.; Silburn, D.M. Soil water measurement and management on Vertisols in Queensland, Australia. In Management of Vertisols in Sub-Saharan Africa; Jutzi, S.C., Haque, I., McIntire, J., Stares, J.E.S., Eds.; International Livestock Centre for Africa: Nairobi, Kenya, 1988. [Google Scholar]
- Bioversity International, IRRI, WARDA. Descriptors for Wild and Cultivated Rice (Oryza spp.); Bioversity International: Rome, Italy; International Rice Research Institute: Los Baños, Philippines; WARDA, Africa Rice Center: Cotonou, Benin, 2007. [Google Scholar]
- Yoshida, S.; Forno, D.A.; Cock, J.; Gomez, K.A. Laboratory Manual for Physiological Studies of Rice; International Rice Research Institute: Los Baños, Philippines, 1976. [Google Scholar]
- Palaniswamy, K.M.; Gomez, K.A. Length-width method for estimating leaf area of rice. Agron. J. 1974, 66, 430–433. [Google Scholar] [CrossRef]
- Kumar, A.; Guha, A.; Bimolata, W.; Reddy, A.R.; Laha, G.S.; Sundaram, R.; Pandey, M.K.; Ghazi, I.A. Leaf gas exchange physiology in rice genotypes infected with bacterial blight: An attempt to link photosynthesis with disease severity and rice yield. Aust. J. Crop Sci. 2013, 7, 32–39. [Google Scholar]
- Yang, C.; Yang, L.; Yang, Y.; Ouyang, Z. Rice root growth and nutrient uptake as influenced by organic manure in continuously and alternately flooded paddy soils. Agric. Water Manag. 2004, 70, 67–81. [Google Scholar] [CrossRef]
- Fukai, S. Phenology in rainfed lowland rice. Field Crops Res. 1999, 64, 51–60. [Google Scholar] [CrossRef]
- Gunawardena, T.A.; Fukai, S.; Blamey, F.P.C. Low temperature induced spikelet sterility in rice. I. Nitrogen fertilisation and sensitive reproductive period. Aust. J. Agric. Res. 2003, 54, 937–946. [Google Scholar] [CrossRef]
- Farrell, T.; Fukai, S.; Williams, R. Minimising cold damage during reproductive development among temperate rice genotypes. I. Avoiding low temperature with the use of appropriate sowing time and photoperiod-sensitive varieties. Aust. J. Agric. Res. 2006, 57, 75–88. [Google Scholar] [CrossRef]
- Martinez-Eixarch, M.; Ellis, R.H. Temporal sensitivities of rice seed development from spikelet fertility to viable mature seed to extreme-temperature. Crop Sci. 2015, 55, 354–364. [Google Scholar] [CrossRef] [Green Version]
- Devkota, K.; Manschadi, A.; Lamers, J.; Humphreys, E.; Devkota, M.; Egamberdiev, O.; Gupta, R.; Sayre, K.; Vlek, P. Growth and yield of rice (Oryza sativa L.) under resource conservation technologies in the irrigated drylands of Central Asia. Field Crops Res. 2013, 149, 115–126. [Google Scholar] [CrossRef]
- Morris, R.A.; Rumbaoa, F.M., Jr. Rainfall recurrence analysis for extrapolating rice-based cropping patterns. In Proceedings of the A Symposium on the Agrometeorology of the Rice Crop; WMO-IRRI Symposium: Los Baños, Philippines, 1979; pp. 223–233. [Google Scholar]
- Zhao, D.L.; Atlin, G.N.; Amante, M.; Cruz, M.T.S.; Kumar, A. Developing aerobic rice cultivars for water-short irrigated and drought-prone rainfed areas in the tropics. Crop Sci. 2010, 50, 2268–2276. [Google Scholar] [CrossRef]
- Pantuwan, G.; Fukai, S.; Cooper, M.; Rajatasereekul, S.; O’Toole, J.C. Yield response of rice (Oryza sativa L.) genotypes to drought under rainfed lowlands: 2. Selection of drought resistant genotypes. Field Crops Res. 2002, 73, 169–180. [Google Scholar] [CrossRef]
- Song, Y.; Gao, Z.; Luan, W. Interaction between temperature and photoperiod in regulation of flowering time in rice. Sci. China Life Sci. 2012, 55, 241–249. [Google Scholar] [CrossRef] [PubMed]
- Mackill, D.J.; Coffman, W.R.; Garrity, D.P. Rainfed Lowland Rice Improvement; International Rice Research Institute: Los Baños, Philippines, 1996; p. 242. [Google Scholar]
- Tang, L.; Zhu, Y.; Hannaway, D.; Meng, Y.; Liu, L.; Chen, L.; Cao, W. RiceGrow: A rice growth and productivity model. NJAS Wagening. J. Life Sci. 2009, 57, 83–92. [Google Scholar] [CrossRef] [Green Version]
- Stansel, J.W.; Fries, R.E. A conceptual agromet rice model. In Agrometeorology of the Rice Crop; Cowell, R.L., Ed.; WMO/IRRI: Los Baños, Philippines, 1980; pp. 201–212. [Google Scholar]
- Yin, X.; Kropff, M.J.; Goudriaan, J. Changes in temperature sensitivity of development from sowing to flowering in rice. Crop Sci. 1997, 37, 1787–1794. [Google Scholar] [CrossRef]
- Raboin, L.M.; Randriambololona, T.; Radanielina, T.; Ramanantsoanirina, A.; Ahmadi, N.; Dusserre, J. Upland rice varieties for smallholder farming in the cold conditions in Madagascar’s tropical highlands. Field Crops Res. 2014, 169, 11–20. [Google Scholar] [CrossRef]
- Tao, H.; Brueck, H.; Dittert, K.; Kreye, C.; Lin, S.; Sattelmacher, B. Growth and yield formation of rice (Oryza sativa L.) in the water-saving ground cover rice production system (GCRPS). Field Crops Res. 2006, 95, 1–12. [Google Scholar] [CrossRef]
- Yue, B.; Xue, W.Y.; Luo, L.J.; Xing, Y.Z. QTL analysis for flag leaf characteristics and their relationships with yield and yield traits in rice. Acta Genet. Sin. 2006, 33, 824–832. [Google Scholar] [CrossRef]
- Cao, S.Q.; Zhai, H.Q.; Yang, T.N.; Zhang, R.X.; Kuang, T.Y. Studies on photosynthetic rate and function duration of rice germplasm. Chin. J. Rice Sci. 2001, 15, 29–34. [Google Scholar]
- Chen, W.F.; Xu, Z.J.; Zhang, B.L. Physiological Bases of Super High Yield Breeding in Rice; Liao Ning Science and Technology Publishing Company: Shenyang, China, 1995. [Google Scholar]
- Lauteri, M.; Haworth, M.; Serraj, R.; Monteverde, M.C.; Centritto, M. Photosynthetic diffusional constraints affect yield in drought stressed rice cultivars during flowering. PLoS ONE 2015, 10, e0117631. [Google Scholar] [CrossRef] [PubMed] [Green Version]
- Teng, S.; Qian, Q.; Zeng, D.; Kunihiro, Y.; Fujimoto, K.; Huang, D.; Zhu, L. QTL analysis of leaf photosynthetic rate and related physiological traits in rice (Oryza sativa L.). Euphytica 2004, 135, 1–7. [Google Scholar] [CrossRef]
- Gu, J.; Yin, X.; Stomph, T.-J.; Wang, H.; Struik, P. Physiological basis of genetic variation in leaf photosynthesis among rice (Oryza sativa L.) introgression lines under drought and well-watered conditions. J. Exp. Bot. 2012, 63, 695–709. [Google Scholar] [CrossRef] [PubMed] [Green Version]
- Henry, A. IRRI’s drought stress research in rice with emphasis on roots: Accomplishments over the last 50 years. Plant Root 2013, 7, 92–106. [Google Scholar] [CrossRef] [Green Version]
- Chang, T.T.; Vergara, B.S. Varietal diversity and morpho-agronomic characteristics of upland rice. In Major Research in Upland Rice; International Rice Research Institute: Los Baños, Philippines, 1975; pp. 72–90. [Google Scholar]
- Araki, H.; Iijima, M. Stable isotope analysis of water extraction from subsoil in upland rice (Oryza sativa L.) as affected by drought and soil compaction. Plant Soil 2005, 270, 147–157. [Google Scholar] [CrossRef]
- Niones, J.M.; Suralta, R.R.; Inuka, Y.; Yamauchi, A. Field evaluation on functional roles of root plastic responses on dry matter production and grain yield of rice under cycles of transient soil moisture stresses using chromosome segment substitution lines. Plant Soil 2012, 359, 107–120. [Google Scholar] [CrossRef]
- Lilley, J.M.; Fukai, S. Effect of timing and severity of water deficit on four diverse rice cultivars I. Rooting pattern and soil water extraction. Field Crops Res. 1994, 37, 205–213. [Google Scholar] [CrossRef]
- Zheng, C.; Zhang, Z.; Hao, S.; Chen, W.; Pan, Y.; Wang, Z. Agronomic growth performance of super rice under water-saving irrigation methods with different water-controlled thresholds in different growth stages. Agronomy 2020, 10, 239. [Google Scholar] [CrossRef] [Green Version]
- Gunawardena, T.A.; Fukai, S. The interaction of nitrogen application and temperature during reproductive stage on spikelet sterility in field-grown rice. Aust. J. Agric. Res. 2005, 56, 625–636. [Google Scholar] [CrossRef]
- Cruz, R.; O’Toole, J. Dryland rice response to an irrigation gradient at flowering stage. Agron. J. 1984, 76, 178–183. [Google Scholar] [CrossRef]
- Jongdee, B.; Fukai, S.; Cooper, M. Leaf water potential and osmotic adjustment as physiological traits to improve drought tolerance in rice. Field Crops Res. 2002, 76, 153–163. [Google Scholar] [CrossRef]
- Saini, H.S.; Lalonde, S. Injuries to reproductive development under water stress, and their consequences for crop productivity. J. Crop. Prod. 1997, 1, 223–248. [Google Scholar] [CrossRef]
- Lanceras, J.C.; Pantuwan, G.; Jongdee, B.; Toojinda, T. Quantitative trait loci associated with drought tolerance at reproductive stage in rice. Plant Physiol. 2004, 135, 384–399. [Google Scholar] [CrossRef] [PubMed] [Green Version]
- Fujita, K.; Coronel, V.P.; Yoshida, S. Grain filling characteristics of rice varieties (Oryza sativa L.) differing in grain size under controlled environmental conditions. Soil Sci. Plant Nutr. 1984, 30, 445–454. [Google Scholar] [CrossRef] [Green Version]
- Wang, D.R.; Wolfrum, E.J.; Vick, P.; Ismail, A.; Greenberg, A.J.; McCrouch, S.R. Robust phenotyping strategies for evaluation of stem non-structural carbohydrates (NSC) in rice. J. Exp. Bot. 2016, 67, 6125–6138. [Google Scholar] [CrossRef] [Green Version]
- Bouman, B.A.M.; Peng, S.; Castañeda, A.R.; Visperas, R.M. Yield and water use of irrigated tropical aerobic rice systems. Agric. Water Manag. 2005, 74, 87–105. [Google Scholar] [CrossRef]
- Kato, Y.; Okami, M.; Katsura, K. Yield potential and water use efficiency of aerobic rice (Oryza sativa L.) in Japan. Field Crops Res. 2009, 113, 328–334. [Google Scholar] [CrossRef]
- Stevens, G.; Vories, E.; Heiser, J.; Rhine, M.; Dunn, D. Experimentation on cultivation of rice irrigated with a center pivot system. In Irrigation Systems and Practices in Challenging Environments; Lee, T.S., Ed.; INTECH Open Access Publisher: Rijeka, Croatia, 2012; pp. 134–254. [Google Scholar]
- Shi, Y.; Shen, Q.; Mao, Z.; Li, W. Biological response of rice crop cultivated on upland soil condition and the effect of mulching on it. Plant Nutr. Fertil. Sci. 2001, 7, 271–277. [Google Scholar]
- Sudhir, Y.; Gill, G.; Humphreys, E.; Kukal, S.S.; Walia, U.S. Effect of water management on dry seeded and puddled transplanted rice. Part 1: Crop performance. Field Crops Res. 2011, 120, 112–122. [Google Scholar] [CrossRef]
- Matsunami, M.; Matsunami, T.; Kokubun, M. Growth and yield of new rice for Africa (NERICAs) under different ecosystems and nitrogen levels. Plant Prod. Sci. 2009, 12, 381–389. [Google Scholar] [CrossRef] [Green Version]
Figure 1.
Rainfall, irrigation, and temperature in Alton Downs, Queensland (QLD), during the rice growing period in 2014 and 2015 (first season: sowing = 22 January 2014, harvest = 28 June 2014; second season: sowing = 14 November 2014, harvest = 23 March 2015). Arrows indicate date of flowering for early and late varieties. DAS = days after sowing.

Figure 2.
Soil moisture distribution (mm/100 soil depth) by depths (cm from the soil surface) for early rice variety AAT 4 and late rice variety AAT 12 under rainfed and strategic irrigation conditions at Alton Downs, 2015.
Figure 2.
Soil moisture distribution (mm/100 soil depth) by depths (cm from the soil surface) for early rice variety AAT 4 and late rice variety AAT 12 under rainfed and strategic irrigation conditions at Alton Downs, 2015.

Figure 3.
Root dry weight distribution (%) at different depths under strategically irrigated and rainfed treatments, Alton Downs 2015. Least significant difference (LSD) within a depth at p = 0.05.
Figure 3.
Root dry weight distribution (%) at different depths under strategically irrigated and rainfed treatments, Alton Downs 2015. Least significant difference (LSD) within a depth at p = 0.05.

Figure 4.
Means of varietal harvest index averaged across years 2014 and 2015. Bars followed by different letters differ significantly at p = 0.05.
Figure 4.
Means of varietal harvest index averaged across years 2014 and 2015. Bars followed by different letters differ significantly at p = 0.05.

Figure 5.
Spikelet fertility percentage of rice varieties, by maturity class, in years 2014 and 2015. LSD for comparisons of the variety by year interaction.
Figure 5.
Spikelet fertility percentage of rice varieties, by maturity class, in years 2014 and 2015. LSD for comparisons of the variety by year interaction.


Table 1.
Sample plot yield (t/ha) of varieties under strategic irrigation and rainfed conditions at Alton Downs, 2014 and 2015. LSD = least significant difference. AAT = Australian Agricultural Technologies.
Table 1.
Sample plot yield (t/ha) of varieties under strategic irrigation and rainfed conditions at Alton Downs, 2014 and 2015. LSD = least significant difference. AAT = Australian Agricultural Technologies.
| Varieties | Maturity | 2014 | 2015 | Mean Yield (t/ha) over Two Seasons * | |||||
|---|---|---|---|---|---|---|---|---|---|
| Rainfed | Strategic Irrigation | Mean | Rainfed | Strategic Irrigation | Mean | ||||
| AAT 9 | Late | 0.10 | 3.03 | 1.57 | 0.82 | 3.81 | 2.31 | 1.94 abc | |
| AAT 10 | Late | 0.84 | 2.38 | 1.61 | 1.14 | 4.38 | 2.76 | 2.19 c | |
| AAT 11 | Late | 0.49 | 3.08 | 1.79 | 0.61 | 3.90 | 2.25 | 2.02 bc | |
| AAT 12 | Late | 0.26 | 2.81 | 1.53 | 0.79 | 3.66 | 2.23 | 1.88 abc | |
| AAT 15 | Late | 0.11 | 1.34 | 0.72 | 0.24 | 4.36 | 2.30 | 1.51 ab | |
| AAT 16 | Late | 0.12 | 2.24 | 1.18 | 0.59 | 4.06 | 2.33 | 1.75 abc | |
| AAT 18 | Late | 0.10 | 1.81 | 0.96 | 0.42 | 3.32 | 1.87 | 1.41 a | |
| AAT 3 | Early | 2.12 | 4.20 | 3.16 | 1.94 | 3.90 | 2.92 | 3.04 d | |
| AAT 4 | Early | 3.85 | 3.48 | 3.67 | 2.10 | 5.23 | 3.67 | 3.67 e | |
| AAT 6 | Early | 2.71 | 4.48 | 3.60 | 2.72 | 4.62 | 3.67 | 3.63 e | |
| AAT 13 | Early | 2.19 | 4.68 | 3.44 | 2.02 | 4.58 | 3.30 | 3.37 de | |
| AAT 17 | Early | 2.99 | 4.57 | 3.78 | 1.94 | 4.06 | 3.00 | 3.39 de | |
| AAT 19 | Early | 2.71 | 3.64 | 3.18 | 2.64 | 4.95 | 3.80 | 3.49 de | |
| Average | 1.43 | 3.21 | 2.32 | 1.38 | 4.22 | 2.80 | 2.56 | ||
| p-value and LSD0.05 | |||||||||
| Year (Y) | 0.107 (0.735) | Y×V | 0.002 (0.756) | Y×I×V | 0.109 (1.147) | ||||
| Variety (V) | <0.001 (0.485) | V×I | 0.178 (0.815) | ||||||
| Irrigation (I) | 0.006 (0.747) | Y×I | 0.093 (0.676) | ||||||
* Mean values with the same letter do not differ significantly at p = 0.05.
Table 2.
Leaf area index (m2/m2) at flowering of rice varieties under strategic irrigation and rainfed conditions at Alton Downs, in 2014 and 2015. AAT = Australian Agricultural Technologies.
Table 2.
Leaf area index (m2/m2) at flowering of rice varieties under strategic irrigation and rainfed conditions at Alton Downs, in 2014 and 2015. AAT = Australian Agricultural Technologies.
| Varieties | Maturity | Year 2014 | Year 2015 | ||||||
|---|---|---|---|---|---|---|---|---|---|
| Rainfed | Strategic Irrigation | Mean | Rainfed | Strategic Irrigation | Mean | ||||
| AAT 9 | Late | 2.88 | 3.24 | 3.06 | 1.37 | 2.60 | 1.98 | ||
| AAT 10 | Late | 3.79 | 3.57 | 3.68 | 1.24 | 3.05 | 2.14 | ||
| AAT 11 | Late | 3.07 | 3.89 | 3.48 | 1.30 | 2.82 | 2.06 | ||
| AAT 12 | Late | 3.34 | 4.45 | 3.89 | 1.85 | 3.07 | 2.46 | ||
| AAT 15 | Late | 2.58 | 2.67 | 2.63 | 1.37 | 2.51 | 1.94 | ||
| AAT 16 | Late | 2.84 | 3.64 | 3.24 | 1.08 | 2.22 | 1.65 | ||
| AAT 18 | Late | 2.68 | 3.30 | 2.99 | 1.23 | 2.71 | 1.97 | ||
| AAT 3 | Early | 1.63 | 2.43 | 2.03 | 1.73 | 3.99 | 2.86 | ||
| AAT 4 | Early | 1.97 | 1.79 | 1.88 | 1.84 | 3.94 | 2.89 | ||
| AAT 6 | Early | 1.86 | 2.74 | 2.30 | 1.47 | 4.89 | 3.18 | ||
| AAT 13 | Early | 2.35 | 3.15 | 2.75 | 1.90 | 4.30 | 3.10 | ||
| AAT 17 | Early | 2.89 | 3.23 | 3.06 | 1.91 | 4.19 | 3.05 | ||
| AAT 19 | Early | 2.62 | 2.45 | 2.54 | 1.79 | 4.69 | 3.24 | ||
| Average | 2.65 | 3.12 | 2.89 | 1.54 | 3.46 | 2.50 | |||
| p-value (LSD0.05) | |||||||||
| Year (Y) | 0.269 (1.089) | Y × V | <0.001 (0.942) | Y × I × V | 0.201 (1.196) | ||||
| Variety (V) | 0.036 (0.542) | V × I | 0.302 (0.801) | ||||||
| Irrigation (I) | 0.020 (0.731) | Y × I | 0.051 (0.897) | ||||||
Table 3.
Average leaf photosynthetic rate (A) (μmol/m2/ s) of rice varieties under strategic irrigation and rainfed conditions at Alton Downs in 2014 and 2015. DAS = days after sowing.
Table 3.
Average leaf photosynthetic rate (A) (μmol/m2/ s) of rice varieties under strategic irrigation and rainfed conditions at Alton Downs in 2014 and 2015. DAS = days after sowing.
| Year | DAS | Rainfed | Strategic Irrigation | LSD (p = 0.05) |
|---|---|---|---|---|
| 2014 | 83 | 13.2 | 13.2 | ns |
| 103 | 7.7 | 8.2 | ns | |
| 133 | 3.3 | 6.0 | 0.94 | |
| 2015 | 51 | 7.9 | 7.9 | ns |
| 82 | 14.7 | 14.2 | ns | |
| 95 | 3.8 | 11.7 | 0.55 | |
| 110 | 6.7 | 6.1 | ns |
Table 4.
Analysis of variance p-values indicating differences or not between irrigation and variety for root length density, root diameter, and root weight density at different soil depths in 2015 at Alton Downs.
Table 4.
Analysis of variance p-values indicating differences or not between irrigation and variety for root length density, root diameter, and root weight density at different soil depths in 2015 at Alton Downs.
| Soil Depth (cm) | ||||||
|---|---|---|---|---|---|---|
| Root Parameters | Source of Variation | Total | 0–15 | 15–30 | 30–60 | 60–100 |
| Root Length Density (RLD) (mm/cm3) | Irrigation (I) | 0.341 | 0.042 | 0.713 | 0.419 | 0.720 |
| Variety (V) | 0.190 | 0.109 | 0.598 | <0.001 | 0.497 | |
| Root Diameter (RD) (mm) | Irrigation (I) | 0.872 | 0.200 | 0.750 | 0.698 | 0.394 |
| Variety (V) | 0.847 | 0.301 | 0.245 | 0.036 | 0.483 | |
| Root Weight Density (RWD) (mg/cm3) | Irrigation (I) | 0.210 | 0.176 | 0.740 | 0.825 | 0.401 |
| Variety (V) | 0.195 | 0.270 | 0.173 | 0.002 | 0.840 | |
Table 5.
Total spikelets per panicle of rice varieties under strategic irrigation and rainfed conditions in Alton Downs, 2014 and 2015.
Table 5.
Total spikelets per panicle of rice varieties under strategic irrigation and rainfed conditions in Alton Downs, 2014 and 2015.
| Varieties | Maturity | Year 2014 | Year 2015 | Two-Season Mean * | ||||||
|---|---|---|---|---|---|---|---|---|---|---|
| Rainfed | Strategic Irrigation | Mean | Rainfed | Strategic Irrigation | Mean | |||||
| AAT 9 | Late | 220 | 150 | 185 | 101 | 187 | 144 | 165 a | ||
| AAT 10 | Late | 145 | 179 | 162 | 88 | 172 | 130 | 146 a | ||
| AAT 11 | Late | 169 | 189 | 179 | 118 | 193 | 156 | 168 a | ||
| AAT 12 | Late | 142 | 189 | 165 | 102 | 170 | 136 | 151 a | ||
| AAT 15 | Late | 153 | 169 | 161 | 108 | 154 | 131 | 146 a | ||
| AAT 16 | Late | 170 | 175 | 172 | 115 | 137 | 126 | 149 a | ||
| AAT 18 | Late | 204 | 222 | 213 | 74 | 153 | 114 | 164 a | ||
| AAT 3 | Early | 100 | 129 | 114 | 106 | 123 | 115 | 115 b | ||
| AAT 4 | Early | 100 | 128 | 114 | 101 | 115 | 108 | 111 b | ||
| AAT 6 | Early | 91 | 109 | 100 | 103 | 117 | 110 | 105 b | ||
| AAT 13 | Early | 107 | 125 | 116 | 106 | 109 | 107 | 112 b | ||
| AAT 17 | Early | 90 | 110 | 100 | 102 | 123 | 113 | 107 b | ||
| AAT 19 | Early | 81 | 116 | 98 | 105 | 124 | 114 | 106 b | ||
| Average | 136 | 153 | 145 | 102 | 144 | 123 | 134 | |||
| p-value (LSD 0.05) | ||||||||||
| Year (Y) | 0.045 (20.03) | Y × V | 0.004 (33.85) | Y × I × V | 0.368 (55.61) | |||||
| Variety (V) | <0.001 (23.99) | V × I | 0.796 (39.11) | |||||||
| Irrigation (I) | 0.033 (23.48) | Y × I | 0.145 (20.11) | |||||||
* Mean values with the same letter do not differ significantly at p = 0.05.
Table 6.
Varietal 1000 grain weight (g) under strategic irrigation and rainfed conditions in Alton Downs, 2014 and 2015.
Table 6.
Varietal 1000 grain weight (g) under strategic irrigation and rainfed conditions in Alton Downs, 2014 and 2015.
| Varieties | Maturity | Year 2014 | Year 2015 | ||||||
|---|---|---|---|---|---|---|---|---|---|
| Rainfed | Strategic Irrigation | Mean | Rainfed | Strategic Irrigation | Mean | ||||
| AAT 9 | Late | 18.7 | 18.1 | 18.4 | 19.5 | 21.4 | 20.4 | ||
| AAT 10 | Late | 21.3 | 23.2 | 22.3 | 18.8 | 21.7 | 20.3 | ||
| AAT 11 | Late | 18.2 | 22.5 | 20.3 | 18.8 | 22.3 | 20.6 | ||
| AAT 12 | Late | 20.4 | 21.3 | 20.8 | 21.2 | 21.7 | 21.5 | ||
| AAT 15 | Late | 26.2 | 26.3 | 26.3 | 24.9 | 29.0 | 27.0 | ||
| AAT 16 | Late | 15.8 | 19.9 | 17.8 | 18.3 | 20.2 | 19.2 | ||
| AAT 18 | Late | 19.4 | 20.7 | 20.0 | 17.7 | 21.0 | 19.3 | ||
| AAT 3 | Early | 26.7 | 26.5 | 26.6 | 26.3 | 29.5 | 27.9 | ||
| AAT 4 | Early | 29.4 | 27.0 | 28.2 | 25.9 | 28.1 | 27.0 | ||
| AAT 6 | Early | 24.7 | 27.9 | 26.3 | 26.0 | 28.7 | 27.3 | ||
| AAT 13 | Early | 26.2 | 26.3 | 26.3 | 24.9 | 29.0 | 27.0 | ||
| AAT 17 | Early | 27.3 | 24.6 | 25.9 | 25.4 | 28.2 | 26.8 | ||
| AAT 19 | Early | 29.0 | 26.0 | 27.5 | 25.7 | 29.0 | 27.4 | ||
| Average | 22.6 | 23.5 | 23.1 | 22.1 | 24.6 | 23.4 | |||
| p-value (LSD0.05) | |||||||||
| Year (Y) | 0.428 (1.426) | Y × V | 7.66 (2.803) | Y × I × V | 0.006 (3.232) | ||||
| Variety (V) | <0.001 (2.009) | V × I | 0.033 (2.294) | ||||||
| Irrigation (I) | 0.009 (0.723) | Y × I | 0.04 (1.191) | ||||||
Table 7.
Average growing degree days (GDDs), photoperiod (pp), and number of days from sowing to flowering of rice varieties under strategic irrigation and rainfed conditions at Alton Downs, 2014 and 2015.
Table 7.
Average growing degree days (GDDs), photoperiod (pp), and number of days from sowing to flowering of rice varieties under strategic irrigation and rainfed conditions at Alton Downs, 2014 and 2015.
| Flowering | 2014 (January–May 2014) | 2015 (November 2014–March 2015) | ||||
|---|---|---|---|---|---|---|
| Sowing to Flowering GDD | Ave pp | No. of days for Flowering | Sowing to Flowering GDD | Ave pp | No. of Days for Flowering | |
| Early (japonica) | 1225 | 12.55 | 76 | 1554 | 13.40 | 87 |
| Late (indica) | 1565 | 12.26 | 102 | 1695 | 13.35 | 96 |
Note: 10 °C temperature is used as base temperature for calculating GDDs [47].
Publisher’s Note: MDPI stays neutral with regard to jurisdictional claims in published maps and institutional affiliations. |
© 2020 by the authors. Licensee MDPI, Basel, Switzerland. This article is an open access article distributed under the terms and conditions of the Creative Commons Attribution (CC BY) license (http://creativecommons.org/licenses/by/4.0/).
Share and Cite
MDPI and ACS Style
Silwal, S.; Bhattarai, S.P.; Midmore, D.J. Aerobic Rice with or without Strategic Irrigation in the Subtropics. Agronomy 2020, 10, 1831. https://doi.org/10.3390/agronomy10111831
AMA Style
Silwal S, Bhattarai SP, Midmore DJ. Aerobic Rice with or without Strategic Irrigation in the Subtropics. Agronomy. 2020; 10(11):1831. https://doi.org/10.3390/agronomy10111831
Chicago/Turabian StyleSilwal, Sachesh, Surya P. Bhattarai, and David J. Midmore. 2020. "Aerobic Rice with or without Strategic Irrigation in the Subtropics" Agronomy 10, no. 11: 1831. https://doi.org/10.3390/agronomy10111831
Note that from the first issue of 2016, this journal uses article numbers instead of page numbers. See further details here.