Assessment of the Anthropogenic Sediment Budget of a Littoral Cell System (Northern Tuscany, Italy)
by
 , ,
, ,
Sergio Cappucci
1 ,
,
Duccio Bertoni
2,* ,
,
Luigi Enrico Cipriani
3, 
Gianfranco Boninsegni
4 and
Giovanni Sarti
2 1
Department for Sustainability, Italian National Agency for New Technologies, Energy and Sustainable Economic Development (ENEA), 00123 Rome, Italy
2
Department of Earth Sciences, University of Pisa, 56126 Pisa, Italy
3
Sector “Lower Valdarno Civil Engineering”, Directorate “Soil Defense and Civil Protection”, Region of Tuscany, 50127 Florence, Italy
4
Sector “Tutela Acqua e Costa, Directorate “Difesa del Suolo e Protezione Civile”, Region of Tuscany, 50127 Firenze, Italy
*
Author to whom correspondence should be addressed.
Water 2020, 12(11), 3240; https://doi.org/10.3390/w12113240
Submission received: 10 October 2020
/
Revised: 14 November 2020
/
Accepted: 16 November 2020
/
Published: 19 November 2020
(This article belongs to the Special Issue Coastal Sediment Management: From Theory to Practice)
Abstract
:In the present study we describe a straightforward and highly replicable methodology to assess the anthropogenic sediment budget within a coastal system (the Northern Tuscany littoral cell, Italy), specifically selected in a partially natural and partially highly urbanized coastal area, characterized by erosion and accretion processes. The anthropogenic sediment budget has been here calculated as an algebraic sum of sediment inputs, outputs and transfer (m3) within a 40 year time interval (1980–2020). Sediment management strongly influences the sediment budget and, even if its evaluation is crucial to assess the efficiency of a coastal management policy, it is often difficult to quantify the anthropogenic contribution to sedimentary processes. Different types of intervention are carried out by a variety of competent authorities over time (Municipalities, Marinas, Port Authorities), and the correct accountability of sediment budget is no longer known, or possible, for the scientific community. In the Northern Tuscany littoral cell, sedimentation is concentrated in a convergent zone and updrift of port structures, which have determined a series of actions, from offshore dumping and disposal into confined facilities (sediment output), to bypassing and redistribution interventions (sediment transfer); conversely, river mouths and coastal areas protected by groins and barriers are subjected to severe erosion and coastline retreat, resulting in many beach nourishments (sediment input). The majority of coastal protection interventions were carried out to redistribute sand from one site to another within the study area (2,949,800 m3), while the sediment input (1,011,000 m3) almost matched the sediment output (1,254,900 m3) in the considered time interval. A negative anthropogenic sediment budget (−243,900 m3) is here documented.
1. Introduction
The anthropogenic pressure in coastal zones is constantly increasing [1,2]. The socioeconomic values and the benefits characterizing such areas are attracting people that increasingly choose to live there. As a matter of fact, worldwide the majority of megacities are located close to the shoreline [3,4,5,6,7]. Consequently, socioeconomic benefits and population increase feed off each other causing an inevitable escalation in human pressure. In Europe, around 86 million people live within 10 km from the coastline and about 200 million people within 50 km from the coastline, respectively, [8,9] despite the shoreline variations that inherently characterize such a dynamic environment [10,11,12,13,14].
In recent decades, coastline modifications have become a chronic problem for coastal communities, and the anthropogenic impact due to human activities (e.g., harbor maintenance, beach facilities, coastal protection schemes) is increasingly becoming a driver of shoreline changes [15,16,17,18]. The mismatch between natural and anthropogenic influence on coastal and human activities and interests is evidenced by many protection schemes characterizing the most inhabited coastal regions. Despite such effort, a large number of European coastal zones still show a high degree of exposure to erosion processes [19] causing significant impact on economic activities and the Gross Domestic Product (GDP) of several countries. Furthermore, since the 1960s climate changes have dramatically increased the vulnerability of coastal zones moving the focus from coastal erosion emergency to coastal flooding risk [20,21,22,23].
In this picture, the in-depth comprehension of coastal processes and their driving factors is one of the most relevant tools to support conscious coastal management [24]. The final target should be the ability to elaborate accurate morpho-dynamic models able to predict coastline changes over time [25,26,27], and to select correct sediment management options in order to regulate the use of natural resources so as to maintain the width of the backshore and to support the medium-to-long term sustainability of coastal protection schemes [28,29,30]. To achieve this goal, knowledge of the source (input) to sink (output) sand cycle in terms of total sediment volume stored within the littoral cell (i.e., the sediment budget) is crucial. Although from a theoretical point of view the concept of a sediment budget is relatively simple (e.g., a positive sedimentary balance means that sand input is higher than sand output, leading to coastline accretion; vice versa, a negative sedimentary balance means that sand output is higher than sand input, resulting in coastline retreat), it is not easy to calculate with accuracy [31,32,33,34,35,36].
Furthermore, with the transition to the still debated Anthropocene epoch [37,38,39,40] human activities are increasingly capable of influencing and modifying natural processes [41,42,43,44]. Both the sediment budget and the longshore distribution of sediments can be significantly modified by human actions, and worldwide this is a usual practice of coastal management [45,46,47]. Anthropogenic modifications are: (i) the input of new volumes of sediment coming from sources located outside of the littoral cell in order to mitigate erosion processes (e.g., beach nourishments); (ii) the output of volumes of sediment from within the littoral cell and their destination to sites that do not belong to the system (e.g., dredging of harbor areas and allocation of sediments to utilization other than nourishments, or offshore dumping); (iii) transfer of sediments within the littoral cell (e.g., sand bypassing and back-passing) to restore stretches of coast characterized by shoreline retreat while redistributing sediment from accreting areas (e.g., littoral drift convergence zones, updrift accumulation at port and defense structures).
Usually, the anthropogenic actions of sediment input, output, and transfer are standard operations in need of periodical recurrence (in periods ranging from months to decades). A quantitative assessment of the anthropogenic sediment budget in terms of sand volumes is crucial information to complement the total value of a “natural sediment budget” and to understand the efficiency of a coastal management policy. The lack of detailed quantitative information about the anthropogenic sediment budget is due to a series of reasons: (i) mismatch between the extension of the littoral cell and local authority jurisdiction, (ii) change of administrations over time, and (iii) tendency to take measures out of a local emergency situation. As a consequence, the total anthropogenic budget is often unknown, and this seriously hampers sustainability analysis both for the environment (inability to optimize the use of non-renewable natural resources) and for economic development (tourism accounts for about 10% of the Gross Domestic Product in Italy). The economic assessment of coastal defense interventions is crucial, and its evaluation is fundamental to estimate the sustainability of management strategies in the medium to long term.
The aim of this paper is to make a quantitative assessment of the anthropogenic sediment budget along a sector of the northern coast of Tuscany (Italy), situated between the Magra and Arno river mouths. This area represents an ideal natural laboratory because it encompasses a northern sector characterized by strong human pressure (presence of beach resort facilities, port and industrial activities, coastal defense structures) and a southern sector devoid of anthropic settlements and still preserving the natural aspects of the coast. Thanks to an efficient cooperation with the main authority of the area, the Region of Tuscany, a detailed evaluation of the anthropogenic sediment budget over the last 40 years (1980–2020) has been calculated for the first time, and the methodological approach is highly replicable in other locations.
2. Study Area
2.1. Physical and Sedimentological Characterizations
The coastal sector under study belongs to the Northern Tuscany littoral cell, which is a 65 km long stretch of coast spanning from the Punta Bianca headland to the north and the Livornesi Mounts to the south (Figure 1). We decided to focus attention on the northern part of the littoral cell, from the Magra River to the Arno River (approximately 50 km), as it corresponds to a convergent cell in terms of drift direction [48,49]. Littoral drift is directed to the south from the Magra River mouth and to the north from the Arno River mouth, resulting in the formation of a convergence zone in the area of Marina di Pietrasanta (Figure 1). South of the Arno River mouth the littoral drift is directed to the south, as wave processes related to the sea-floor morphological factors determine a divergent direction of the drifts on either side of the delta [50].
The northern sector is fed by the Magra River sediment supply; several other streams flow into the Ligurian Sea (Parmignola, Frigido, Carrione, Magliano, Brugiano, Versilia, etc.), but their sediment supply is negligible. The grain-size is variable along this sector: fine and medium sands are dominant at Marina di Pietrasanta and Forte dei Marmi, but coarse sand tends to increase to the north [51]. Gravel can also be found forming cusps and disorganized accumulations at Marina di Massa [52]: such coarse sediments are the remnants of the time when the Magra River was supplying gravel and pebbles to the sea, but they are also proof of the several nourishment projects involving coarse sediments, along with sand, which were implemented in other parts of the littoral cell (at Marina di Pisa [53]). Sediment composition of the beach is quartz (40%), feldspar and mica (<40%) and carbonates (20%) [48]. Based on the anthropogenic sediment input, the composition of emerged and submerged beach has drastically changed, and is unknown [51]. In the last two decades many analyses have been carried out by competent authorities [54] and academics [55], but the overall composition of littoral sediments deserves additional investigation. The southern sector is entirely fed by the Arno River, as the Serchio River and Morto Nuovo River do not contribute significantly [48]. Fine-to-medium sands are typical along this stretch of coast [51]; currently, it is of the maximum grain-size ever supplied by the Arno River in the last 2000 years [56]. Similar to the northern sector, the grain-size tends to decrease approaching the convergence zone at Marina di Pietrasanta [51]. Sand composition analyses along this sector of the coast reported that quartz is the main component (>50%), along with feldspar and mica (>25%), and carbonates (20%) [48,57,58].
2.2. Wave Conditions
The dominant wave direction for the Northern Tuscany littoral cell is south-west. This is also confirmed by the data provided by the buoys located at La Spezia (National Wave Network) and at the Gorgona Island (Regional Wave Network). Unfortunately, data acquisition from such devices is incomplete at times due to system malfunctions. However, the historical data show that both the most frequent waves and the strongest storms come from the same directions, with slight differences due to the respective geographical exposures: 210°–250° N at the La Spezia buoy and 220°–260° N at the Gorgona Island buoy (Figure 1a). The maximum values of the significant wave height (Hs) exceeded 7 m at both buoys. The astronomical tide excursion is limited throughout the study area, as it is only 0.3 cm during spring tides [51].
The convergent drift described in Section 2.1 is the result of the interaction of incident wave motion and different bathymetry and coastline orientation between the northern and southern sectors of the coastal cell compared to dominant wave.
2.3. River Supply
Both the drainage basins of the Magra and Arno rivers have been subjected to massive anthropogenic impact during the twentieth century, which can be briefly described as follow:
- soil and agriculture abandonment and reforestation (since 1920s–1930s);
- protection structures (groins, levees, etc., since 1920s) in the lower part of catchments;
- construction of dams (since 1930s–1950s) in the upper part of catchments;
- sediment mining from the riverbed (1950s–1980s).
All the human impacts listed above have contributed to the reduction of sediment supply to the sea, but sediment mining can be considered one of the main factors responsible for the inception of coastal erosion processes in the study area. The quantity of sediment dredged from the lower part of the Magra River has been estimated to be ~24,400,000 m3 between 1958 and 1973 [59,60] and corresponds to an annual extraction rate of about ~1,600,000 m3/y (one or two orders of magnitude higher than the annual bedload transport presently estimated [60]). According to several reports [61,62,63], the Arno River has been subjected to dredging activities and sand and gravel exploitation in the 1960–1970 timespan, but no estimate has ever been proposed.
Nowadays, it is difficult to calculate river bedload sediment transport as few in situ measurements are reliable and user-friendly. Bedload sediment transport in the Magra River has been estimated by [64], based on field measurements and the application of available empirical formulations. A different methodology has been applied by [65], using historical hydrographic surveys to reconstruct bathymetric changes occurring at the Magra River mouth over the 1882–2014 timespan. High accuracy of historical data analysis was achieved by the authors referring to permanent Italian Hydrographic Institute benchmarks and allowed the identification of two different time intervals of riverbed depletion: 1882–1954 and 1954-present day. The resulting estimations of Magra River bedload transport carried out by [64,65] are surprisingly similar (from ~70 to ~100,000 m3/y).
In contrast, there are no direct measurements of bedload transport for the Arno River, even though research activities are in progress (Bini; personal communication). However, indirect calculations of volumes of sand transported to the mouth of the Arno River show an intense potential transport, with an absolute maximum of 153,289 m3 in 1960, followed in subsequent years by average volumes of 30–40,000 m3/y [66].
2.4. Erosion vs. Accretion Processes
The study area is characterized by widespread erosion processes related to the reduction of sediments supplied by the Magra and Arno rivers during the last 150 years [67]. Locally, accretion areas can be identified along the littoral cell (Figure 1b). Beach erosion started at the mouth of both the Arno and Magra rivers, and gradually spread on both sides (Arno) and to the south (Magra). In less than 150 years the shoreline at the Arno River mouth retreated by more than 1 km, prompting immediate interventions to protect the coastline fronting the village of Marina di Pisa [50]. The left side has been vastly modified by human activities and many protection schemes have been adopted through the years [53,68]; conversely, the right side was not protected as much as the southern sector, and the retreat reached maximum values (about 1.5 km) until some structures were built to prevent the land from further erosion [69]. The erosion processes exposed to serious risk the huge natural assets of the area belonging to the Migliarino–San Rossore–Massaciuccoli Regional park, and still strike this sector with harsh consequences [70]. However, the sediments wiped out from the updrift beaches contribute to feed the downdrift sectors: at Viareggio, the sediments are intercepted by a harbor jetty that was built in the 1920s. This jetty was further enlarged by the 1970s, which is the reason why a 300 m wide backshore is present.
In the northern sector of the cell the evolution was not that different. The progradation continued up to the second half of the 19th century, when the Magra River sediment supply started decreasing for the same reasons as many other fluvial systems in the Mediterranean: inland human activities [65]. Erosion hit the coast quite rapidly and was emphasized by the construction of the Port of Marina di Carrara in the 1920s [71]. The jetty was built orthogonally to the direction of the littoral drift, intercepting the bulk of the sediments moving downdrift. Just a few years later, the beaches south of the Port were almost completely lost [72], which encouraged the local administration to build a long series of protection structures (such as detached breakwaters, submerged breakwaters, seawalls, groins) that are still characteristic of the sector of coast from the Magra River mouth to Cinquale [73]. South of Cinquale, beach erosion processes are decreasing, and only recently the beaches of Forte dei Marmi are experiencing the first signs of shoreline retreat. Such a huge anthropogenic impact is reflected in the morphology of the emerged and submerged beach. The beach profile assumes a different shape in accordance with the extent of protection structures along the study area (Figure 2).
2.5. Sea-Floor Morphology and Continental Shelf Relict Sand Reservoirs
The morphology of the seafloor fronting the study area presents a concave cross-shore profile characterized by an average slope of approximately 0.94% between the foreshore and the −10 m isobath. However, a high variability of the slope is reported along the littoral cell, as the natural profile of both the subaerial and submerged portions of the beach has been strongly modified by human activities. For instance, at Marina di Carrara and Marina di Massa the offshore structures have determined scouring at the base of the breakwaters, where the depth is well over 5 m. The seafloor at the convergence zone at Marina di Pietrasanta is also peculiar: as the convergent drifts tend to accumulate sediments there, the −5 m isobath is significantly offset seaward and the slope between the −5 m and −10 isobaths is steeper than elsewhere.
In recent years, the Region of Tuscany Administration financed the investigation of a deeper portion of the seafloor fronting the Northern Tuscany littoral cell with the purpose of identifying potential continental shelf relict sand reservoirs [74]. Such deposits represent ancient coastlines formed during low-stand periods and are composed of sand and gravel coming from local hydrographic basins and redistributed by coastal processes. The subsequent sea-level rise determined the drowning of the system and the deposition of finer sediments (silt/mud) over it, which ended up burying the sandy deposits. At some sites, though, the thick, muddy level did not completely cover the sandy deposits: such sites were those selected as convenient locations for dredging activities, after a thorough environmental analysis [75]. Two large deposits (around 30 million m3) were detected [76], one within the Northern Tuscany littoral cell (Massa) and one further to the south of the Tuscany coast (Piombino, Figure 1a). The Massa site is about 17–25 km off the present coastline and at a variable depth of 46–100 m. Detailed analysis provided an estimation of about 1 million m3 potentially available for beach nourishments, even if mainly composed of fine sands. No exploitation of such deposits has been carried out so far due to the characteristics of the sites. In particular, the sand deposits are eligible for sand dredging operations, but fine sediments (silt-mud) hinder such activities. Moreover, only large-scale dredging would represent an advantage in terms of cost-benefits for local Administrations [76].
3. Materials and Methods
The anthropogenic sediment budget of the Northern Tuscany littoral cell has been calculated here as an algebraic sum of sediment inputs and outputs (expressed in volumes, m3) within a 40 year timespan (from 1980 to 2020). A total of 66 documents were analyzed and used to create a data repository, paying attention to identifying the interventions mentioned by multiple sources in order to avoid double-counting. The methodological approach is similar to that of Cappucci et al. [71], but other examples of sediment budget assessments in different regions can be retrieved from the scientific literature [36,77,78,79,80,81]. Sediment redistribution (transfer) within the cell has also been considered and listed but counted as neutral in terms of sediment budget computation. The whole cell has been subdivided into five smaller sub-cells in a further processing of the dataset (Figure 1b): in this case sediment transfers from one sub-cell to another factored in the calculation of the sediment budget as sediment inputs and outputs. Sub-cell boundaries were pointed out based on anthropogenic (port structures and administrative borders) and natural (littoral drift convergence zone and limits of the main littoral cell) features. Such further subdivision allowed us to expand the interpretation of the results, while zooming in and out on particular situations along the coast.
Information about inputs, outputs, and transfers was collected and archived in an Excel database after a long and detailed research into the scientific literature, which has been particularly prolific in this area since the 1970s [67,82,83,84,85]. As many data on replenishments, dredging and transfer operations were not disclosed and included in published papers, we expanded the research to the public competent Authorities. The archives of the Region of Tuscany and local municipalities (e.g., Massa, Carrara and Viareggio), as well as those of the national and regional Port Authorities (Marina di Carrara and Viareggio) were the main data repositories. Many precious projects and official documents were retrieved, whose data helped in rounding out the database with information we would not be able to get in any other way. Finally, personal communications from present and former technical officers of Municipalities, Port Authorities and Drainage Basin Authorities contributed to make the database the most comprehensive on the Northern Tuscany littoral cell to date.
3.1. General Assumptions
Sediment budget computations are never an easy task because of many factors and variables that are hard to be quantified (Figure 3). Even if we only consider anthropogenic aspects, we had to make some assumptions to enable the calculation, while maintaining a high standard of precision and reliability. In accordance with previous literature (e.g., [71]), these assumptions are as follows:
- variations in wave climate, sea level and littoral drift directions in the 40 years timespan have been neglected;
- dredged material may have had different destinations, as it added to sediment transfer (sand redistribution) and/or output (offshore dumping, landfill) in accordance with utilization;
- available documents reported that dredged sediment has always been dumped beyond the depth of closure. The purpose of the paper is not to identify the depth of closure for the study area, so we refer to the estimations made by [71,85], both carried out by applying the Hallermeier’s formula [86], regardless of which one is best fitting;
- some interventions were officially expressed in tons rather than cubic meters. Assuming the material as dry, we converted tons to cubic meters considering the standard particle-size conversion values (sand: 1.46; gravel 1.56) and porosity, even though such property was difficult to assess properly as gravel used for nourishments was hardly devoid of finer fractions. A simple sensitivity analysis was carried out by using a conversion interval from a minimum of 1.46 to a maximum of 1.57 (instead of a medium value of 1.5). An approximation of about 3% is obtained and it can be applied only to 235,000 m3 of sand and gravel excavated from inland quarries, which accounts for 5% of the overall volume moved in the time interval considered (5,215,700 m3). We decided to indicate a 3% error for any other activity, in an effort to be conservative while dealing with these figures.
3.2. Sediment Input
Sediment inputs include any beach replenishment interventions that have been carried out in the 1980–2020 timespan. As replenishment, we consider every operation made by humans to feed the beach using sediments coming from inland quarries, riverbed dredging, dam basin emptying, and longshore sediment redistribution from outside the littoral cell. For some interventions that lasted for multiple years, we got to know only the total volume and not the amount allocated to each year. In such cases, we divided the total volume by the number of years of the intervention, defining equal parts for each year.
Local Authorities used sand and gravel to refill the beaches updrift and downdrift of the Marina di Carrara and Viareggio ports. However, the majority of the interventions were made in the area situated between the Port of Marina di Carrara and Cinquale, where many coastal protection structures have been built over time (Figure 1).
3.3. Sediment Output
Sediment outputs include offshore dumping beyond the depth of closure, storage of dredged material into Confined Disposal Facility (CDF), and landfills. The sediments that have been subjected to such destinations were those dredged from navigation channels and hotspots within harbors, not ideal for beach replenishments due to potential contaminations and unsuitable grain-size (silt and clay). Accumulation of contaminants within sediments can derive from natural or anthropogenic sources [87]. However, natural processes can lead to concentration exceeding the threshold of contamination defined by national legislation [88]. In some sites, such abundance establishes a reference value of natural background. In contrast, anthropogenic sources are represented by all the activities that produce and/or use toxic or harmful substances, and that can affect the ecosystem into which they are issued [89]. Italian current legislation about the matter is rapidly evolving. Recently, based on the Legislative Decree no. 1 of 24 January 2012 (converted into Law no. 27 of 24 March 2012), in which Article 48 is referred to as “Dredging Rules”, the detailed regulations regarding dredging, previously regulated by art. 5 of Law no. 84 of 1994, were re-written. In 2016 two Decrees of the Ministry of the Environment and Land and Sea Protection rewrote the framework for sediment management [90,91]. As the contamination thresholds corresponding to suitable sediment management options have been updated through the years in accordance with the evolving legislation framework, in the present paper we considered only the possibility that sediment volume collected during a dredging operation can be partially used for nourishment (if compatible with the native sand), or disposed into confined facilities or dumped out of the coastal system [71].
3.4. Sediment Transfer
Sediment transfer corresponds to the material that has been dredged from within the littoral cell and redistributed along the backshore, the shoreface and the nearshore. The main expression of sediment transfer is represented by the activities of bypassing coastal infrastructures carried out by the Authorities. These occurred at the major ports within the study area, i.e., Viareggio and Marina di Carrara (Figure 1b). These are centers of exceptional importance for the local communities in terms of recreational and commercial purposes, respectively. Therefore, maintenance of the navigation channel to enter the harbor is crucial, as the drifts end up redistributing sediments that contribute to the siltation of the access way. Recurrent dredging operations are required to maintain safe navigation: a large part of the sediment collected during such interventions has been redistributed downdrift beyond the port structures that partially impede the longshore natural circulation of sediments.
From some documents and projects, we retrieved information that the sediments used as replenishment were composed of sand extracted from inland quarries and by marine source. As no exploitation of continental shelf relict sand reservoirs was ever made along the Tuscany coast [76], we assumed that the marine source sands were dredged from the shoreface/nearshore and such volumes were classified as sediment transfer.
3.5. Shoreline Change
The Northern Tuscany littoral cell and its spatial and temporal evolution was studied by several Authors [73,92]. In the present study, using the regional-scale monitoring data recently approved by the Region of Tuscany (Regional Council Deliberation 204/2020), we updated the data available for 11 sectors previously proposed by [85] in order to correlate our findings with those already available. Each sector has an average length of about 4 km, which enables a better definition of the evolution of the shoreline trends over the considered time period. Data acquisition was commissioned by the Region of Tuscany in recent decades thanks to the technical and scientific support of the Earth Sciences Department at the University of Florence and lately by the Consorzio LaMMA (Laboratorio di Monitoraggio e Modellistica Ambientale), which first produced the raw data processing.
The 1984/1985 dataset was derived from the ortho-rectification of aerial photographs; the accuracy is estimated as being within about 5 m. The 2005 dataset was acquired through a topographic survey carried out by means of DGPS-RTK (Differential Global Positioning System - Real Time Kinematic) equipment, whose accuracy can be estimated to less than 10 cm [85]. Here we integrate such surveys with the latest, carried out by Consorzio LaMMA in 2019, which was obtained from high resolution satellite imagery (Pleaiades 1A), with an estimated accuracy of about 1 m. The processing of the 2019 dataset allowed us to extend the shoreline trend analysis to the 2005–2019 time interval. The raw data have been analyzed in order to get quantitative values of linear shoreline change (expressed in ± meters, resulting from the difference between two consecutive datasets), and the rate of variation (m/y) in the considered time intervals (1984/1985–2005 and 2005–2019). The analyses were carried out as simple end-point rates based on the earliest to the most recent shorelines.
4. Results
The in-depth research of sediment input, transfer and output data from multiple sources helped us in reconstructing the anthropogenic sediment budget of a large sector of the Northern Tuscany littoral cell for the last 40 years (1980–2020). Human activities contributed to reworking a total of more than 5 million cubic meters of sediments in this timespan (Figure 4). In detail, total gained sediment equals 1,011,000 m3, lost sediments 1,254,900 m3, and redistributed sediments 2,949,800 m3, respectively. Since transfers represent only sediments displaced within the boundaries of the selected stretch of coast, the resulting algebraic sum regarding gains and losses is −243,900 m3.
4.1. Sediment Input
The Northern Tuscany littoral cell has been supplied with artificial beach nourishments using material from outside the study area. Since 1983 (the year of the first reported beach fill in the area), slightly more than 1 million cubic meters of sand and gravel has been brought along the shoreline, with the exception of areas 3 and 4, where such nourishments have never been carried out (Table 1). Sediments have been retrieved in large part from inland quarries, either close to the area (Carrara marble quarries) or distant (sand mines along the Po River). The contribution from inland quarries (623,100 m3) almost doubles the second highest sediment provenance, which is related to dredging activities along the Magra River mouth (335,200 m3), even though the latter has been used for large interventions (almost 50,000 m3 on average, compared to 6000 m3). The sum of the other three sources (dredging practices of different sites: uphill Magra River, back-dune accumulations at Marina di Torre del Lago, shoreface near the harbor of Marina di Pisa) accounts for just 5% of the total.
The largest nourishment projects have been carried out along sub-cells 1 and 2 (Figure 1b), where the erosion effects have been (and still are) harsher than elsewhere. Sub-cell 5 has also been hit hard by erosion processes, but no major protection schemes were implemented here as it is a natural site, with no human settlements to defend [69]. As a result, since 1980 the sector situated between the Magra River mouth and the Port of Marina di Carrara has been supplied with 517,900 m3, whereas 406,000 m3 has been used for beach nourishment downdrift of the Port of Marina di Carrara, up to the Versilia River mouth (Figure 1b). Finally, just 87,100 m3 have been used as beach fill in the area between the Port of Viareggio and the Arno River mouth, specifically in the sector south of the Morto Nuovo River mouth.
4.2. Sediment Output
4.2.1. Different Disposal of Dredged Sediments
The practice of harbor dredging is crucial to maintain clear access ways to ports. Part of the dredged material has been redistributed along the coast as beach filling. However, a significant part has been discarded and used in a different manner, not related to nourishment activities (Table 2). More than half a million cubic meters have been dredged from the harbors at Viareggio and Marina di Carrara and removed from the coastal system. At Marina di Carrara, about 12,000 m3 have been allocated to nearby confined disposal facilities due to the reported presence of possible contaminants in the sediments, which made them unsuitable for nourishment projects. A large part of the dredged sediments was used as authorized landfills (just less than 250,000 m3), including 30,000 m3 within the 2020 dredging operation. Utilization of dredged material (about 320,000 m3) from the Port of Viareggio was not disclosed, but certainly it was not used for beach nourishment within the study area (Table 2).
4.2.2. Offshore Sediment Dumping
In some cases, sediment dredged from the harbors was used neither as beach filling nor as landfill, nor brought to confined disposal facilities, but discharged offshore to selected sites, well beyond the depth of closure. Such practice was carried out because the dredged material was not suitable for beach nourishments due to a significant level of contamination, but was compatible for the offshore environment; therefore, dumping well beyond the depth of closure was often easier and less expensive than arranging the transport of such huge volumes to other destinations. As a result, almost 700,000 m3 of sediments were dumped offshore in a short time interval between 1993 and 2001 (Table 3). In particular, just over 300,000 m3 were removed from the Port of Marina di Carrara in a single capital dredging project in 1993, which accounted for a massive loss to the local sediment budget. This is the only offshore dumping activity ever reported occurring at Marina di Carrara since 1980 (Figure 1b). Such practice was more frequently carried out at the Port of Viareggio, where 7 separate dredging operations led to offshore dumping of the material that was taken out of the harbor (Figure 1b). Even though of short duration (between 1995 and 2001, one intervention per year), such actions ended up in a loss of almost 400,000 m3 of sediments (an average of more than 50,000 m3 each year). However, offshore dumping has not been taken into consideration by more recent legislation as a viable option to dispose of dredged sediments since the last occurrence in 2001 [71,89].
4.3. Sediment Transfer
4.3.1. Sediment Bypass (Port of Viareggio)
Within the study area, many interventions were carried out to transfer sediments from areas where sand was accumulating towards areas where the shoreline was retreating and in need of artificial nourishment of both the emerged and submerged portions of the beach. Sediment Bypass Tunnels (SBT) were built at the ports of Marina di Carrara and Viareggio in the 1970s [93,94], constituted of a system of pipes and pumps that enabled the suction of a mixture of sand and water and discharge beyond the port structures, further downdrift. These were dismissed a few years after installation due to frequent failures. As the technology was too expensive and complex to be maintained, standard dredging operations of the sites where sediments mainly accumulated were preferred over such a complicated system. No indication of sediment volumes moved by SBT has ever been reported. As this mainly operated before the beginning of the considered time interval (1980–2020), it does not affect the calculation of the anthropogenic sediment budget.
Such a practice has only been adopted at the Port of Viareggio because updrift accumulation has been more significant than at the Port of Marina di Carrara, where in recent years, deposition has been so low that nourishments have been required also on the updrift side of the port (Table 4). As a matter of fact, the updrift area at the Port of Viareggio is characterized by an intense deposition, which is the result of the erosion of the beach north of the Arno River mouth. Sediments are entrained by the littoral drift, transported longshore northwards, and finally deposited at the southern jetty of the Port of Viareggio. Here the sediment in excess is dredged and unloaded along the shoreline at Viareggio, where erosion effects were reported especially in the 1970s and 1980s. More than 2 million cubic meters of sand have been dredged and redistributed during the 1980–2020 time interval. In two distinct circumstances (2000 and 2020) the bypass involved the redistribution of sand beyond the convergence zone and further north, up to Poveromo and Marina di Massa (108,000 m3; Figure 5).
4.3.2. Sediment Dredged from Harbors
Maintenance of navigation channels for safety reasons involves frequent sand dredging [89]. In order to avoid offshore dumping beyond the depth of closure, and consequent loss of sand that could contribute to the nourishment of eroding beaches, volumes of sand have often been moved to counteract shoreline retreat. In particular, at the Port of Marina di Carrara this practice has been frequently implemented because access to the harbor silted up quickly [71]. Fourteen separate dredging interventions have been carried out there since 1993: ten involved the redistribution of dredged material along the coast (Table 5); sediments were allocated to different utilizations in the other four interventions (Table 2). As a result, about half a million cubic meters have been redistributed as beach nourishment, but only in the area seriously hit by the erosion processes in the aftermath of the construction of the Port (Marina di Massa). Sediments dredged from the navigation channel and the harbor at Marina di Carrara were never used as beach filling in other sectors. The largest dredging operation occurred in the early months of 2020 (123,000 m3).
Sediments dredged from inside the harbor at the Port of Viareggio were never used to refill eroding beaches: they have been designated to other uses, adding to sediment output (Table 2).
4.3.3. Sediment Dredged from Nearby Shoreface and River Mouth
The practice of redistributing sediments from one site to another within the littoral cell has also been carried out via dredging operations from beach shoreface and river mouths located near to the nourishment area. This was done only a few times in the 1980–2020 timespan (Table 6), involving small volumes (less than 80,000 m3). While in the past such interventions were made as emergency actions, more recently they have been identified as possible ordinary management measures for coastal restoration, due to guidelines approved by the Region of Tuscany. The 1983 operation was completed to mitigate harsh erosion effects, which occurred at the nourishment site in the weeks leading up to the intervention: the shoreface at the mouth of a small ditch (Poveromo) in the nearby area was dredged, as at the time erosion processes had not reached that sector of the coast, which was accreting. The 2009 operation was related to a structural protection scheme that was implemented at the mouth of the Morto Nuovo River. About 37,000 m3 of sediments were moved from the mouths of the Frigido and the Versilia rivers, and from other minor streams, to the nearest beaches in the period 2017–2019. An additional 15,000 m3 were taken from the nearshore in order to refill the backshore at Marina di Massa and Poveromo (Figure 5) after a major storm occurred in late October 2019.
4.4. Shoreline Change
The analysis of shoreline change during the 1984–2019 timespan confirms the characteristic trends reported along this sector of the Tuscany coast [85,92]. There are two main erosion hotspots (north of the Arno River mouth and south of the Port of Marina di Carrara) and three areas where sediments coming from the eroding sites tend to accumulate (Viareggio–Forte dei Marmi and updrift of the ports of Marina di Carrara and Viareggio). Erosion effects at the Arno River mouth were harsh especially during the first time interval (1984/1985–2005): a retreat of almost 70 m was calculated in the sector situated between the Arno River and the Serchio River mouths (Table 7 and Figure 6a). Later such trends decreased to reach a retreat of about 40 m, but the two timespans are not equally split (the first covers 21 years, the second only 15). As a matter of fact, the rate of variation is not that different: −3 m/y and −2 m/y respectively (Figure 6b). Higher mitigation of the eroding trend has been identified in the second hotspot, at Marina di Massa, where the retreat was about 40 m during the first time interval and decreased to 11 m in the 2005–2019 timespan. Likewise, the rate of variation shows a reduction from +1.8 m/y to +0.8 m/y. However, no reversal in accretion/erosion trends has been reported between the two periods.
Aside from marginal positive variations at sectors 1 and 3, intense accumulation occurred in the central part of the littoral cell, centered in the convergence area at Marina di Pietrasanta (sectors 5–9). The accretions showed at sectors 1 and 3 are likely to be related to beach fill activities, as such portions of the coast are confined within protection structures. The strong accretion trend is located especially at the Port of Viareggio (sector 8), where the southern jetty creates a trap for the sediments coming from the southern tract of the littoral cell (Table 7 and Figure 6a). The trend was particularly high during the 1984/1985–2005 period (+55.7 m, 2.8 m/y), but it significantly decreased later (+17.5 m, 1.3 m/y). This is consistent with the yearly average extent of total sediment redistribution in the area, which was about 54,000 m3 in the 1984/1985–2005 period and increased to about 85,000 m3 in the 2005–2020 interval. The trends were consistent through the two timespans in the other sectors that showed accretion, which is also confirmed by the rate of variation (Figure 6b).
5. Discussion
The results here presented show the spatial and temporal distributions of sediment management activities along a sector of the Northern Tuscany littoral cell in the 1980–2020 timespan and, for the first time, they provide a quantitative evaluation of the total volume of anthropogenic sand input, output, and transfer occurring in the area during this time interval. Two main key points should be highlighted.
The first is that the total volume of the anthropogenic sediment budget resulted in a loss. As a matter of fact, the algebraic sum of the volume of sediments used as artificial nourishments (1,011,000 m3) and those removed from the system in the same timespan (1,254,900 m3) indicates a deficit of 243,900 m3. As transfers exclusively involved the sediments displaced within the boundaries of the study area (2,949,800 m3), they are irrelevant for the computation of the total budget, but they do play an important role by deceiving the local community that the origin and effects of coastal erosion have been solved. However, transfer data are crucial in redesigning the management of sand resources within the littoral cell over time, revealing the significant amount of sand redistributed as part of coastal management practices.
The second relevant key-point to highlight is the difference in the order of magnitude between the value of the anthropogenic sediment input (about 1 million m3) and the quantity of sediment dredged from the Magra and Arno Rivers immediately after the Second World War. Riverbed excavation along the lower reach of the Magra River generated a sediment deficit of ~24,400,000 m3 between 1950 and 1980 [59,60]. This corresponds to an annual extraction of about ~1,600,000 m3/y, which is higher by one or two orders of magnitude to the present-day annual bedload transport estimation [60]. At present, no quantitative data nor estimation are available for the Arno River, but investigation is in progress (Bini; personal communication); intense dredging activities and sand and gravel exploitation are documented in the 1960–1970 timespan [61,62,63]. No information is available for the Serchio River and the other minor streams flowing into the sea in the area.
These data are likely to be underestimated, because of the lack of a detailed and continuous integration into the database of any riverbed quarrying activity, which sometimes was not even authorized and, as such, not recorded. They also do not take into account the decrease of river sediment supply occurring in recent decades, related to the construction of dams and weirs along rivers, to levee stabilization, to the increase in vegetation cover, and to several other factors closely linked to human activities [e.g., 50]. The extensive erosive processes occurring in recent decades are substantially due to such an abrupt reduction of sediments supplied by rivers, as confirmed by the Italian Ministry of Environment, Land and Sea Protection, which certified on July 2020 that, over the last 50 years, Italian coastline areas have been reduced by 40 × 106 m2. Clearly such a structural problem cannot be faced only by turning to the good practice of injecting sediments as artificial nourishment. The offices dedicated to coastal management need to take this aspect into serious consideration while laying down future strategies for mitigation and adaptation to global changes in the mid-to-long term. However, this is an issue that Italy shares with the whole of Europe, as confirmed by the high degree of exposure to erosion processes that characterizes many European coasts [19]. All these considerations allow us to correctly frame the erosion problem against artificial beach nourishing activities, which is valid for the study area.
An in-depth analysis of sediment transfer data within the Northern Tuscany littoral cell provides an additional characterization of the results in terms of sediment redistribution, which helps us in defining the areas where most of the activities have been carried out. The study area has been subdivided into 5 sub-cells, which are each characterized by a different anthropogenic pressure (Figure 7; Table 8).
Sub-cell 1 was only characterized by sediment input over the considered timespan (517,900 m3), whereas all three types of contribution (input, transfer and output) were involved within sub-cell 2 (total reworked volume of 1,654,000 m3 of sediments, for a net loss of about 156,000 m3). These are the sub-cells where coastal erosion has been tackled both with beach nourishments and with the construction of barriers and groins (Figure 5). No activities have been carried out within sub-cell 3; it is the only one without breakwaters and groins. No sediment input intervention occurred within sub-cell 4, which is characterized by a total reworked volume of 2,944,300 m3 of sediments and by a net loss of 692,900 m3. In fact, sediment transfer observed within sub-cells 2 and 4 is generated by sediment transfer from updrift to downdrift of the Marina di Carrara and Viareggio ports. Part of this volume moved to sub-cell 3 under the effect of waves and longshore currents, contributing to the accretion of the beach and to contribute to the exclusive nature of the world-famous resorts at Forte dei Marmi. Finally, just 97,300 m3 of sediments have been reworked within sub-cell 5, where no output has been reported in the considered timespan.
An additional examination of the results allows us to get a clear look at the sediment redistribution activities in the period 1980–2020 along the study area. If transfer operations between different sub-cells are considered as input and output and not just as a mere mobilization of sediments within the same littoral cell, the resulting data change significantly: inputs and outputs increase to 3,371,000 and −3,614,800 m3 respectively, while transfers take a hit, decreasing to 587,800 m3 (Figure 8).
Such data underline the huge effort made by the competent Authorities to redistribute sediments in the last 40 years, often pre-empting the modern strategy of managing sand as a resource and not just as an inert material. This is also backed up by the impressive symmetry of the timeline curves of inputs and outputs in such a timespan (Figure 9), which is an indication that major operations were carried out as a result of emergency rather than in accordance with a strategic, long-term plan. Unfortunately, this is clearly not enough, otherwise the need for recurrent replenishments would not be as imperative as it still is.
The present study revealed another important issue. Many groins and breakwaters were built to combat erosion in the study area in recent decades, but ended up modifying the natural morphology of the littoral sedimentary deposits, changing the grain-size distribution and the profile of the emerged and submerged beach (Figure 2). This approach has increased the need for artificial beach nourishments because of the downdrift migration of the erosive processes. As a consequence, the northern part of the study area (sub-cells 1 and 2) cannot be considered as a natural beach anymore: emerged and submerged structures of different shape and size are continuously designed and implemented, but they have generated a new concept of anthropogenic littoral deposits, the artificial beach. However, breakwaters do not prevent sediment loss and the expectations of stakeholders and tourists are not fully satisfied even though many replenishments have been completed (Table 1).
However, sediment redistribution from accreting areas (e.g., updrift of port structures) to eroding beaches is a good compromise in terms of socioeconomic and environmental issues. In fact, while the touristic appeal of beaches affected by erosion processes is reduced or null, excessively wide backshores are not the best for beach goers either. This is the case with the beach at the ports of Marina di Carrara and Viareggio, whose updrift sectors have a width of about 150 and 350 m respectively (Figure 1; Figure 10). Likewise, the sand accumulating at the convergence area at Marina di Pietrasanta (Figure 1; Figure 10) might be redistributed to re-nourish the nearby suffering beaches.
Another complementary option, related more to environmental issues, would be the back-passing of sediments from the Port of Viareggio to the natural reserved area of the Migliarino-San Rossore-Massaciuccoli Regional Park. This zone is located in the southern part of the study area (sub-cell 5) and is characterized by strong erosion processes that recently led to the destruction of a wide portion of the natural beach-dune system [70] (Figure 11).
Sand redistribution is a delicate practice that requires more studies, analyses and strict monitoring to evaluate the efficiency and the performance of completed projects. It also needs to be repeated over time within the framework of a defined maintenance program. A crucial point is represented by the accurate definition of the characteristics of grain movement, considering the prevailing path of transport flows. In particular, the assessment of the depth of closure needs detailed consideration. The estimate of this value determines the depth seaward at which morpho-dynamic processes are no longer active [95,96,97]. In this sense, the depth of closure has relevant implications in determining whether the volume of dredged sediments dumped offshore should be considered as sediment output or transfer. Currently, this is a matter of debate in the scientific community [97,98,99] and several methods have been presented in the last 40 years [100,101,102,103,104,105]. Each approach needs an adequate dataset, collected over time in a constant manner: (i) sedimentological and lithological data for the application of a geologically oriented approach, (ii) beach–offshore profiles for a morphological methodology, and (iii) a wave–hydrodynamics dataset for a mathematical modeling approach. The dissimilar values of the depth of closure obtained for the same area using different approaches have been recently highlighted by [106]. This underlines the need for caution in giving an absolute value to the depth of closure, especially in sites frequently subjected to beach nourishments [107]. However, the choice of approach basically depends upon the set of data available. Within the study area, the dataset existing for regular intervals of time comes from a buoyant wave-meter located offshore of the Gorgona Island (Figure 1a). For this reason, the depth of closure has been estimated by applying Hallermeier’s formula [86]. In agreement with [71], the resulting value indicates a depth of −14 m for the entire study area. More recently, [85] applied Hallermeier’s formula [86], suggesting a lower value, of about −9 m. However, such a debate is beyond the purpose of the present paper and we have decided not to dwell on it as depth of closure does not alter the results of the present study.
An additional issue that is gaining interest among the scientific community and stakeholders concerns the possibility of optimizing and increasing the volumes of sand available for redistribution [108,109]. So far, part of the sediments dredged in the harbors cannot be utilized for nourishment purposes due to its high contamination level, ending up discarded on confined facilities or dumped offshore [71,110]. While legislation tends to mitigate the environmental impact derived from the movement of sediments in the coastal-marine environment, it should also tend to avoid the wrong disposal of dredged material, and should be applied to limit or prevent sediments from being removed from the sites where they are most polluted (e.g., navigation channels, harbors) where hot spots are more frequent. The expansion and the upgrade of methods allowing in situ decontamination of sediments would represent a good strategy in order to increase the volume of available sands [111,112,113,114,115]. In the last 40 years the volume of sediments discarded due to contamination in the study area corresponds to an output of about 576,100 m3, which is more than half of the total anthropogenic sediment input (1,011,000 m3). This implies that a significant amount of the anthropogenic input (e.g., replenishments) has served to cover the anthropogenic outputs (e.g., dredging activities). Such operations do not come cheap, and inland and offshore sediment disposal contributes to the total expense. The balance is clearly negative in terms of costs and benefits: charges for dredging operations, sediment disposal and replenishments are factors that must be considered as a summation, not only from the financial point of view but also for the environment; at the same time, the available sand resource is halved. Cost assessment is far beyond the purpose of this study, but it is a relevant issue when the effects of coastal erosion must be mitigated. The cost of coastal defense interventions, including the inflation factor, are variable, but are mainly related to the origin of the sand and gravel and their final destination/disposal (e.g., ~10 €/m3 for sediment supplied by dredging operation, ~30–50 €/m3 for sediment supplied from onshore quarries or rivers by trucks, and ~100 €/m3 for sediment treatment or disposal into CDF and landfill due to the presence of contaminants). A conservative estimation of the cost of sediment management and exploitation within the study area is about 800 million Euros, with an average of more than 10 million Euros spent every year during the Anthropocene period.
Location, length of coastal area subjected to coastal interventions, time interval and total amount of sediment management operations are reported in Table 9. Such comparisons must be considered with caution due to the many natural and anthropogenic conditions that may affect the results from different study areas. A standard methodology to assess sediment budget along a coastal area is still not available, but it is clear that the scientific community is trying to find a solution by following different methodological approaches. The competent Authorities, along with academics, are asked to find a sustainable solution to the geomorphological evolution of coastal areas and to better understand which factors are responsible for coastal erosion in order to provide correct information and support coastal management. The present study demonstrates that the rate of sediment management in Northern Tuscany (Italy) is comparable with the results provided by using other methodologies in other parts of the world, where beach nourishment was carried out to mitigate natural, anthropogenic and climate changes impacts.
6. Conclusions
The approach here presented may be easily replicated elsewhere and constantly updated. These results are essential to support decision-makers regarding coastal management issues such as sediment redistribution. They also represent the starting point for the calculation of the whole sediment budget. The main findings of the present paper can be summarized as follows:
- a quantitative evaluation of the volume of anthropogenic sediment inputs, outputs, and transfers during the last 40 years has been provided along a sector of the Northern Tuscany littoral cell (a drift-convergent area, from the Magra River to the Arno River);
- the resulting anthropogenic sediment budget is negative (−243,900 m3);
- there is a difference of orders of magnitude between the anthropogenic sediment input (about 1 million m3) and the amount of sediment dredged from the rivers (more than 24 million m3 from the Magra River alone), which would have generally contributed to the natural supply of the beach;
- the decrease of sediment supply from rivers is the higher order driving-factor in controlling and triggering erosion processes and cannot just be balanced by the volume of sediments represented by the anthropogenic inputs (e.g., replenishments);
- transfer data processing allows the identification of five sub-cells that show different degrees and trends of sediment redistribution in the considered time interval, depending on the local extent of the erosion effects;
- the competent Authorities need to carry on developing forward sediment management strategies as they have done in recent decades, possibly implementing actions involving the entire littoral cell and not just specific spots under emergency or stakeholder’s pressure.
Supplementary Materials
The following are available online at https://www.mdpi.com/2073-4441/12/11/3240/s1, Table S1: List of sediment input interventions, Table S2: List of sediment transfer interventions.
Author Contributions
Conceptualization, D.B. and S.C.; methodology, S.C. and G.S.; software, G.B.; validation, L.E.C. and G.B.; investigation, L.E.C and G.B.; data curation, D.B.; writing—original draft preparation, D.B. and S.C.; writing—review and editing, G.S., L.E.C. and G.B.; supervision, S.C., D.B. and G.S.; funding acquisition, D.B. All authors have read and agreed to the published version of the manuscript.
Funding
The research was funded by PRA_2018_41 Georisorse e Ambiente.
Acknowledgments
We are pleased to thank Ivano Melito for his kind support in reviewing the data related to the dredging activities in the area of the Port of Marina di Carrara, and Andrea Bontempi, who provided useful reports about many operations carried out within the Marina di Massa municipality. Stefano Cucco of the La Dragaggi s.r.l. dredging company provided us with nice pictures of the study area; his remarks were also instrumental. The work presented in the paper has been conducted also in the framework of ARCH Project (European Union’s Horizon 2020 research and innovation program under grant agreement N°820999). Prof. Monica Bini has been willing to discuss with us some preliminary insights of her ongoing study about the Arno River sediment discharge. Comments made by two anonymous reviewers led to a significant improvement to the manuscript, thanks for your time. Lorenzo Grassi kindly helped us in improving the visual aspect of some figures.
Conflicts of Interest
The authors declare no conflict of interest.
References
- Small, C.; Nicholls, R.J. A global analysis of human settlement in coastal zones. J. Coast. Res. 2003, 19, 584–599. [Google Scholar]
- Neumann, B.; Vafeidis, A.T.; Zimmermann, J.; Nicholls, R.J. Future coastal population growth and exposure to sea-level rise and coastal flooding—A global assessment. PLoS ONE 2015, 10, e0118571. [Google Scholar] [CrossRef] [PubMed]
- Li, H. Management of coastal mega-cities—A new challenge in the 21st century. Mar. Policy 2003, 27, 333–337. [Google Scholar] [CrossRef]
- Martinez, M.L.; Intralwan, A.; Vazquez, G.; Pérez-Maqueo, O.; Sutton, P.; Landgrave, R. The coasts of our world: Ecological, economic and social importance. Ecol. Econ. 2007, 63, 254–272. [Google Scholar] [CrossRef]
- Yeung, Y.M. Coastal mega-cities in Asia: Transformation, sustainability and management. Ocean Coast. Manag. 2001, 44, 319–333. [Google Scholar] [CrossRef]
- Barragán, J.M.; de Andrés, M. Analysis and trends of the world’s coastal cities and agglomerations. Ocean Coast. Manag. 2015, 114, 11–20. [Google Scholar] [CrossRef]
- Luijendijk, A.; Hagenaars, G.; Ranasinghe, R.; Baart, F.; Donchyts, G.; Aarninkhof, S. The state of the world’s beaches. Sci. Rep. 2018, 8, 6641. [Google Scholar] [CrossRef]
- ETC-CCA. Methods for assessing coastal vulnerability to climate change. In Vulnerability and Adaptation Technical Paper 1/2011; ETC-CCA: Lecce, Italy, 2011; p. 93. Available online: http://cca.eionet.europa.eu/docs/TP_1–2011 (accessed on 19 June 2020).
- Collet, I.; Engelbert, A. Coastal regions: People living along the coastline, integration of NUTS 2010 and latest population grid. Eurostat Stat. Focus 2013, 30, 1–12. [Google Scholar]
- Syvitski, J.P.; Harvey, N.; Wolanski, E.; Burnett, W.C.; Perillo, G.M.; Gornitz, V.; Arthurton, R.K.; Bokuniewicz, H.; Campbell, J.W.; Cooper, L.; et al. Dynamics of the coastal zone. In Coastal Fluxes in the Anthropocene; Springer: Berlin, Germany, 2005; pp. 39–94. [Google Scholar]
- Maiti, S.; Bhattacharya, A.K. Shoreline change analysis and its application to prediction: A remote sensing and statistics based approach. Mar. Geol. 2009, 257, 11–23. [Google Scholar] [CrossRef]
- Liu, H.; Wang, L.; Sherman, D.; Gao, Y.; Wu, Q. An object-based conceptual framework and computational method for representing and analyzing coastal morphological changes. Int. J. Geogr. Inf. Sci. 2010, 24, 1015–1041. [Google Scholar] [CrossRef]
- Mentaschi, L.; Vousdoukas, M.I.; Pekel, J.F.; Voukouvalas, E.; Feyen, L. Global long-term observations of coastal erosion and accretion. Sci. Rep. 2018, 8, 1–11. [Google Scholar] [CrossRef] [PubMed] [Green Version]
- Wright, L.D.; Nichols, C.R. Tomorrow’s Coasts: Complex and Impermanent; Springer: Cham, Switzerland, 2019; p. 374. [Google Scholar]
- Coelho, C.; Conceição, T.; Ribeiro, B. Coastal erosion due to anthropogenic impacts on sediment transport in Douro river—Portugal. In Proceedings of the Coastal Dynamics, Tokyo, Japan, 7–11 September 2009; pp. 1–15. [Google Scholar] [CrossRef]
- Farhan, A.R.; Lim, S. Resilience assessment on coastline changes and urban settlements: A case study in Seribu Islands, Indonesia. Ocean Coast. Manag. 2011, 54, 391–400. [Google Scholar] [CrossRef]
- Williams, A.T.; Rangel-Buitrago, N.; Pranzini, E.; Anfuso, G. The management of coastal erosion. Ocean Coast. Manag. 2018, 156, 4–20. [Google Scholar] [CrossRef]
- Gomez, C.; Hart, D.E.; Wassmer, P.; Kenta, I.; Matsui, H.; Shimizu, M. Coastal evolution, geomorphic processes and sedimentary records in the anthropocene. Forum Geogr. 2019, 33, 1–24. [Google Scholar] [CrossRef]
- Salman, A.; Lombardo, S.; Doody, P. Living with coastal erosion in Europe: Sediment and space for sustainability. Eurosion Proj. Rep. 2004. Available online: http://resolver.tudelft.nl/uuid:483327a3-dcf7-4bd0-a986-21d9c8ec274e (accessed on 19 June 2020).
- Hallegatte, S.; Green, C.; Nicholls, R.J.; Corfee-Morlot, J. Future flood losses in major coastal cities. Nat. Clim. Chang. 2013, 3, 802–806. [Google Scholar] [CrossRef]
- Hauer, M.E.; Evans, J.M.; Mishra, D.R. Millions projected to be at risk from sea-level rise in the continental United States. Nat. Clim. Chang. 2016, 6, 691–695. [Google Scholar] [CrossRef]
- Vousdoukas, M.I.; Mentaschi, L.; Voukouvalas, E.; Verlaan, M.; Jevrejeva, S.; Jackson, L.P.; Feyen, L. Global probabilistic projections of extreme sea levels show intensification of coastal flood hazard. Nat. Commun. 2018, 9, 1–12. [Google Scholar] [CrossRef] [Green Version]
- Stronkhorst, J.; Huisman, B.; Giardino, A.; Santinelli, G.; Santos, F.D. Sand nourishment strategies to mitigate coastal erosion and sea level rise at the coasts of Holland (The Netherlands) and Aveiro (Portugal) in the 21st century. Ocean Coast. Manag. 2018, 156, 266–276. [Google Scholar] [CrossRef]
- Bartolini, S.; Mecocci, A.; Pozzebon, A.; Zoppetti, C.; Bertoni, D.; Sarti, G.; Caiti, A.; Costanzi, R.; Catani, F.; Ciampalini, A.; et al. Augmented virtuality for coastal management: A holistic use of in situ and remote sensing for large scale definition of coastal dynamics. ISPRS Int. J. Geo-Inf. 2018, 7, 92. [Google Scholar] [CrossRef] [Green Version]
- Davidson, M.A.; Splinter, K.D.; Turner, I.L. A simple equilibrium model for predicting shoreline change. Coast. Eng. 2013, 73, 191–202. [Google Scholar] [CrossRef]
- Deng, J.; Harff, J.; Zhang, W.; Schneider, R.; Dudzińska-Nowak, J.; Giza, A.; Terefenko, P.; Furmańczyk, K. The dynamic equilibrium shore model for the reconstruction and future projection of coastal morphodynamics. In Coastline Changes of the Baltic Sea from South to East; Springer: Cham, Switzerland, 2017; pp. 87–106. [Google Scholar] [CrossRef]
- Goldstein, E.B.; Coco, G.; Plant, N.G. A review of machine learning applications to coastal sediment transport and morphodynamics. Earth-Sci. Rev. 2019, 194, 97–108. [Google Scholar] [CrossRef] [Green Version]
- Cooper, N.J.; Hooke, J.M.; Bray, M.J. Predicting coastal evolution using a sediment budget approach: A case study from southern England. Ocean Coast. Manag. 2001, 44, 711–728. [Google Scholar] [CrossRef]
- Giardino, A.; Schrijvershof, R.; Nederhoff, C.M.; de Vroeg, H.; Brière, C.; Tonnon, P.K.; Caires, S.; Walstra, D.J.; Sosa, J.; van Verseveld, W.; et al. A quantitative assessment of human interventions and climate change on the West African sediment budget. Ocean Coast. Manag. 2018, 156, 249–265. [Google Scholar] [CrossRef]
- Hanson, H.; Brampton, A.; Capobianco, M.; Dette, H.H.; Hamm, L.; Laustrup, C.; Lechuga, A.; Spanhoff, R. Beach nourishment projects, practices, and objectives—A European overview. Coast. Eng. 2002, 47, 81–111. [Google Scholar] [CrossRef]
- Rosati, J.D. Concepts in sediment budgets. J. Coast. Res. 2005, 21, 307–322. [Google Scholar] [CrossRef]
- Patsch, K.; Griggs, G. A sand budget for the Santa Barbara littoral cell, California. Mar. Geol. 2008, 252, 50–61. [Google Scholar] [CrossRef]
- Hinderer, M. From gullies to mountain belts: A review of sediment budgets at various scales. Sediment. Geol. 2012, 280, 21–59. [Google Scholar] [CrossRef]
- de Figueiredo, S.A.; Cowell, P.J. Sensitivity of shoreline-recession forecasts to sediment budget uncertainties. J. Coast. Res. 2016, SI75, 947–951. [Google Scholar] [CrossRef]
- Ciarletta, D.J.; Shawler, J.L.; Tenebruso, C.; Hein, C.J.; Lorenzo-Trueba, J. Reconstructing coastal sediment budgets from beach-and foredune-ridge morphology: A coupled field and modeling approach. J. Geophys. Res.-Earth 2019, 124, 1398–1416. [Google Scholar] [CrossRef] [Green Version]
- Silva, A.N.; Taborda, R.; Andrade, C.; Ribeiro, M. The future of insular beaches: Insights from a past-to-future sediment budget approach. Sci. Total Environ. 2019, 676, 692–705. [Google Scholar] [CrossRef] [PubMed]
- Ehlers, E.; Krafft, T. Managing global change: Earth system science in the anthropocene. In Earth System Science in the Anthropocene; Springer: Berlin, Germany, 2006; pp. 5–12. [Google Scholar] [CrossRef]
- Zalasiewicz, J.; Williams, M.; Waters, C.N. Can an Anthropocene Series be defined and recognized? Geol. Soc. Spec. Publ. 2014, 395, 39–53. [Google Scholar] [CrossRef] [Green Version]
- Lewis, S.L.; Maslin, M.A. Defining the anthropocene. Nature 2015, 519, 171–180. [Google Scholar] [CrossRef] [PubMed]
- Ruddiman, W.F. Three flaws in defining a formal ‘Anthropocene’. Prog. Phys. Geogr. Earth Environ. 2018, 42, 451–461. [Google Scholar] [CrossRef]
- Syvitski, J.P.; Kettner, A. Sediment flux and the Anthropocene. Philos. Trans. R. Soc. A 2011, 369, 957–975. [Google Scholar] [CrossRef]
- Aswani, S.; Basurto, X.; Ferse, S.; Glaser, M.; Campbell, L.; Cinner, J.E.; Dalton, T.; Jenkins, L.D.; Miller, M.L.; Pollnac, R.; et al. Marine resource management and conservation in the Anthropocene. Environ. Conserv. 2018, 45, 192–202. [Google Scholar] [CrossRef] [Green Version]
- Wright, L.D.; Syvitski, J.P.M.; Nichols, C.R. Coastal systems in the anthropocene. In Tomorrow’s Coasts: Complex and Impermanent; Springer: Cham, Switzerland, 2019; pp. 85–99. [Google Scholar] [CrossRef]
- Valentini, E.; Taramelli, A.; Cappucci, S.; Filipponi, F.; Nguyen Xuan, A. Exploring the dunes: The correlations between vegetation cover pattern and morphology for sediment retention assessment using airborne multisensor acquisition. Remote Sens. 2020, 12, 1229. [Google Scholar] [CrossRef] [Green Version]
- Dean, R.G. Beach Nourishment: Theory and Practice; World Scientific Publishing Company: Singapore, 2002; p. 399. [Google Scholar]
- Bernatchez, P.; Fraser, C. Evolution of coastal defence structures and consequences for beach width trends, Québec, Canada. J. Coast. Res. 2012, 28, 1550–1566. [Google Scholar] [CrossRef]
- Luo, S.; Liu, Y.; Jin, R.; Zhang, J.; Wei, W. A guide to coastal management: Benefits and lessons learned of beach nourishment practices in China over the past two decades. Ocean Coast. Manag. 2016, 134, 207–215. [Google Scholar] [CrossRef]
- Gandolfi, G.; Paganelli, L. Il litorale pisano-versiliese (Area campione Alto Tirreno). Composizione, provenienza e dispersione delle sabbie. Boll. Soc. Geol. Ital. 1975, 94, 1273–1295. [Google Scholar]
- Anfuso, G.; Pranzini, E.; Vitale, G. An integrated approach to coastal erosion problems in northern Tuscany (Italy): Littoral morphological evolution and cell distribution. Geomorphology 2011, 129, 204–214. [Google Scholar] [CrossRef]
- Pranzini, E. Updrift river mouth migration on cuspate deltas: Two examples from the coast of Tuscany (Italy). Geomorphology 2001, 38, 125–132. [Google Scholar] [CrossRef]
- Cipriani, L.E.; Ferri, S.; Iannotta, P.; Paolieri, F.; Pranzini, E. Morfologia e dinamica dei sedimenti del litorale della Toscana settentrionale. Stud. Cost. 2001, 4, 119–156. [Google Scholar]
- Sarti, G.; Bertoni, D. Monitoring backshore and foreshore gravel deposits on a mixed sand and gravel beach (Apuane-Versilia coast, Tuscany, Italy). GeoActa 2007, 6, 73–81. [Google Scholar]
- Nordstrom, K.F.; Pranzini, E.; Jackson, N.L.; Coli, M. The marble beaches of Tuscany. Geogr. Rev. 2008, 98, 280–300. [Google Scholar] [CrossRef]
- Del Furia, L.; De Filippi, G.; D’Oriano, V.; Luciani, L.; Caminelli, M. Evoluzione morfologica della costa toscana: Principali risultati dello studio e ricerca per l’implementazione del quadro conoscitivo della costa toscana nell’ambito del Piano Regionale di Gestione Integrata della Costa. In Il Piano Regionale di gestione integrata della costa ai fini del riassetto idrogeologico—L’implementazione del quadro conoscitivo; Cipriani, L.E., Regoli, C., Eds.; Regione Toscana: Firenze, Italy, 2008; pp. 11–34. [Google Scholar]
- Garzanti, E.; Canclini, S.; Moretti Foggia, F.; Petrella, N. Unraveling magmatic and orogenic provenance in modern sand: The back-arc side of the Apennine thrust belt, Italy. J. Sediment. Res. 2002, 72, 2–17. [Google Scholar] [CrossRef]
- Bertoni, D.; Sarti, G. Grain size characterization of modern and ancient dunes within a dune field along the Pisan coast (Tuscany, Italy). Atti Soc. Toscana Sci. Nat. Mem. Ser. A 2011, 116, 11–16. [Google Scholar] [CrossRef]
- Bertoni, D.; Biagioni, C.; Sarti, G.; Ciccarelli, D.; Ruocco, M. The role of sediment grain-size, mineralogy, and beach morphology on plant communities of two Mediterranean coastal dune systems. Ital. J. Geosci. 2014, 133, 271–281. [Google Scholar] [CrossRef]
- Ciampalini, A.; Consoloni, I.; Salvatici, T.; Di Traglia, F.; Fidolini, F.; Sarti, G.; Moretti, S. Characterization of coastal environment by means of hyper- and multispectral techniques. Appl. Geogr. 2015, 57, 120–132. [Google Scholar] [CrossRef]
- Cavazza, S.; Pregliasco, P. Sulle modificazioni dell’apporto terrigeno alla foce del fiume Magra causate dall’uomo. In Tra Fiumi, Mare e Terraferma; Tipografia Zappa: Sarzana, Italy, 1981; pp. 57–128. [Google Scholar]
- Rinaldi, M.; Simoncini, C.; Piégay, H. Scientific design strategy for promoting sustainable sediment management: The case of the Magra River (Central-Northern Italy). River Res. Appl. 2009, 25, 607–625. [Google Scholar] [CrossRef]
- Billi, P.; Rinaldi, M. Human impact on sediment yield and channel dynamics in the Arno River basin (central Italy). In Proceedings of the Rabat Symposium S6; IAHS Publ.: Wallingford, UK, 1997; Volume 245, pp. 301–311. [Google Scholar]
- Rinaldi, M.; Simon, A. Bed-level adjustments in the Arno River, central Italy. Geomorphology 1998, 22, 57–71. [Google Scholar] [CrossRef]
- Simon, A.; Rinaldi, M. Disturbance, stream incision, and channel evolution: The roles of excess transport capacity and boundary materials in controlling channel response. Geomorphology 2006, 79, 361–383. [Google Scholar] [CrossRef]
- Cappucci, S.; Lisi, I.; Ciavola, P.; Rossi, L. Sediment delivery at sea by the Magra River, Northern Italy. Rev. Paralia Éd. Pap. 2015, 8, 25–30. [Google Scholar]
- Pratellesi, M.; Ciavola, P.; Ivaldi, R.; Anthony, E.J.; Armaroli, C. River-mouth geomorphological changes over >130 years (1882–2014) in a small Mediterranean delta: Is the Magra delta reverting to an estuary? Mar. Geol. 2018, 403, 215–224. [Google Scholar] [CrossRef]
- Monti, S.; Rapetti, F. Stima del trasporto potenziale sul fondo del fiume Arno (Toscana) trail 1951 eil 2010. Atti Soc. Toscana Sci. Nat. Mem. Ser. A 2011, 115–126. [Google Scholar] [CrossRef]
- Pranzini, E. Bilancio sedimentario ed evoluzione storica delle spiagge. Il Quat. 1994, 7, 197–204. [Google Scholar]
- Aminti, P.; Cipriani, L.E.; Pranzini, E. «Back to the beach»: Converting seawalls into gravel beaches. In Proceedings of the First International Soft Shore Protection Conference, Patras, Greece, 18–22 October 2000; pp. 187–196. [Google Scholar]
- Pranzini, E. L’intervento di stabilizzazione del litorale de Le Lame (Parco San Rossore Migliarino Massaciuccoli, Toscana). Stud. Cost. 2008, 14, 29–42. [Google Scholar]
- Alquini, F.; Bertoni, D.; Sarti, G. Extreme erosion of a dune crest within a short timespan (January-September 2016): The recent case in the Migliarino—San Rossore—Massaciuccoli Regional Park (Tuscany, Italy). Atti Soc. Toscana Sci. Nat. Memorie Ser. A 2016, 123, 5–16. [Google Scholar] [CrossRef]
- Cappucci, S.; Scarcella, D.; Rossi, L.; Taramelli, A. Integrated Coastal Zone Management at Marina di Carrara Harbor: Sediment management and policy making. J. Ocean Coast. Manag. 2011, 54, 277–289. [Google Scholar] [CrossRef]
- Piccardi, M.; Pranzini, E.; Rombai, L. Historical cartography and coastal dynamics of the Apuan littoral in the modern and contemporary periods: The port of Marina di Carrara (Tuscany, Italy). e-Perimetron 2018, 13, 32–49. [Google Scholar]
- Pranzini, E.; Anfuso, G.; Cinelli, I.; Piccardi, M.; Vitale, G. Shore Protection Structures Increase and Evolution on the Northern Tuscany Coast (Italy): Influence of Tourism Industry. Water 2018, 10, 1647. [Google Scholar] [CrossRef] [Green Version]
- Chiocci, F.L.; Cipriani, L.E.; Falese, F.; La Monica, G.B. Search and characterization of relict sand deposits on the Tuscany continental shelf for the artificial nourishment of eroding beaches. Abstract book. In Proceedings of the 27th IAS Meeting of Sedimentology, Alghero, Italy, 20–23 September 2009; p. 106. [Google Scholar]
- Cipriani, L.E.; Barghigiani, C.; Bigongiari, N.; Budillon, G.; Capello, M.; Castellano, M.; Chiarlo, R.; Cutroneo, L.; De Biasi, A.; Kozinkova, L.; et al. A case study to evaluate the environmental impact of relict sand dredging along the Tuscany continental shelf. In Proceedings of the 7th International SedNet Conference, Venice, Italy, 6–9 April 2011. [Google Scholar]
- Bigongiari, N.; Cipriani, L.E.; Pranzini, E.; Renzi, M.; Vitale, G. Assessing shelf aggregate environmental compatibility and suitability for beach nourishment: A case study for Tuscany (Italy). Mar. Pollut. Bull. 2015, 93, 183–193. [Google Scholar] [CrossRef] [PubMed]
- Trembanis, A.C.; Valverde, H.R.; Pilkey, O.H. Comparison of Beach Nourishment Along the U.S. Atlantic, Great Lakes, Gulf of Mexico and New England Shorelines. Coast. Manag. 1999, 27, 329–340. [Google Scholar] [CrossRef]
- Thornton, E.B. Temporal and spatial variations in sand budgets with application to southern Monterey Bay, California. Mar. Geol. 2016, 382, 56–67. [Google Scholar] [CrossRef] [Green Version]
- Dan, S.; Vandebroek, E. A Sediment Budget for a Highly Developed Coast—Belgian Case; Coastal Dynamics: Helsingør, Denmark, 2017; pp. 1376–1385. [Google Scholar]
- Messaros, R.C.; Rosati, J.D.; Buonaiuto, F.; Rasmussen, C.; Vega, A.M.; Bocamazo, L. Assessing the coastal resilience of manasquan inlet to Sea Bright, New Jersey: Regional sediment budget 1992–2003. J. Coast. Res. 2018, 34, 955–967. [Google Scholar] [CrossRef]
- Pinto, C.A.; Silveira, T.M.; Teixeira, S.B. Beach nourishment practice in mainland Portugal (1950–2017): Overview and retrospective. Ocean Coast. Manag. 2020, 192, 105211. [Google Scholar] [CrossRef]
- Rapetti, F.; Vittorini, S. Osservazioni sulle variazioni dell’ala destra del Delta dell’Arno. Atti Soc. Toscana Sci. Nat. Mem. Ser. A 1974, 81, 25–88. [Google Scholar]
- Mazzanti, R. Il punto sul Quaternario della fascia costiera e dell’arcipelago di Toscana. Boll. Soc. Geol. Ital. 1983, 102, 419–556. [Google Scholar]
- Aminti, P.; Iannotta, P.; Pranzini, E. Morfodinamica di un sistema costiero intensamente protetto: Il litorale di Marina di Massa. Atti Conv. Lincei 1998, 154, 263–270. [Google Scholar]
- Pranzini, E.; Cinelli, I.; Cipriani, L.E.; Anfuso, G. An integrated coastal sediment management plan: The example of the Tuscany region (Italy). J. Mar. Sci. Eng. 2020, 8, 33. [Google Scholar] [CrossRef] [Green Version]
- Hallermeier, R.J. A profile zonation for seasonal sand beaches from wave climate. Coast. Eng. 1981, 4, 253–277. [Google Scholar] [CrossRef]
- Amorosi, A.; Sammartino, I.; Sarti, G. Background levels of potentially toxic metals from soils of the Pisa coastal plain (Tuscany, Italy) as identified from sedimentological criteria. Environ. Earth Sci. 2013, 69, 1661–1671. [Google Scholar] [CrossRef]
- Sarti, G.; Sammartino, I.; Amorosi, A. Geochemical anomalies of potentially hazardous elements reflect catchment geology: An example from the Tyrrhenian coast of Italy. Sci. Total Environ. 2020, 714, 136870. [Google Scholar] [CrossRef]
- Cappucci, S.; Vaccari, M.; Falconi, M.; Tudor, T. Sustainable management of sedimentary resources: A case study of EGADI Project. Environ. Eng. Manag. J. 2019, 18, 317–328. [Google Scholar]
- Peres, F.; Cappucci, S. Dragaggi, nuove procedure per siti di interesse nazionale. Ambiente Sicur. Sole24Ore 2016, 16, 76–80. [Google Scholar]
- Peres, F.; Cappucci, S. Sedimenti: Nuove regole sulla gestione con i DM 172 e 173. Ambiente Sicur. Sole24Ore 2016, 21, 54–68. [Google Scholar]
- Bini, M.; Casarosa, N.; Ribolini, A. Multitemporal (1938-2004) evolution of the Pisan shoreline based on the comparison of georeferenced aerial images. Atti Soc. Toscana Sci. Nat. Mem. Ser. A 2008, 113, 1–12. [Google Scholar]
- Berriolo, G.; Sirito, G. Spiagge e Porti Turistici; U. Hoepli editore: Milan, Italy, 1972; p. 428. [Google Scholar]
- Pranzini, E. Shore protection in Italy: From hard to soft engineering… and back. Ocean Coast. Manag. 2018, 156, 43–57. [Google Scholar] [CrossRef]
- Nicholls, R.J.; Birkemeier, W.A.; Hallermeier, R.J. Application of the depth of closure concept. In Proceedings of the 25th International Conference on Coastal Engineering, Orlando, FL, USA, 2–6 September 1996; pp. 3874–3887. [Google Scholar]
- Phillips, M.R.; Williams, A.T. Depth of closure and shoreline indicators: Empirical formulae for beach management. J. Coast. Res. 2007, 23, 487–500. [Google Scholar] [CrossRef]
- Valiente, N.G.; Masselink, G.; Scott, T.; Conley, D.; McCarroll, R.J. Role of waves and tides on depth of closure and potential for headland bypassing. Mar. Geol. 2019, 407, 60–75. [Google Scholar] [CrossRef]
- Hartman, M.; Kennedy, A.B. Depth of closure over large regions using airborne bathymetric lidar. Mar. Geol. 2016, 379, 52–63. [Google Scholar] [CrossRef]
- Udo, K.; Ranasinghe, R.; Takeda, Y. An assessment of measured and computed depth of closure around Japan. Sci. Rep. 2020, 10, 1–8. [Google Scholar] [CrossRef] [PubMed] [Green Version]
- Hallermeier, R.J. Uses for a calculated limit depth to beach erosion. In Proceedings of the 16th Coastal Engineering Conference, New York, NY, USA, 27 August–3 September 1978; pp. 1493–1512. [Google Scholar]
- Capobianco, M.; Larson, M.; Nicholls, R.J.; Kraus, N.C. Depth of closure: A contribution to the reconciliation of theory, practise and evidence. In Proceedings of the Coastal Dynamics, Plymouth, UK, 1 June 1997; pp. 506–515. [Google Scholar]
- Nicholls, R.J.; Birkemeier, W.A.; Lee, G. Evaluation of depth of closure using data from Duck, NC, USA. Mar. Geol. 1998, 148, 179–201. [Google Scholar] [CrossRef]
- Robertson, W.; Zhang, K.; Finkl, C.W.; Whitman, D. Hydrodynamic and geologic influence of event-dependent depth of closure along the South Florida Atlantic Coast. Mar. Geol. 2008, 252, 156–165. [Google Scholar] [CrossRef]
- Wallace, D.J.; Anderson, J.B.; Fernández, R.A. Transgressive ravinement versus depth of closure: A geological perspective from the upper Texas coast. J. Coast. Res. 2010, 26, 1057–1067. [Google Scholar] [CrossRef]
- Ortiz, A.C.; Ashton, A.D. Exploring shoreface dynamics and a mechanistic explanation for a morphodynamic depth of closure. J. Geophys. Res. Earth Surf. 2016, 121, 442–464. [Google Scholar] [CrossRef]
- Valiente, N.G.; Masselink, G.; Scott, T.; Conley, D. Depth of Closure along an Embayed, Macro-Tidal and Exposed Coast: A Multi-Criteria Approach; Coastal Dynamics: Helsingør, Denmark, 2017; p. 185. [Google Scholar]
- Thieler, E.R.; Pilkey, O.H.; Cleary, W.J.; Schwab, W.C. Modern sedimentation on the shoreface and inner continental shelf at wrightsville beach, North Carolina, U.S.A. J. Sediment. Res. 2001, 71, 958–970. [Google Scholar] [CrossRef]
- Conti, M.; Cappucci, S.; La Monica, G.B. Sediment dynamic of nourished sandy beaches. Rend. Online Soc. Geol. Ital. 2009, 8, 31–38. [Google Scholar]
- Pallottini, E.; Cappucci, S. Beach-dune system interaction and evolution. Rend. Online Soc. Geol. Ital. 2009, 8, 87–97. [Google Scholar]
- Ausili, A.; Cappucci, S.; Gabellini, M.; Innocenti, C.; Maffucci, M.; Romano, E.; Rossi, L.; Taramelli, A. New approaches for multi source data sediment characterisation, thickness assessment and clean up strategies. Chem. Eng. Trans. 2012, 28, 223–228. [Google Scholar] [CrossRef]
- Hauge, A.; Konieczny, R.M.; Halvorsen, P.O.; Eikum, A. Remediation of contaminated sediments in Oslo Harbour, Norway. Water Sci. Technol. 1998, 37, 299–305. [Google Scholar] [CrossRef]
- Bergen, B.J.; Nelson, W.G.; Mackay, J.; Dickerson, D.; Jayaraman, S. Environmental monitoring of remedial dredging at the New Bedford Harbor, MA, Superfund site. Environ. Monit. Assess. 2005, 111, 257–275. [Google Scholar] [CrossRef]
- Walker, T.R.; MacAskill, D.; Weaver, P. Environmental recovery in Sydney Harbour, Nova Scotia: Evidence of natural and anthropogenic sediment capping. Mar. Pollut. Bull. 2013, 74, 446–452. [Google Scholar] [CrossRef]
- Lofrano, G.; Libralato, G.; Minetto, D.; De Gisi, S.; Todaro, F.; Conte, B.; Calabrò, D.; Quatraro, L.; Notarnicola, M. In situ remediation of contaminated marine sediment: An overview. Environ. Sci. Pollut. Res. 2017, 24, 5189–5206. [Google Scholar] [CrossRef] [Green Version]
- Libralato, G.; Minetto, D.; Lofrano, G.; Guida, M.; Carotenuto, M.; Aliberti, F.; Conte, B.; Notarnicola, M. Toxicity assessment within the application of in situ contaminated sediment remediation technologies: A review. Sci. Total Environ. 2018, 621, 85–94. [Google Scholar] [CrossRef]
Figure 1.
Map of the study area. (a) the Tuscany coast, with the indication of the study area (yellow line) and the location of the two continental shelf relict sand reservoirs (yellow squares: 1: Massa; 2: Piombino); (b) zoom-in of the study area: green and red lines indicate accretion and erosion areas respectively; the sites characterized by equilibrium are indicated with white lines; the red dots represent the location of the ports of Marina di Carrara and Viareggio; the yellow triangles point out the approximate locations of the offshore dumping sites; the purple dots represent the borrow sites of shoreface dredging; the black numbers correspond to the 5 sub-cells in which the main littoral cell has been subdivided; the black arrows point out the direction of the littoral drifts.

Figure 2.
A simplified sketch of the emerged and submerged beach profiles along the 5 sub-cells within the study area (not in scale). The shoreline along Sub-cells 1 and 2 is about 62% and 85% armored, respectively, whereas it is just 22% in Sub-cell 5. Conversely, Sub-cells 3 and 4 have no protection structures. The blue, horizontal line represents the mean sea level (msl).

Figure 3.
Flux diagram showing the general concepts related to the anthropogenic sediment budget calculation. The river bedload decrease is the main driver of the erosion effects, and it is not matched by all the other activities involving sediment input, output and transfer. Green and red arrows represent inputs and outputs respectively; gray arrows represent transfers.

Figure 4.
The diagram shows the sum of all the contributions to sediment input, output, and transfer (expressed in m3) in the 1980–2020 timespan. The red column represents the anthropogenic sediment budget, calculated as the algebraic sum of inputs and outputs. The whiskers represent the 3% of uncertainty.

Figure 5.
Aerial view (GoogleEarth database) of the northernmost sector of the study area (sub-cells 1 and 2), from the Versilia River mouth to the Magra River mouth. The image is tilted, so the scale is not uniform: as a reference, the distance between the Magra River mouth and the Versilia River mouth is about 14.5 km.

Figure 6.
The diagrams show (a) the shoreline linear variations and (b) the rate of shoreline variations in the 1984/1985–2005 (according to [85]) and 2005–2019 timespans along the study area. The numbers to the left of each panel correspond to the sub-cells we considered for the anthropogenic sediment budget calculation. The yellow and the gray bars beside the blue and red bars, respectively, represent the uncertainty related to the calculation of shoreline variations in the two time intervals considered.

Figure 7.
The diagram shows the contributions of sediment input, output and transfer (expressed in m3) in the 1980–2020 timespan for each sub-cell. The whiskers represent the 3% of uncertainty.
Figure 7.
The diagram shows the contributions of sediment input, output and transfer (expressed in m3) in the 1980–2020 timespan for each sub-cell. The whiskers represent the 3% of uncertainty.

Figure 8.
The plots show the contributions of input, output and transfer (expressed in m3) to the anthropogenic sediment budget in the 1980–2020 timespan. (a) sediment redistribution activities within the limit of the study area are considered as transfers; (b) sediment transfers between different sub-cells are considered as inputs and outputs.

Figure 9.
Annual sediment redistribution (expressed in m3) within the Northern Tuscany littoral cell within our timespan. Here, transfers from one sub-cell to another are considered as separate inputs and outputs. Each value has a 3% of uncertainty.
Figure 9.
Annual sediment redistribution (expressed in m3) within the Northern Tuscany littoral cell within our timespan. Here, transfers from one sub-cell to another are considered as separate inputs and outputs. Each value has a 3% of uncertainty.

Figure 10.
Aerial views of three hotspots along the Northern Tuscany littoral cell with the indication of beach width. (a) updrift beach at the Port of Marina di Carrara; (b) updrift beach at the Port of Viareggio; (c) the convergence area at Marina di Pietrasanta. The images were retrieved from the GoogleEarth database.

Figure 11.
Eroding dunes at the Migliarino-San Rossore-Massaciuccoli Regional Park.


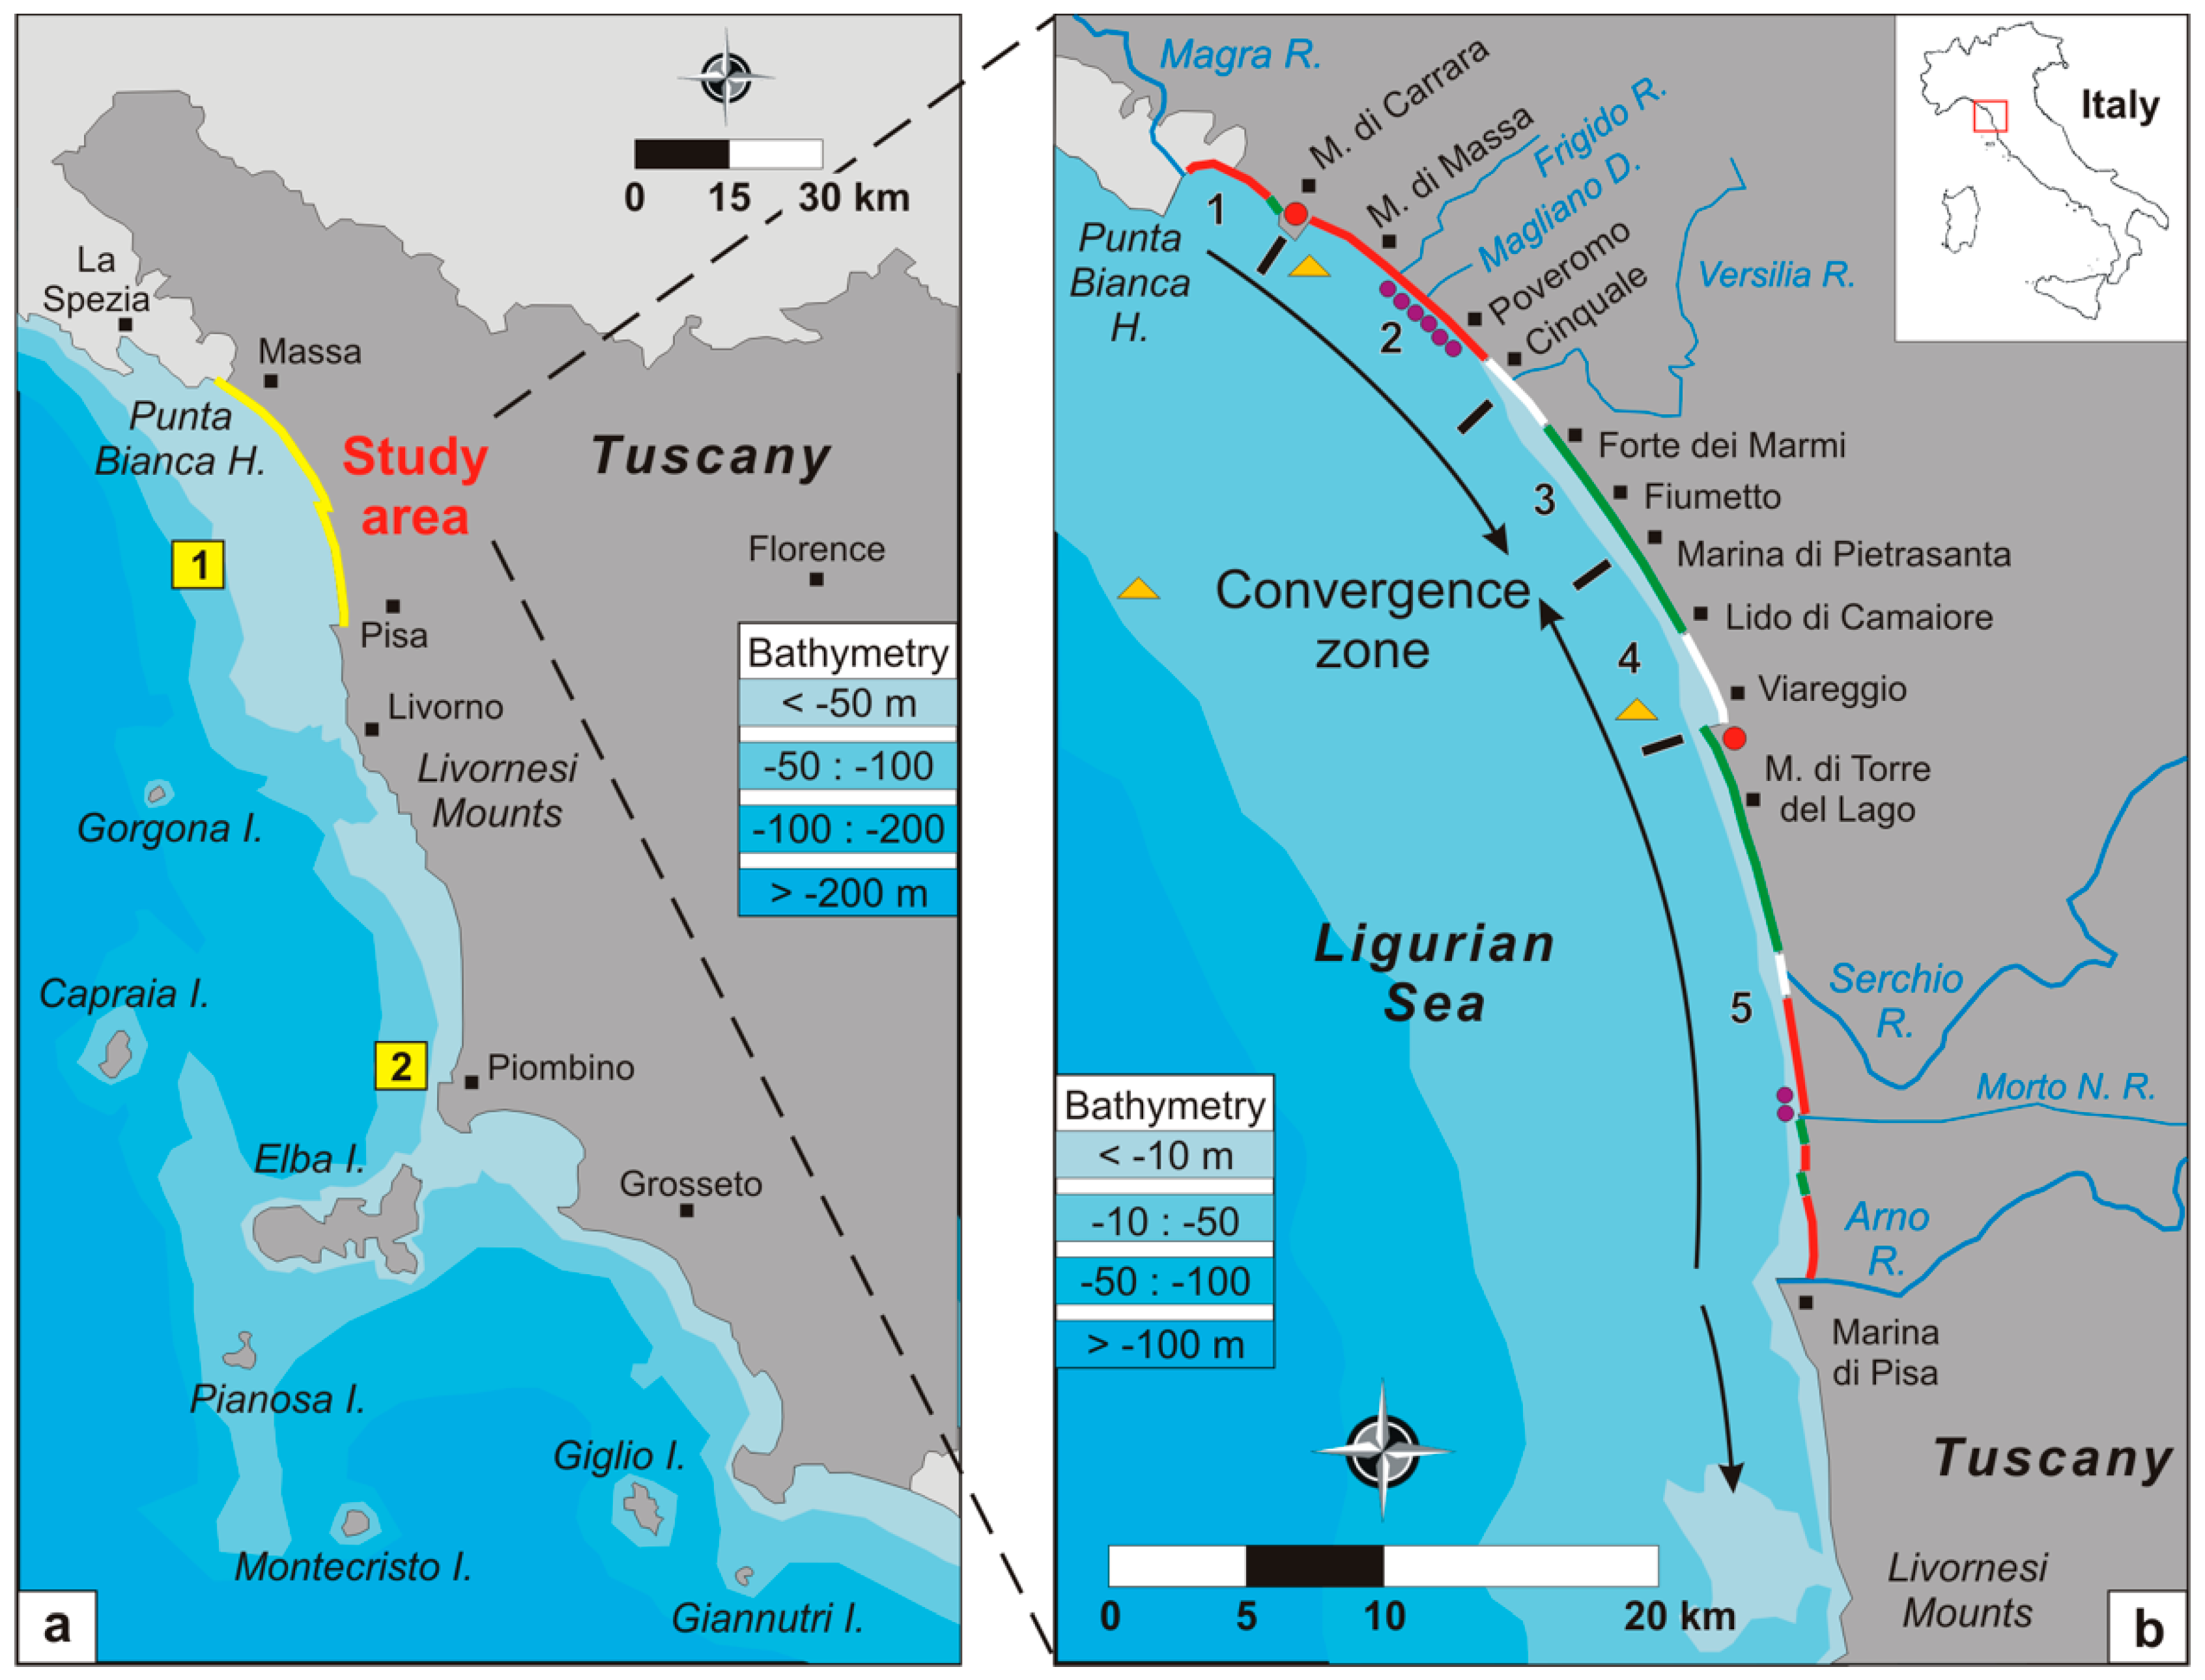
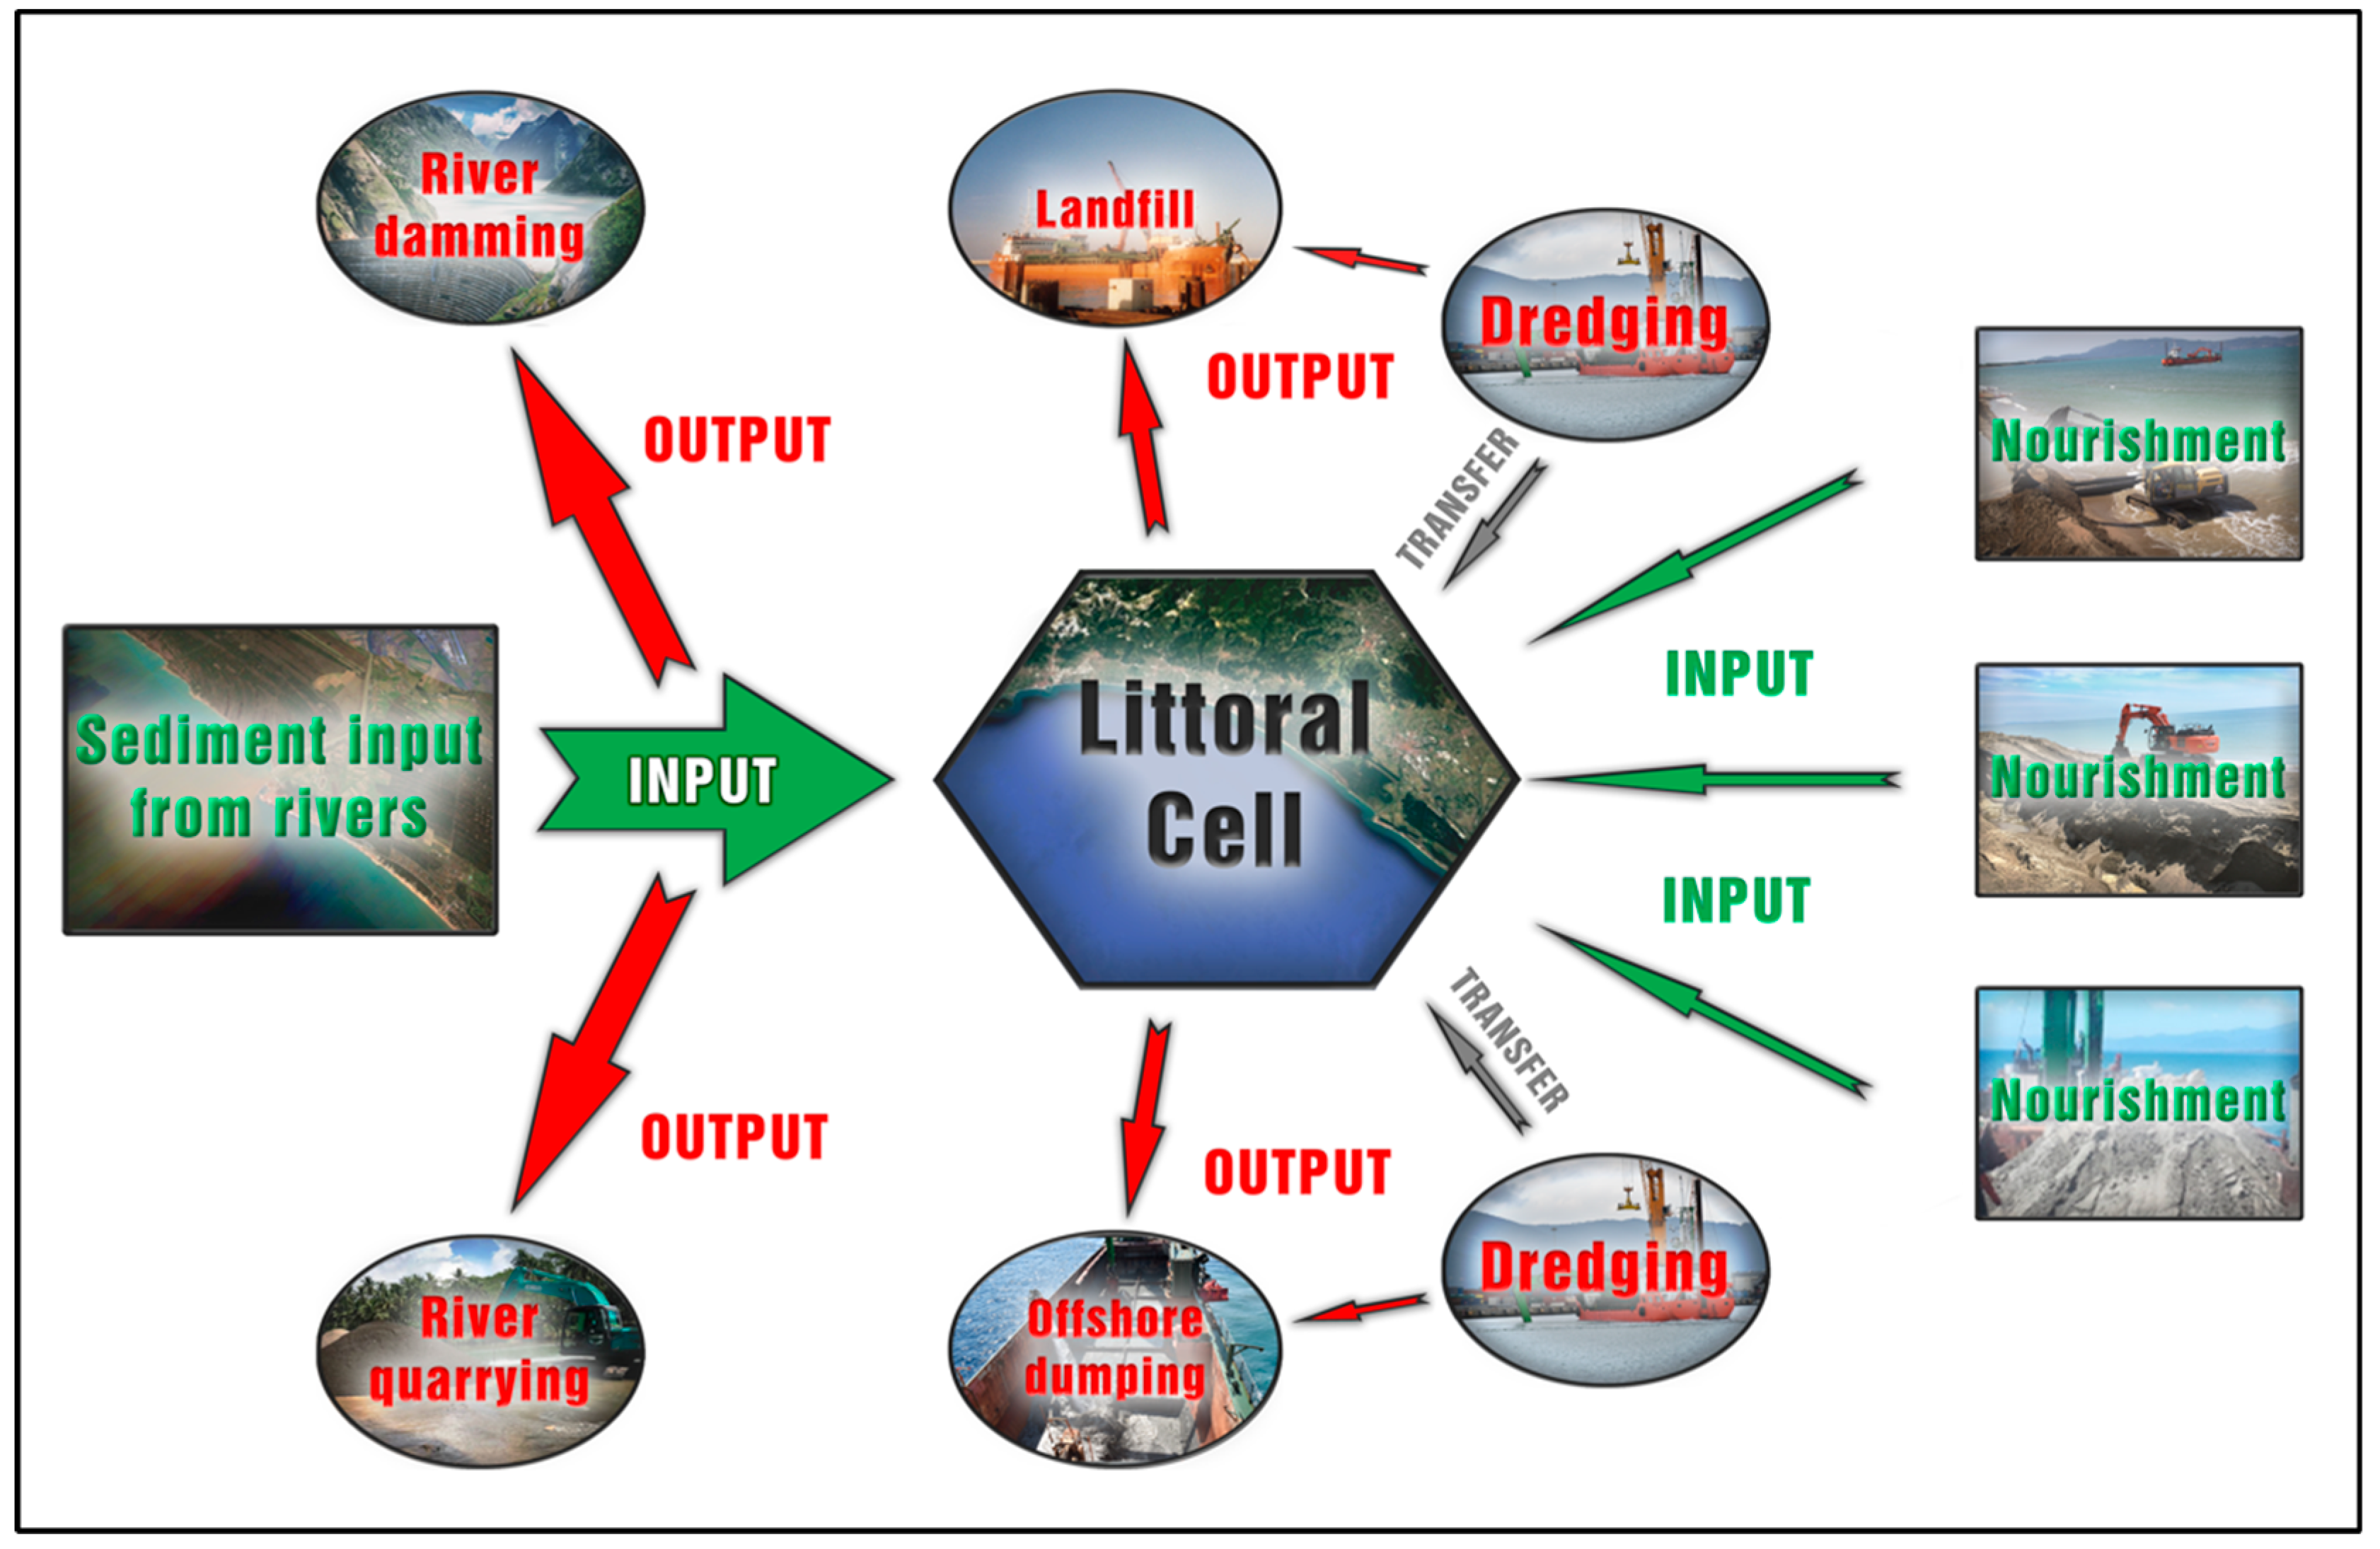
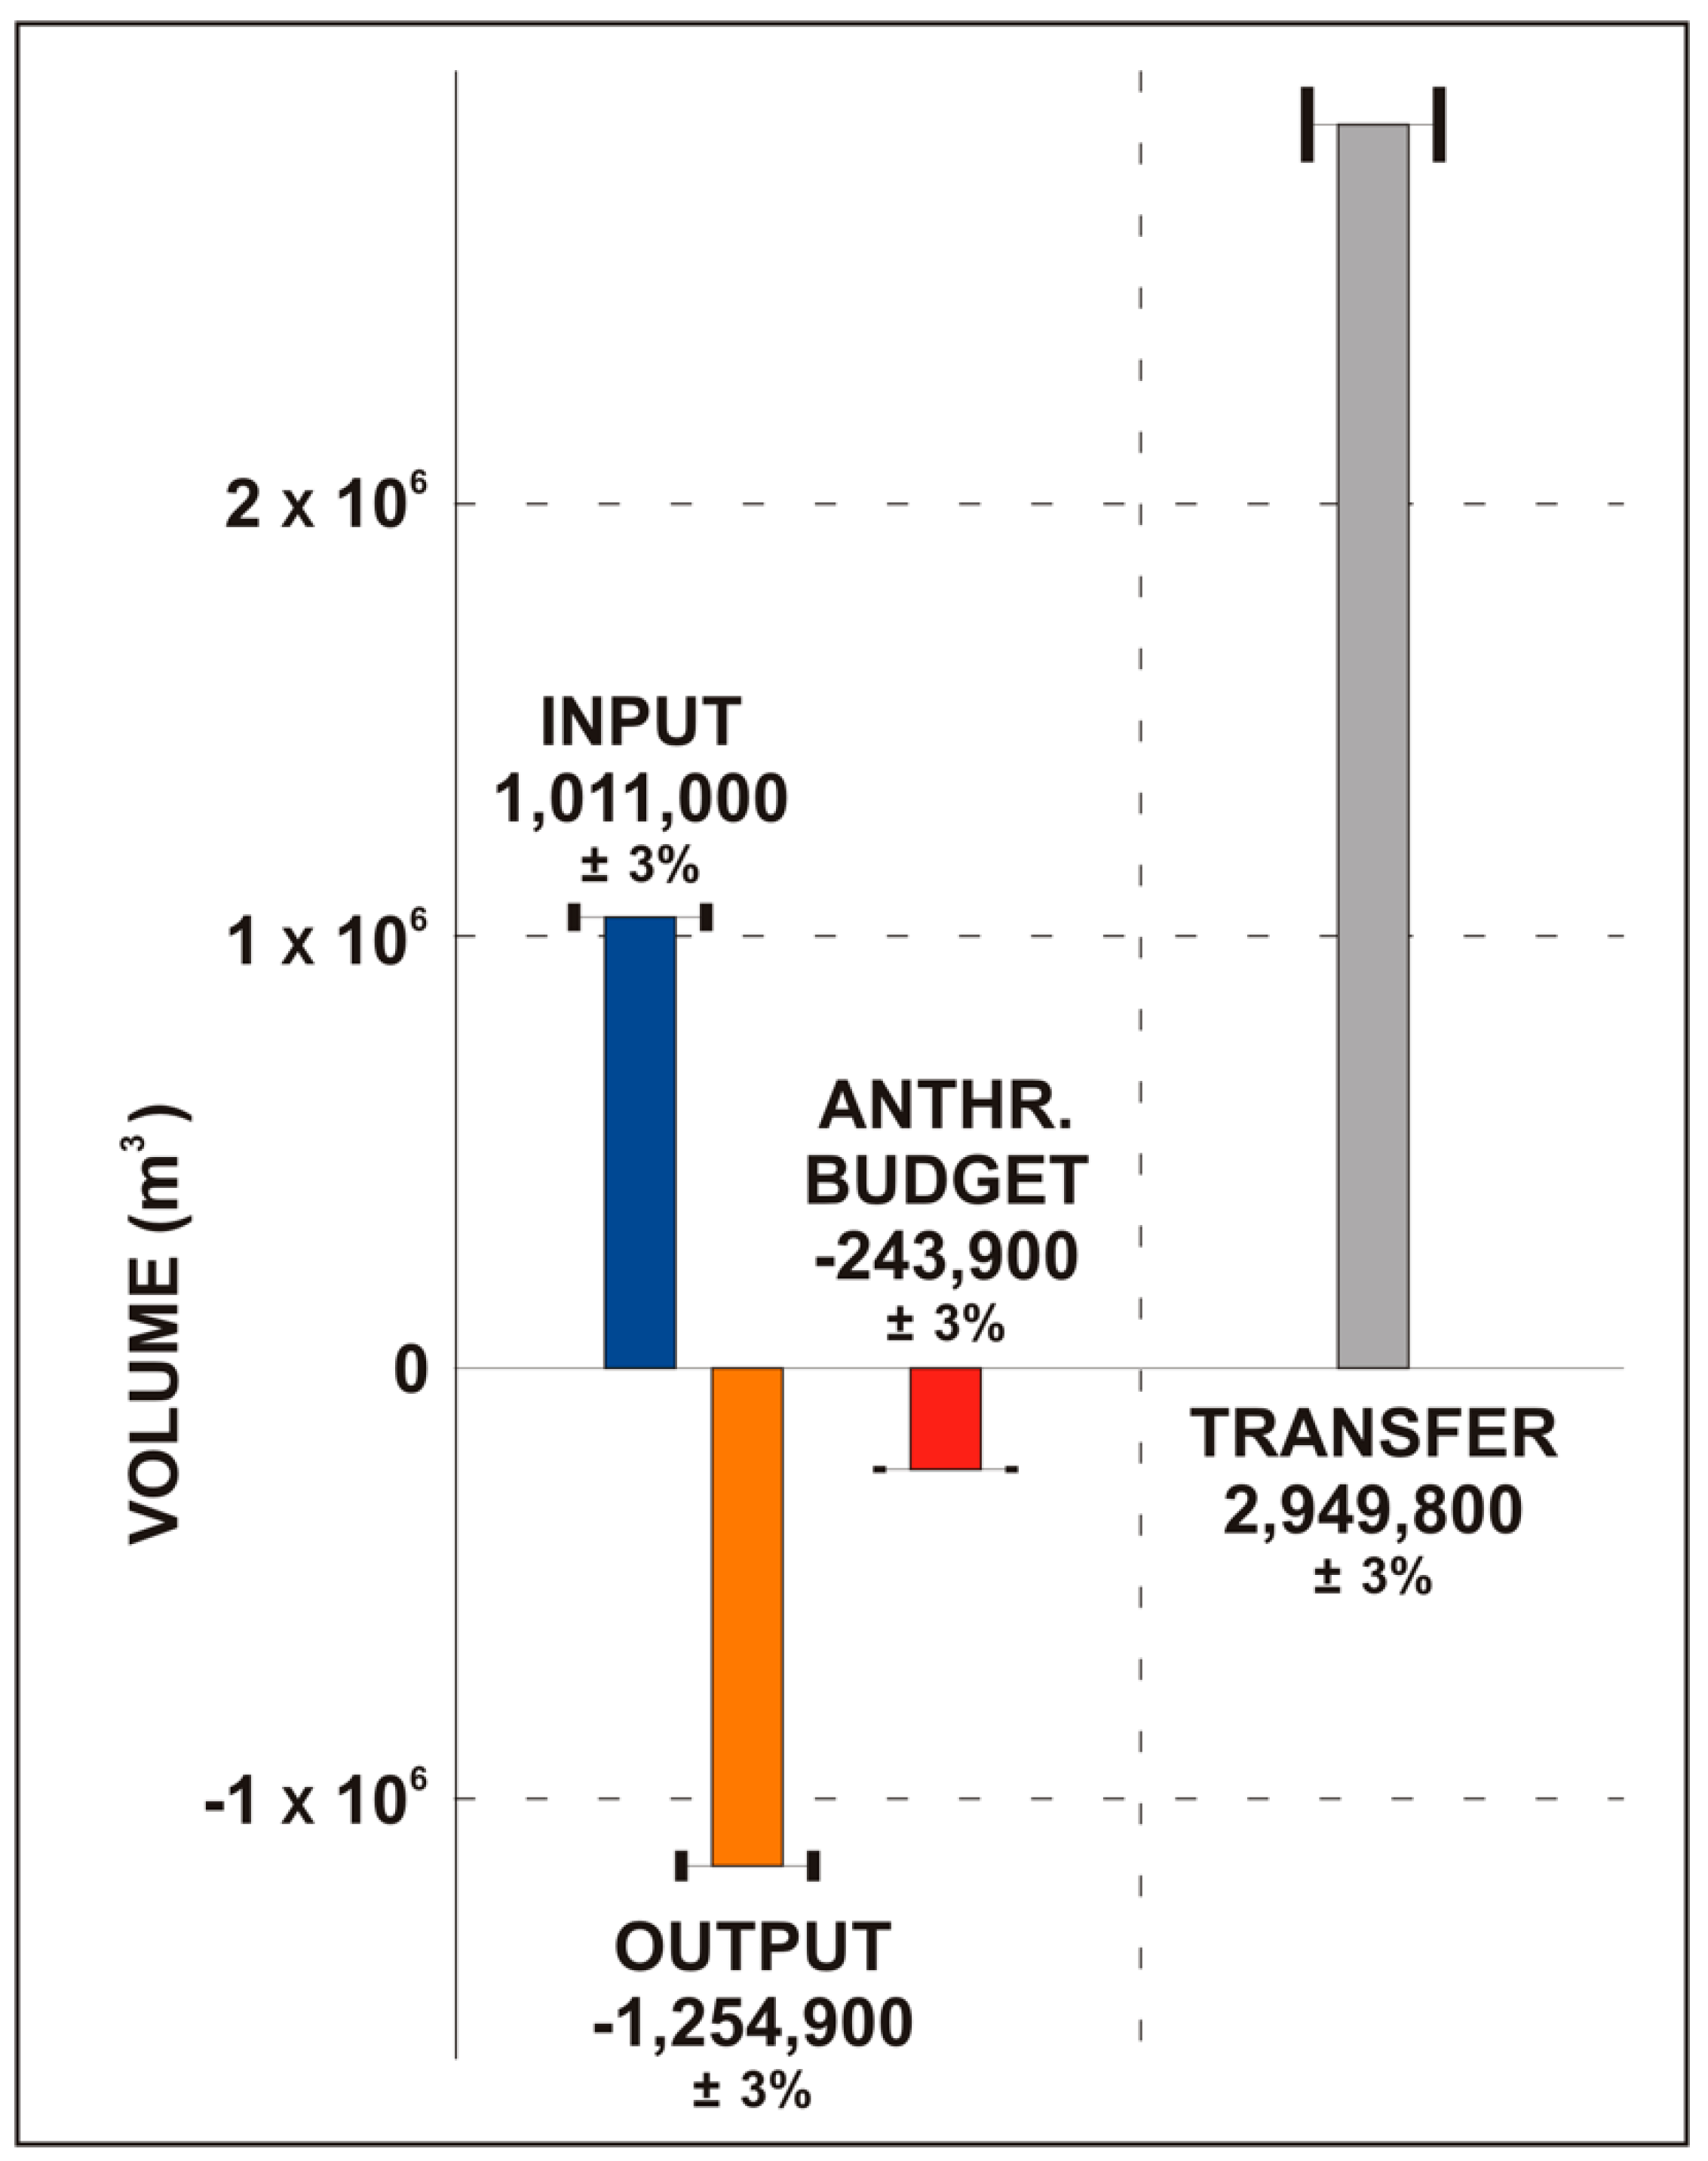
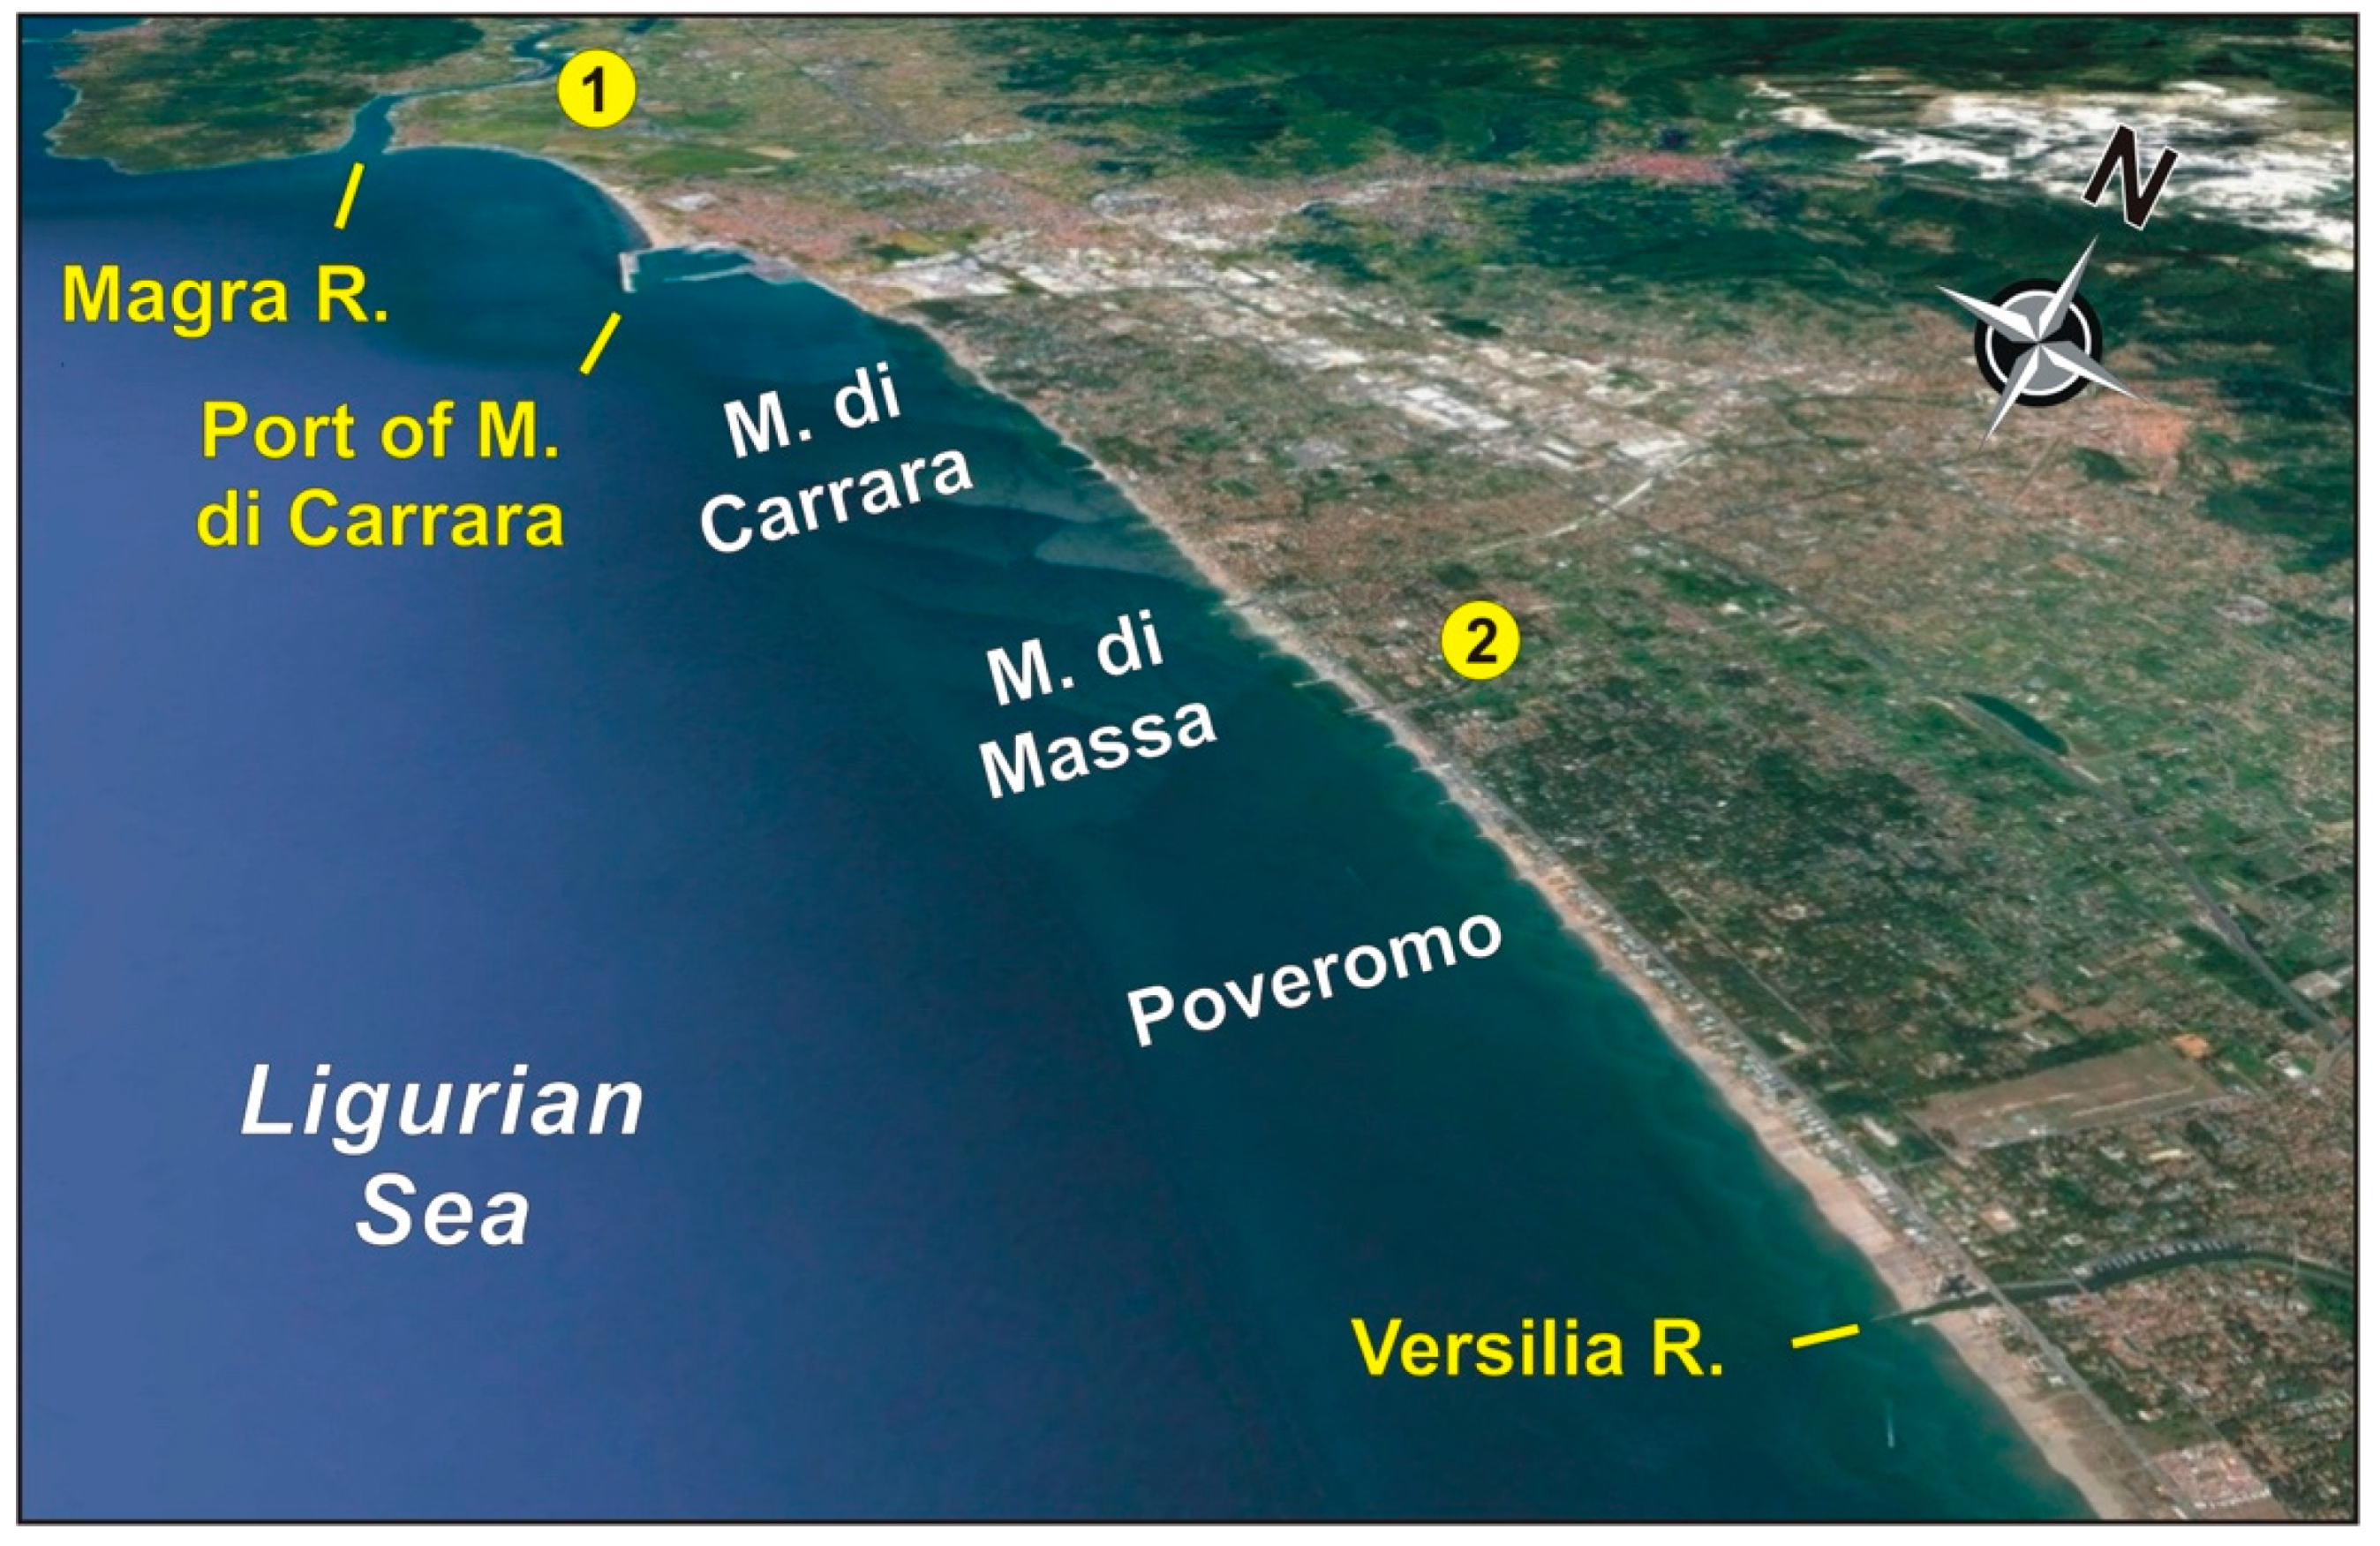
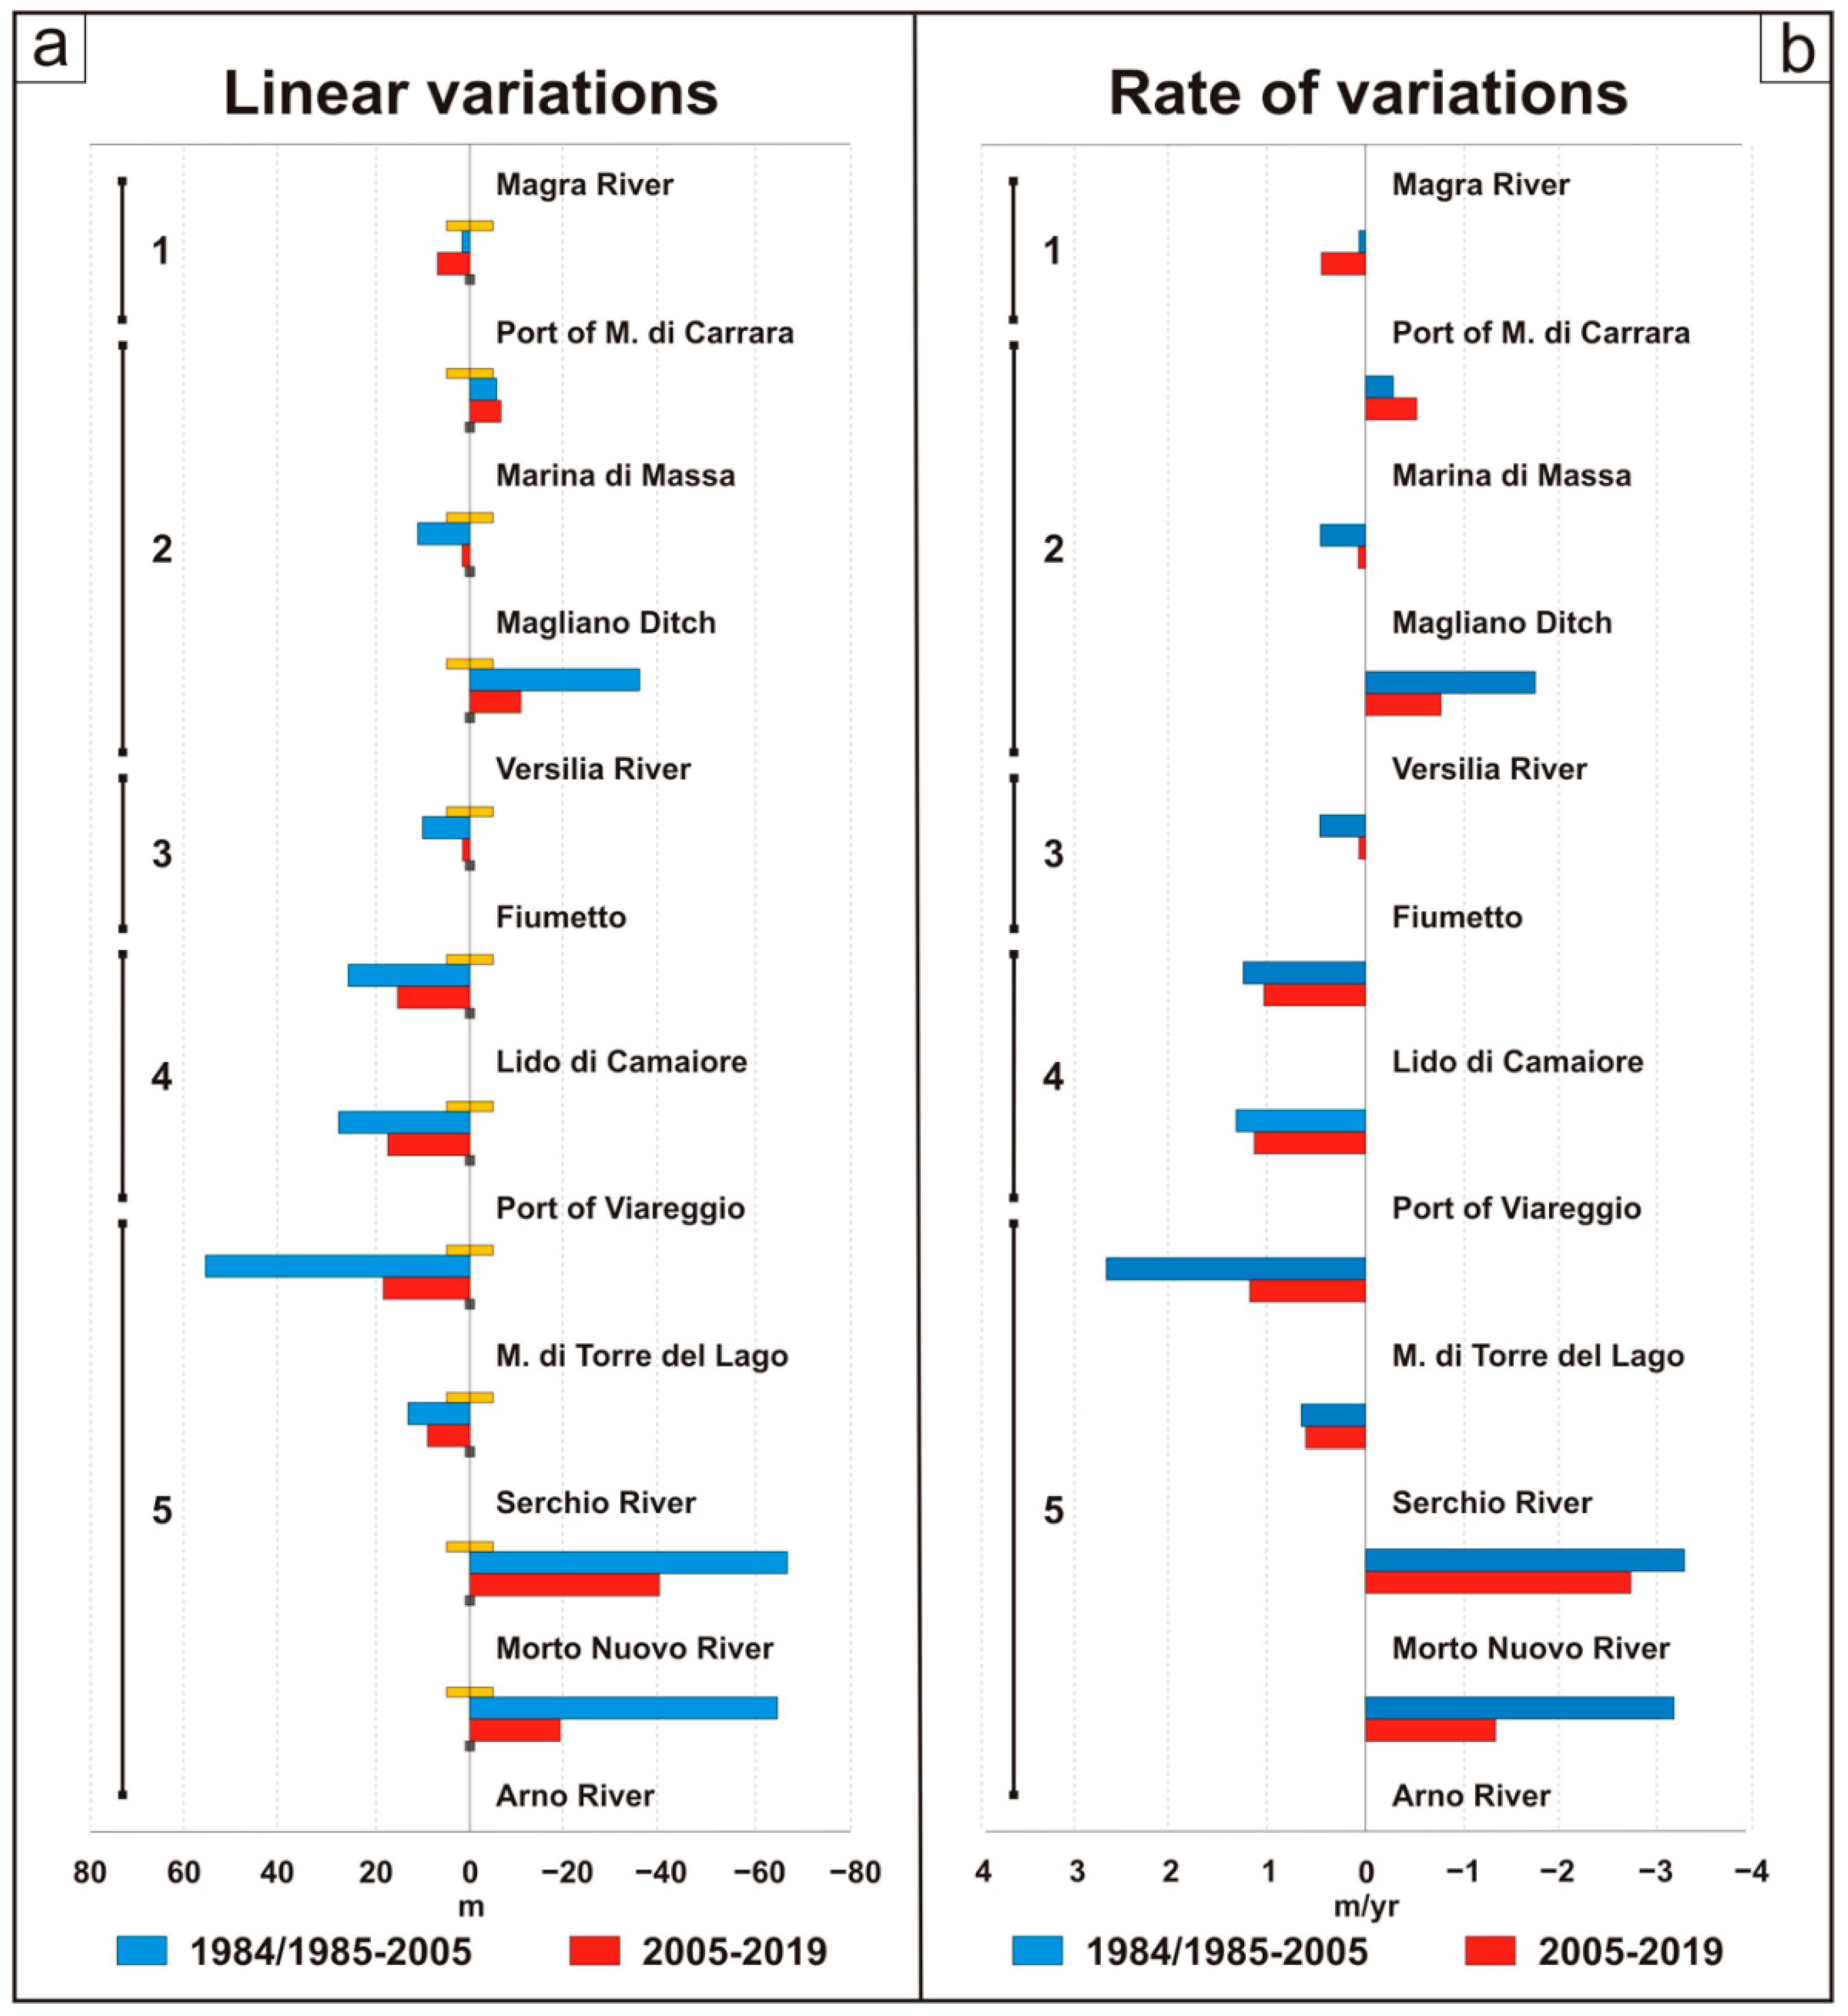
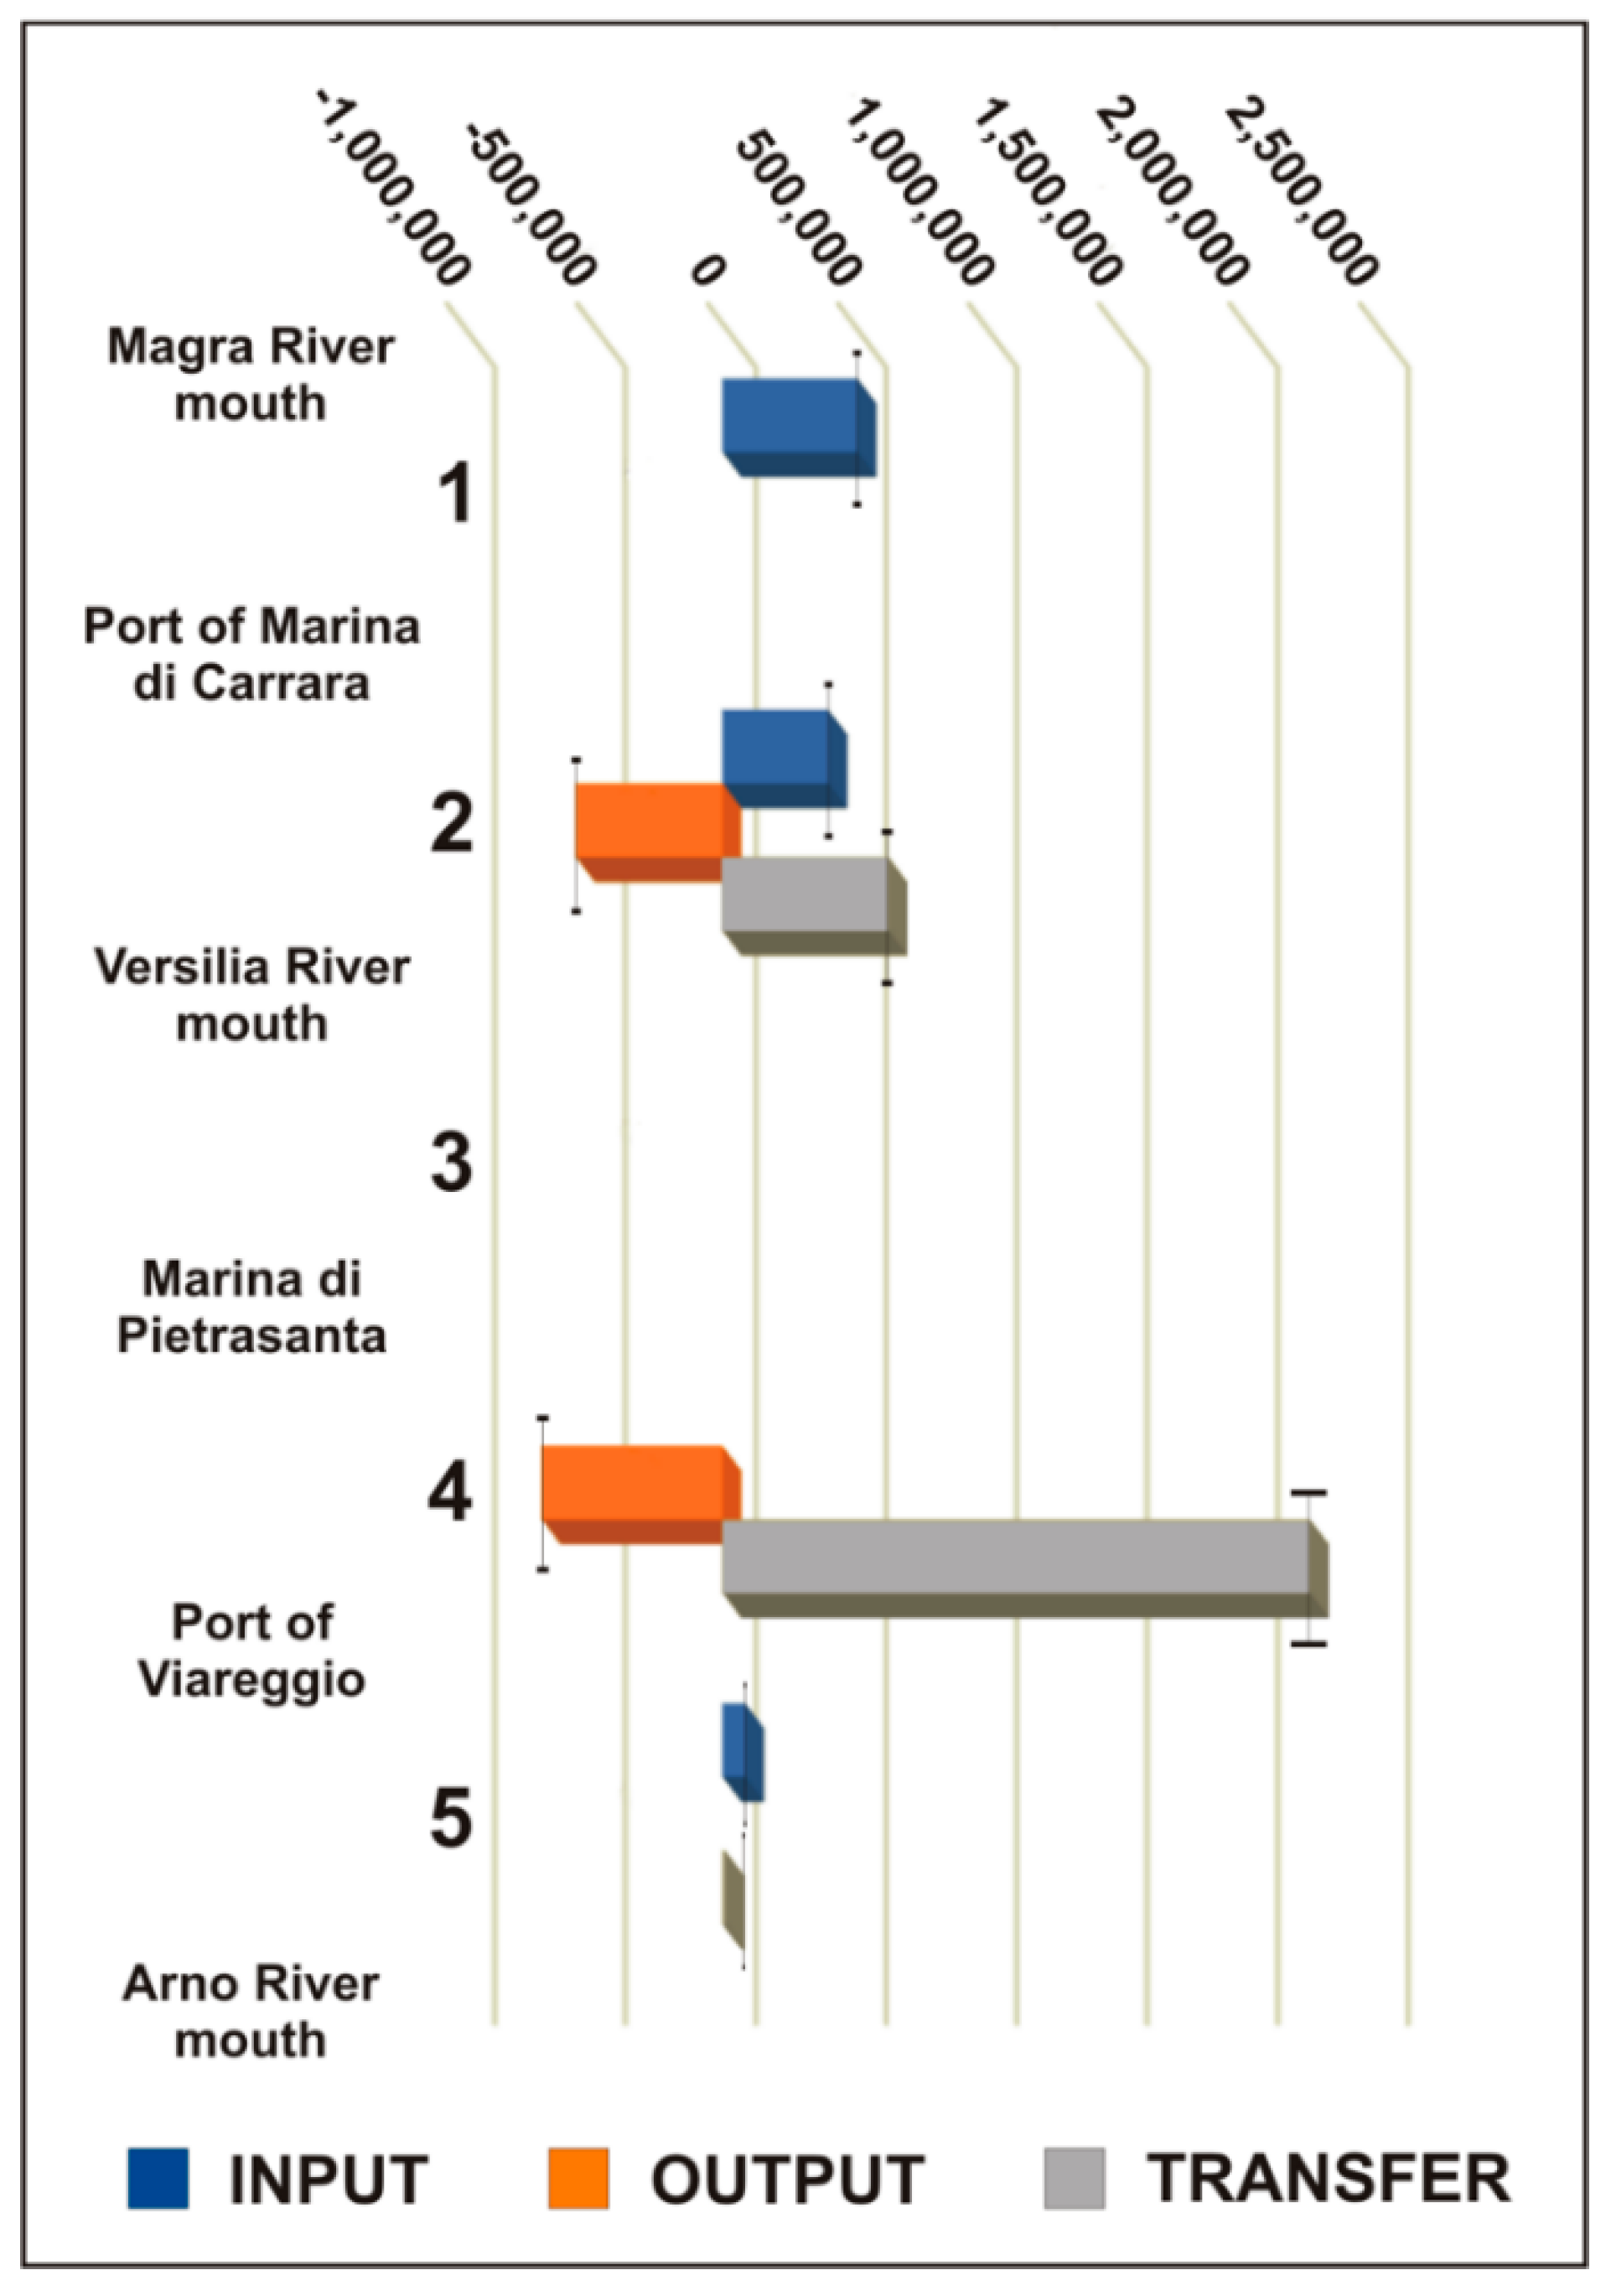
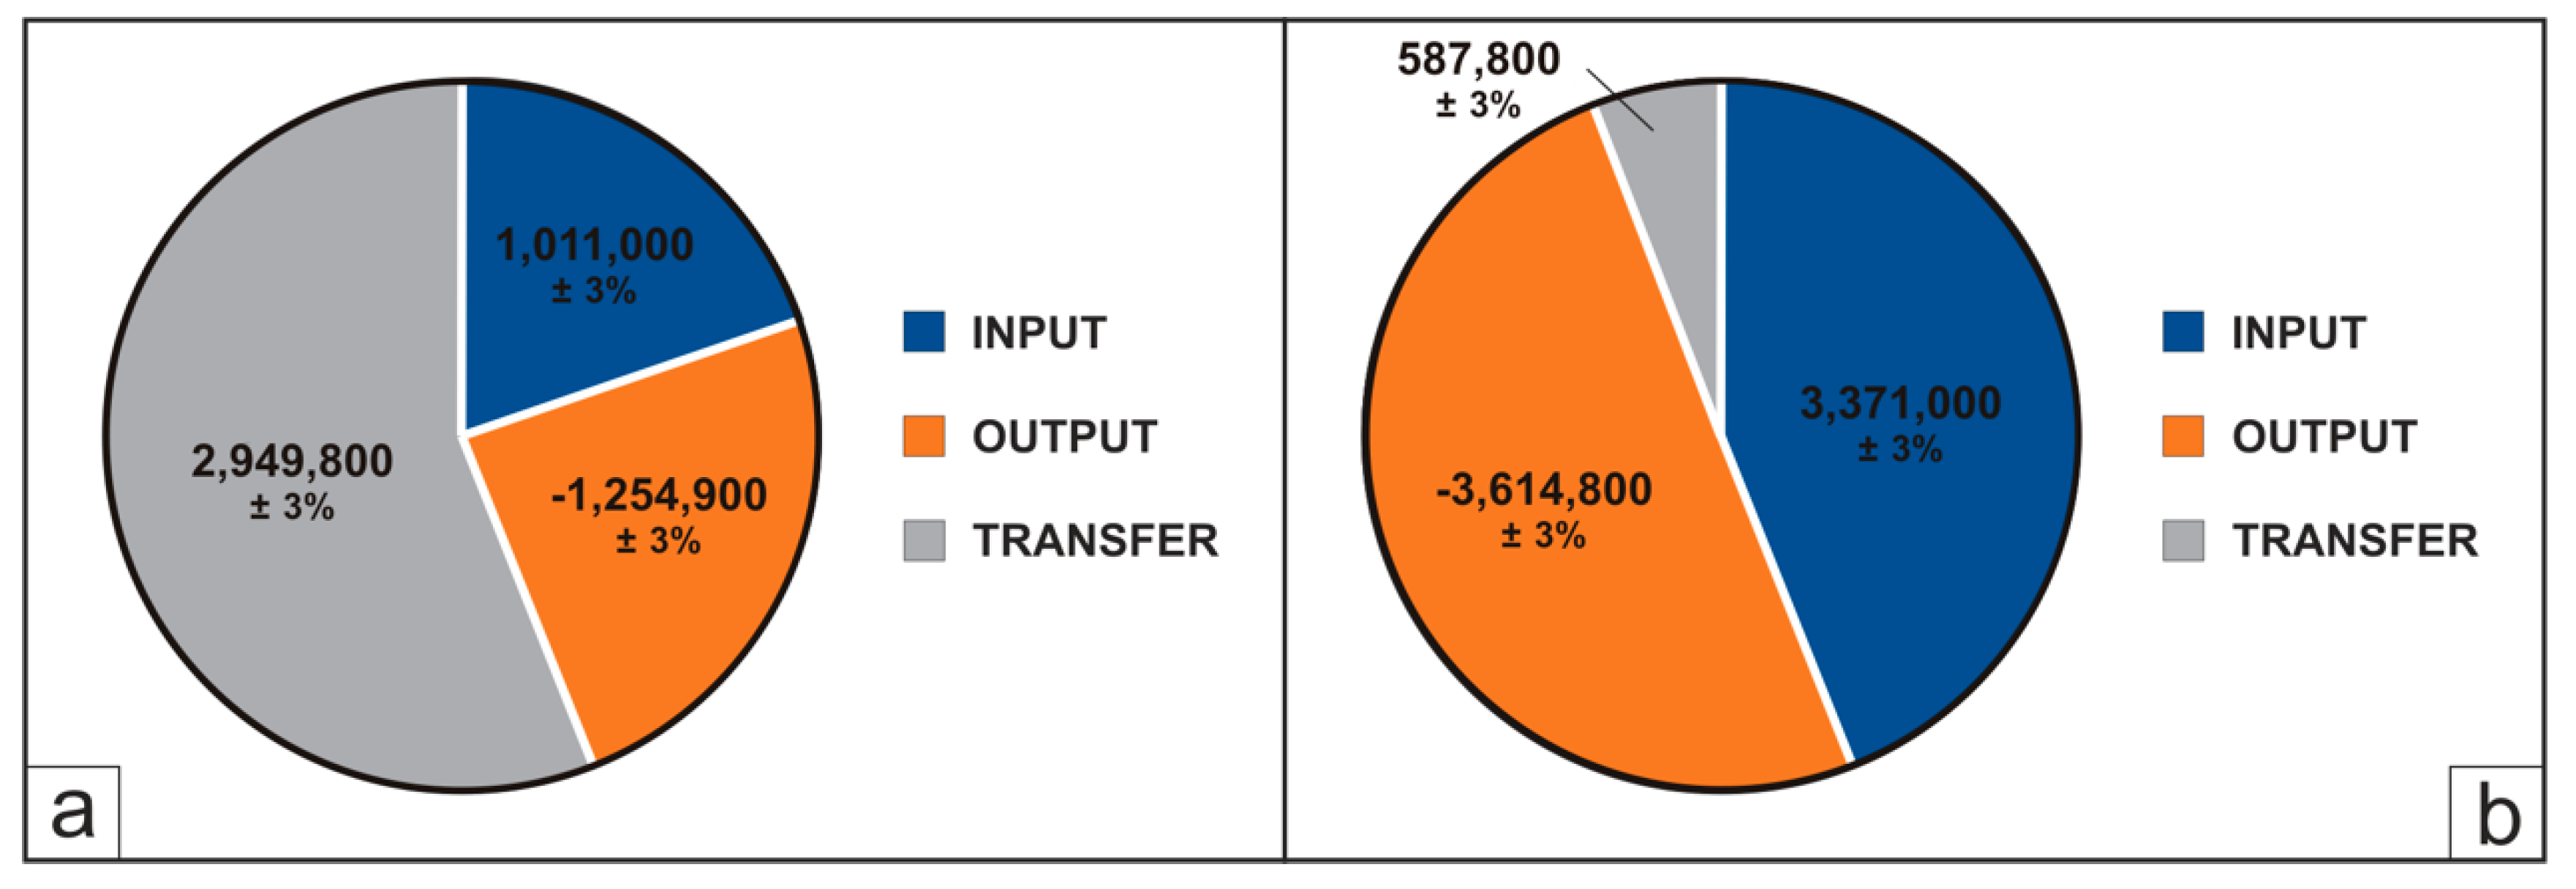
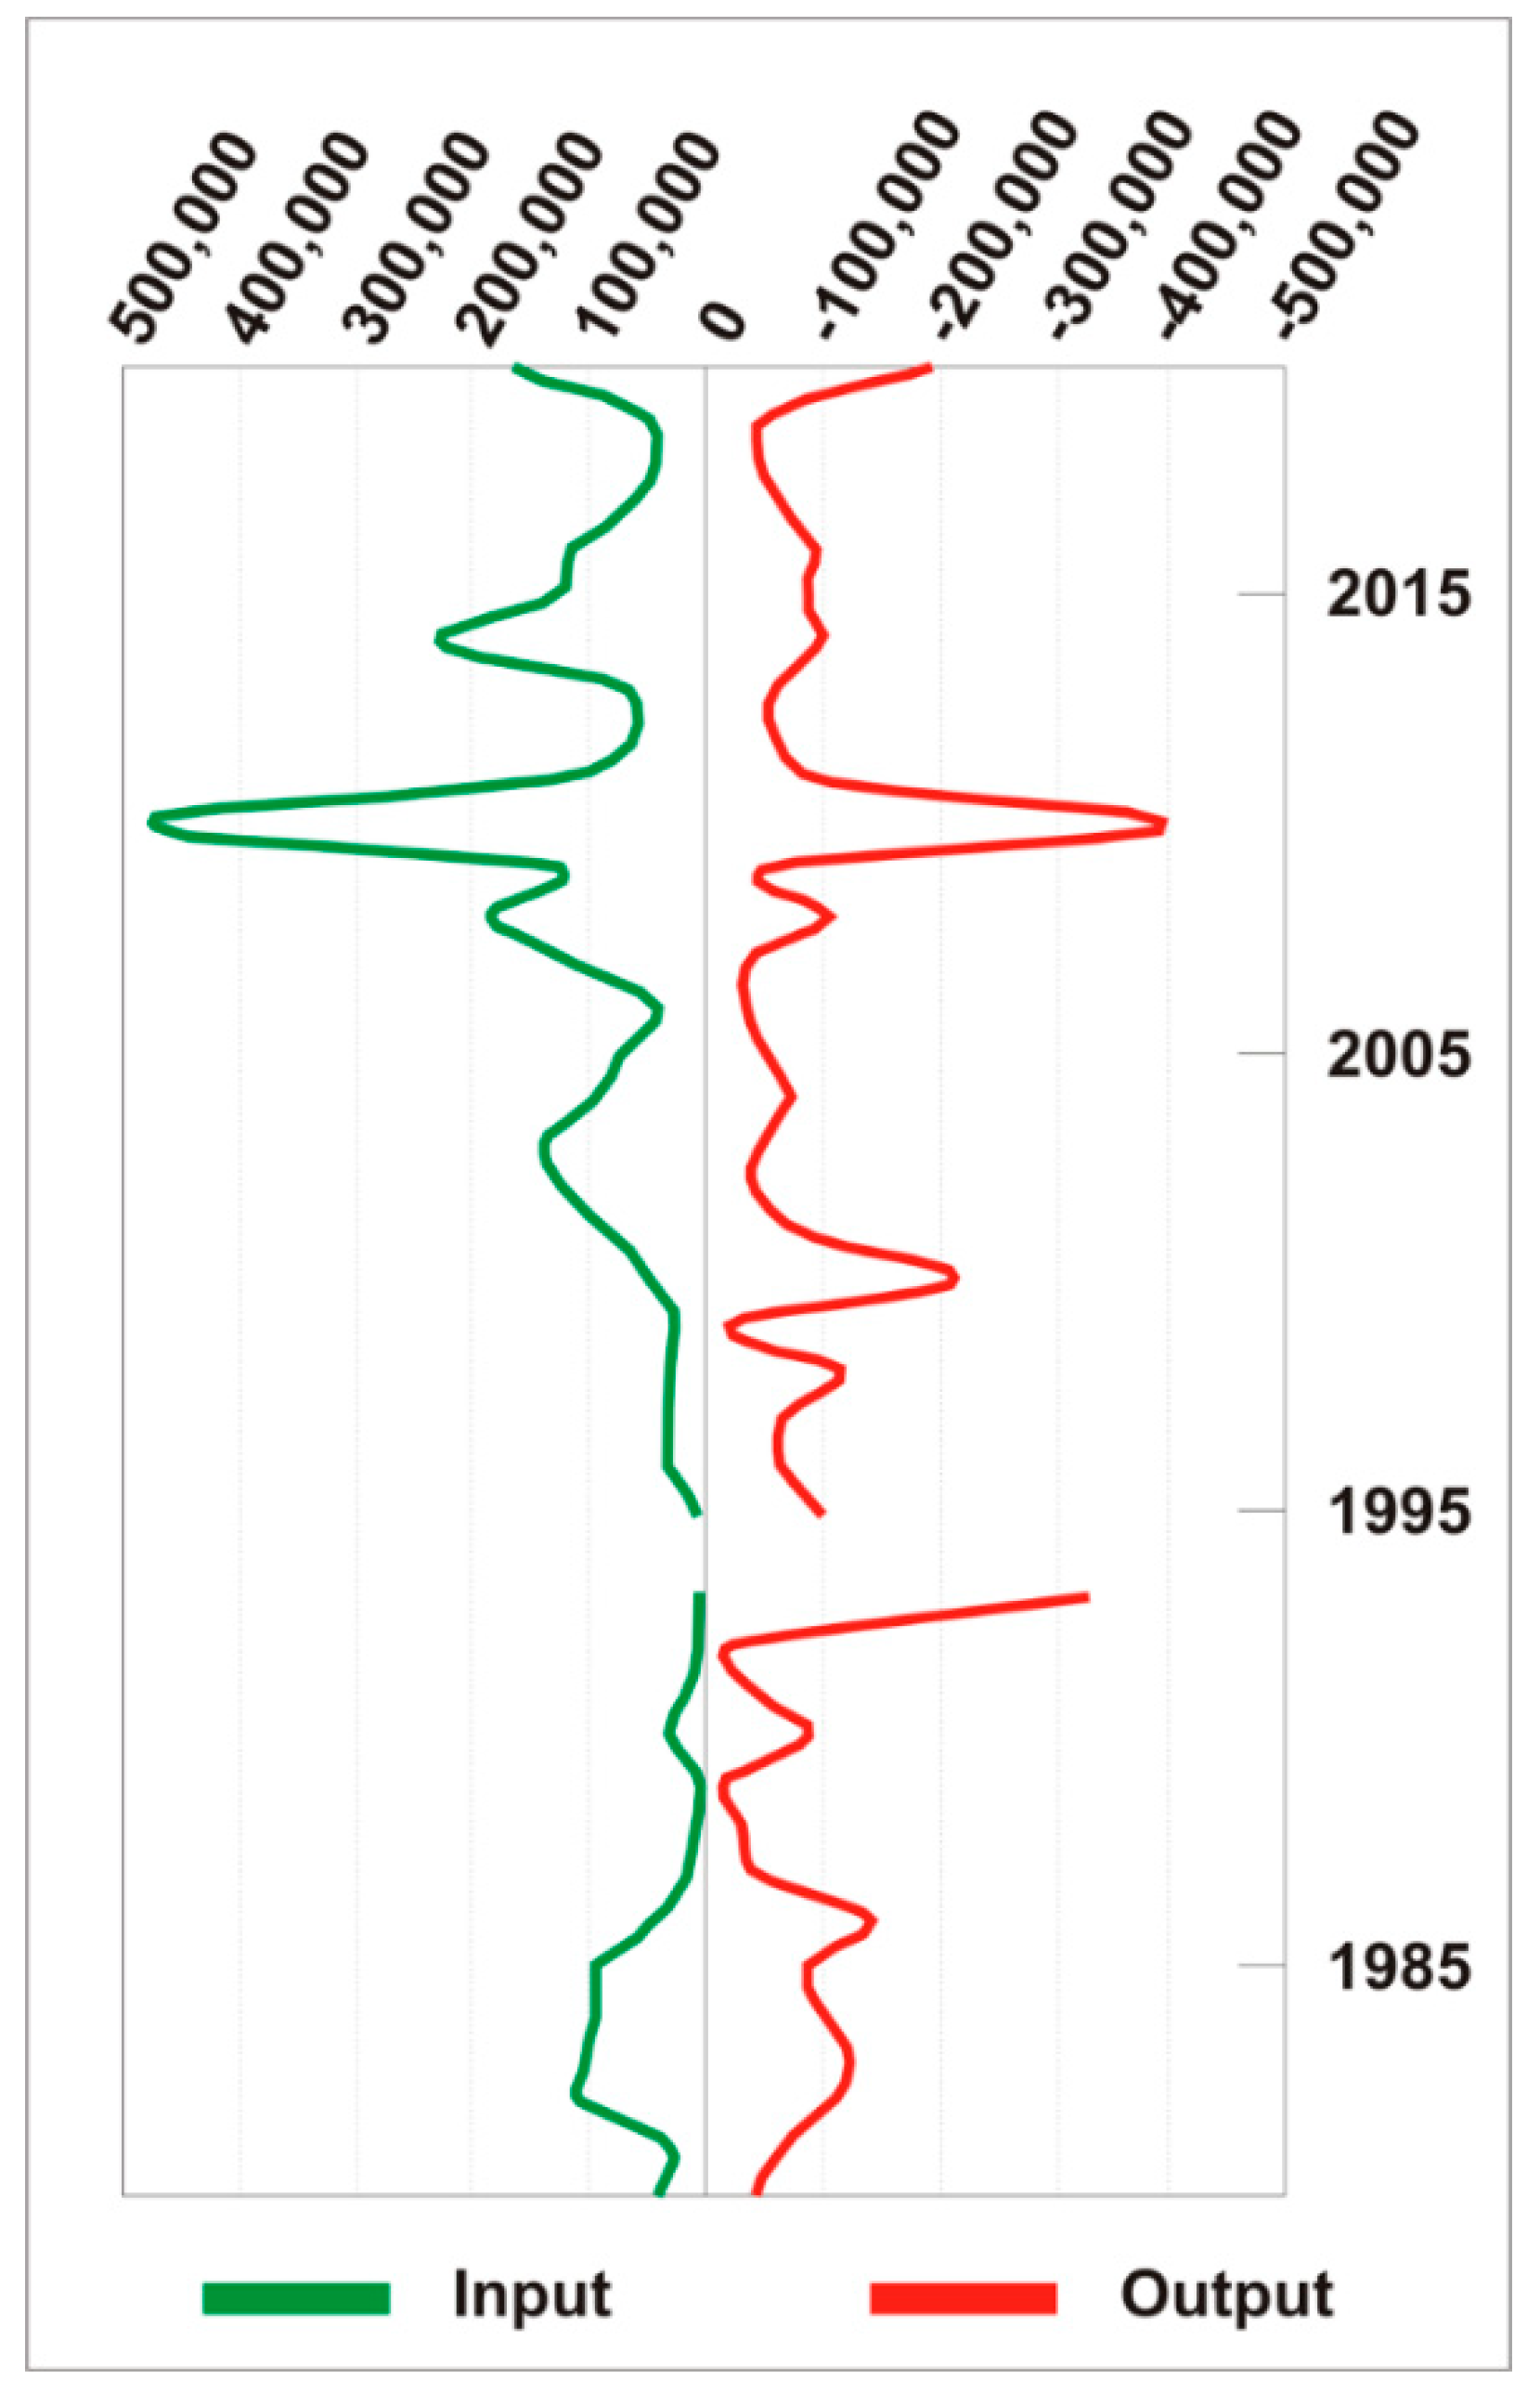
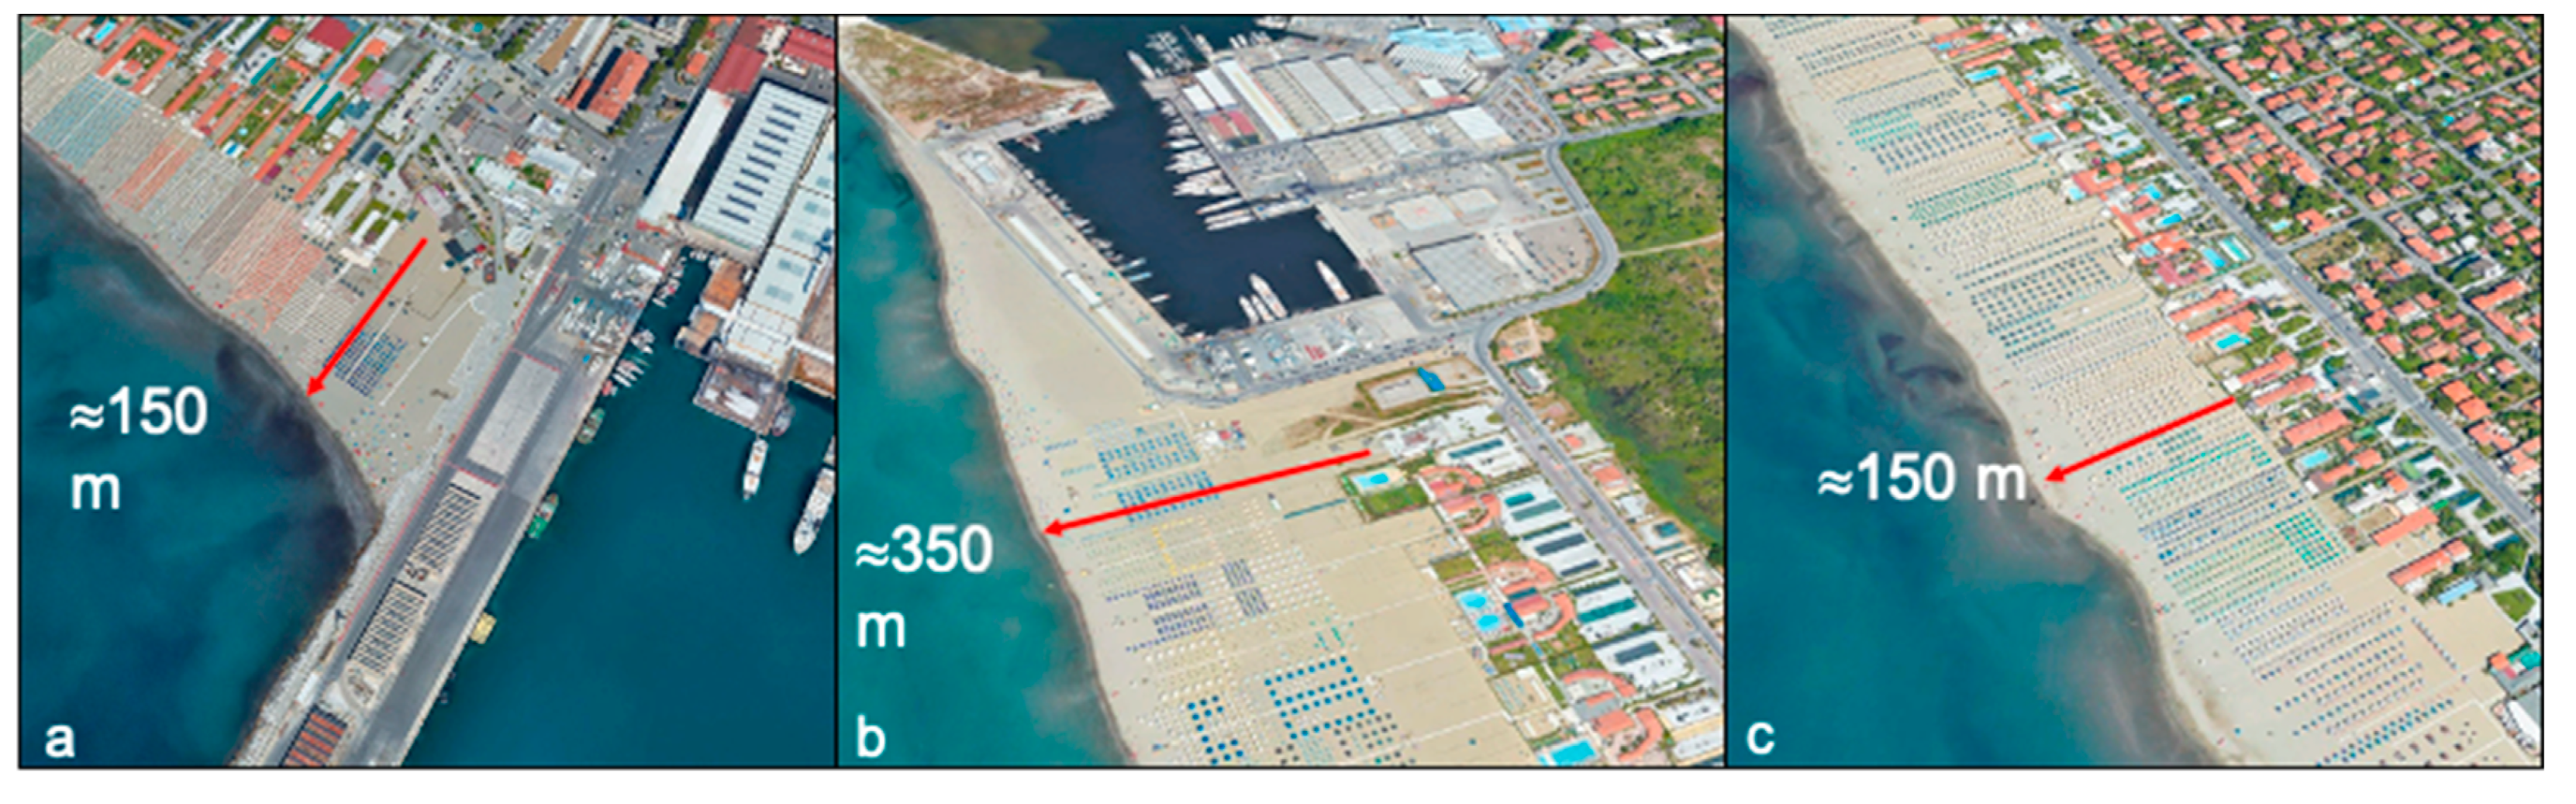
Table 1.
Volume of sediments used as nourishments in the 1980–2020 timespan along the considered sector of coast, sorted by the provenance of material used as beach fill. Refer to Table S1 for a detailed list of each nourishment intervention.
Table 1.
Volume of sediments used as nourishments in the 1980–2020 timespan along the considered sector of coast, sorted by the provenance of material used as beach fill. Refer to Table S1 for a detailed list of each nourishment intervention.
| 1 # | Sediment Input (m3) | Year | Sediment Provenance (Area Code) | Nourishment Area Code |
|---|---|---|---|---|
| 8 | 13,100 ± 3% | 2010–2013 | back-dune accumulations at Marina di Torre del Lago (5) | 5 |
| 98 | 623,100 ± 3% | 1983–2020 | inland quarry (nc) | 1, 2, 5 |
| 3 | 30,600 ± 3% | 2002–2015 | Magra River dredging (1) | 1, 2 |
| 7 | 335,200 ± 3% | 2003–2014 | Magra River mouth dredging (1) | 1 |
| 1 | 9000 ± 3% | 2013 | shoreface dredging at the Port of Marina di Pisa (5) | 5 |
| Total | 1,011,000 ± 3% |
1 #: number of such interventions.
Table 2.
Volume of sediments dredged from the harbor at Marina di Carrara and Viareggio, and not used for nourishment purposes in the 1980–2020 timespan along the considered sector of coast, sorted by destination.
Table 2.
Volume of sediments dredged from the harbor at Marina di Carrara and Viareggio, and not used for nourishment purposes in the 1980–2020 timespan along the considered sector of coast, sorted by destination.
| Sediment Output (Cubic Meters) | Year | Dredging Area | Destination | |
|---|---|---|---|---|
| 1 | −10,000 ± 3% | 2006 | Port of Marina di Carrara | confined disposal facilities |
| 2 | −2000 ± 3% | 2013 | Port of Marina di Carrara | confined disposal facilities |
| 3 | −188,000 ± 3% | 2000 | Port of Marina di Carrara | landfill |
| 4 | −2000 ± 3% | 2001 | Port of Marina di Carrara | landfill |
| 5 | −25,000 ± 3% | 2008 | Port of Marina di Carrara | landfill |
| 6 | −30,000 ± 3% | 2020 | Port of Marina di Carrara | landfill |
| 7 | −31,300 ± 3% | 1981 | Port of Viareggio | undisclosed |
| 8 | −26,400 ± 3% | 1983 | Port of Viareggio | undisclosed |
| 9 | −98,200 ± 3% | 1986 | Port of Viareggio | undisclosed |
| 10 | −27,700 ± 3% | 1987 | Port of Viareggio | undisclosed |
| 11 | −19,300 ± 3% | 1988 | Port of Viareggio | undisclosed |
| 12 | −10,800 ± 3% | 1989 | Port of Viareggio | undisclosed |
| 13 | −55,100 ± 3% | 1990 | Port of Viareggio | undisclosed |
| 14 | −25,900 ± 3% | 1991 | Port of Viareggio | undisclosed |
| 15 | −13,100 ± 3% | 1992 | Port of Viareggio | undisclosed |
| 16 | −11,300 ± 3% | 1993 | Port of Viareggio | undisclosed |
| Total | −576,100 ± 3% |
Table 3.
Volume of sediments dredged from the harbor at Marina di Carrara and Viareggio and dumped offshore beyond the depth of closure in the 1980–2020 timespan along the considered sector of coast, sorted by the year of occurrence.
Table 3.
Volume of sediments dredged from the harbor at Marina di Carrara and Viareggio and dumped offshore beyond the depth of closure in the 1980–2020 timespan along the considered sector of coast, sorted by the year of occurrence.
| Sediment Output (Cubic Meters) | Year | Dredging Area | Destination | |
|---|---|---|---|---|
| 1 | −305,000 ± 3% | 1993 | Port of Marina di Carrara | offshore dumping |
| 2 | −86,900 ± 3% | 1995 | Port of Viareggio | offshore dumping |
| 3 | −31,800 ± 3% | 1996 | Port of Viareggio | offshore dumping |
| 4 | −42,200 ± 3% | 1997 | Port of Viareggio | offshore dumping |
| 5 | −85,100 ± 3% | 1998 | Port of Viareggio | offshore dumping |
| 6 | −19,600 ± 3% | 1999 | Port of Viareggio | offshore dumping |
| 7 | −18,300 ± 3% | 2000 | Port of Viareggio | offshore dumping |
| 8 | −89,900 ± 3% | 2001 | Port of Viareggio | offshore dumping |
| Total | −678,800 ± 3% |
Table 4.
Volume of sediments redistributed as sediment transfer during the 1980–2020 timespan along the considered sector of coast, sorted by the nourishment area code. Refer to Table S2 for a detailed list of each transfer intervention.
Table 4.
Volume of sediments redistributed as sediment transfer during the 1980–2020 timespan along the considered sector of coast, sorted by the nourishment area code. Refer to Table S2 for a detailed list of each transfer intervention.
| 1 # | Sediment Bypass (Cubic Meters) | Year | Dredging Area Code | Nourishment Area Code |
|---|---|---|---|---|
| 37 | 2,252,000 ± 3% | 1980–2020 | 5 | 4 |
| 2 | 108,000 ± 3% | 2000, 2020 | 5 | 2 |
| Total | 2,360,000 ± 3% |
1 #: number of such interventions.
Table 5.
Volume of sediments dredged from the harbor at Marina di Carrara and redistributed as sediment transfer in the 1980–2020 timespan along the considered sector of coast, sorted by year of occurrence. Refer to Table S2 for a detailed list of each transfer intervention.
Table 5.
Volume of sediments dredged from the harbor at Marina di Carrara and redistributed as sediment transfer in the 1980–2020 timespan along the considered sector of coast, sorted by year of occurrence. Refer to Table S2 for a detailed list of each transfer intervention.
| Sediment Dredged from Harbors (Cubic Meters) | Year | Dredging Area Code | Nourishment Area Code | |
|---|---|---|---|---|
| 1 | 86,000 ± 3% | 1995 | 2 | 2 |
| 2 | 100,000 ± 3% | 1997 | 2 | 2 |
| 3 | 66,500 ± 3% | 1999 | 2 | 2 |
| 4 | 35,000 ± 3% | 1999 | 2 | 2 |
| 5 | 12,000 ± 3% | 2000 | 2 | 2 |
| 6 | 10,000 ± 3% | 2002 | 2 | 2 |
| 7 | 10,000 ± 3% | 2004 | 2 | 2 |
| 8 | 10,000 ± 3% | 2010 | 2 | 2 |
| 9 | 56,000 ± 3% | 2013 | 2 | 2 |
| 10 | 123,000 ± 3% | 2020 | 2 | 2 |
| Total | 508,500 ± 3% |
Table 6.
Volume of sediments dredged from nearby shoreface and redistributed as sediment transfer in the 1980–2020 timespan along the considered sector of coast, sorted by year of occurrence. Refer to Table S2 for a detailed list of each transfer intervention.
Table 6.
Volume of sediments dredged from nearby shoreface and redistributed as sediment transfer in the 1980–2020 timespan along the considered sector of coast, sorted by year of occurrence. Refer to Table S2 for a detailed list of each transfer intervention.
| Sediment Dredging from Shoreface and River Mouths (Cubic Meters) | Year | Dredging Area Code | Nourishment Area Code | |
|---|---|---|---|---|
| 1 | 17,500 ± 3% | 1983 | 2 | 2 |
| 2 | 10,200 ± 3% | 2009 | 5 | 5 |
| 3 | 2250 ± 3% | 2016 | 2 | 2 |
| 4 | 1100 ± 3% | 2017 | 2 | 2 |
| 5 | 18,250 ± 3% | 2018 | 2 | 2 |
| 6 | 15,000 ± 3% | 2019 | 2 | 2 |
| 7 | 15,000 ± 3% | 2019 | 2 | 2 |
| Total | 79,300 ± 3% |
Table 7.
Shoreline trends (linear variation and rate of variation) in the 13 sectors of the coast situated between the Magra River mouth and the Arno River mouth. Two time intervals have been taken into account: 1984/1985–2005 and 2005–2019. The uncertainty corresponds to the highest error of the surveys involved in both comparisons, that is ± 5 m for the 1984/85–2005 interval and ± 1 m for the 2005–2019 interval.
| # | Sector | Length (m) | Linear Variation (m) (1984/1985–2005) | Rate of Variation (m/y) (1984/1985–2005) | Linear Variation (m) (2005–2019) | Rate of Variation (m/y) (2005–2019) |
|---|---|---|---|---|---|---|
| 1 | Magra River mouth–Port of Marina di Carrara | 4389 | 1.9 ± 5 | 0.1 | 6.8 ± 1 | 0.5 |
| 2 | Port of Marina di Carrara–Marina di Massa | 2081 | −6.0 ± 5 | −0.3 | −7.4 ± 1 | −0.5 |
| 3 | Marina di Massa–Magliano Ditch mouth | 2511 | 10.2 ± 5 | 0.5 | 1.4 ± 1 | 0.1 |
| 4 | Magliano Ditch mouth–Versilia River mouth | 3125 | −36.2 ± 5 | −1.8 | −11.0 ± 1 | −0.8 |
| 5 | Versilia River mouth–Fiumetto | 5836 | 9.5 ± 5 | 0.5 | 0.9 ± 1 | 0.1 |
| 6 | Fiumetto–Lido di Camaiore | 4187 | 25.2 ± 5 | 1.3 | 15.2 ± 1 | 1.1 |
| 7 | Lido di Camaiore–Port of Viareggio | 5019 | 27.4 ± 5 | 1.4 | 16.8 ± 1 | 1.2 |
| 8 | Port of Viareggio–Marina di Torre del Lago | 4714 | 55.7 ± 5 | 2.8 | 17.5 ± 1 | 1.3 |
| 9 | Marina di Torre del Lago–Serchio River mouth | 4188 | 13.2 ± 5 | 0.7 | 9.0 ± 1 | 0.6 |
| 10 | Serchio River mouth–Morto Nuovo River mouth | 5243 | −67.2 ± 5 | −3.4 | −39.8 ± 1 | −2.8 |
| 11 | Morto Nuovo River mouth–Arno River mouth | 6014 | −65.2 ± 5 | −3.3 | −19.4 ± 1 | −1.4 |
| Average: | 4301 | −2.9 | −0.1 | −0.9 | −0.1 |
Table 8.
Subdivision of the main littoral cell and extent of sediment input, output and transfer. See Figure 1b for the location of sub-cell limits.
Table 8.
Subdivision of the main littoral cell and extent of sediment input, output and transfer. See Figure 1b for the location of sub-cell limits.
| Sub-Cell | Location | Length (m) | Input (m3) | Output (m3) | Transfer (m3) | Net Balance (m3) |
|---|---|---|---|---|---|---|
| 1 | Magra River mouth–Port of Marina di Carrara | 4300 | 517,900 ± 3% | 0 | 0 | 517,900 ± 3% |
| 2 | Port of Marina di Carrara–Versilia River mouth | 10,200 | 406,000 ± 3% | −562,000 ± 3% | 685,600 ± 3% | −156,000 ± 3% |
| 3 | Versilia River mouth–Marina di Pietrasanta | 7400 | 0 | 0 | 0 | 0 |
| 4 | Marina di Pietrasanta–Port of Viareggio | 7300 | 0 | −692,900 ± 3% | 2,254,000 ± 3% | −692,900 ± 3% |
| 5 | Port of Viareggio–Arno River mouth | 20,400 | 87,100 ± 3% | 0 | 10,200 ± 3% | 87,100 ± 3% |
| Total | 49,600 | 1,011,000 ± 3% | −1,254,900 ± 3% | 2,949,800 ± 3% | −243,900 ± 3% |
Table 9.
Table summarizing sediment budget calculations from different areas.
| Location | Length (km) | TimeInterval (y) | Coastal Area/Sector (n) | Sediment Volume (m3) | Rate of Sediment Management (m3/y) |
|---|---|---|---|---|---|
| Belgium | ~67 | 2000–2009 | 7 | 0–2,124,000 | 0–236,000 |
| USA | ~1185 | 1955–2017 | 5 | 458,000,000 | 7,387,097 |
| Portugal | - | 1909–2011 | Several locations | 30,769,538 | 301,662 |
| Porto Santo | ~7.3 | 1935–2015 | Small Island | 11,150 | 141 |
| New Jersey (USA) | ~33.8 | 1992–2003 | 7 | 1,748,000 | 158,909 |
| California (USA) | ~40 | 1910–2011 | 1 | 12,163,000 | 135,144 |
| Northern Tuscany (Italy) * | ~49.6 | 1980–2020 | 1(5 Sectors) | 5,215,700 | 130,400 |
* Values of the present study.
Publisher’s Note: MDPI stays neutral with regard to jurisdictional claims in published maps and institutional affiliations. |
© 2020 by the authors. Licensee MDPI, Basel, Switzerland. This article is an open access article distributed under the terms and conditions of the Creative Commons Attribution (CC BY) license (http://creativecommons.org/licenses/by/4.0/).
Share and Cite
MDPI and ACS Style
Cappucci, S.; Bertoni, D.; Cipriani, L.E.; Boninsegni, G.; Sarti, G. Assessment of the Anthropogenic Sediment Budget of a Littoral Cell System (Northern Tuscany, Italy). Water 2020, 12, 3240. https://doi.org/10.3390/w12113240
AMA Style
Cappucci S, Bertoni D, Cipriani LE, Boninsegni G, Sarti G. Assessment of the Anthropogenic Sediment Budget of a Littoral Cell System (Northern Tuscany, Italy). Water. 2020; 12(11):3240. https://doi.org/10.3390/w12113240
Chicago/Turabian StyleCappucci, Sergio, Duccio Bertoni, Luigi Enrico Cipriani, Gianfranco Boninsegni, and Giovanni Sarti. 2020. "Assessment of the Anthropogenic Sediment Budget of a Littoral Cell System (Northern Tuscany, Italy)" Water 12, no. 11: 3240. https://doi.org/10.3390/w12113240
Note that from the first issue of 2016, this journal uses article numbers instead of page numbers. See further details here.