
Abstract
A thermionic plasma source apparatus has been developed and characterised for high-density gaseous plasma antenna (GPA) applications. The system produces a cylindrical plasma column which is 100 mm long with a diameter of 8 mm and operates with a total plasma power consumption of 70 to 200 W, depending mainly on the DC discharge current. The plasma column electron density and temperature is measured via microwave interferometry and optical emission spectroscopy. The plasma properties are investigated for Ar, Kr and Xe at pressures from 1 to 4 mbar. The system has demonstrated higher electron densities (>1019 m−3) at low pressures (<2 mbar) than has been experimentally achieved before for GPA applications. This could allow for high gain GPA operation comparable to that of conventional metallic antennas. Additionally, the source has demonstrated operation over a wide range of electron densities, from 2 × 10¹⁸ to 1 × 10¹⁹ m−3, which can allow for frequency hopping. The plasma columns electron temperature remains around 1.5 eV for argon, largely uninfluenced by the pressure or discharge current. These plasma column measurements obtained are used to analyse the plasma properties influence on GPA performance. This analysis indicates that at high density operation, a gain is achieved which is only 22% lower than that of the conventional metallic antenna. Furthermore, the density ranges demonstrated could enable wide-range frequency hopping of over 100 MHz, with a gain greater than 1.3 dBi.
Export citation and abstract BibTeX RIS

Original content from this work may be used under the terms of the Creative Commons Attribution 4.0 licence. Any further distribution of this work must maintain attribution to the author(s) and the title of the work, journal citation and DOI.
1. Introduction
A gaseous plasma antenna (GPA) is usually defined as a device using a partially or fully ionized gas to transmit or receive electromagnetic (EM) waves [1]. In a GPA, a neutral gas confined in a dielectric enclosure is ionised by means of any excitation method. The signal is then injected into the plasma using a dedicated circuit, usually referred to as the signal coupler. GPAs offer several advantages over traditional metal antennas [2, 3]. First of all, their radiation properties, such as gain and frequency of operation [4], can be controlled via electrically varying the plasma parameters, as opposed to by conventional mechanical movement. Thus this can enable antenna property changes in the 10−3 to 10−6 second timescale range [2]. Therefore, a GPA enables frequency hopping [5] along with antenna gain and directivity tuning according to the application requirements [4]. Secondly, when the excitation energy is turned off, the plasma reverts to a neutral gas which is transparent to EM waves and thus the radar cross section [4] of the antenna is significantly reduced. This property makes GPAs particularly appealing for applications in which stealth is required [6]. Moreover, the opportunity to reduce the radar cross section of inactive antennas can be of great interest in applications such as multiple input multiple output systems, where the mutual coupling between active and inactive elements can promote signal losses. Moreover, GPAs are transparent to incoming waves with frequency higher than the plasma frequency [7], making this technology suitable for applications wherein many antennas operating at different frequencies are stacked in close proximity because of space constraints [1]. Due to these features and advantages, GPAs can be easily grouped into arrays to achieve beam forming and beam steering [4, 8] while lowering the mutual coupling between the different antenna elements.
Even though GPAs are a valuable alternative to conventional antennas, their utilization in communication systems has been hindered by the availability of suitable technological solutions to generate the plasma. Various plasma source systems have been tested for plasma generation of GPAs. Among them, Borg [2] relied on a discharge driven by surface waves to obtain a monopole antenna working in the radio frequency range, and Manheimer [9] proposed a laser plasma for radar applications. Anderson [10] used a GPA operating between 0.5–20 GHz by means of two electrodes placed at opposite ends of a cylindrical vessel which was fed by either continuous or pulsed direct current (DC). However, most of the GPA research until now has relied on commercially available cold cathode fluorescent lamps (CCFL) for GPA prototyping [11, 12]. In fact, CCFLs are a cost-effective solution that do not require complex ground support systems for operation. Unfortunately, the adoption of commercial CCFLs is limited in terms of discharge shape, plasma characteristics and system envelope dimensions by those available on the market, narrowing the development and potential applications of GPAs.
From a numerical standpoint, several analyses have been conducted exploiting full-wave EM solvers to investigate the radiation properties of a GPA [13, 14]. Though often numerical GPA works utilise aspirational plasma densities and pressure that have not yet been experimentally realised in applicable GPA configurations. For instance [15, 16] have plasma density inputs of around 1018–1019 m−3 with associated pressures of only 0.01 to 0.2 mbar for their models. Nevertheless, these efforts have aided in identifying some relations between plasma parameters and antenna performances [17]. It has been proved that the plasma density strongly affects the radiation properties of a plasma antenna. In particular, whether plasma discharges are used as active antenna elements (e.g., plasma dipole [17] or monopole [18]), the first resonance frequency [4] of such devices can be increased by up to 50% when varying the plasma density from 1 × 10¹⁸ to 1 × 10¹⁹ m−3 [17]. With such an increase in plasma density, the antenna gain can also increase by an order of magnitude [19]. Higher values of the neutral background pressure result in a reduction of the antenna performances due to collisionality reducing the achievable antenna gain [17]. For instance, gain decreases by 10 dBi if the neutral background pressure rises from 1 mbar up to 10 mbar. Due to these GPA performance trends, it is beneficial in general to operate at higher electron densities with low pressures.
A major issue related to the analysis of GPAs is to obtain reliable measurements of the plasma parameters [20]. Such measurements are crucial for GPA model validation to enable accurate prediction of GPA performance for design optimisation. Several approaches have been pursued to evaluate the discharge properties. The plasma parameters have been previously estimated by means of theoretical [21] or numerical [22] models. However these approaches give predictions which might be affected by an uncertainty of up to 60%–70% [23, 24]. In other cases, in which commercial plasma sources have been adopted, groups have assumed the plasma density from the literature [25] although this offers reduced flexibility for modifying the experimental setup. A few papers have illustrated direct measurements of the plasma parameters by means of Langmuir probes [26–28], such instruments have an accuracy of up to 30% [29]. Finally, it is worth mentioning that some GPA papers report values of the plasma density without a clearly displayed methodology that derived them [30, 31]. Table 1 summarises the outcomes of the approaches described.
Table 1. Summary of GPA configurations and characteristics.
| n e [m−3] | p 0 [mbar] | Approach to estimate plasma parameters | Source type | Reference |
|---|---|---|---|---|
| <1.0 × 10¹⁸ | 0.4 | Analytical model | Surface waves | [21] |
| <2.0 × 10¹⁸ | 5 | Numerical model | CCFL | [22] |
| <1.0 × 10¹⁸ | 4 | Literature review | CCFL | [25] |
| <1.0 × 10¹⁷ | 0.1 | Langmuir probe | Surface waves | [26, 27] |
| <1.0 × 10¹⁷ | 5 | Langmuir probe | CCFL | [28] |
| 6.0 × 10¹⁷ | 0.4 | — | CCFL | [30] |
| 8.0 × 10¹⁷ | 5 | — | DC-fed electrodes | [31] |
As shown in table 1 the plasma density achievable with actual GPA technologies is <2 × 10¹⁸ m−3 with the neutral pressure in the order of a few mbar. Melazzi's analysis [17] has shown that GPAs with such characteristics result in a first resonance frequency [4] of only a few hundred MHz, and an antenna gain [4] one order of magnitude lower than the metallic counterpart. Therefore, overcoming the density limit of these current GPAs will open new frontiers in the plasma antenna field, by enlarging the frequency spectrum in which such devices operate while reaching higher antenna gains. Furthermore, characterisation of the plasma properties of such a system is required to attain real inputs to enable higher fidelity numerical analysis for applicable GPAs systems.
In this work, a novel thermionic plasma source apparatus for plasma antenna applications is built and characterised. The system utilises a thermionic hollow cathode (HC) to obtain high plasma densities (>1 × 10¹⁹ m−3), while maintaining a neutral background pressure less than or equal to 4 mbar, namely in the same range of the cases reported in table 1. This apparatus has been characterised, including axial plasma density and electron temperature measurements by means of interferometric and spectrographic techniques. The plasma characterization results, as well as validating this sources approach for high density GPA applicable systems, are employed to enable estimation of the plasma properties influence on antenna performance in terms of radiation pattern, antenna gain, and resonance frequency. Furthermore, the numerical analysis assesses the apparatus effects on GPA performance, such as the presence of the cathode, anode, and non-uniform axial and radial distribution of density along the plasma column.
2. Hollow cathode apparatus
2.1. Thermionic cathode and anode
A HC electron source provided by Mars Space Ltd, is a modified version of a lanthanum hexaboride (LaB6) source which has been used with gridded ion engines for spacecraft propulsion [32].
The electron source (see figure 1) consists of a hollow cylindrical emitter, which is made of lanthanum hexaboride that has a low work function of 2.66 eV [33]. The hollow cylindrical shape gives rise to the HC effect to increase performance, primarily from the electron pendulum mechanism, in which electron oscillation yields enhanced ionization [34]. Typically LaB6 cathodes of this type attain emitter region plasma densities in the order of 1 × 10¹⁸ to 1 × 10²¹ m−3 [35].

Figure 1. Hollow cathode electron source.
Download figure:
Standard image High-resolution imageThe use of a LaB6 emitter allows for easy handling and decreased risk of emitter poisoning, as an example LaB6 can withstand an oxygen partial pressure of up to 10−4 mbar at 1570 °C, whereas materials such as tungsten impregnated with barium oxide can only withstand oxygen partial pressures up to 10−6 mbar at 1100 °C, which is the corresponding temperature to attain the same emission current [36]. The emitter is supported by a thin carbon sleeve to ensure good electrical and thermal connection, while limiting physical contact with the refractory metal cathode tube that can result in boron diffusion [33]. The sleeved emitter is inserted in a refractory metal cathode tube that mechanically supports the emitter and provides the electrical connections. A heater is placed around the cathode tube to raise the emitter to thermionic temperatures, around 1600 °C. Radiation shielding is wrapped around the heater in order to reduce thermal losses and thus the power required during operation.
An auxiliary electrode, referred to as a keeper electrode is placed over the cathode tube, yet electrically isolated. The keeper electrode has two main functions. Firstly, to aid lower voltage ignition, around 50 V. After the ignition the discharge can be seamlessly transferred to the anode. Secondly, post ignition the keeper discharge can help stabilise and maintain the anode discharge. Finally, the keeper protects the cathode tube from ion bombardment incurred due to the plasma discharge, prolonging the systems life. The keeper is made of a fine grain POCO graphite which has a low sputter yield, thus minimising the sputtering erosion.
The HC system is mounted on a Kovar disk which allows mechanical support and fixed electrical connections.
The HC electron source is 50 mm in diameter and 110 mm long, which allows easy integration into discharge plasma tubes.
The anode is constructed of POCO EDM-3 graphite due to the mentioned sputter yield benefits and is shaped as a cylindrical cup, which gives a larger surface area for the discharge attachment. The anode length is 20 mm and the outer diameter is 8 mm, with a wall thickness of 1 mm. Emitter, keeper, and anode surface conditions can have a significant impact on the discharge attachment and stability. Due to this, the anode and cathode system are cleaned in an ultra-sonic bath, first with ethanol, then with isopropanol for 30 min each round, to ensure adequate removal of impurities.
2.2. Vessel configuration and electrical scheme
The plasma tube apparatus can be seen in figure 2, and consists of a flanged Pyrex vessel. The vessel has a flange to flange length of 420 mm, on the cathode side the outer diameter is 62 mm and on the anode side the outer diameter is 19 mm. The main column tube between the cathode and anode is 100 mm long, with an 8 mm inner diameter, and 2 mm wall thickness. The system is constructed from Pyrex to allow clear sight of discharge operation, and optical access for the spectrographic diagnostics.

Figure 2. Thermionic plasma source apparatus.
Download figure:
Standard image High-resolution imageThe vessel has a CF16 feedthrough on the anode side for electrical connections and a CF63 feedthrough on the cathode side for the cathode mounting, and multiple connections for the pressure gauge, gas line, turbomolecular pump and electrical wiring. The total length of the vessel is 415 mm from flange to flange. A 33 l/s turbomolecular pump is connected to the system through an isolation valve, that allows evacuation of the system to 1 × 10⁻⁶ mbar, prior to backfilling with the required gas. A gas independent 0–25 mbar biometric dial gauge was used to calibrate a Pfeiffer full range gauge, connected to a Pfeiffer TPG—261 controller, for each gas type used, this allowed for logged gas pressure measurements with an accuracy of ±0.25 mbar from 0.5–25 mbar.
The electrical schematic can be seen in figure 3, a 200 V-10 A, EA-PSI 5200-10 supplies the power to the keeper and a 200 V-4 A, EA-PSI 5200-04 supplies power to the anode. Both are connected and controlled remotely via Ethernet connections. A 60 V-3 A TENMA 72-2720 supplies the heater power and is connected and controlled via serial cable. Finally, a 1 kV-30 mA BERTAN 205B-01R provides an ignition voltage to the anode and is controlled manually. To protect the anode supply from the high ignition voltage a diode is used, and additionally a ballast resistor is placed in the anode line to aid discharge stability.

Figure 3. Electrical schematic.
Download figure:
Standard image High-resolution imageTo monitor the Pyrex temperature, three type K thermocouples are connected to a PICO USB TC-08 thermocouple data logger. An external fan is used if the Pyrex absolute temperature or the gradient exceeds safe operating limits, namely >10 °C min−1 and >500 °C respectively. All connected systems are monitored and logged at 1 Hz rate through a dedicated LabVIEW control interface. Additionally, all control systems have isolated optocoupler connections to the PC to insure operational stability of the control system.
2.3. Interferometer diagnostic instrumentation
To obtain non-intrusive plasma density measurements of the plasma column, a 75 GHz microwave interferometer co-developed by the University of Padova was utilized. This microwave interferometer is described in detail in a recent paper [37], hence only a brief overview is given here. Microwave interferometry is based on the phase shift between a microwave beam transmitted through the plasma and a reference microwave beam generated by the same source and propagating along a waveguide. The instrument is capable of plasma density measurements regardless of the gas type, as the electron density value is related to the phase shift produced on a microwave signal travelling through the plasma. The interferometry measurement horn end faces have a length of 15 mm, and height of 10 mm.
This diagnostic instrumentation is designed and calibrated for measuring cylindrical plasma sources [37]. The effect of refraction in measuring cylindrical plasma sources smaller than the measurement beam was investigated by means of ray tracing. It was found that the linear phase-density relationship given by the slab approximation is still valid for plasma diameters as small as 8 mm [37].
The maximum plasma diameter that can be handled by the interferometer is roughly D = 40 mm being the distance between its horns 45 mm. Therefore, the plasma tube examined in this work, with a minimum diameter of 8 mm, satisfy the requirements imposed to use the interferometer in its linear range.
In figure 4, a characteristic phase jump plot acquired by the interferometer is shown, the phase jump is attained when the discharge is switched off, as seen occurring after 4 s. The magnitude of the difference in phase jump before and after the discharge is correlated with the plasma density as detailed in [37].

Figure 4. Characteristic phase jump plot for the plasma column at 2 mbar (Ar), IK = 4 A, IA = 2.5 A, resulting in a phase jump of −74.65 ± 2.00 degree, equating to a plasma density 1.35 × 10¹⁹ ± 6.91 × 10¹⁷ m−3 for a 2σ confidence interval.
Download figure:
Standard image High-resolution imageThe pre and post jump phase noise adds an uncertainty to the measured phase jump, thus the standard deviation of the pre-jump phase noise is calculated to produce a 2σ confidence interval for each plasma density measurement acquired. The measurement system and plasma source are shown in figure 5.

Figure 5. Plasma source apparatus mounted on the microwave interferometer.
Download figure:
Standard image High-resolution image2.4. Spectrographic instrumentation
The electron temperature Te of the discharge is determined by an optical emission spectroscopy technique. The spectrometer is an Acton Princeton SP2750i with 750 mm focal length and featuring three different diffraction gratings; low resolution 500 gr mm−1, medium resolution 1800 gr mm−1 and a high resolution grating 2400 gr mm−1. The spectrometer was wavelength and intensity calibrated with an Hg–Ar and a D2-W calibration source, both from ocean optics.
The electron temperature is determined by a line ratio method in the frame of the extended corona model, and it is described in a published work of Boffard [38]; the method is well suited for this range of plasma densities where the plasma is far from either local thermodynamic equilibrium or corona equilibrium.
The method calculates the ratio of two lines from the blue system of neutral argon emission, namely the 3p9 → 1s5 transition at 420.06 nm and the 3p5 → 1s4 transition at 419.83 nm (Paschen notation). In the extended corona model, the population of the 3p excited manifold, is due to electron impact excitation from the ground state, the metastable and the resonant levels in the 1s manifold.
In the steady state plasma, the collisional population is balanced by radiative decay out of the 3p states, so that the emission lines are related to the kinetic population processes by the following line ratio relation [38]:

Where nm/n0 is the metastable state 1s5 fraction, K0 and Km the respective optical emission rate. It is worth to mention that the sensitivity of the method to the metastable fraction is not severe, Boffard [38] reports that an uncertainty of 50% on nm/n0 results in an uncertainty on Te of at most 10%. The metastable fraction can be determined in different ways, for example collisional radiative modelling or white light absorption spectroscopy; in this work we adopt the commonly implemented method of line ratios from the red emission system of neutral argon (transitions from the 2p manifold to the 1s manifold). Several papers are available in literature on this subject, here in the following we refer to the work of Schulze [39] and Mariotti [40]. In Schulze [39] the emission ratios are calculated for transitions that originate from the same upper level and radiate to different metastable (or resonant) levels. The resulting emission ratio is function of the lower level concentrations as represented by the following relation:
where Λ is the escape factor function and it represents the probability for a photon to leave the plasma volume without being reabsorbed, in order to calculate the escape factor we adopt, as in [39], the popular expression presented by Mewe [41, 42]; for the case of isotropic homogenous emitting source:

where R is the radius of the source and kij is the absorption coefficient defined, for a Doppler broadened line, as:

where the λij is the wavelength of the transition i → j, gi and gj are the statistical weights of the upper and lower levels, nj is the number density of the lower level-j (in the manuscript the metastable and resonant levels nm and nr), Aij is the Einstein coefficient of the spontaneous emission, Tg is the gas temperature, M is the atomic mass and Rg is the gas constant.
There is some literature evidence that suggest the use of escape factor, and therefore the approximation of homogenous source, does not introduce significant deviation from a more rigorous calculation. Such a calculation, if it had to be carried out, it would require combined plasma and photon models accompanied by spatially resolved data gained by means of an Abel inversion.
Schulze [39] critically discusses the assumption of homogenous radiation source in his method for determining metastable density by means of line ratio; the author, who adopt Mewe's escape factor, point out that, despite assuming uniform density profiles, the method produces results that are in agreement within a few per cent to experimental determinations [43].
Boffard [44] derived a method similar to Schulze [39] and adopting global Mewe's escape factor; he then compares results with experimental measurements of metastable densities by white light absorption spectroscopy technique. He obtains agreement of the two different methods for both argon and neon plasmas.
We selected the 2p3 → 1s5 transition at 706.72 nm with nm being the 1s5 metastable state concentration, and the 2p3 → 1s4 transition at 738.40 nm with nr being the 1s4 resonant state concentration.
Mariotti [40] developed an extended corona model based on the emissions of the red system in order to determine the concentrations of the metastable and resonant levels; here we are interested only in the 1s5 and 1s4, therefore we selected transitions from levels that are mainly populated by electron impact excitation from the ground state, the 1s5 and 1s4 states, while the contribution from the 1s3 and 1s2 is small. The following relation is the line emission ratio for the 2p6 → 1s4 transition at 800.62 nm and the 2p8 → 1s5 transition at 801.48 nm, in the corona extended model paradigm:
Equations (1), (2) and (5) are non-linear in the unknown Te, nm/n0 and nr/n0 are solved numerically in order to determine the electron temperature. Optical emission cross sections necessary to calculate the population rates K(0, m, r), in equations (1) and (5) are taken or calculated from references [38, 45–47]. Figure 6 shows an example of the acquired spectra within the ranges of interest.

Figure 6. Emission spectra of the plasma discharge obtained at 2 mbar pressure and 2 A anode current, displaying the interested wavelength regions used in the line ratios calculation.
Download figure:
Standard image High-resolution image3. Results
3.1. System operation
After the HC installation into the vessel, the vacuum system was pumped down 10−6 mbar range. The HC heater is then turned on, leveling up the heater power to 150 W with the power left at maximum for 10 min, this is to bake the system, and heat the emitter to thermionic temperatures. At this point the vessel is backfilled between 2–4 mbar with the noble gas selected for the test.
Once backfilled with the heater power maintained at 150 W, the keeper voltage is applied at 200 V and current controlled at 2 A. Post-breakdown the keeper voltage would be maintained typically between 10–30 V. With a stable keeper discharge, the heater supply is turned off, at which point the anode discharge was ignited by using the ignition supply set at 1 kV, 300 mA, in parallel to the anode supply set at 200 V and current controlled at 2 A. After the formation of the anode discharge the ignition supply is turned off, with the anode discharge then maintained solely by the anode supply. At this point the system was fully ignited and the required parametric sweeps could be commenced.
3.2. Discharge electrical characterisation
The voltage–current characteristics for the system running on argon with varying anode and keeper currents are displayed in table 2, figures 7 and 8. It is seen that as the keeper current is increased the voltage drops, there is an almost linear increase in the keeper power. Such increases in the keeper current also result in an anode potential drop, and reduced anode power consumption, such that the total plasma power increase for increasing keeper current is moderate in comparison to the anode current increases, as seen in table 2.
Table 2. Total plasma power consumption with argon at 2 mbar.
| I A [A] | I K [A] | W T [W] |
|---|---|---|
| 3 | 4 | 204 |
| 3 | 3 | 189 |
| 3 | 2 | 166 |
| 3 | 1 | 157 |
| 3 | 0 | 146 |
| 2 | 4 | 156 |
| 2 | 3 | 142 |
| 2 | 2 | 131 |
| 2 | 1 | 123 |
| 2 | 0 | 118 |
| 1 | 4 | 126 |
| 1 | 3 | 110 |
| 1 | 2 | 99 |
| 1 | 1 | 90 |
| 1 | 0 | 71 |

Figure 7. Plasma source keeper power characteristics for Ar and p 0 = 2 mbar.
Download figure:
Standard image High-resolution image
Figure 8. Plasma source anode power characteristics for Ar and p0 = 2 mbar.
Download figure:
Standard image High-resolution imageThe total plasma power, WT, which is a combination of keeper and anode consumption is between 71 to 204 W, dependent on the operational parameters, most notably the anode current.
With the anode discharge running, the keeper discharge was often left on to aid in maintaining a stable anode discharge, although it was possible for it to be turned off such that the keeper was floating.
3.3. Electron density characterisation
Electron density measurements have been conducted at five locations along the length of the discharge tube, B, with the origin of the axial coordinate corresponding to the tube throat on the anode side, as shown in figure 2. Measurements are taken at 0.5, 2.5, 4.5, 6.5 and 8.5 cm from this origin with an uncertainty of 0.05 cm. Each measurement is repeated at least three times, with the electron density mean and repeatability error plotted, additionally any sizeable instrumentational uncertainty is discussed.
The measurement at 0.5 cm can be seen to be lower than the average for each data set. As the interferometer horns are 1.5 cm wide, they measure the average density from −0.25 cm to 1.25 cm at the 0.5 cm measurement location. This measurement region is ∼0.5 cm away from the anode, and as such, takes account partially of the anode fall, in which electron number density drops towards the anode. This effect is visible from figure 9 to figure 12.

Figure 9. Keeper current influence on column plasma density for Ar, p0 = 4 mbar, and IA = 2 A.
Download figure:
Standard image High-resolution imageIn figure 9, the keeper current dependency on plasma density is presented. The average density has a relatively moderate increase from 1.02 × 10¹⁹ to 1.24 × 10¹⁹ m−3 for a keeper current increase from 0 to 4 A. The experimental instrumentational noise remained below 1.5 × 10¹⁸ m−3 for this testing.
The total current is increased by a factor of 3, but the total plasma power increases by less than 35%, as can be seen in table 2. This is due to the anode voltage dropping with increased keeper current. As the keeper current increases there is a higher electron generation rate, thus a higher column density is reached with a lower anode voltage to reduce the electron drift velocity and maintain the given anode current.
The influence of the anode discharge current is shown in figure 10, and it can be seen that a 33% increase in the anode current results in an average density increase from 9.66 × 10¹⁸ to 12.38 × 10¹⁸ m−3, which is around a 28% increase. As the total power increases almost proportionally with the anode current, the equivalent relation is seen with the ne vs IA .

Figure 10. Anode current influence on column plasma density for Ar, p0 = 4 mbar, and IK = 2 A.
Download figure:
Standard image High-resolution imageThe experimental instrumentational noise remained below 7 × 10¹⁸ m−3 for this test, though notably for the 1.5 A data set, at the 0.5 cm setpoint the mean noise is 4.86 × 10¹⁸ m−3, such that it is greater than the electron measurement at that single setpoint. This behaviour was observed when reaching lower electron densities and as such, it was challenging to attain reliable measurements with further lowering of the anode current.
The vessels gas pressure influence on the electron density is seen in figure 11. As expected, the average electron density increases with increasing pressure, due to the reduction in the electron mobility at increased pressures. Additionally, the repeatability uncertainty can be seen to decrease as the pressure rises, showing the increased stability at higher pressures, indeed this behaviour is visibly seen with the luminescence more consistent at higher pressures.

Figure 11. Gas pressure influence on column plasma density, for Ar, IK = 4 A and IA = 2 A.
Download figure:
Standard image High-resolution imagePower dissipated in the plasma column is spent on the elastic collisions and on additional ionization to compensate electron losses at the walls. For the same anodic current, ne is expected to be approximately proportional to p0 as seen in figure 11.
ne rises almost proportionally to IA , as seen in figure 10. The deviation from this dependence is mainly due to the associated rise in VA which increases the electron drift velocity to compensate for the higher electron losses. This in turn slightly reduces the rise of ne.
Keeper current drives additional, sometimes perhaps excessive, ionization in the cathode-keeper gap. Moderate keeper currents are beneficial for the discharge stability and increases ne while reducing VA slightly.
In figure 12, a comparison of the electron density profiles for argon, krypton and xenon are displayed. In this comparison it was required to operate the Ar discharge at a higher pressure and anodic current than that of the Kr or Xe discharges. When the same parameters as for Xe, Kr were used, the ne decreased to the point that the instrumental noise was significantly greater than the measurement achieved. Alternatively, raising the current and pressure of the Xe and Kr discharges, resulted in an ne higher than the instrument's measurement capabilities.
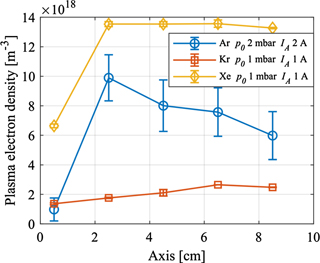
Figure 12. Gas species influence on column plasma density, for Ik = 4 A.
Download figure:
Standard image High-resolution imageNevertheless, the plot demonstrates clearly the high electron density gain from operating with Xe compared with Ar despite Xe operating at lower pressures and anodic currents. Hence Xe operation with higher currents would likely result in electron densities beyond 1.4 × 10¹⁹ m−3. For these gas comparison tests the instrumental uncertainty was at an average of 44% of the measured ne values.
Primary electrons emitted from the cathode are from field enhanced thermionic emission at the emitter, with secondary electron emission and ionization influenced by the gas characteristics. The first ionization energy for xenon is lower than that of krypton and argon, 12.1 eV compared with 14.0 eV and 15.8 eV respectively. Due to this, xenon results in higher ionization in the bulk plasma than that of argon and krypton, as observed in figure 12. Similar trends have been found in prior HC studies [48, 49].
These ne results demonstrate multiple parametric changes to vary the achieved electron density, although such changes lead to trade-offs for the antenna performance. Higher pressure is seen to increase electron density which increases the antenna operational frequency, though would lower the gain. Furthermore, utilizing pressure changes to achieve frequency hopping, although possible, are impractical due to the relatively long backfilling time compared to that of the electrical timescale, as well as the added valve system complexity required. Xenon yielded higher density for lower pressure than that of krypton or argon. This could allow for higher frequency GPA operation with lower gain loss than that of Kr or Ar.
3.4. Electron temperature characterisation
Figure 13 reports values of the argon electron temperature determined at three locations along the axis of the discharge tube, with the origin of the axial coordinate the same as with the ne measurements, see figure 2. Measurements are taken at 1, 5, and 9 cm, at each setpoint the measurement is repeated at least 3 times. In figure 13, Te is displayed corresponding to the discharge conditions at 4 mbar on the top row of the figure, and on the bottom row the discharge conditions at 2 mbar are shown. It can be observed that the electron temperature shows a relatively flat profile along the axis and does not change appreciably for different current values; slightly higher temperatures are shown for the lower pressure case at 2 mbar.

Figure 13. Electron temperature along the discharge column for 6 different argon discharge conditions.
Download figure:
Standard image High-resolution imageThis trend of temperature was expected since there is a relatively uniform plasma with far greater length than radius. Assuming a Maxwell distribution the electron temperature has only a weak dependence on pressure and no significant dependence on IA . Similar Te trends with discharge power for thermionic cathodes have been seen by Goebel [50] and Chi [51] and given the experimental error associated with measuring Te, it is not expected for sub-order-of-magnitude variance in p0 to have noticeable change in Te.
In terms of GPA operation, the electron temperature remains relatively low with an overall mean of 1.51 eV with a variance of 0.08 eV. Due to this low Te sensitivity, there would be almost negligible impact to the antenna performance from Te, when varying pressure or operational currents within the ranges tested.

Figure 14. Setup of the plasma monopole antenna's EM model.
Download figure:
Standard image High-resolution image4. Predicted antenna performance
In this section the thermionic DC plasma properties influence on GPA performance is assessed. More specifically, the analysis was done for GPA operation as a monopole quarter-wave antenna [4]. A commercially available numerical EM package [52] has been used in order to estimate the reflection coefficient of the antenna and its radiation pattern [4]. As shown in figure 14, the antenna is modelled as a cylindrical plasma rod placed on top of a circular ground plane that has a radius of rGP = 1.5 m. The cylindrical plasma rod has the same dimensions of the plasma discharge characterised in the prior section, with a length of 100 mm and a diameter of 8 mm. The plasma is assumed to be a non-uniform medium, specifically the axial and radial gradients of electron density have been accounted for. The presence of anode and cathode, whose dimensions are reported in section 2, has also been considered. The latter have been assumed to be in contact with the plasma. The cathode is located below the ground plane and is encased in a shielding box of diameter DB = 30 cm and length LB = 20 cm. This box is needed to avoid the presence of unwanted back lobes of the radiation pattern [3]. The signal is introduced into the antenna via a discrete face port which connects the ground plane with the cathode.
In order to evaluate the behaviour of this GPA as the plasma parameters are reconfigured, two experimental cases have been considered, namely a low and high electron density configuration. The exact plasma parameters in the two cases are reported in tables 3 and 4. Specifically, the axial distribution of electron density reported in table 4 is derived with the MW interferometer [37] previously described; consequently, the latter are average values obtained in each section of the plasma column. At the same time, the radial distribution of plasma density is assumed to fit the analytical trend described in [53, 54] provided that the length of the discharge is considerably greater than its radius. Therefore, the non-uniformity of the electron density profile in the radial direction has been estimated analytically [54]. It is worth specifying that the instrumentation uncertainty is less than 7 × 10¹⁷ m−3for the high-electron density case, and for the low electron density case, it is 5.1 × 10¹⁸ m−3. Although this noise is comparable to the measured density value for the low-density case, the instrumentation noise grows with lowering density, as such is an indicator of low-density operation. The electron temperature for both cases is taken as the average value of the measurements performed for the 2 mbar argon experiments and is reported in figure 13. As has been seen, Te variance along the plasma column and for the parameters tested is minor and, hence, has negligible impact on the undertaken estimations. Finally, the GPA's operation is compared to that of a same-size metallic antenna.
Table 3. Plasma parameters for low-density and high-density plasma cases.
| Low-density plasma | High-density plasma | |
|---|---|---|
| Gas | Ar | |
| I A [A] | 1 | 2.5 |
| I K [A] | 4 | |
| p 0 [mbar] | 2 | |
 [eV]
[eV]
| 1.53 | |
| ν c [Hz] | 6.72 × 10⁸ | |
Table 4. Axial distribution of the measured electron density and plasma frequency for low-density and high-density plasma.
| Position z [cm] | Low-density plasma | High-density plasma | ||
|---|---|---|---|---|
| ne [m−3] | ωp [rad s−1] | ne [m−3] | ωp [rad s−1] | |
| 0.5 | 2.66 × 10¹⁸ | 9.20 × 10¹⁰ | 6.57 × 10¹⁸ | 1.45 × 10¹¹ |
| 2.5 | 2.56 × 10¹⁸ | 9.03 × 10¹⁰ | 1.33 × 10¹⁹ | 2.06 × 10¹¹ |
| 4.5 | 2.52 × 10¹⁸ | 8.96 × 10¹⁰ | 1.27 × 10¹⁹ | 2.01 × 10¹¹ |
| 6.5 | 2.65 × 10¹⁸ | 9.18 × 10¹⁰ | 1.21 × 10¹⁹ | 1.96 × 10¹¹ |
| 8.5 | 2.25 × 10¹⁸ | 8.46 × 10¹⁰ | 1.15 × 10¹⁹ | 1.91 × 10¹¹ |
Before proceeding with the discussion of the results it is worth specifying how the EM parameters of the plasma, namely the relative electrical permittivity  , have been calculated. The plasma is assumed cold [17, 55] (see appendix

where ωp is the plasma frequency, νc is the collision frequency, ω refers to the signal frequency, and j is the imaginary constant. In particular, the plasma frequency is defined as

with ne designating electron density, ɛ0 the electric permittivity of vacuum, qe and me the electron's charge and mass respectively. The collision frequency is evaluated by using a standard collision mechanics lumped model [53, 55] as a sum that takes into account all the collisional processes:

where νei accounts for the electron–ion collisions and νen depends on the electron–neutral collisions. The expressions for these collision frequencies are the following [53, 57]:

where the neutral density n0 and the electron density ne are expressed in m−3, while the electron temperature Te in eV. In particular, in tables 3 and 4 also the plasma frequency and the collision frequency assumed in the low-density and high-density plasma cases have been reported. Finally, it is worth specifying that the effect of plasma non-uniformity is accounted allowing  to vary into space.
The first parameter analysed is the reflection coefficient S11 as a function of the signal frequency f (see figure 15). This is an important performance indicator provided that S11 is related to the transmission/reception efficiency. Specifically, a generic antenna is coupled, through a transmission line [4], to an electronic system which processes the signal. Whether the impedance of the antenna and the one of the transmission line (usually equal to 50 Ω) are matched, the intensity of the signal received/transmitted is maximised. The latter condition is registered for S11 = 0 (in linear scale). Provided that this perfect matching is rarely met in practice, antennas are assumed to transmit/receive signals efficiently enough whether the S11 is below <−10 dBi (in logarithmic scale) [4]. Eventually, in a monopole antenna, the minimum value registered for S11 and the antenna resonance (i.e., imaginary part of the antenna impedance equal to zero) occurs at almost the same frequency fres [4]. Both in the low-density plasma and in the high-density plasma cases, there is a frequency range in which S11 <−10 dBi. At the same time, as the plasma density varies, a shift of this frequency interval, and in turn of the resonant frequency, is noticed. Between the low-density plasma and the high-density plasma cases, a hop of roughly 100 MHz is registered (i.e., a shift of more than 10% in respect to fres). Moreover, in the high-density plasma case the resonant frequency is roughly 10% lower than that of a metallic antenna, as shown in table 5. This behaviour is related to the different EM parameters assumed in the three cases analysed for the rod that acts as an antenna. Indeed, as the plasma density increases, its capability to sustain the currents required to receive/transmit the signal increases as well. For this reason, a higher density plasma behaves more and more similarly to a metal (e.g., length of the waves propagating inside the plasma shorten as the plasma density increases [58]). As a consequence, the resonant frequency for the high-density plasma is closer to the one of a metallic antenna than in the low-density plasma case.

Figure 15. Reflection coefficient S11 as a function of the signal frequency f for the low-density plasma and the high-density plasma cases.
Download figure:
Standard image High-resolution imageTable 5. Comparison of antenna performances between the low-density plasma, high-density plasma and metallic antenna cases.
| Resonance | First resonance antenna gain | |
|---|---|---|
| frequency fres [GHz] | in [dBi] and (linear scaling) | |
| Low-density plasma | 0.53 | 1.34 (1.36) |
| High-density plasma | 0.63 | 3.46 (2.22) |
| Metallic antenna | 0.72 | 4.42 (2.77) |
The second antenna parameter analysed is the gain, IEEE-defined [59]. In figure 16, the two-dimensional polar antenna gains have been reported for the high-density plasma, low-density plasma, and metallic antenna cases; each pattern is omnidirectional. The maximum value of the gain is not registered in correspondence of an elevation angle of 90°, namely in the direction parallel to the ground plane, provided that the latter has a finite size [60] (see appendix

Figure 16. Two-dimensional antenna's gain (IEEE-defined) for the high-density plasma, low-density plasma, and metallic antenna cases, shown in linear scaling.
Download figure:
Standard image High-resolution imageThe principal outcome of these antenna simulations is the characterisation of the influence that plasma parameters have on the GPA performance. Specifically, the source presented in this work allows the exploitation of a notably interesting feature: antenna frequency hopping of more than 100 MHz is controlled exclusively by regulating the plasma density. Moreover, even in the low-density plasma case for this source the antenna gain is greater than 1.3 dBi, which is one of the highest values ever reached using classical discharges exploited for GPAs. Furthermore, in the high-density plasma case the antenna gain is greater than 3.4 dBi, which is only −0.9 dBi less than that of the metallic antenna.
It is notable that these estimations utilise the achieved electron density measurements, and although higher and lower density measurements are not detectable with the available instrumentation, as discussed prior, there is good indication that this thermionic source can produce electron densities higher than 5 × 10¹⁹ m−3 and lower than 1017 m−3. Thus, potentially allowing for frequency hops significantly higher than 100 MHz, as well as gains even closer to that of metallic antennas.
Although reflection coefficient and gain measurements are beyond the scope of the present paper, it is worth outlining the plan to transition this prototype into an actual GPA in the near future. Notably, the numerical setup described in this section is quite representative of a realistic GPA, as the presence of the anode and cathode, along with a shielding box to minimize back lobes, has been accounted for. In the GPA device, the signal is coupled to the plasma via the cathode. Therefore, a high-pass filter will be designed to avoid the introduction of DC disturbances in the network which generates/processes the signal. At the same time, the support hardware required to pump down and backfill the vessel as well as power the discharge can be encased in a Faraday cage located below the ground plane, so as to minimize interferences.
Wider commercial use of such a system would clearly require simplification and optimisation. For instance, the glass vessel shall be a 'closed' system backfilled with the required gas. At the same time, the HC source would be minimised, such as adopting heaterless HC ignition [61, 62] reducing source size and that of the electrical control system to sustain the plasma [61, 63].
5. Conclusions
It was found that a plasma source apparatus utilizing a thermionic HC can provide enhanced plasma properties for high-density GPA applications. This apparatus has demonstrated higher electron densities (>10−19 m−3) at low pressures (<2 mbar) than has been experimentally achieved before for such applications. Potentially this can allow GPA's to reach gain levels comparable to a metallic antenna. The system was successfully operated with xenon, argon, and krypton, with xenon providing the highest electron densities at low pressures.
The electron temperature varies only marginally with notable variations in the neutral gas pressure, the operational DC current and the electron density. The electron temperature is determined to be typically around 1.5 eV for the argon discharge.
Furthermore, the apparatus is shown to operate over a wide range of densities, from <3 × 10¹⁸ to >1019 m−3 , which could enable wide-range frequency hopping of >100 MHz with a gain maintained higher than 1.3 dBi.
The antenna performance analysis has indicated that the thermionic plasma source apparatus has plasma properties which would be beneficial for high-density GPA applications, where gain performance comparable to metallic antennas is required. Additionally, the system shows promise for frequency hopping applications, wherein signals are received/transmitted on frequencies which are varied in the 10−3 to 10−6 second timescale range.
Acknowledgments
The authors wish to acknowledge the help of Simone Ciaralli on the plasma source setup and operation. We would also like to acknowledge funding from the EU Horizon 2020 Plasma Antenna Technologies project (Grant agreement ID: 734629).
: Appendix A
The scope of this appendix is to give further details on the results of the antenna simulations, specifically four aspects have been analysed: (a) influence of plasma density gradients on the antenna performances, (b) effect of a finite size ground plane, (c) effect induced by the presence of the anode and cathode, and (d) effect of finite temperature.
A.1. Effect of plasma density gradients
The effect of plasma gradients on the simulations results has been analysed relying on a simplified numerical setup. The plasma column (length 100 mm and diameter 8 mm) is located on top of an infinite ground plane. The signal is injected via a discrete face port located between the plasma and the ground plane. No cathode or anode are considered. Referring to the high-density plasma configuration (see table 4), three sub-cases have been studied: (i) uniform plasma, (ii) only axial gradients of electron density accounted, (iii) both axial and radial gradients of plasma density considered. The results, in terms of resonance frequency and antenna gain, are reported in table 6 and figure 17 for the three cases. Provided that axial non-uniformity is relatively mild (below <15%) the uniform plasma and axial gradient cases present negligible differences. Instead, accounting also for radial gradients of electron density, the gain increases of roughly 2 dBi while the resonance frequency is mildly reduced by 20 MHz. These results are consistent with the behaviour of a metallic monopole, in fact the resonance frequency is chiefly related to the electrical length of the antenna, while its diameter can influence the radiation pattern [4]. In this case, the presence of radial gradients results in the reduction of the equivalent diameter of the plasma column [4].
Table 6. Radial and axial density gradients influence on antenna performances.
| Case | Resonance | First resonance antenna |
|---|---|---|
| frequency fres | gain in [dBi] and (linear | |
| [GHz] | scaling) | |
| Uniform plasma | 0.65 | 2.59 (1.81) |
| Axial gradients | 0.64 | 2.49 (1.78) |
| Radial-axial gradients | 0.62 | 4.62 (2.90) |

Figure 17. Radial and axial density gradients influence on the computed antenna gain.
Download figure:
Standard image High-resolution imageA.2. Effect of the dimension of the ground plane
The effect of the dimension of the ground plane on the performance of a metallic monopole antenna has been previously studied [60]. Here follows an analysis to verify whether similar trends are reproduced also with plasma antennas. A simplified numerical setup has been adopted, the high-density plasma case (see table 4) has been assumed considering axial and radial electron density gradients. The plasma column, without anode and cathode, is located on top of a ground plane which can be infinite or finite with radius rGP equal to 1.0 m or 1.5 m. Results are reported on table 7 and figure 18.
Table 7. Ground plane influence on antenna performances.
| Ground plane | Resonance | First resonance antenna |
|---|---|---|
| radius rGP | frequency fres | gain in [dBi] and (linear |
| [m] | [GHz] | scaling) |
| 1.0 | 0.62 | 3.88 (2.45) |
| 1.5 | 0.62 | 4.50 (2.82) |
| ∞ | 0.62 | 4.62 (2.90) |

Figure 18. Ground plane's influence on the computed antenna gain.
Download figure:
Standard image High-resolution imageAs expected, the resonance frequency is not affected by the size of the ground plane. Conversely, as rGP grows, the intensity of the maximum gain increases and its direction approaches 90°. For the case at hand, rGP is roughly 2λ and 3λ, where λ = c0/fres is the wavelength in free space and c0 is the speed of sound.
A.3. Effect of cathode and anode
The effect induced by the presence of metallic anode and cathode at the endpoints of the plasma column have been analysed in the following. Two cases have been compared, namely (i) plasma column directly interfaced to the ground plane via a discrete face port, and (ii) complete numerical setup depicted in figure 14.
In both cases the high-density plasma scenario has been assumed (see table 4), along with the ground plane with a radius of 1.5 m. Results are presented in table 8 and figure 19.
The presence of anode and cathode lengthen the electrical length of the antenna with a consequent reduction of the resonance frequency (roughly −90 MHz). At the same time the presence of metallic elements, whose diameter is different to the one of the plasma column, tend to affect badly the radiation pattern which presents a maximum gain reduced of 1 dBi in respect to the idealized case. Finally, it is worth specifying that the presence of the metal box which shields the cathode is necessary to avoid back lobes.
A.4. Effect of finite temperature
The expression of the relative electrical permittivity adopted in section 4 [see equation (6)] is valid assuming that the plasma is unmagnetized and cold [64]. Namely, the effects induced by finite temperature (e.g., occurrence of acoustic waves) and kinetic phenomena (e.g., Landau damping) have been neglected [64]. Nevertheless, the latter aspects must be accounted to accurately describe the wave propagation in several laboratory experiments [65, 66] in which the plasma density is in the order of 1018–1019 m−3. For this reason, an additional analysis has been carried out to verify that the plasma can be assumed cold in the present study. Specifically, a simplified version of the EM problem has been tackled with the numerical tool SPIREs [67, 68]. The latter solves the full set of Maxwell's equations in a cylindrical domain which is infinite in the axial direction and filled with a plasma that can be considered cold or hot [64]. Specifically, the EM fields are Fourier transformed in time and along the axial and azimuthal directions; the resultant Maxwell's equations are solved with the finite difference approach along the radial direction. Therefore, any field solved by SPIREs is expressed as a function of the excitation frequency ω, the axial wavenumber kz , the azimuthal wavenumber m, and the radial coordinate r [68].
Table 8. Influence of electrodes on antenna performances.
| Case | Resonance | First resonance antenna |
|---|---|---|
| frequency fres | gain in [dBi] and (linear | |
| [GHz] | scaling) | |
| Plasma column | 0.62 | 4.50 (2.82) |
| Anode & cathode | 0.53 | 3.46 (2.22) |

Figure 19. Influence of electrodes on the computed antenna gain.
Download figure:
Standard image High-resolution imageA cylindrical column of diameter D = 8 mm filled with uniform and unmagnetized plasma has been studied. The plasma density is assumed ne = 1019 m−3, the electron temperature Te = 1.5 eV, the neutral background pressure p0 = 2.0 mbar, and the excitation frequency is ω = 4.0 × 10⁹ rad s−1. These values are coherent with the data used in section 4. The axial wavenumber has been varied in the range from kz = 1.57 rad m−1 up to kz = 157 rad m−1; namely the axial wave length λz = 2π/kz varies from 0.4L up to 40L, where L = 0.1 m is the length of the plasma column. Such range of kz , and in turn of λz , has been chosen because, in accordance with [17], the resonance of a plasma monopole occurs whether L is an integer multiple of λz /4; in particular λz ≈ 4L in the case studied in section 4. The azimuthal wavenumber m has been assumed equal to +1.
In figure 20 the modulus of the azimuthal electric field Eθ is reported as a function of the radial coordinate r assuming a cold and a hot plasma respectively, along with for λz = 0.4L (kz = 157 rad s−1) and λz = 40L (kz = 1.57 rad s−1). In case of λz = 40L, a difference of less than 1% on the value of Eθ is noticed assuming the plasma cold or hot; for λz = 0.4L the gap increases up to 2%–3%. As a consequence, the assumption of a cold plasma is expected to produce errors of a few percent points in the analysis at hand (λz ≈ 4L) while simplifying the numerical treatment.

Figure 20. SPIREs results, modulus of the azimuthal electric field Eθ as a function of the radial coordinate r. Comparison between plasma cold and hot for different axial wave lengths.
Download figure:
Standard image High-resolution image
The results here described are in agreement with the experimental evidence reported in [69] where the following rule of thumb is formulated: 'the effects of thermal motion on the wave dispersion have to be taken into account when the phase velocity is sufficiently decreased to become of the order of the electron thermal velocity'. For the plasma antenna at hand, the phase velocity is Vph ≈ ω/kz ≈ 108 m s−1 and the thermal speed of the electrons is Ve ≈ 106 m s−1.