Impacts of Spectral Nudging Parameters on Dynamical Downscaling in Summer over Mainland China
 Xiaoping Mai
 Xiaobin Qiu
 Yi Yang
 Yuanyuan Ma5
- 1Key Laboratory of Research on Marine Hazards Forecasting, National Marine Environmental Forecasting Center, Beijing, China
- 2Research Center for the Development of the Earth System Model of Lanzhou University, College of Atmospheric Sciences, Lanzhou University, Lanzhou, China
- 3Tianjin Key Laboratory for Oceanic Meteorology, Tianjin, China
- 4Tianjin Institute of Meteorological Science, Tianjin, China
- 5Key Laboratory of Land Surface Process and Climate Change in Cold and Arid Regions, Northwest Institute of Eco-Environment and Resources, Chinese Academy of Science, Lanzhou, China
Spectral nudging is an important method of improving the effectiveness of dynamical downscaling in the Weather Research and Forecasting model (WRF). However, spectral nudging is sensitive to nudging parameters, and most related research has typically adopted the default nudging schemes. Summer is the rainy season in China. Both typhoons and heavy rains occur in summer. It is therefore significant to discuss the optimal nudging parameter settings to achieve better summer climate simulations over mainland China. In this study, we analyzed the impacts of various nudged variables and their cutoff wavelengths on the downscaling ability by simulating the summer climate over mainland China in 2009 and 2010. The results showed that nudging the horizontal wind or potential temperature had a significant effect on the simulation of nearly all conventional meteorological fields and that nudging the geopotential height affected mainly precipitation. The suitable cutoff wavelengths were 500 or 1,000 km for wind, 1,000–2,000 km for potential temperature, and 1,000 km for geopotential height. Nudging all variables had obvious advantages over nudging the wind, potential temperature, or geopotential height individually in nearly all subregions. The appropriate cutoff wavelength was 500–1,500 km when all variables were nudged. Overall, nudging all three variables with 1,000 km cutoff wavelength is recommended for dynamical downscaling in summer over mainland China.
Introduction
Climate change has been a research hotspot in recent years. Global climate models (GCMs) and reanalysis data constitute the primary tools for climate research, but the output of GCMs and the reanalysis data are both too coarse to be directly applied to regional climate descriptions at a fine scale (IPCC, 2013). Dynamical downscaling, which consists of driving regional climate models (RCMs) with large-scale fields provided by GCMs or reanalysis data, has been developed to obtain regional-scale or local atmospheric information. Due to their high horizontal resolution and complex physical parameterization schemes, RCMs can simulate many small- and mesoscale weather processes caused by local topography, land use and land cover conditions, pollutant emissions, etc. (Giorgi and Shields, 1999; Leung et al., 2003; Wang et al., 2004; Feser et al., 2011; Rockel, 2015). Initially developed for short-term weather forecasting, the Weather Research and Forecasting model (WRF) is widely used as a RCM for conducting regional-scale climate research.
China has some of the highest seasonal, interannual, and interdecadal climate variability worldwide (Fu and Zheng, 1998). In summer, China is simultaneously controlled by the easterly and westerly wind belts. The South Asian High is situated over the Tibetan Plateau, and the strongest easterly jet in the world occurs on the south side of the plateau. The southwestern and eastern subregions of China are dominated by the Indian southwest monsoon and the East Asian monsoon, respectively. In addition, the Western Pacific Subtropical High strengthens in eastern subregions of China. RCMs have also been applied in China for regional climate simulations and future climate change studies (Lee et al., 2004; Ding et al., 2006; Gao et al., 2012; Wang and Entao, 2013; Hu et al., 2015; Hui et al., 2015; Kong and Bi, 2016; Tang et al., 2016a; Tang et al., 2016b). However, considering the complex influences in this region, it is relatively difficult to carry out accurate numerical simulation experiments. Some research has focused on the selection of the horizontal resolution (Gao et al., 2006), vertical layers (Zhao and Luo, 1999), parameterization schemes (Liu and Ding, 2001; Pan et al., 2002), adaptation adjustment (spin-up) time (Zhong et al., 2007), underlying surface data (Liu et al., 2018), nesting domains (Qian and Liu, 2001; Bao et al., 2006), and other models factors to improve climate simulations. However, the long-term integrations of RCMs will gradually deviate from the large-scale climate fields due to the accumulation of simulated errors, which is known as “climate drift”. This phenomenon also greatly affects the simulation performance. Spectral nudging, which is an efficient assimilation method in WRF, can ensure consistency between the simulated large-scale fields and the global driving fields to restrain “climate drift” (Miguez-Macho et al., 2004; Radu et al., 2008; Salameh et al., 2010; IPCC, 2013).
Recently, it has become popular to use nudging in regional climate simulation (Miguez-Macho et al., 2004; Song and Tang, 2011; Otte et al., 2012; Ma et al., 2016). Song and Tang (2011) evaluated the performance of spectral nudging in simulating summer precipitation over East Asia with different nested domains. The results showed that spectral nudging could improve the precipitation simulation and significantly reduce its sensitivity to the different nested domains. Miguez-Macho et al. (2004) found that spectral nudging could successfully eliminate the spatial distortion of precipitation caused by changes in the simulation domain. Otte et al. (2012) also indicated that extreme events were better simulated with spectral nudging than without spectral nudging.
Spectral nudging has many adjustable parameters, such as the nudged variables, nudging time, nudged level, and cutoff wavelength, which play important roles in the simulations. Omrani et al. (2015) used the “Big-Brother experiment” to determine the influence of nudging different variables. The experiment showed that nudging the horizontal wind greatly improved the simulated surface air temperature, wind, and precipitation. Nudging the potential temperature also contributed to the simulation of meteorological fields, but nudging the geopotential height had no obvious effect. Pohl and Crétat (2014) indicated that there were significant differences in the performance of experiments with different nudged variables in the tropics. The above studies about nudged variables were either based on ideal experiments or located in the tropics. Further research is needed to evaluate the impacts of nudged variables on dynamical downscaling over mainland China.
Bullock et al. (2013) reported that spectral nudging was insensitive to the nudging time but sensitive to the cutoff wavelength setting. Pielke (2001) noted that the optimal cutoff wavelength was related to the driving field resolution (dx) and should be more than 4 × dx. Many studies have set their cutoff wavelength based on this conclusion (Castro et al., 2005; Rockel et al., 2008; Song and Tang, 2011; Bowden et al., 2012; Otte et al., 2012; Bullock et al., 2013). There have also been many studies in which the cutoff wavelength was determined by the subjective experience of researchers (Miguez-Macho et al., 2004; Miguez-Macho et al., 2005; Alexandru et al., 2009; Barstad et al., 2009; Separovic et al., 2012; Cha and Wang, 2013). Therefore, it is necessary to carry out sensitivity experiments to determine suitable cutoff wavelength settings for Chinese climate simulations.
For the nudged layers, previous studies (Lo et al., 2008; Pohl and Crétat, 2014; Mai et al., 2017) demonstrated that nudging above the planetary boundary layer (PBL) should be recommended. Both Lo et al. (2008) and Pohl and Crétat (2014) compared the simulation performance obtained by nudging all atmospheric levels with that obtained by nudging only levels above the PBL. The results showed that nudging above the PBL led to better results for some simulated meteorological fields. Mai et al. (2017) explored different nudged level settings for grid nudging over mainland China and indicated that the regional climate simulation with nudging above the PBL showed better performance than other experiments with nudging above 850, 700, or 500 hPa. These studies demonstrated the advantages of nudging above the PBL. In fact, this is less true in the PBL, which is more turbulent by nature and can be better resolved by WRF (Pohl and Crétat, 2014). Nudging above the PBL not only prevents the middle and upper levels from deviating too far from the driving fields but also maintains WRF’s ability to generate important meso- and small-scale features near the surface.
On the basis of this background information, our study focuses on the influence of nudged variables and cutoff wavelengths on spectral nudging over mainland China. Disasters are prone to occur in summer (Tang et al., 2009; Song and Tang, 2011; Hu et al., 2015; Wei et al., 2015; Mai et al., 2017), and there are many uncertainties in this research. Thus, the summer was selected as the simulated season. In this study, using the WRF model and National Centers for Environmental Prediction (NCEP) Final Operational Global Analysis (FNL) data, we conducted 37 sensitivity experiments with different nudging parameters to investigate the performance of spectral nudging in summer over mainland China.
This paper is organized as follows: descriptions of spectral nudging, the experimental setup, and the evaluation method are given in Data and Methods. Results evaluates the effects of different nudged variables and cutoff wavelengths on surface and upper-air meteorological field simulations, thus providing referential nudging schemes for regional climate simulations over mainland China. Finally, Conclusion and Discussion summarizes the results and highlights some research questions that require further investigation.
Data and Methods
Spectral Nudging
Spectral nudging was proposed by Waldron et al. (1996) and improved by Storch et al. (2000). This technique was first used in the Pennsylvania State University/National Center for the Atmospheric Research mesoscale model (known as MM5) and became one of the assimilation methods within WRF version 3.1. In spectral nudging, the input data are transformed for spectrum analysis by a fast-Fourier transform and then used to drive WRF on selected larger spatial scales only. Therefore, the technique not only ensures consistency between the simulated large-scale circulations and the analysis fields but also allows small-scale details in the model to evolve without nudging. In WRF, spectral nudging is represented by the following general equation described by Choi and Lee (2016):
Here,
where
In WRF,
Compared with assimilating observational data, spectral nudging is better at reducing “climate drift”, since it can act directly on large-scale fields. Moreover, spectral nudging keeps simulations close to the driving fields by applying extra forcing terms to the model equations. The method provides a four-dimensional analysis that is somewhat dynamically balanced and continuous, allowing for complex local topographical or convective variations. This may be useful for stable and efficient model operation in long analysis-driven simulations (e.g., months to years). The more advanced assimilation methods, such as 3DVAR/4DVAR/EnKF, may also provide similar or better analysis. However, the high computing resource requirements of 4DVAR and EnKF make them currently unfeasible. 3DVAR is economical, but it lacks constraints during simulation.
Experimental Setup
WRF contains two dynamical solvers, referred to as the advanced research WRF (ARW) and the nonhydrostatic mesoscale model (NMM). WRF ARW version 3.6.1 was used as the RCM for conducting dynamical downscaling simulations during summer over mainland China. The model domain was centered at 30°N, 105°E, covering most of East Asia (Figure 1A). The land use from MODIS IGBP 21-category data (Figure 1B) and the terrain height (Figure 1A) vary dramatically from west to east over mainland China and cause different climate conditions in various subregions of China. The study periods included the summers of 2009 and 2010. In these two years, the major circulation patterns were generally stable over China (Ai et al., 2010; Jia et al., 2011). The model was integrated from May 22 to September 1 in 2009 and 2010. The initial 10 days were considered a spin-up period, and the results from 1 June to 1 September were utilized to investigate the simulation performance. The simulation results from 2009 were used for analysis and those from 2010 were used to verify the universality of the referential nudging schemes obtained from 2009.
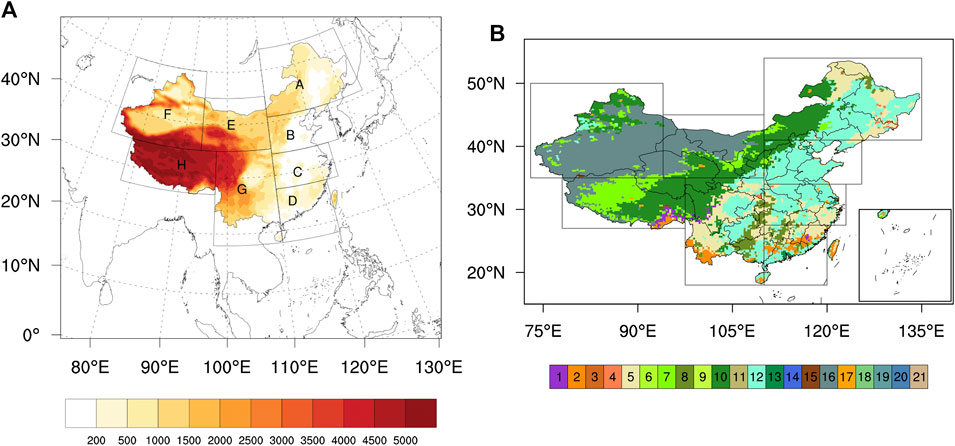
FIGURE 1. (A) Simulated domain, terrain height (m), and subregion map (A, Northeast China; B, North China; C, East China; D, South China; E, East of Northwest China; F, West of Northwest China; G, Southwest China; H, Tibet); (B) distribution of land use (1–21 refer to MODIS IGBP 21-category land use, including lake).
All experiments used a 30 km grid spacing with
Previous study (Bullock et al., 2013) indicated that spectral nudging was insensitive to nudging time. Therefore, the nudging strength was uniformly set as
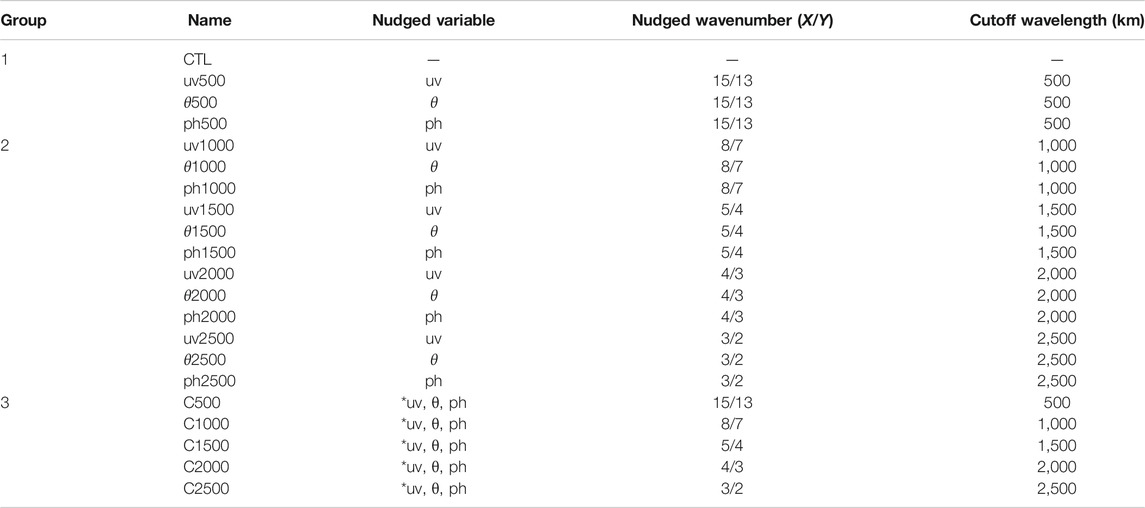
TABLE 1. Experiment design (X-zonal direction, Y-meridional direction, uv denotes horizontal wind, θ denotes potential temperature, and ph denotes geopotential height. Nudged variables for Group 3 were selected based on the simulation performance of Groups 1 and 2).
Evaluation Data and Methods
The daily mean observation data from 838 ground stations were used to evaluate the simulated surface meteorological fields, which include precipitation, 2 m temperature, relative humidity, and 10 m wind speed. The simulated upper-air meteorological fields, including geopotential height, temperature, relative humidity, and wind speed, were evaluated by the standard pressure layer (1,000, 925, 850, 700, 500, 400, 300, 250, 200, 150, and 100 hPa) data from 129 sounding stations. All observation data came from the China Meteorological Data Service Center website (http://data.cma.cn/en) and underwent strict quality control. The locations of the observation stations are shown in the report by Mai et al. (2017).
Referring to the regional divisions of Zhao et al. (2011) and Mai et al. (2017), mainland China was divided into eight subregions, as shown in Figure 1A, and the simulation results were evaluated for each subregion to explore the suitable parameter settings. A–H in Figure 1A denote Northeast China, North China, East China, South China, Eastern Northwest China, Western Northwest China, Southwest China, and Tibet, respectively.
Model evaluation was performed by interpolating the simulation results onto the observation station locations and quantifying the model’s ability to simulate the meteorological fields with the root mean square error (RMSE), mean error (ME), and correlation coefficient (CC). To evaluate the multivariate comprehensive simulation performance, the RATE based on the RMSE is defined as follows:
where nv denotes the number of nudged variables,
Results
In this section, first, the impacts of nudging different variables on the simulation of surface and upper-air meteorological fields in summer 2009 are analyzed. Then, we discuss the advantages and disadvantages of different cutoff wavelengths when single variables are nudged. In addition, the simulation performances of nudging single variables are compared with those of nudging multiple variables. Finally, simulations with the same nudging scheme are conducted for summer 2010 to verify the universality of the optimal nudging strategy.
Sensitivity Analysis to Nudged Variables
To investigate the role of each nudged variable, the simulated meteorological fields with and without nudging are compared in Group 1. Figure 2 displays the difference fields of surface meteorological fields (seasonal accumulated precipitation, seasonal mean 2 m temperature, relative humidity, and 10 m wind speed) in summer 2009 over mainland China. Nudging uv, θ, or ph had a large effect on the simulation of precipitation, while the effect of nudging uv or θ was more significant than that of nudging ph in Tibet (H) (Figures 2A,E,I). Nudging θ reduced precipitation in most subregions, and the distribution of precipitation changes was more irregular when the other two variables were nudged. For the simulated 2 m temperature (Figures 2B,F,J), nudging θ had the most obvious impact and reduced the simulated value over nearly all of China. Nudging uv had the second largest impact, and the simulated temperature became warmer in most subregions. Nudging ph had a weak effect. As displayed in Figures 2C,G,K, nudging uv greatly impacted the simulation of the 10 m wind speed, reducing the simulated value in all subregions. The effect of nudging θ was also obvious, and the simulated wind speed in the eastern region (A–D) decreased significantly. For the 2 m relative humidity (Figures 2D,H,L), the most important nudged variables were uv and θ. Nudging the two variables increased the simulated relative humidity in Tibet (H), inhibited the humidity in Western Northwest China (F), and had the opposite effect in other subregions.
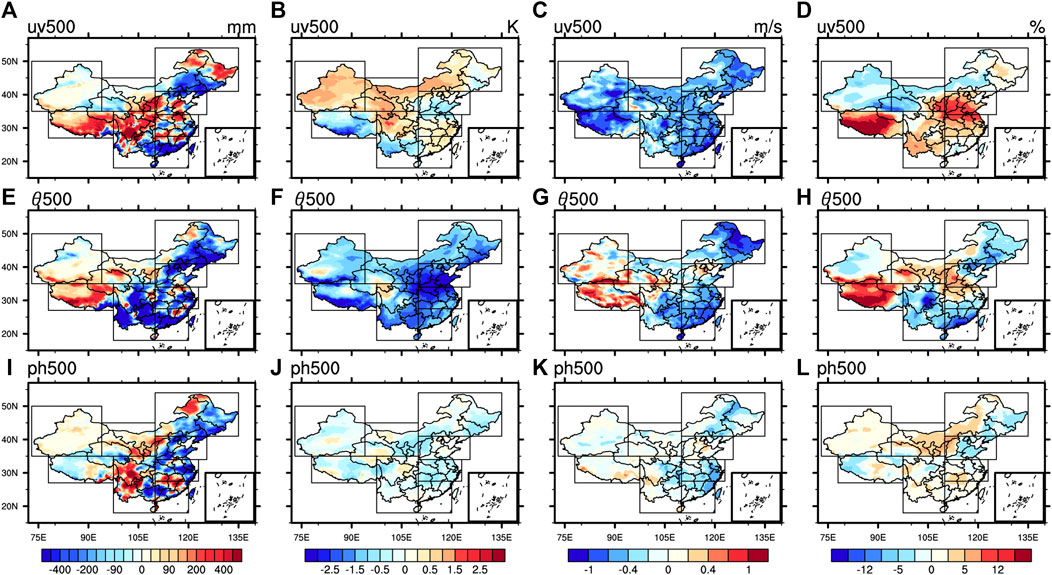
FIGURE 2. Difference fields of simulated surface meteorological field with and without nudging in summer 2009: (A–D) seasonal accumulated precipitation, seasonal mean 2 m temperature, relative humidity, and 10 m wind speed, respectively, with nudging uv; (E–H) same as (A–D) but nudging θ; (I–L) same as (A–D) but nudging ph.
Figure 3 shows the difference fields of the simulated meteorological fields at 500 hPa (seasonal mean 500 hPa geopotential height, temperature, wind speed, and relative humidity) between nudging experiments and CTL. For the geopotential height (Figures 3A,E,I), the impact of nudging uv was the greatest, increasing the simulated geopotential height over the whole region. Nudging θ had a weak effect, and nudging ph had almost no influence on the simulated geopotential height. For the 500 hPa temperature (Figures 3B,F,J), nudging θ significantly reduced the simulated value in most subregions. Nudging uv increased the simulated temperature in the northern region (A–B, E–F) and reduced its value in the southern region (C–D, G–H). The effect of nudging ph was also not obvious. For the 500 hPa wind speed simulation (Figures 3C,G,K), the effect of nudging uv was the strongest, reducing the simulated value over the whole domain, followed by nudging θ and ph. When uv or θ was nudged, the simulation of the 500 hPa relative humidity was significantly affected (Figures 3D,H,I). Particularly, in Tibet (H), the relative humidity increased more than 12%. Moreover, in the eastern region (A–D), nudging θ made the 500 hPa air drier by approximately 10% than nudging uv, and nudging ph still had a weaker effect.
FIGURE 3. Same as FIGURE 2, except for 500 hPa meteorological fields including the seasonal mean geopotential height (A,E,I), temperature (B,F,J), wind speed (C,G,K), and relative humidity (D,H,L).
In general, individually nudging uv, θ, and ph affects the simulation of surface and upper-air meteorological fields, but the most-affected meteorological fields and the levels of influence are different. Nudging uv or θ has a greater impact on simulated meteorological fields. Specifically, nudging uv has significant impact on all variables; nudging θ also has significant impact on each variable excepting potential height; but nudging ph only impacts precipitation. The effects of nudging uv on wind field and nudging θ on temperature field are more consistent in spatial distribution.
Sensitivity Analysis to Cutoff Wavelength for Nudging Single Variables
To further consider the advantages and disadvantages of different cutoff wavelength settings in meteorological field simulations, we established sensitivity experiments with cutoff wavelengths of 500, 1,000, 1,500, 2000, and 2,500 km for each nudged variable in Groups 1 and 2 and combined the observation data to evaluate the simulation performance of each experiment by subregion.
Surface Meteorological Field Simulation Analysis
Table 2 shows the RATE of simulated precipitation, 2 m temperature, relative humidity, and 10 m wind speed. These values can be used to analyze the comprehensive effect of the surface meteorological field simulation. Considering the simulation over the whole country, nudging uv or θ improved the simulated value more noticeably, but the effect of nudging ph was relatively small. Of the different subregions, the simulation in the eastern region (A–D) improved the most obviously. There were certain improvements in the central and northwest regions (E–G) with the nudging scheme. The performance of the nudging schemes in Tibet (H) was substantially negative. When uv was nudged, the 500 or 1,000 km cutoff wavelength greatly improved the simulated surface meteorological fields. Specifically, the 500 km cutoff wavelength exhibited the best simulation performance in all subregions except South China (D) and Eastern Northwest China (E). The performance of the 1,000 km cutoff wavelength was slightly better in South China (D) and Eastern Northwest China (E). As the cutoff wavelength increased, the improvement gradually weakened and even worsened in all subregions, particularly in Tibet (H). For nudging θ, when the cutoff wavelength was taken as 1,000–2,000 km, the simulations performed well in most subregions. Increasing or decreasing the cutoff wavelength decreased the RATE relative to the optimal value. For every cutoff wavelength, the RATE in Tibet (H) was negative and the variation of the RATE with the cutoff wavelength showed the opposite pattern as those in the other subregions. The highest RATE values occurred when the cutoff wavelength was 2,500 km, and the lowest RATE values occurred when the wavelength was 2,000 km in Tibet (H). When ph was nudged, the improvements (both below 12%) in the simulated meteorological fields were smaller than those achieved by nudging uv or θ. The 1,000 km cutoff wavelength resulted in great improvement in most subregions. The optimal cutoff wavelength was significantly different among the different subregions. In addition, a monotonic relationship did not exist between the RATE and the cutoff wavelength for ph.
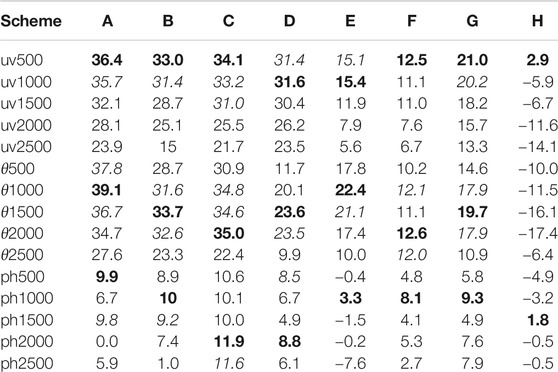
TABLE 2. Mean improvement rate (RATE) (%) of simulated surface meteorological fields under different cutoff wavelengths with nudging single variables in summer 2009 (bold type indicates the optimal RATE in a given subregion, and italic values indicate the schemes with RATE values greater than 90% of the optimal RATE).
Figure 4 illustrates the ME of simulated surface meteorological fields from Groups 1 and 2. For precipitation (Figures 4A–C), the simulations from both spectral nudging and CTL were too wet in most areas. Compared with CTL, most nudging experiments reduced the precipitation deviation. Among them, nudging θ, especially when the shorter cutoff wavelength was set, greatly inhibited the deviation. The precipitation deviation was the smallest in Western Northwest China (F). In fact, this is also the region with the least annual precipitation over mainland China. For the 2 m temperature (Figures 4D–F), the simulation of CTL was warmer in Northeast China (A), North China (B), East China (C), and Northwest China (E–F) and colder in the other subregions. In particular, the simulated cold deviation reached 4 K in Tibet (H). Nudging uv or ph made little improvement in the deviation of the simulated temperature, whereas nudging θ effectively reduced the deviation in most subregions. In all experiments, the simulated surface wind had positive ME, and the ME was reduced to some extent after the nudging schemes were implemented (Figures 4G–I). In detail, nudging uv obviously minimized the ME the most, followed by nudging θ and nudging ph. Unlike in the 2 m temperature simulation, the simulated relative humidity of the CTL exhibited a positive bias in South China (D), Southwest China (G), and Tibet (H) and a negative bias in the other subregions (Figures 4J–L). Spectral nudging had a certain ability to reduce the simulated deviation in some subregions.
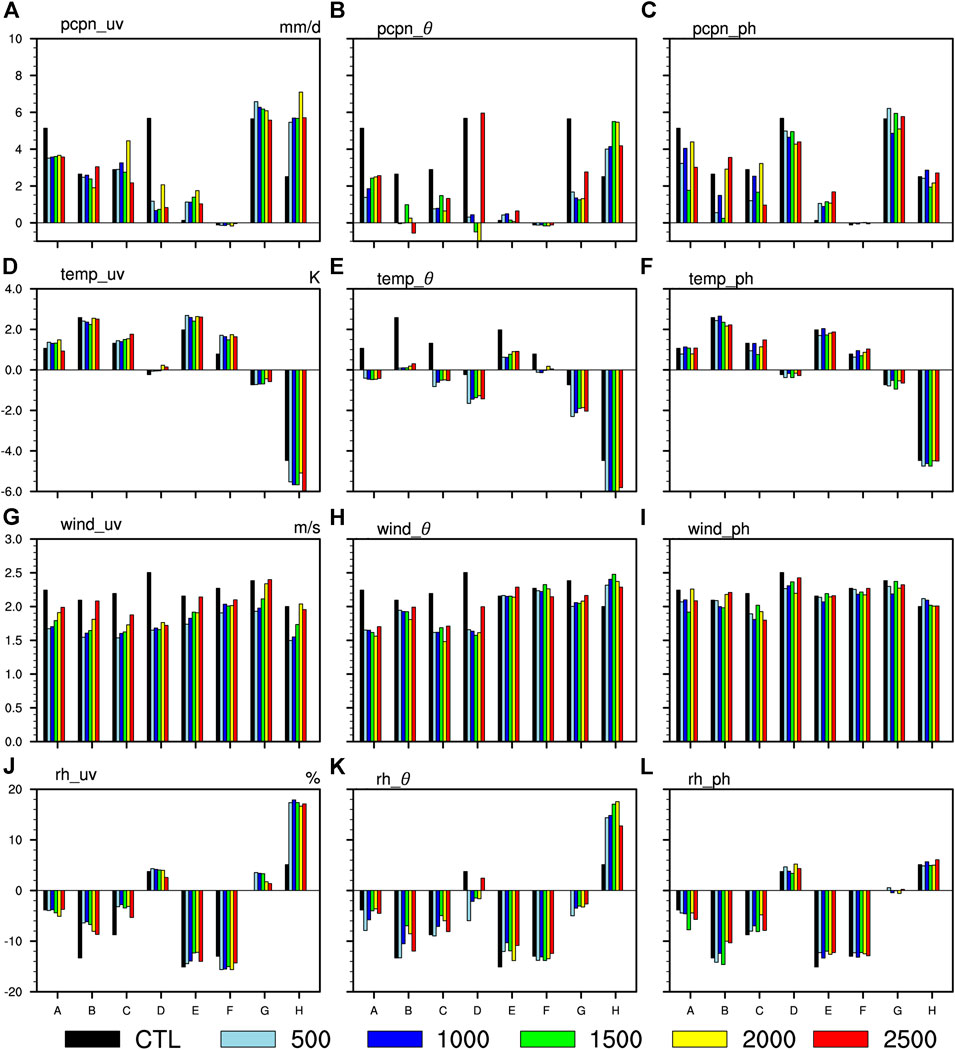
FIGURE 4. Mean error (ME) of simulated surface meteorological fields under different cutoff wavelengths: (A–C) simulated precipitation with nudging uv, θ, and ph, respectively; (D–F) 2 m temperature; (G–I) 10 m wind speed; (J–L) 2 m relative humidity.
The CC between the simulated 2 m relative humidity and the observed values indicated that the correlation was low without spectral nudging and could not pass a significance t-test at the 0.1% level in most subregions (Figure 5). With uv or θ nudged, the correlation increased greatly and could pass the significance test at a high confidence level in nearly all subregions. For the CC, the suitable cutoff wavelength for nudging uv or θ in the different subregions was the same as that in Table 2 (500 or 1,000 km for uv and 1,000–2,000 km for θ). When ph was nudged, the improvement in the CC was not significant. The CCs for the other surface meteorological field simulations showed similar results (not shown). The correlation of simulated meteorological fields to observational data was significantly improved with spectral nudging, especially with uv or θ nudged, and passed the t-test with a 99.9% confidence level in most subregions.
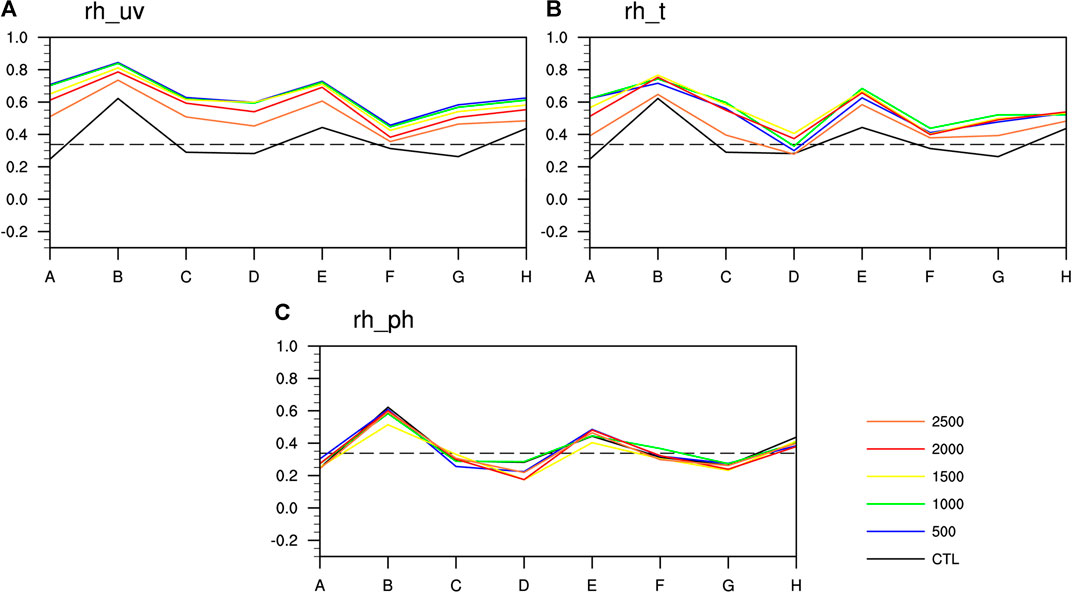
FIGURE 5. Correlation coefficient (CC) of simulated 2 m relative humidity under different cutoff wavelengths (black dashed line indicates a CC threshold of 0.1% significance according to t-test): (A) nudging uv; (B) nudging θ; (C) nudging ph.
Although spectral nudging only worked above the PBL, it could impact surface simulations. In the eastern region (A–D), nudging had a more obvious improvement effect. The terrain is relatively flat in this area. But, the improvement from nudging decreased significantly in western region (E–G) where the topography is complex. It was hard to see positive improvement in Tibet (H) especially. Because the spectral nudging technique only relaxes the large scales, its effects for surface fields are limited by the complex topography.
Upper-Air Meteorological Field Simulation Analysis
Different schemes were also compared in the simulations of upper-air meteorological fields. Table 3 indicates the RATE of the simulated geopotential height, temperature, relative humidity, and wind speed at all standard pressure layers. Consistent with the simulations of the surface meteorological fields, nudging uv or θ resulted in better performance. The simulated meteorological fields improved slightly when ph was nudged, and the RATE was less than 5% in most subregions. For the simulated subregions, the improvement from spectral nudging in the eastern region (A–D) was significantly greater than that in the western region (E–H). For the varying cutoff wavelengths, 500 or 1,000 km still performed well in the simulation of meteorological fields when uv was nudged, and the optimal wavelength was 500 km over mainland China. With increasing cutoff wavelength, the effects of the nudging technique as well as the improvement in the simulated meteorological fields weakened. When θ was nudged, there were very small differences in the RATE for 500–2,000 km cutoff wavelengths. The 1,000 km cutoff wavelength resulted in the best performance for Northeast China (A), Northwest China (F), and Tibet (H), and 500 km was slightly better for the other subregions. When ph was nudged, the suitable cutoff wavelength was 1,000 km in all subregions. Unlike in the simulation of surface meteorological fields, the application of nudging had obvious advantages for the simulations at standard layers in Tibet (H).
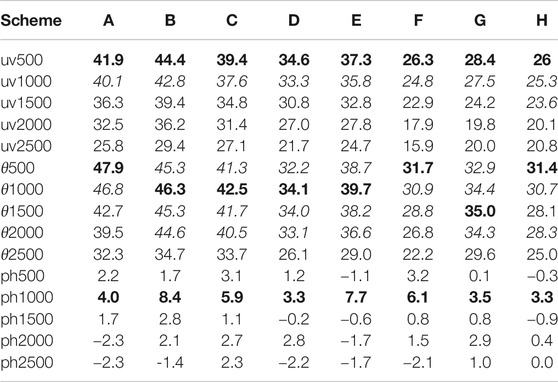
TABLE 3. Same as Table 2, except for simulated meteorological fields at standard pressure layers.
Based on the RATE of the simulated meteorological fields at different standard layers (Figure 6), the results generally conform to the conclusions in Table 3. The simulated upper-air meteorological fields were obviously improved by nudging θ or uv and improved less by nudging ph. Except at the surface and top of the model, the simulations of the meteorological fields improved significantly. In particular, the performance at the model surface was obviously worse than that at other levels, which may be related to the lack of direct constraints on nudged variables within the PBL. When uv or θ was nudged, all cutoff wavelengths improved the simulation, and 500 or 1,000 km provided the best performance. As the cutoff wavelength increased, the improvement weakened. When ph was nudged, the 1,000 km cutoff wavelength had an obvious advantage. When other cutoff wavelengths were set, the RATE of simulated meteorological fields was approximately 0% and even became negative for some subregions or levels. For every nudged variable, spectral nudging performed poorly when the cutoff wavelength was 2,500 km.
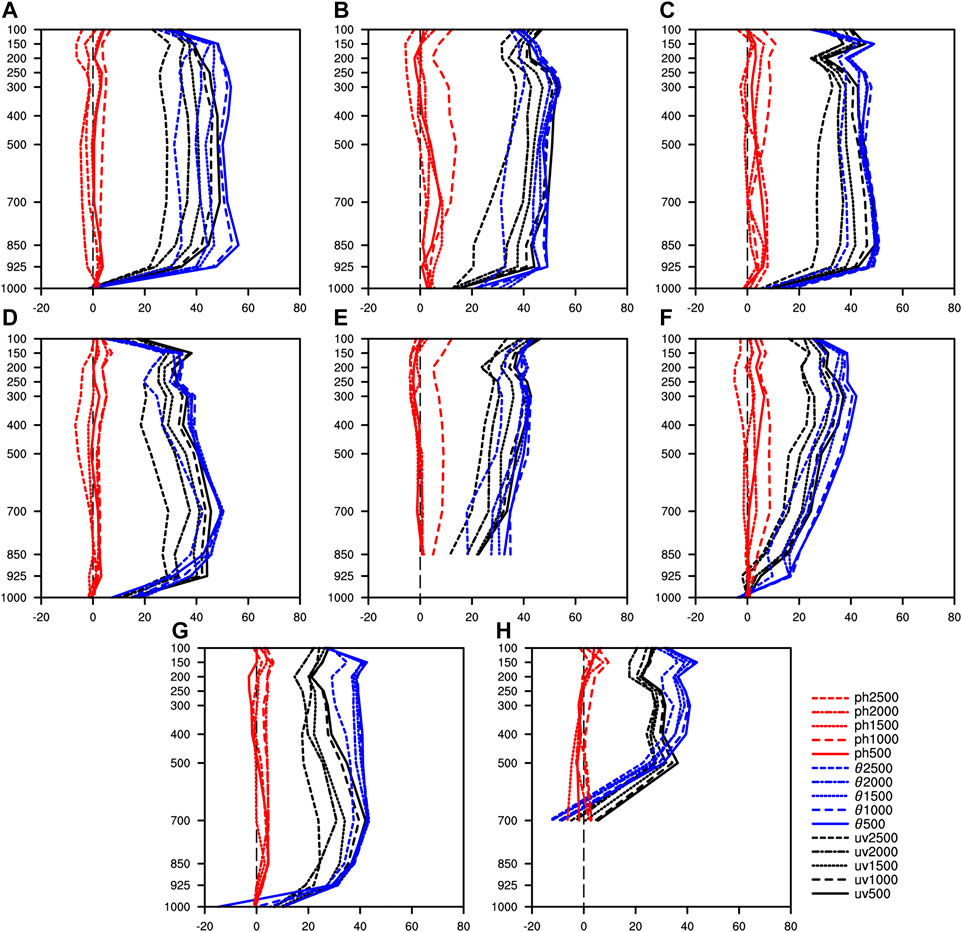
FIGURE 6. Variation in the RATE (%) of simulated meteorological fields at standard vertical levels (hPa) under different cutoff wavelengths: (A) Northeast China; (B) North China; (C) East China; (D) South China; (E) East of Northwest China; (F) West of Northwest China; (G) Southwest China; (H) Tibet.
The ME of the simulated meteorological fields at standard layers in the different experiments was also analyzed (not shown). The geopotential height in the CTL was higher at high levels and lower at low levels. With the nudging schemes adopted, the negative deviation at low levels was effectively limited. For temperature and wind speed, nudging also obviously reduced the simulated deviation at each standard layer. The nudging scheme had little effect on the deviation of relative humidity.
Comparing the CCs between the simulated and observed meteorological fields at each standard layer (not shown), the meteorological fields simulated by CTL had relatively high correlations with the observations in most subregions, and they were further improved after nudging was adopted, particularly when uv or θ was nudged. Except for the simulation of some meteorological fields at 1,000 and 925 hPa, the other nudging experiment results passed the 0.1% significance t-test.
With less affection from topography, the improvements of upper-air fields were more obviously for all subregions. Overall, considering the meteorological fields near the surface and at standard pressure layers together, nudging θ improved the simulation the most, followed by nudging uv, and nudging ph improved the simulation the least. The simulation of meteorological fields in the eastern region (A–D) improved more than that in the western region (E–H). The use of nudging in Tibet (H) required special attention and was likely to have a negative effect. Very good simulation performance was achieved when the cutoff wavelengths were 500 or 1,000 km for nudging uv, 500–2,000 km for nudging θ, and 1,000 km for nudging ph. The cutoff wavelength of 2,500 km consistently provided the worst results for each nudged variable.
The simulation of surface and upper-air meteorological fields is closely related. For example, in South China (D), the summer climate is dominated by the monsoon circulation, and the precipitation was severely overestimated in the CTL simulation. We analyzed the ME of the geopotential height, wind field, and relative humidity at 700 hPa for CTL and nudging-θ experiments (not shown). A cyclonic bias with strong northerly winds that produced more precipitation and lowered the surface temperature was evident over South China (D) in CTL. In the nudging experiments, especially with 500 or 1,000 km cutoff wavelengths, the biases from geopotential height and wind fields were reduced, which resulted in a more realistic monsoon circulation. Better circulation improved the model's simulation of monsoon rainfall. Moreover, all the experiments showed negative MEs for humidity, and even in the nudging experiments, the dry bias increased. Lower humidity could further restrain the summer convection, reducing simulated precipitation.
Sensitivity Analysis to Cutoff Wavelength for Nudging Multiple Variables
According to the results provided in the first two sections, nudging uv, θ, or ph could improve the simulation of meteorological fields in most subregions; thus, all three variables should be considered when choosing nudged variables. The previous sections also discussed the suitable cutoff wavelength for each nudged variable. However, WRF can use only one cutoff wavelength for all nudged variables. Therefore, sensitivity experiments with different cutoff wavelengths and nudging all variables are discussed in Results. The simulated results are evaluated to obtain the optimal cutoff wavelength setting for nudging all variables.
Surface Meteorological Field Simulation Analysis
The RATE of surface meteorological field simulations under different cutoff wavelengths was analyzed, and the results are shown in Table 4. The nudging performance in the eastern region (A–D) was still better than that in the western region (E–H). Compared with that obtained by nudging single variables (Table 2), the simulation of surface meteorological fields improved more significantly when all variables were nudged, except in Tibet (H). Among the different cutoff wavelength settings, the simulation of surface meteorological fields improved greatly when the cutoff wavelength was 500–1,500 km in most subregions. As the cutoff wavelength increased, the improvement was reduced. Specifically, 500 km was the optimal cutoff wavelength for Northeast China (A), Northwest China (E–F), and Southwest China (G), while 1,000 km cutoff wavelength was slightly better for East China (C) and South China (D). In North China (B), the simulated results were improved equally by the 500 and 1,000 km cutoff wavelengths. Moreover, nudging was still not recommended in Tibet (H).

TABLE 4. RATE (%) of the simulated surface meteorological fields under different cutoff wavelengths with nudging all variables in summer 2009 (bold type indicates the optimal RATE in a given subregion, and italic values indicate the schemes with RATE values greater than 90% of the optimal RATE).
Figure 7 displays the ME of the surface meteorological field simulation when all variables were nudged. Most experiments had a positive bias in the simulated precipitation. The application of nudging significantly reduced the wet deviation, except in Northwest China (E–F) and Tibet (H). Compared with nudging single variables, nudging all the variables reduced the simulated deviation more significantly. For the 2 m temperature, the ME trend and spatial distribution of nudging all variables were similar to those of nudging θ. All schemes simulated a stronger 10 m wind speed, and nudging all variables reduced the deviation more than nudging single variables. For the 2 m relative humidity, the differences between nudging all the variables and single variables were very small.
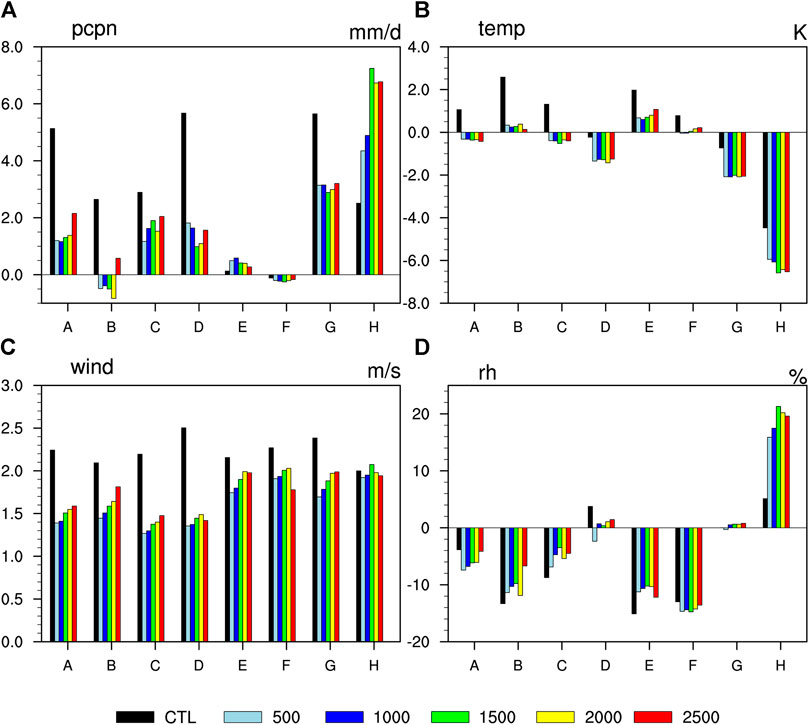
FIGURE 7. Mean error of simulated surface meteorological fields with nudging all variables under different cutoff wavelengths: (A) precipitation; (B) 2 m temperature; (C) 10 m wind speed; (D) 2 m relative humidity.
For the CCs between the simulated and observed surface meteorological fields, nudging all variables improved the correlation of relative humidity more significantly (Figure 8) than both CTL and nudging single variables (Figure 5). Among the different cutoff wavelengths, 1,000 km wavelength provided the best performance. The correlations of other meteorological field simulations showed similar results (not shown), further illustrating the advantage of nudging all variables.
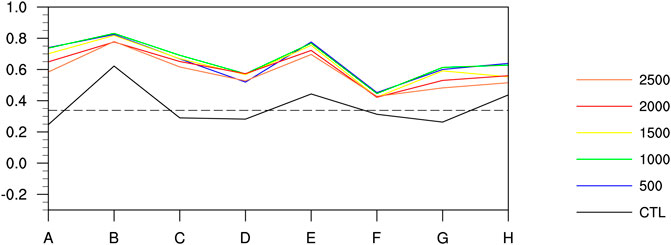
FIGURE 8. Correlation coefficient (CC) of simulated 2 m relative humidity with nudging all variables under different cutoff wavelengths (black dashed line indicates a CC threshold of 0.1% significance based on a t-test).
Upper-Air Meteorological Field Simulation Analysis
The RATE of the simulated meteorological fields at all standard pressure layers with different cutoff wavelengths were analyzed when all variables were assimilated (not shown). With the use of nudging, the simulation of meteorological fields at standard layers was obviously improved, and most RATE values were above 40%. Compared with nudging single variables (Table 3), nudging all variables was more effective at improving the simulation. It created dynamically consistent analysis and forecast. The errors caused by nudging single variables were restrained. The simulated meteorological fields in the eastern region (A–D) improved more significantly when adopting nudging. For the cutoff wavelength setting, 500–1,500 km wavelengths provided good simulation results. In particular, the meteorological fields at standard layers were simulated best for a cutoff wavelength of 1,000 km in South China (D) and Southwest China (G) and 500 km in other subregions.
According to the vertical profile of the RATE (Figure 9), the results were basically consistent with the conclusions obtained from the RATE values at all standard pressure layers. 500 and 1,000 km cutoff wavelengths had obvious advantages, and 2,500 km cutoff wavelength was the worst choice. Compared with the results from nudging single variables (Figure 5), there was a great improvement in each subregion when all variables were nudged. By analyzing the CCs between the simulations and observations at standard layers (not shown), we could also conclude that nudging all variables performed better than CTL and nudging single variables, especially at midlevels.
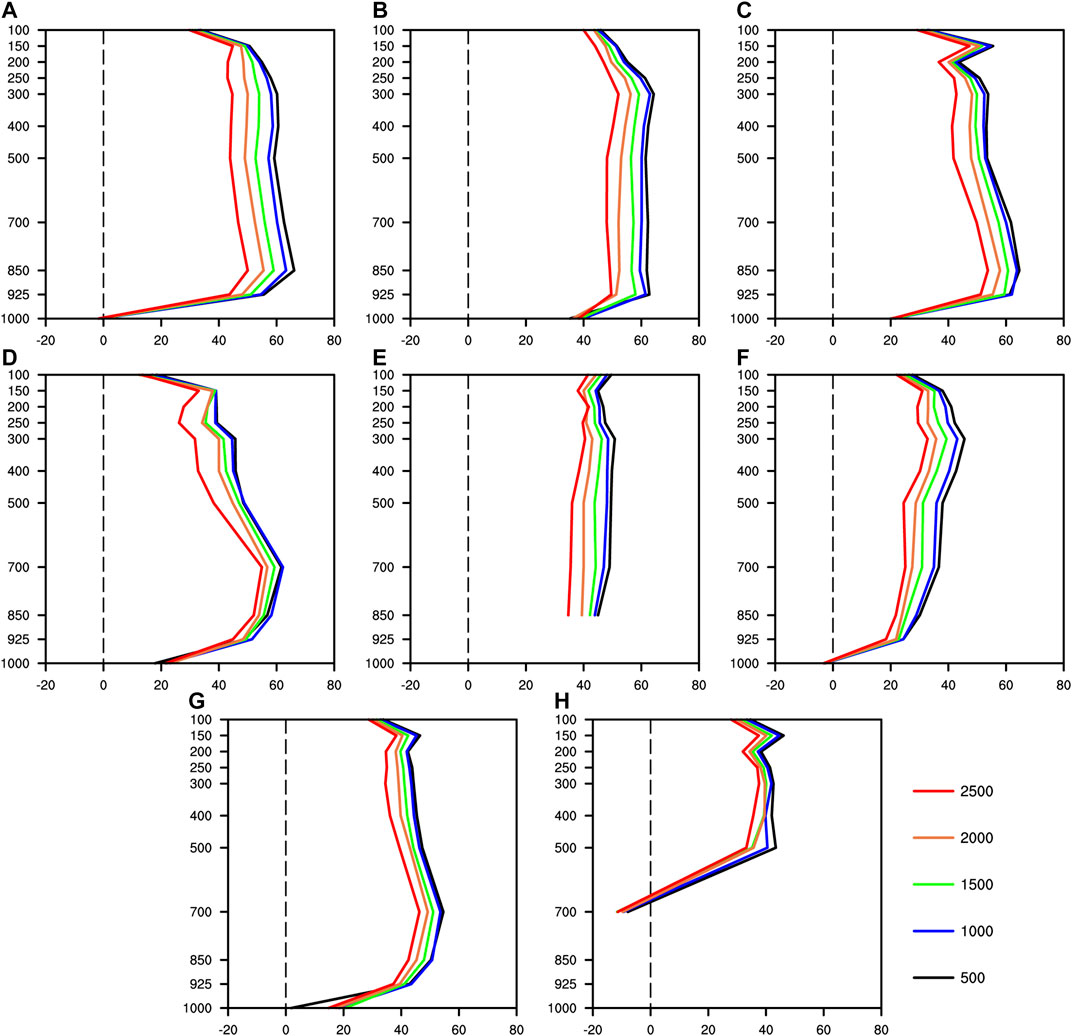
FIGURE 9. Variation in RATE (%) of simulated meteorological fields at standard vertical level (hPa) under different cutoff wavelengths when all variables are nudged: (A) Northeast China; (B) North China; (C) East China; (D) South China; (E) East of Northwest China; (F) West of Northwest China; (G) Southwest China; (H) Tibet.
In general, considering the meteorological fields near the surface and at standard pressure layers together, when all variables were nudged, the simulated meteorological fields in the eastern region (A–D) were improved more significantly than those in the western region (E–H), and the simulation at mid-levels was improved more significantly than that at low and upper levels. Compared with nudging single variables, nudging all variables provided better performance. For the cutoff wavelength settings, 500–1,500 km wavelengths greatly improved the simulated surface and upper-air meteorological fields over mainland China, and the results at 1,000 km wavelength were particularly good. 1,000 km is the typical spatial scale for the synoptic system. The performance was poorest when the cutoff wavelength was 2,500 km. The cutoff wavelengths suitable for each subregion can be found in Table 4. Notably, for the simulation of surface meteorological fields in Tibet (H), neither nudging all variables nor nudging single variables is recommended.
Verification of the Optimum Nudging Scheme
To ensure the reliability of the previously obtained appropriate nudging parameter strategies, the same nudging experiments were also performed and analyzed for summer 2010. The RATE results for nudging single variables are shown in Tables 5, 6.
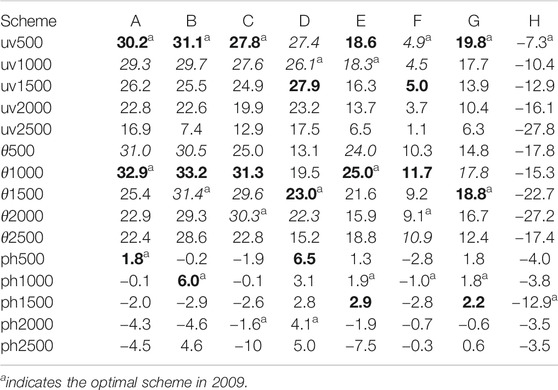
TABLE 5. Same as Table 2, except for summer 2010.
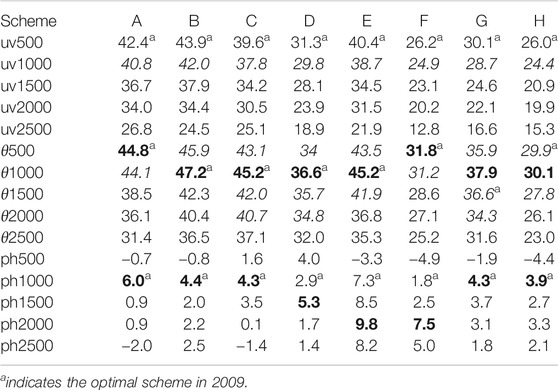
TABLE 6. Same as Table 3, except for summer 2010.
For the surface meteorological fields (Table 5), similar to the simulated results in summer 2009 (Table 2), nudging θ improved the simulation the most and nudging ph improved the simulation the least. The simulated meteorological fields in the eastern region (A–D) improved more than those in the central and northwestern regions (E–G). Regardless of the cutoff wavelength, the improvement was negative in Tibet (H). Among the three nudged variables, the nudging strategies were applicable when uv or θ was nudged, but the applicability decreased when ph was nudged. Moreover, the RATE from nudging ph in 2010 was worse than the results from 2009. As a whole, in summer 2010, the optimal cutoff wavelength was 500 or 1,000 km for nudging uv and 1,000 or 1,500 km for nudging θ. A single optimal cutoff wavelength could not be determined for nudging ph due to the different RATE performances in various subregions.
Comparing the RATEs of the upper-air meteorological field simulations for 2010 and 2009 (Table 6 vs. Table 3), the cutoff wavelengths that resulted in an obvious improvement were substantially consistent for every nudged variable in each subregion. Over mainland China, the suitable cutoff wavelength for nudging uv was still 500 or 1,000 km, that for nudging θ was 500–1,500 km, and that for nudging ph was 1,000 km in summer 2010. These results mean that, at standard pressure layers, the optimal nudging parameter settings remained stable in different years.
Overall, the appropriate nudging settings in 2010 and 2009 were similar. Specifically, the nudging scheme was more applicable to simulating meteorological fields at standard layers than to simulating surface meteorological fields, and the applicability of nudging uv or θ was stronger than that of nudging ph. The suitable cutoff wavelengths were still 500 or 1,000 km for nudging uv, 1,000 or 1,500 km for nudging θ, and 1,000 km for nudging ph over mainland China in summer 2010.
Conclusion and Discussion
In this study, 37 experiments were conducted to analyze the spectral nudging parameter settings for summer climate simulations over mainland China. First, the impacts of different nudged variables on the downscaling simulation of surface and 500 hPa meteorological fields in summer 2009 were compared. Then, combined with the observations, the simulated results for meteorological fields near the surface and at standard pressure layers with different cutoff wavelengths and nudged variables were evaluated. Thus, we provided suitable cutoff wavelengths for every subregion and nudged variable. Considering that only one cutoff wavelength could be set for nudging multiple variables, sensitivity experiments with different cutoff wavelengths were carried out again after selecting the appropriate nudged variables.
Nudging the horizontal wind (uv), potential temperature (θ), or geopotential height (ph) all influenced the simulation of surface and upper-air meteorological fields. Among the three nudged variables, the impacts of nudging uv and θ were significant. Specifically, uv had a greater impact on the simulation of the 10 m wind speed, 500 hPa geopotential height, and wind speed, whereas θ had a greater influence on the simulated 2 m temperature. Except for its strong impact on the simulated precipitation, nudging ph had a smaller influence on the other fields.
Furthermore, considering the improvements to the simulation of meteorological fields, the performance obtained by nudging θ was the best, followed by those obtained by nudging uv and nudging ph. The simulated meteorological fields in the eastern region (A–D) were improved more than those in the western region (E–H). For nudging uv, the best cutoff wavelength was 500–1,000 km. For nudging θ and ph, they were 1,000–2,000 and 1,000 km, respectively. Notably, spectral nudging is not recommended for the simulation of surface meteorological fields in Tibet (H). The simulation of upper-air meteorological fields was improved more obviously and consistently than the simulation of surface fields, which are affected by the complex underlying conditions and are therefore more difficult to simulate.
Nudging uv, θ, or ph improved the simulation of meteorological fields in most subregions; thus, all three variables should be considered when selecting nudged variables. Compared with nudging single variables, nudging all variables had obvious advantages, and greater improvements in simulated meteorological fields at different model levels were observed in nearly all subregions. The suitable cutoff wavelengths for nudging all variables were 500–1,500 km. 1,000 km wavelength is recommended because of its excellent performance in each subregion except Tibet (H). As shown in the experiment with nudging single variables, no nudging scheme could improve the simulated surface meteorological fields in Tibet (H), and the worst cutoff wavelength was 2,500 km.
Verification was performed in summer 2010, and the conclusions obtained in 2009 showed good applicability. For nudging single variables, the optimal cutoff wavelength was more consistent when uv or θ was nudged. At aboveground layers, the nudging scheme had better general applicability.
It is understandable that nudging uv or θ significantly influenced the simulation of surface and upper-air meteorological fields. Theoretically, nudging certain variable can affect other variables due to intervariable relationships imposed by the dynamics. For example, wind and temperature are coupled through the thermal wind balance. The thermal wind balance follows the hydrostatic balance and geostrophic balance, which is valid at scales larger than 1,000 km (Omrani et al., 2015). Therefore, nudging uv or θ directly affects the simulation of geopotential height and thus the synoptic-scale circulation. Furthermore, wind determines the transportation of all conserved quantities, especially moisture and heat. Although spectral nudging is switched off in the PBL, nudging uv or θ has the ability to improve model’s simulation of surface variables, which is influenced by local forcing as well as large-scale background fields. The reason for this performance is that the better representation of the large-scale horizontal wind or potential temperature impacts atmospheric circulation and large-scale background fields. Moreover, fine-scale process or local forcing can be preserved and developed under better large-scale circulation.
Omrani et al. (2015) reported that nudging ph had no discernible effect on the simulation of meteorological fields. Our study also concluded that nudging ph had a weak impact on other meteorological fields except for precipitation, which may be due to the negligible effect of nudging ph on the simulation of the geopotential height field. In fact, the geopotential height is strongly constrained by the potential temperature and surface pressure in the WRF (Omrani et al., 2015). As shown in Figure 3, nudging ph slightly influenced the 500 hPa geopotential height. Therefore, other meteorological fields could not be significantly adjusted. The strong effect on precipitation indicated its sensitivity to very small changes in circulation fields.
In comparisons with CTL, of the variables tested, nudging uv had the greatest influence on most analyzed simulations of meteorological fields. Comparing the simulated meteorological fields with the observed data showed that the simulations improved the most when θ was nudged. This result indicated that there were still some differences between FNL and the observed data and verified the conclusion from Wei et al. (2015). Specifically, the credibility of various reanalysis variables is different in China, and the reanalysis had a better ability to reproduce the summer average temperature. Compared with those in Eastern China (A–D), the improvements in Western China (E–H) were less. Especially for Tibet (H), spectral nudging had nearly a negative impact on the surface fields. This situation may be due to the low credibility of FNL in subregions with complicated terrain and sparse observation stations (Li et al., 2004; Zhao and Fu, 2006; Zhao and Fu, 2009).
Without nudging, warm temperature biases existed at nearly all vertical layers and subregions, which were associated with the strong geopotential height biases that increased in the upper levels. Considering the reasons for the consistent positive anomaly, it may have due to an atmospheric blocking situation artificially created by the model without nudging. Nudging greatly reduced the temperature bias at all levels, and the ME of 2 m temperature was even reduced to less than 1 K in Northeast China (A), North China (B), East China (C), and Northwest China (E–F) (Figure 7). Although the ME of the geopotential height was reduced, a residual bias persisted even when all possible variables were nudged. The reason is that the geopotential height is strongly constrained by the potential temperature and surface pressure in the WRF. Although the potential temperature was improved when nudging was used, the simulated performance of surface pressure was always poor whether using nudging or not (not shown). Removing this residual bias may require the nudging of surface pressure, which is unachievable with the WRF model.
Spectral nudging acts directly on large-scale fields and thus adjusts atmospheric circulations. If the large-scale circulations are determined, the performance of the spectral nudging scheme should be stable. The summer climate in China is controlled by several established circulation systems. Therefore, the conclusions obtained in summer 2009 and 2010 should also be applicable to other summers.
In our work, for the specific simulated domain and physical options, the numerical experiments with varying spectral nudging parameters were carried out in summer 2009 and 2010. Different simulated seasons, model configurations (region, resolution, physical options, and so on), and even validation data may affect the performance of nudging schemes. The suitable nudging parameter settings recommended by this study may not always yield the best simulation results. Therefore, further research is needed to verify the effects of spectral nudging parameter settings with other model configurations and simulated seasons. In previous work (Mai et al., 2017), research on more effective setting for grid nudging parameters was performed. Our next step involves establishing how to select grid nudging or spectral nudging as the assimilation method for dynamical downscaling simulations over mainland China.
Data Availability Statement
The raw data supporting the conclusions of this article will be made available by the authors, without undue reservation.
Author Contributions
XM was involved throughout the research, analysis, and manuscript process. XQ helped to analyze and interpret the results and reviewed and revised the manuscript. YY developed the concept for the manuscript and provided ongoing manuscript feedback. YM provided insight and feedback in the analysis process.
Funding
This work was supported by the National Nature Science Foundation of China (41675098 and 41905013), Nature Science Foundation of Tianjin, China (17JCQNJC08200 and 16JCYBJC21500), Key Foundation of Tianjin Meteorology Service, China (202002zdxm01), and the CAS “Light of West China” Program.
Conflict of Interest
The authors declare that the research was conducted in the absence of any commercial or financial relationships that could be construed as a potential conflict of interest.
Acknowledgments
The authors acknowledge the Mesoscale and Microscale Meteorology Laboratory of National Center for Atmospheric Research (NCAR) for providing the WRF model. They also thank the computing resource support of the National Supercomputer Center in Tianjin, China.
References
Ai, W., Sun, L., and Song, W. (2010). Ocean and atmospheric circulation anomalies in 2009 and their impacts on climate in China. Meteorol. Mon. 36 (4), 101–105. doi:10.2118/159264-RU
Alexandru, A., Elia, R. D., Laprise, R., Separovic, L., and Biner, S. (2009). Sensitivity study of regional climate model simulations to large-scale nudging parameters. Mon. Weather Rev. 137 (5), 1666–1686. doi:10.1175/2008MWR2620.1
Bao, Y., Lv, S., Zuo, H., and Hou, R. (2006). Application of regional climate model (RegCM3) in Northwest China II: sensitivity experiment for domain choice and cumulus convection parameterization. J. Glaciol. Geocryol. 28 (2), 175–182. doi:10.1016/S1003-6326(06)60040-X
Barstad, I., Sorteberg, A., Flatøy, F., and Déqué, M. (2009). Precipitation, temperature and wind in Norway: dynamical downscaling of ERA40. Clim. Dynam. 33 (6), 769–776. doi:10.1007/s00382-008-0476-5
Bowden, J. H., Nolte, C. G., Otte, T. L., and Otte, M. J. (2012). Examining interior grid nudging techniques using two-way nesting in the WRF model for regional climate modeling. J. Clim. 25 (8), 2805–2823. doi:10.1175/JCLI-D-11-00167.1
Bullock, O. R., Alapaty, K., Herwehe, J. A., Mallard, M. S., Otte, T. L., Gilliam, R. C., et al. (2013). An observation-based investigation of nudging in WRF for downscaling surface climate information to 12-km grid spacing. J. Appl. Meteorol. Climatol. 53 (1), 20–33. doi:10.1175/JAMC-D-13-030.1
Castro, C. L., Pielke, R. A., and Leoncini, G. (2005). Dynamical downscaling: assessment of value retained and added using the regional atmospheric modeling system (RAMS). J. Geophys. Res. Atmos. 110 (D5), 66. doi:10.1029/2004JD004721
Cha, D.-H., and Wang, Y. (2013). A dynamical initialization scheme for real-time forecasts of tropical cyclones using the WRF model. Mon. Weather Rev. 141 (3), 964–986. doi:10.1175/MWR-D-12-00077.1
Chen, F., and Dudhia, J. (2001). Coupling an advanced land surface–hydrology model with the Penn State–NCAR MM5 modeling system. Part I: model implementation and sensitivity. Mon. Weather Rev. 129 (4), 569–585. doi:10.1175/1520-0493(2001)129<0569:CAALSH>2.0.CO;2
Choi, S.-J., and Lee, D.-K. (2016). Impact of spectral nudging on the downscaling of tropical cyclones in regional climate simulations. Adv. Atmos. Sci. 33 (6), 730–742. doi:10.1007/s00376-016-5061-y
Collins, W. D., Rasch, P. J., Boville, B. A., Hack, J. J., McCaa, J. R., Williamson, D. L., et al. (2004). NCAR Technical Note. NCAR/TN-464+ STR 226. Description of the NCAR community atmosphere model (CAM 3.0). Available at: http://www.cesm.ucar.edu/models/atm-cam/docs/description/description.pdf (Accessed June 2004).
Ding, Y., Shi, X., Liu, Y., Liu, Y., Li, Q., Qian, Y., et al. (2006). Multi-year simulations and experimental seasonal predictions for rainy seasons in China by using a nested regional climate model (RegCM_NCC). Part I: sensitivity study. Adv. Atmos. Sci. 23 (3), 323–341. doi:10.1007/s00376-006-0323-8
Feser, F., Rockel, B., Von Storch, H., Winterfeldt, J., and Zahn, M. (2011). Regional climate models add value to global model data: a review and selected examples. Bull. Am. Meteorol. Soc. 92 (9), 1181–1192. doi:10.1175/2011BAMS3061.1
Fu, C., and Zheng, Z. (1998). Monsoon regions: the highest rate of precipitation changesobserved from global data. Chin. Sci. Bull. 43 (8), 662–663. doi:10.1007/BF02883571
Gao, X., Shi, Y., Zhang, D., and Giorgi, F. (2012). Climate change in China in the 21st century as simulated by a high resolution regional climate model. Chin. Sci. Bull. 57 (10), 1188–1195. doi:10.1007/s11434-011-4935-8
Gao, X. J., Ying, X. U., Zhao, Z. C., and Jeremy, (2006). Impacts of horizontal resolution and topography on the numerical simulation of East Asian precipitation. Chin. J. Atmos. Sci. 30 (2), 185–192. doi:10.1016/S1003-6326(06)60040-X
Giorgi, F., and Shields, C. (1999). Tests of precipitation parameterizations available in latest version of NCAR regional climate model (RegCM) over continental. J. Geophys. Res. Atmos. 104 (D6), 6353–6375. doi:10.1029/98JD01164
Gu, H., Jin, J., Wu, Y., Ek, M. B., and Subin, Z. M. (2015). Calibration and validation of lake surface temperature simulations with the coupled WRF-lake model. Climat. Change. 129 (3–4), 471–483. doi:10.1007/s10584-013-0978-y
Hong, S.-Y., Noh, Y., and Dudhia, J. (2006). A new vertical diffusion package with an explicit treatment of entrainment processes. Mon. Weather Rev. 134 (9), 2318–2341. doi:10.1175/MWR3199.1
Hu, H., Hu, Y., Zhong, Z., and Zhu, Y. (2015). Double nested dynamical downscaling research on summer precipitation over China with WRF model. J. Meteorol. Sci. 70, 1278–1290. doi:10.1175/JAS-D-12-0155.1
Hui, P., Tang, J., Wang, S., Wu, J., and Kang, Y. (2015). Future climate projection under IPCC A1B scenario in the source region of yellow river with complex topography using RegCM3. J. Geophys. Res. Atmos. 119 (19), 11,205–11222. doi:10.1002/2014JD021992
IPCC (2013). Climate change: the physical science basis. Available at: https://www.ipcc.ch/site/assets/uploads/2018/03/WG1AR5_SummaryVolume_FINAL.pdf (Accessed September 2013).
Jia, X., Chen, L., Gong, Z., Wang, Z., Yuan, Y., and Sun, C. (2011). Anomalies of ocean and atmospheric circulation in 2010 and their impacts on climate in China. Meteorol. Mon. 37 (004), 446–453. doi:10.1536/ihj.52.153
Jimenez, P. A., Dudhia, J., Gonzalez-Rouco, J. F., Navarro, J., Montavez, J. P., and Garcia-Bustamante, E. (2012). A revised scheme for the WRF surface layer formulation. Mon. Weather Rev. 140 (3), 898–918. doi:10.1175/MWR-D-11-00056.1
Kain, J. S. (2004). The Kain–Fritsch convective parameterization: an update. J. Appl. Meteorol. 43 (1), 170–181. doi:10.1175/1520-0450(2004)043<0170:TKCPAU>2.0.CO;2
Kong, X., and Bi, X. (2016). Simulation of temperature and precipitation during the last 100 years over southern China by a regional climate model. Clim. Environ. Res. 21 (6), 711–724. doi:10.3878/j.issn.1006-9585.2016.16079
Lee, D.-K., Cha, D.-H., and Kang, H.-S. (2004). Regional climate simulation of the 1998 summer flood over East Asia. J. Meteorol. Soc. Japn. Ser. II 82 (6), 1735–1753. doi:10.2151/jmsj.82.1735
Leung, L. R., Mearns, L. O., Giorgi, F., and Wilby, R. L. (2003). Regional climate research: needs and opportunities. Bull. Am. Meteorol. Soc. 84 (1), 89–95. doi:10.1175/BAMS-84-1-89
Li, C., Zhang, T. J., and Chen, J. (2004). Climatic change of Qinghai-Xizang Plateau region in recent 40-year reanalysis and surface observation data–contrast of observational data and NCEP, ECMWF surface air temperature and precipitation. Plateau MeteorologyMeteorol. 23 (1), 97–103. doi:10.3321/j.issn:1000-0534.2004.z1.016
Lim, K.-S. S., and Hong, S.-Y. (2010). Development of an effective double-moment cloud microphysics scheme with prognostic cloud condensation nuclei (CCN) for weather and climate models. Mon. Weather Rev. 138 (5), 1587–1612. doi:10.1175/2009MWR2968.1
Liu, P., Qiu, X., Yang, Y., Ma, Y., and Jin, S. (2018). Assessment of the performance of three dynamical climate downscaling methods using different land surface information over China. Atmosphere 9 (3), 101. doi:10.3390/atmos9030101
Liu, Y., and Ding, Y. (2001). Modified mass flux cumulus parameterization scheme and its simulation experiment. Part I: mass flux scheme and its simulation of the flooding in 1991. Acta Meteorol. Sin. 59, 10–22. doi:CNKI:SUN:QXXB.0.2001-01-001
Lo, J. C.-F., Yang, Z.-L., and Pielke, R. A. (2008). Assessment of three dynamical climate downscaling methods using the weather research and forecasting (WRF) model. J. Geophys. Res. 113 (D9), D09112. doi:10.1029/2007jd009216
Ma, Y., Yang, Y., Mai, X., Qiu, C., Long, X., and Wang, C. (2016). Comparison of analysis and spectral nudging techniques for dynamical downscaling with the WRF model over China. Adv. Meteorol. 2016 (2–3), 1–16. doi:10.1155/2016/4761513
Mai, X., Ma, Y., Yang, Y., Li, D., and Qiu, X. (2017). Impact of grid nudging parameters on dynamical downscaling during summer over mainland China. Atmosphere 8 (10), 184. doi:10.3390/atmos8100184
Miguez-Macho, G., Stenchikov, G. L., and Robock, A. (2004). Spectral nudging to eliminate the effects of domain position and geometry in regional climate model simulations. J. Geophys. Res. Atmos. 109 (D13). doi:10.1029/2003JD004495
Miguez-Macho, G., Stenchikov, G. L., and Robock, A. (2005). Regional climate simulations over North America: interaction of local processes with improved large-scale flow. J. Clim. 18 (8), 1227–1246. doi:10.1175/JCLI3369.1
Oleson, K. W., Lawrence, D. M., Gordon, B., Flanner, M. G., Kluzek, E., Peter, J., et al. (2010). Technical description of version 4.0 of the community land model (CLM). Available at: (Accessed April 2010).
Omrani, H., Drobinski, P., and Dubos, T. (2015). Using nudging to improve global-regional dynamic consistency in limited-area climate modeling: what should we nudge? Clim. Dynam. 44 (5–6), 1–18. doi:10.1007/s00382-014-2453-5
Otte, T. L., Nolte, C. G., Otte, M. J., and Bowden, J. H. (2012). Does nudging squelch the extremes in regional climate modeling? J. Clim. 25 (20), 7046–7066. doi:10.1175/JCLI-D-12-00048.1
Pan, J., Zhai, G., and Gao, K. (2002). Comparisons of three convection parameterization schemes in regional climate simulations. Chin. J. Atmos. Sci. 9, 246–254. doi:10.1080/16742834.2016.1172938
Pohl, B., and Crétat, J. (2014). On the use of nudging techniques for regional climate modeling: application for tropical convection. Clim. Dynam. 43 (5–6), 1693–1714. doi:10.1007/s00382-013-1994-3
Qian, Y., and Liu, H. (2001). On nesting area selection of regional climate models coupled to a global climate model. Chin. J. Atmos. Sci. 25 (4), 492–502. doi:10.3878/j.issn.1006-9895.2001.04.06
Radu, R., Déqué, M., and Somot, S. (2008). Spectral nudging in a spectral regional climate model. Tellus Dyn. Meteorol. Oceanogr. 60 (5), 898–910. doi:10.1111/j.1600-0870.2008.00341.x
Rockel, B. (2015). The regional downscaling approach: a brief history and recent advances. Curr. Clim. Chang. Rep. 1 (1), 22–29. doi:10.1007/s40641-014-0001-3
Rockel, B., Castro, C. L., Pielke, R. A., Storch, H. V., and Leoncini, G. (2008). Dynamical downscaling: assessment of model system dependent retained and added variability for two different regional climate models. J. Geophys. Res. Atmos. 113, (D21107. doi:10.1029/2007JD009461
Salameh, T., Drobinski, P., and Dubos, T. (2010). The effect of indiscriminate nudging time on large and small scales in regional climate modelling: application to the Mediterranean basin. Q. J. R. Meteorol. Soc. 136 (646), 170–182. doi:10.1002/qj.518
Separovic, L., Elía, R. D., and Laprise, R. (2012). Impact of spectral nudging and domain size in studies of RCM response to parameter modification. Clim. Dynam. 38 (7), 1325–1343. doi:10.1007/s00382-011-1072-7
Song, S., and Tang, J. P. (2011). An application of the spectral nudging technique to the simulation of summer precipitation over East Asia using a regional climate model: the impact of domain size and position. Acta Meteorol. Sin. 69 (2), 297–309. doi:10.11676/qxxb2011.025
Storch, H. V., Langenberg, H., and Feser, F. (2000). A spectral nudging technique for dynamical downscaling purposes. Mon. Weather Rev. 128 (10), 3664–3673. doi:10.1002/qj.1894
Tang, J., Niu, X., Wang, S., Gao, H., Wang, X., and Jian, W. (2016a). Statistical downscaling and dynamical downscaling of regional climate in China: present climate evaluations and future climate projections. J. Geophys. Res. Atmos. 121 (5), 2110–2129. doi:10.1002/2015JD023977
Tang, J., Song, S., and Wu, J. (2009). Impacts of the spectral nudging technique on simulation of the East Asian summer monsoon. Theor. Appl. Climatol. 101 (1–2), 41–51. doi:10.1007/s00704-009-0202-1
Tang, J., Wang, S., Niu, X., Hui, P., Zong, P., and Wang, X. (2016b). Impact of spectral nudging on regional climate simulation over CORDEX East Asia using WRF. Clim. Dynam. 48 (7–8), 2339–2357. doi:10.1007/s00382-016-3208-2
Waldron, K. M., Paegle, J., and Horel, J. D. (1996). Sensitivity of a spectrally filtered and nudged limited-area model to outer model options. Mon. Weather Rev. 124 (3), 529. doi:10.1175/1520-0493(1996)124<0529:SOASFA>2.0.CO;2
Wang, S., and Entao, Y. U. (2013). Dynamical downscaling simulation over China using the nested MIROC/WRF model. Clim. Environ. Res. 18 (6), 681–692. doi:10.3878/j.issn.1006-9585.2012.12068
Wang, Y., Leung, L. R., McGREGOR, J. L., Lee, D.-K., Wang, W.-C., Ding, Y., et al. (2004). Regional climate modeling: progress, challenges, and prospects. J. Meteorol. Soc. Japan. Ser. II. 82 (6), 1599–1628. doi:10.2151/jmsj.82.1599
Wei, F., Tang, J., and Wang, S. (2015). A reliability assessment of upper-level reanalysis datasets over China. Chin. J. Geophys. 58 (2), 383–397. doi:10.6038/cjg20150204
Zhao, J., Feng, G., Zhang, S., and Sun, S. (2011). Seasonal changes in China during recent 48 years and their relationship with temperature extremes. Acta Phys. Sin. 60, 099205. doi:10.7498/aps.60.099205
Zhao, T., and Fu, C. (2006). Preliminary comparison and analysis between ERA-40,NCEP-2 reanalysis and observations over China. Clim. Environ. Res. 11 (1), 14–32. doi:10.3878/j.issn.1006-9585.2006.01.02
Zhao, T., and Fu, C. (2009). Applicability evaluation for several reanalysis datasets using the upper-air observations over China. Chin. J. Atmos. Sci. 33 (3), 634–648. doi:CNKI:SUN:DQXK.0.2009-03-019
Zhao, Z., and Luo, Y. (1999). Investigations of application for the regional climate model over East Asia. Sci. Atmos. Sin. 5, 001. doi:10.3878/j.issn.1006-9895.1999.05.02
Keywords: spectral nudging, dynamical downscaling, weather research and forecasting model, nudged variable, cutoff wavelength
Citation: Mai X, Qiu X, Yang Y and Ma Y (2020) Impacts of Spectral Nudging Parameters on Dynamical Downscaling in Summer over Mainland China. Front. Earth Sci. 8:574754. doi: 10.3389/feart.2020.574754
Received: 21 June 2020; Accepted: 20 October 2020;
Published: 18 November 2020.
Edited by:
Jing-Jia Luo,Bureau of Meteorology, AustraliaReviewed by:
Ricardo de Camargo, University of São Paulo, BrazilRosa PoggianiDaoyi Gong, Beijing Normal University, China
Copyright © 2020 Mai, Qiu, Yang and Ma. This is an open-access article distributed under the terms of the Creative Commons Attribution License (CC BY). The use, distribution or reproduction in other forums is permitted, provided the original author(s) and the copyright owner(s) are credited and that the original publication in this journal is cited, in accordance with accepted academic practice. No use, distribution or reproduction is permitted which does not comply with these terms.
*Correspondence: Xiaobin Qiu, qiuxiaobin.tj@outlook.com, Yi Yang, yangyi@lzu.edu.cn