A New Approach Using Modeling to Interpret Measured Changes in Soil Organic Carbon in Forests; The Case of a 200 Year Pine Chronosequence on a Podzolic Soil in Scotland
 Rita Ražauskaitė
 Elena Vanguelova2
  Thomas Cornulier
 Pete Smith
 Jo U. Smith
- 1Institute of Biological and Environmental Sciences, University of Aberdeen, Aberdeen, United Kingdom
- 2Forest Research, Alice Holt Lodge, Farnham, United Kingdom
Scotland is continuing to afforest land in order to combat climate change, but the long-term capacity for carbon sequestration in forest soils is still uncertain. Here we present measurements that provide comparative estimates of soil organic carbon in grassland and forestry sites at steady state. We develop a new approach to interpret these values based on simulation of organic carbon turnover in soils that are accumulating carbon and use this to determine losses due to management operations associated with afforestation of grassland and deforestation/reforestation of forest stands. Soil organic carbon stock changes were studied in a >120 year-old Scots pine chronosequence and adjacent grassland sites on podzolic soils. Significant carbon accumulation was measured in the top organic soil horizons with forest age, while no changes were noted in the deeper mineral soil horizons. The simulations with the RothC-26.3 model revealed that pine forests on sandy soils could lose a significant amount of soil organic carbon through management operations. The lowest modeled stocks of soil organic carbon were not in the young sites (0–25 years old), but at 43 years since reforestation. Using measured data from our study site, the simulations of grassland afforestation suggested that accumulation of organic carbon under forest occurs mainly in the organic horizons, while the deeper sandy mineral soil horizons are likely to become depleted in organic carbon compared to grasslands. Our simulations suggest that afforestation of grasslands would increase overall soil carbon stocks but may deplete the more stable carbon pools in the deeper mineral horizons of the podzols.
Introduction
Soils have a key role in global carbon (C) cycling as they contain two times more C than the atmosphere (Smith et al., 2008). In forest ecosystems only 30% of C is situated above ground (Vanguelova et al., 2013). Soil studies are needed to build process based understanding on the changes in soil organic C (SOC) with land use and management, and in response to climatic conditions, that can be used for large scale simulations (Meir et al., 2006; Wiesmeier et al., 2019). Changes in SOC in forest systems are harder to investigate than in arable or grassland systems because management can affect deep soil layers and continue to change for decades to centuries (Hobbie et al., 2013; Poeplau and Don, 2013). A large body of scientific literature has focused on land use change from grassland to forests and vice versa (Nave et al., 2013; Bárcena et al., 2014), but less attention has been dedicated to comparison of SOC in grasslands and forest that have reached steady state (e.g., Buchholz et al., 2014). In addition, most soil inventories and modeling studies have investigated changes in the top soil and very few have investigated changes in SOC in the deep soil (Janssens et al., 2004; Smith et al., 2005; De Vos et al., 2015; Chen et al., 2019). There is a need for further quantification of the potential of forests at steady state and deeper in the soil profile to act as a store of SOC in comparison to common agricultural land uses.
Long term observations provide the most detailed and reliable information about management effects on forest SOC (Jandl et al., 2014). However, systematic, repeated forest soil surveys are rare due to the high financial costs and time required to provide substantial results (Richter et al., 2007; Smith et al., 2012). A “chronosequence” approach provides a way to overcome these issues by employing single observations across a gradient of ages in otherwise identical plots (Fukami and Wardle, 2005). This approach has been applied in a number of forest SOC studies in the UK and worldwide (Zerva et al., 2005; Benham et al., 2012; Reidy and Bolger, 2013; Ashwood et al., 2019; Bastin et al., 2019; Vanguelova et al., 2019). The main challenge in applying this method lays in the identification of sufficiently similar plots (Jandl et al., 2014).
In Scotland, it is especially challenging to find woodlands that have not been converted to other land use types as, at the start of the twentieth century, forest cover was reduced to <5% (Smout, 2003). The largest ancient Scottish woodlands are in the Scottish Highlands and are comprised mainly of the native Scots pine (Pinus sylvestris) (Summers et al., 1999), which is the only naturally occurring commercial conifer species in the UK (Forest Research, 2018). The current major productive conifer species, Sitka spruce (Picea sitchensis), shows less tolerance to projected future climatic conditions for Scotland, so Scots pine could be the best choice for future forest restocking (Mason et al., 2011). The Scottish government has announced plans to increase forest cover to 21% by year 2032 and plant 3,000–5,000 ha of native species forest every year (The Scottish Government, 2019); Scots pine is likely to be one of the main species used for this afforestation.
The Scottish government was committed to reducing greenhouse gas (GHG) emissions by 42% by the year 2020 compared to the baseline year, 1990 (Scotland, 2009) and has exceeded this target, already reducing emissions by 47% in 2019 (Committee on Climate Change, 2019). Currently, the forestry sector is the only land use that delivers consistently negative GHG emissions (The Scottish Government, 2018). Therefore, it is very important to account for all GHG emissions as well as SOC sequestration in this sector. Current forest C balances involve extensive forest above-ground growth simulations, but until recently, estimates of changes in soil C have been based on simplistic models and there have been limited efforts to improve the representation of the soil C dynamics (Brown et al., 2019).
Forest soil heterogeneity is substantial, and large scale soil C stock assessments are very labor intensive (Härkönen et al., 2011). Currently, forest soils in Scotland are monitored on a 10 km grid and 25% of forest plots (179 out of total 721 plots) were revisited from 2007 to 2009 after ~25 years (Chapman et al., 2013). Current resurvey by the Scottish Soil Survey of 39 conifer sites which have been afforested during the last 30–40 years also provides estimates of changes in SOC due to afforestation (Lilly et al., 2016). However, evidence on below-ground changes in SOC induced by forest management and extending beyond common forest rotation age is scarce. Providing site-specific measurements of long-term forest SOC dynamics could provide a solid basis to improve the reliability of simulations of changes in SOC and could offer better estimates of future C sequestration in forest soils.
In this study we aimed to evaluate changes in SOC in surface and sub-soils in a permanent pine forest chronosequence in Scotland. In order to provide a comparison with the other common land use type, we selected adjacent permanent rough grazed grassland sites and used measurements at these sites to simulate SOC turnover under forest growth using the well-established RothC-26.3 model (Coleman and Jenkinson, 1996).
Methods
Site Description and Management History
Rothiemurhus Estate and Glenmore National Nature Reserve (NNR) (57°17′ N, −3°73′ W) are part of a continuous chain of Scots pine forest that stretches from Glen Feshie in the south-west to Abernethy Forest NNR in the north-east of Scotland, forming the largest area of natural pine forest in Scotland (Figure 1). Rothiemurhus estate has been owned by the Gordon family since 1580 (Smout et al., 2007). Glenmore NNR was a part of this property until 1923 when it was acquired by the Forestry Commission (Macpherson Grant, 1975). Glenmore NNR is classified as an Ancient Woodland with ~1,700 ha planted with Scots pine on the ancient woodland sites and ~200 ha under semi-natural pinewoods, while the Rothiemurhus estate has ~900 semi-natural pinewoods and ~200 ha Scots pine plantations (Cairngorms National Park Authority, 2015).
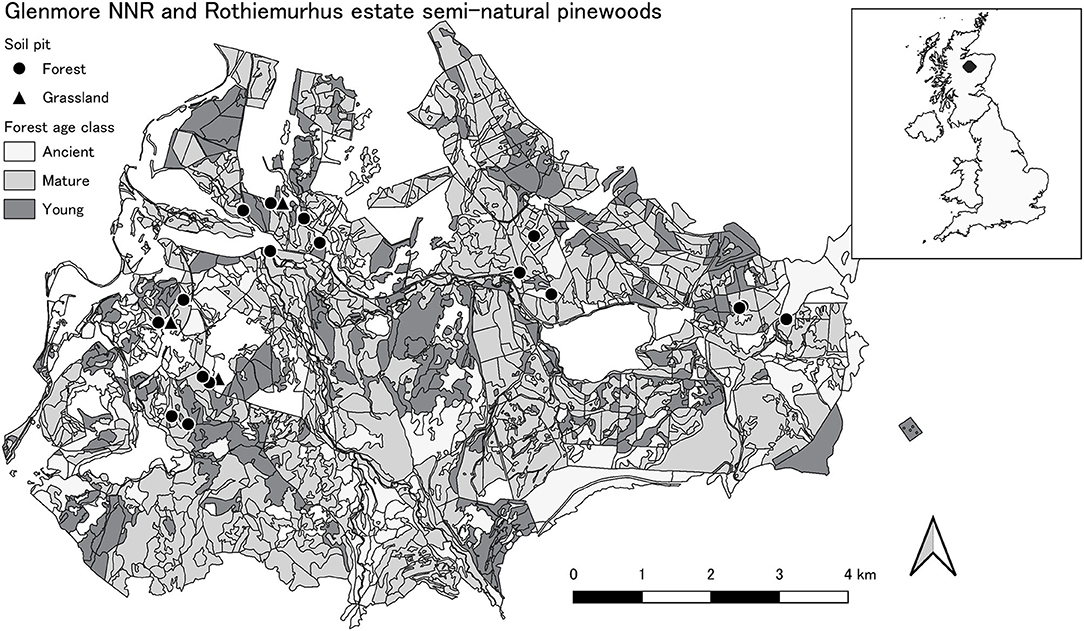
Figure 1. Glenmore NNR and Rothiemurhus estate semi-natural pine forests. Age class represents planting age or age estimated from tree boring and diameter at a breast height: young–0–25, mature–25–80, ancient >120 years old. Three soil pits are on non-forest land, as they were excavated in the adjacent grassland (black triangle).
Pollen from the sediments in the lake, Loch Molrich, show that pine has colonized these woodlands for around 8000 years (Brown and O'Suillivain, 1975). However, most of the ancient pinewoods in Scotland have been cut, burnt and grazed by sheep or cattle over a long period of time (Summers et al., 1999). In this area, the first reference to forest exploitation dates to 1226 and indicates that the forest was used for hunting and selective felling, which in turn has promoted the pines. In the eighteenth century, the forest was more mixed than it is now, with native broadleaved species; birch (Betula sp.), hazel (Corylus avellana) and poplar (Populus tremulus) (Smout et al., 2007). Larger scale forest exploitation operations started in the mid-eighteenth century, when several timber sale contracts were secured by the land owners and later continued by producing wooden pipes and supplying materials for the shipbuilding industry. By the start of nineteenth century all mature and easily accessible pine had been harvested, and the forest was left for natural regeneration; no serious forest reconstruction work was undertaken (Fraser and Innes, 1975; Smout et al., 2007). Two further intensive exploitation periods occurred during the two World Wars. After the Forestry Commission acquired Glenmore NNR, enclosed planting of Scots pine, Sitka spruce, Norway spruce (Picea abies) and Lodgepole pine (Pinus contorta) took place (Edwards and Mason, 2006). The Rothiemurhus estate used the deforested areas for sheep grazing before allowing natural pinewood regeneration to take place with some non-native conifer plantations in the Northern and South Western parts (Smout and Lambert, 1999). By the 1990's, the previous exploitation history left Rothiemurhus estate and Glenmore NNR with mature plantations of Scots pine on the drier slopes and morainic knolls, exotic species on the wetter grounds, and scattered, mixed age, semi-natural Scots pine stands in other areas (Edwards and Mason, 2006). Since then, the mature exotic species plantations have been, and continue to be, harvested and replaced with naturally regenerating stands.
A second management approach being used involves delayed thinning in the mature Scots pine plantations to move to a non-clear-felling regime in the future (pers. comm. Brian Duff, site manager). The semi-natural stands in both estates contain individual pine trees that are over 250 years old (Balharry, 1975). In the pinewoods, birch and juniper (Juniperus communis) occur in the understory; at the ground level the most common species are heather (Calluna vulgaris), bilberry (Vaccinium myrtillus), lingonberry (Vaccinium vitis-idaea) and a deep (10–20 cm) bryophyte horizon (Walton, 1975; Edwards and Mason, 2006).
The forest soils at the site have developed after the last glaciation period, and the pine forests are mainly situated on podzols that formed from glacial granitic drift of the Central Highlands. The mineral soil is predominantly sand and gravel with a very low clay content, due to the past washing by glacial melt water, and an indurated C horizon (Edwards and Mason, 2006; Watson, 2012). The Glenmore valley and Rothiemurhus estate experience a more continental climate, due to shielding by the western mountain range. The area experiences severe winters and relatively low rainfall (1,000–1,100 mm) (Edwards and Mason, 2006). The long term average annual temperature range is 5–19°C, with a minimum annual temperature ranging from −25to −31°C (Haylock et al., 2008).
Site Selection and Sampling Approach
Sites were selected where historical maps indicated the same previous land use, to ensure continuity and minimize the risk of major disturbance. To minimize soil variability, all sites had oxic conditions due to free draining moraine and lower water tables. They were situated at the bottom of a valley or on a slope of <6% facing south. All forest sites were classifies as podzols, with organic layer which consisted of L (litter), F (fragmentation) and H (humification), while Grassland sites were on cambisols (FAO, 2015). The distances between sites were variable. If possible, adjacent sites of different ages were selected, in this manner forming clusters with similar soil conditions. The most distant sites were situated ~8 km apart. The elevation of the sites varied from 230 to 420 m above sea level. All sampling sites (n = 19) were at least 30 m from the main road and at least 15 m from the stand edge to avoid edge effects (Vanguelova et al., 2016). In the Glenmore NNR, plots had previously been evaluated for yield class by Edwards and Christie (1981); over-mature plots (referred to hereafter as “ancient” to avoid confusion with “mature” sites, n = 5) were growing between 2 and 6 m3 ha−1 year−1 (>100 years with variable age regrowth), while the mature (>25 and <80 years, n = 6) and young (<25 years, n = 5) stands were growing between 6 and 8 m3 ha−1 year−1. There was no similar information available for the Rothiemurhus estate, so we assumed similar growth rates throughout the forest stands of the same age. The ancient sites had variable ground cover and mixed age trees (20–200 years old). The sampling pits were located close to the oldest trees to avoid the disturbed patches in the stand. Grassland sites (n = 3) were selected as close as possible to the forest sites to ensure similar drainage and soil conditions. The pits were located minimum 20 m from the grassland edge to avoid forest border effect.
To facilitate more accurate description of the depths of the organic layers, at every forest site, peat horizon depth (F and H horizons) was measured 20 times (Kristensen et al., 2015), taking five measurement using a hand-held peat probe at 10 m intervals, starting from each side of the soil pit. The soil was sampled by excavating one soil pit per site, cleaning three pit sides and taking bulked samples from the identified horizons; fragmentation (F), humification (H), topsoil (Ah), eluviated (E), and subsoil (Bhs). Grassland soil was sampled in a similar way. However, organic horizons were not present and the mineral horizon types were different (see Supplementary Figures 1, 2 and Table 1). The excavation was stopped if large stones were encountered or an indurated soil was reached. Mineral horizon bulk density (BD) was measured by hammering a 100 cm3 steel ring into the middle of each soil horizon. If horizon width permitted, five samples were taken from each horizon; otherwise the horizon was sampled, and rings repacked with soil in the laboratory. Organic soil BD was measured by cutting out three peat blocks that would fill a core of dimensions 5 × 8 × 20 cm.
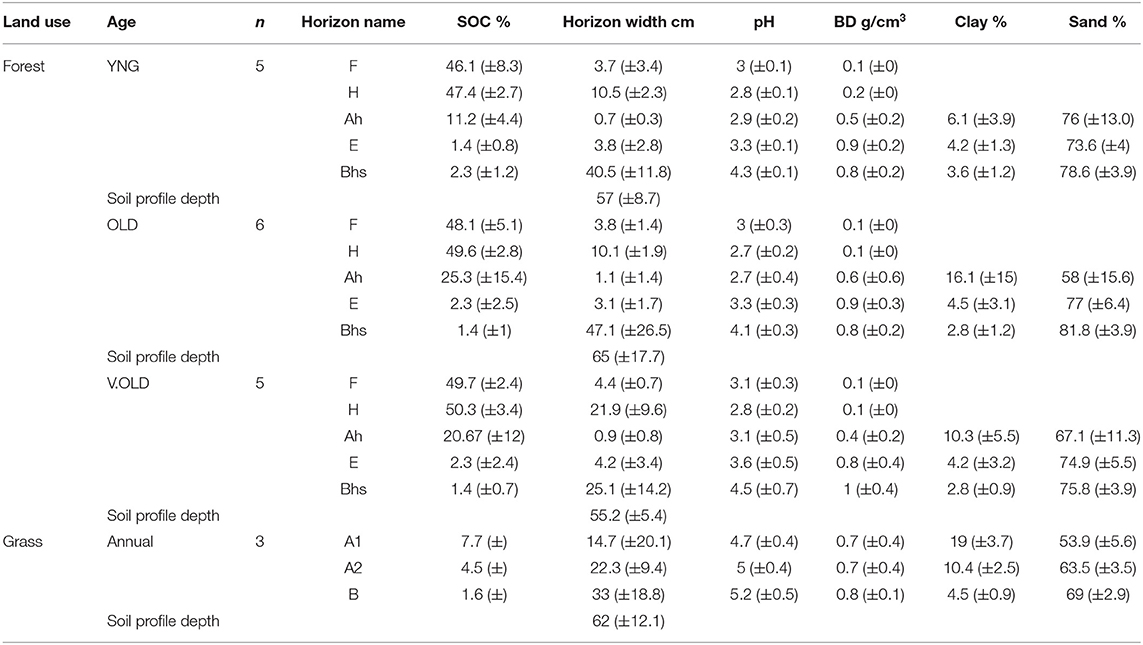
Table 1. Mean physical and chemical soil attributes of grassland and forest sites for the whole soil profile (±95% confidence intervals of the mean).
Sample Preparation and Chemical Analysis
Mineral soil samples were dried at 35°C in a forced air cabinet, gently crushed and sieved with a standard 2 mm sieve to remove stones and roots, while organic soil samples were dried and crushed to enable sample homogenization. The pH of the soil was measured using 0.01 M CaCl2 (soil to solution ratio of 1:5). Dried soil sub-samples were ground in a ball mill (RETSCH MM200, Retsch, Haan, Germany), and total C was measured by combustion in an elemental analyser (Elemental analyser, NA 2500, CE instruments, UK). Both mineral and organic soils were highly acidic, ranging from pH 2.7 to 4.5, so no inorganic C removal was required as soils below pH 4.8 are usually carbonate free (Angst et al., 2018). Fine earth bulk density samples were dried at 105°C in a forced air cabinet until they reached a stable weight, sieved through 2 mm sieve, stones were separated, and stone volume and density were calculated. Particle size was analyzed at the Institut National de la Recherche Agronomique Laboratoire d'Analyse des solis (INRA) by the wet sieving and sedimentation method (ISO, 2009).
Equivalent Mass Calculation
Forest mineral soil had considerable differences in BD between sites, and in some sites, the indurated mineral soil B3 horizon was not reached due to the large stones. Therefore, forest SOC stocks were recalculated using equivalent soil mass (Ellert and Bettany, 1995). Equivalent mass calculations were not needed for the organic soil horizons as, in all the sampling sites, the full depth of organic horizons was sampled. The ancient sites were chosen to serve as a reference soil mass in each horizon (used as a basis to compare different sites). The reference mass horizons were fixed from the average soil mass of the horizons at those sites, 46.4 Mg ha−1 in the Ah horizon, 338 Mg ha−1 in E horizon, and 2,555 Mg ha−1 in Bhs horizon. If the calculation of equivalent mass resulted in the soil exceeding that in the measured Bhs horizon depth, it was assumed that below this the SOC content and BD were equivalent to the Bhs horizon. The SOC stocks, SOCst (Mg ha−1), for individual horizons were calculated using the percentage SOC content, PC (%), from the bulk horizon sample, the fine earth fraction bulk density, BDf (kg m−3) and the horizon thickness D (m):
The total SOC stock was calculated by adding all the horizons measured in one pit.
Statistical Analysis
Forest soil descriptive characteristics (pH, organic and mineral horizon BD, depth and clay content in the mineral soil) were used as response variables, and differences due to forest age and soil horizon were analyzed using linear mixed effects models (LME) (Pinheiro et al., 2007, 2017). Linear mixed effects models are very useful for disentangling the effects of non-independence of samples, in this case due to sampling horizons from the same pit. A distinct Ah horizon was present in only some of the forest soil profiles, so it was removed from the BD statistical analysis. Mineral horizon width and clay content were transformed using natural logarithms to improve the homogeneity of residuals. Site geographical positioning system (GPS) coordinates (transformed into Universal Transverse Mercator) were used to account for spatial correlation, assuming a spherical correlation function to account for the distance between the soil pits. For this, a random noise was assigned to the measured coordinates (due to repetition of coordinates for measurements taken from the same pit) (Bivand and Lewin-Koh, 2015). The random effects part of the model was used to account for clustering of measurement values caused by sampling all horizons in one pit (Zuur et al., 2011). Both forest age and soil horizon effects were included as ordered factors; the order of forest age groups was described as young, mature and ancient, and of soil horizon as F, H, Ah, E, and Bhs (Supplementary Figure 1). Fixed effects in the models were fitted using the maximum likelihood method and a non-relevant explanatory variable, altitude, was dropped based on the Akaike information criterion (AIC) index and likelihood ratio tests (Chi-squared). The final model was fitted again using restricted maximum likelihood. An analysis of variance test (ANOVA) was then used to provide p-values.
The grassland sites were situated on a deeper and more fertile soil, which was categorized as cambisol (Supplementary Figure 2). Therefore, a direct soil horizon comparison was not possible. However, total measured SOC (Mg ha−1) was compared. Total SOC stocks, and organic and mineral horizon SOC stocks were modeled using LME; the same random effect structure and spatial correlation function were used. The fixed effects were tested according to the top down strategy where a full model was fitted (all possible fixed effects were initially included), and the minimum number of fixed effects supported by AIC index were retained (Supplementary Table 1) (Zuur et al., 2011). The SOC stocks in mineral and organic horizons were transformed using natural logarithms to improve the homogeneity of residuals. All statistical analyses were done using the R software (R Core Team, 2017). The nlme package was used for statistical modeling (Pinheiro et al., 2017) and predictions, mgcv (Wood, 2011) for confidence interval construction and ggplot2 for illustrating results (Wickham, 2009).
Modeling Forest Soil With RothC-26.3
Overall Approach
Changes in forest SOC during the forest rotation were simulated using the RothC-26.3 model (Coleman and Jenkinson, 1996). RothC is driven by plant inputs, which are divided into decomposable plant material (DPM) and resistant plant material (RPM). The plant inputs in each layer are obtained by interpolating the measurements of SOC as described below. Decomposition in the soil is described by two SOC pools with different rate constants [microbial biomass (BIO), humus (HUM)] and another organic matter pool which is assumed to be inert [inert organic matter (IOM)]. Peat water retention equations from the Defra GB SEISMIC project PS2225 (Hollis, 2008) were used to simulate water retention in the organic horizons. Long term monthly temperatures and precipitation were calculated from the Haylock et al. (2008) high resolution gridded dataset, which encompassed the period from 1950 to 2018. We used average monthly values for that period. Weather conditions before 1950 were assumed to be to be equivalent to the monthly average values between 1950 and 2018.
Estimating Plant Inputs of Soil Organic Carbon Pools at Steady State
The mineral and the organic horizons of the oldest forest sites were assumed to be in steady state for the purposes of modeling. The steady state concept is a very important assumption used in this study. It represents a system in which SOC is no longer changing, or a system in which there is no further change in the rate of SOC accumulation or degradation. It has been demonstrated by many authors (e.g., Sierra and Muller, 2015) that SOC comes to steady state after an extended period of unchanged inputs and outputs. Mineral soils usually reach a state where no further net accumulation or degradation of SOC occurs, whereas a healthy organic soil usually continues to accumulate SOC, but at a constant rate. The ancient unmanaged sites in our study represent the closest possible match to a pine forest at steady state that could be found in Scotland, as ancient forests are commonly regarded as being neutral with respect to SOC losses (Lippke et al., 2011) or as providing a carbon sink that can be sustained forever (Hudiburg et al., 2011). Based on the measurements collected, we represented the organic layers as being in steady state with respect to the rate of accumulation (i.e., they were assumed to be accumulating SOC at a constant rate), while the mineral layers were represented as being in true steady state, with no further changes in SOC occurring (i.e., the change in SOC was assumed to be zero) (Figure 2). This allows the plant inputs and SOC pool sizes to be determined by running the model to steady state and adjusting plant inputs as shown in Equation 2 until simulated values of SOC match the measured values (Smith et al., 2005). The steady state assumption is valid in a system where no significant disturbance has been observed for an extended period of time, in this case for more than a century;
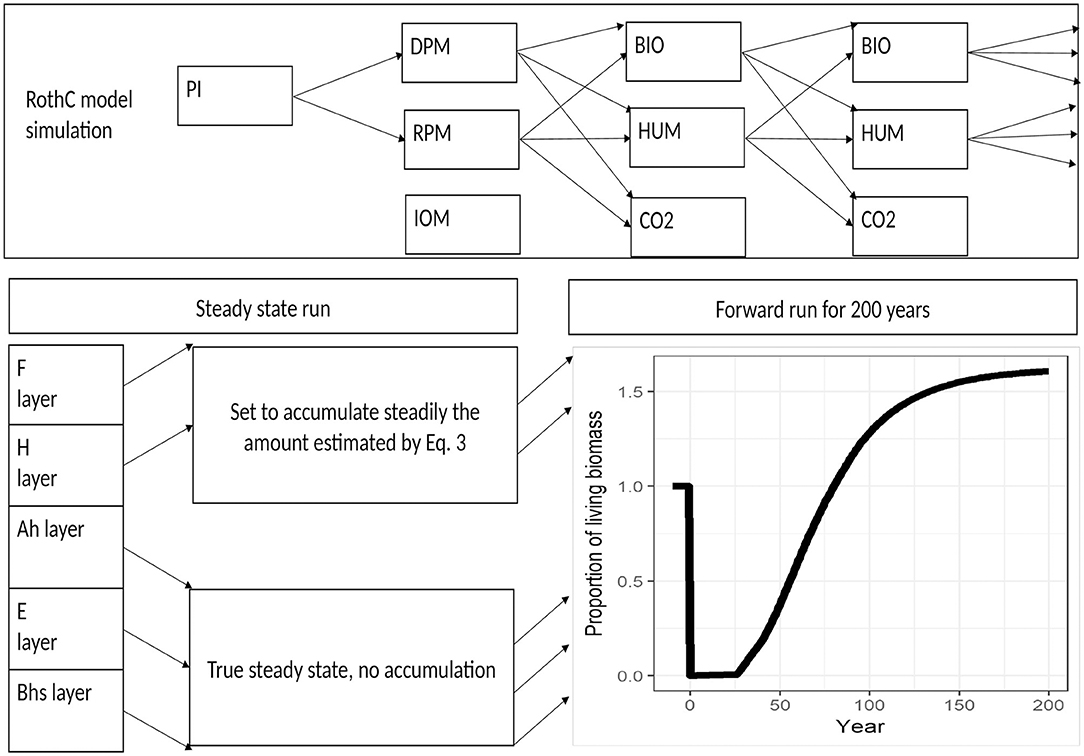
Figure 2. Plant input change () during forest rotation as a proportion of steady state plant inputs. The steady state soil is represented as the line before the year 0.
where PIss is the plant input at steady state (Mg ha−1), PIdef is the plant input from the previous iteration (initialized using default values from RothC that represent the distribution of inputs through the months of the year), and SOCmeas, old and SOCsim, old are the measured and simulated SOC (t ha−1), respectively, both in the oldest site.
Organic Layer Dynamic SOC Accumulation
The mineral soil horizons could be assumed to be in “true steady state,” with no net change in SOC, whereas the organic horizons are likely to be growing in depth and accumulating C, so were assumed to be in steady state only with respect to the rate of accumulation (i.e., the rate of accumulation was assumed to be constant). The rate of accumulation, SOCac (Mg ha−1 y−1), was estimated from the difference in SOC content of the oldest and youngest sites, SOCmeas, old and SOCmeas, yng, respectively (t ha−1);
where t is the growth period (y), assumed to be 200 years. As the organic layer accumulated at the steady rate, ΔSOCac, the same amount of SOC moved to below the fixed depth of the top simulated layer, and so was subtracted from the bottom of the simulated layer. The amount subtracted each month was estimated as . This subtraction of accumulated SOC from the bottom of the layer then allowed the steady state run to be used to determine plant inputs and SOC pools at steady state in the same way as when the soil is in true steady-state. The cumulated SOC subtracted from the simulated layer after 200 years was equivalent to the SOC accumulation in the organic horizon and was assumed to have the same proportion of pools as the fixed width top layer that was explicitly simulated. The outputs from this process were the SOC pools in the total organic horizon and the plant inputs at steady state before harvesting.
Simulating Forest Growth and the Forest Management Operations
To determine the impact of harvesting and replanting (the assumed history of the younger forest stands), the simulations were run forwards starting from the SOC in the organic and mineral horizons in the oldest forest site at steady state. The simulation was initially run forward assuming that the only change was in the reduced plant inputs of the immature forest stand. To do this, it was assumed that the plant inputs from above and below ground tree litter changed as a function of standing forest biomass in each year, Yt (Mg ha−1) (Ågren et al., 2008). The increments in forest biomass were constructed using UK forest yield tables (Matthews et al., 2016a,b), the yield tables providing above and below ground mass increase with forest age (Figure 2).
The plant inputs of C in any given year, PIt (t ha−1), were then given by
where Yss is the biomass at steady state. The discrepancy between the measured and simulated SOC in the ancient sites, SOCmeas, old and SOCsim, old (Mg ha−1), respectively, indicates the change in SOC caused by management, SOCman (t ha−1), for example due to disturbance during planting or harvesting,
The level of disturbance is very different in forests from arable systems. In forests, soil undergoes less frequent disturbance and can accumulate particulate organic matter, which can be easily lost after harvesting. Therefore, the model overprediction of the measurements was taken to represent the loss of particulate organic matter due to disturbance. The simulations were used in this way to interpolate the unknown impacts of management practices on the SOC content of the soil.
Simulating the Impacts of Afforestation of Grasslands
To determine the potential impact of foresting the grassland sites, the SOC pools in the grassland site were first determined by running the site to steady state, assuming the quality of plant inputs for grassland (DPM:RPM ratio = 0.67; Coleman and Jenkinson, 1996). The afforestation process was then simulated by changing the quality of plant inputs to forestry (DPM:RPM = 0.25; Coleman and Jenkinson, 1996) and setting to average plant inputs from ancient sites, while distributing them according to Equation 4. The model was then run for 200 years to estimate the potential change in SOC in the ancient forest. Note that this neglects any impact of disturbance during planting, which cannot be interpolated without additional measurements from ancient sites that have been afforested from grassland. However, this error is expected to have a small impact over the timescales needed to grow the ancient forests.
Results
Descriptive Soil Properties
The depth of organic soil horizon was significantly affected by forest age and horizon location (Table 2), showing that organic horizons were dependent on forest age and were different from each other. The pH and BD were only affected by the horizon location in the profile. The intraclass coefficient showed that soil sampling from one pit accounted for <1, 20, and 32% of total variation of horizon width, pH and BD, respectively (Table 2), so horizon depth was the least influenced by sampling from the same location. The mineral soil BD was not significantly affected by any tested explanatory variables. However, the mineral soil horizon width, pH and clay content were significantly affected by horizon location in the pit. The intraclass correlation coefficient of horizon depth, pH and clay content showed that random effects in these models accounted for a minor part of the total variation (Table 2). By contrast, random effects in BD accounted for 42% of total variation, which could show that there are other important explanatory variables that were not measured and included in statistical models. The BD of soils could be also influenced by stone content, as well as animal activity, rooting patterns of trees and ground vegetation, and the spatial variation of the soil due to natural soil forming processes such as weathering and development of iron pans. Forest management could also have a major impact on soil BD and its spatial variability, so impacts of other influencing factors are difficult to capture; this could be the case especially in the younger sites.
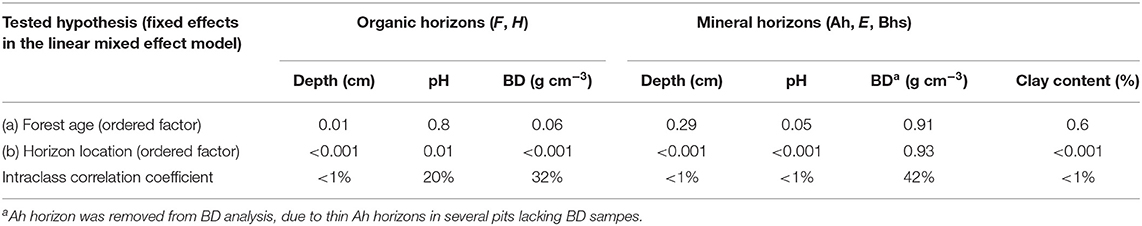
Table 2. Results of linear mixed effect models' analysis of variance on how organic and mineral soil horizon depth, pH, bulk density (BD) and clay content were affected by predictors.
Soil Organic Carbon Changes in the Forest Chronosequence
Total SOC stock change was best described by forest age only and the effect was significant (Table 3), showing the importance of forest age. Grassland was not significantly different from the ancient forest sites and including land use type did not improve the statistical model. Therefore, it was removed from the explanatory variables. Soil sample clustering in pits explained 27% of the total variation. Total SOC stock was predicted to be higher in the ancient than the young and mature pine forests, which had similar predicted SOC stocks (Figure 3A).
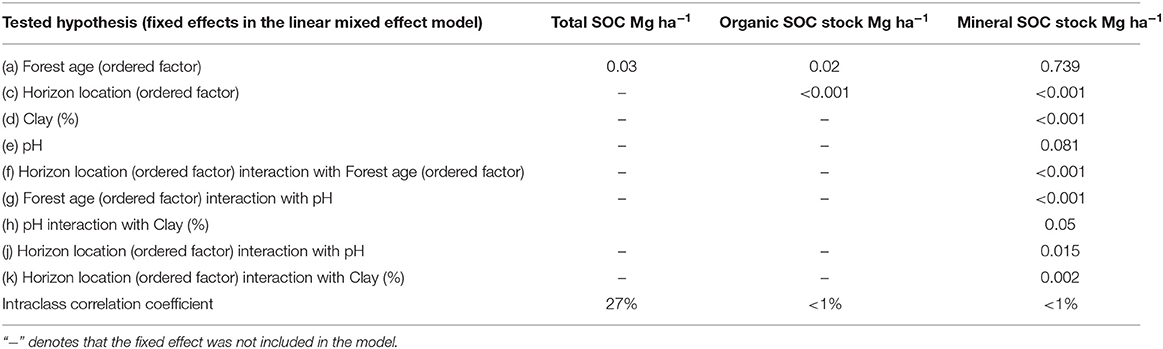
Table 3. Results of linear mixed effect models' analysis of variance on how total and horizon soil organic carbon (SOC) are affected by predictors.
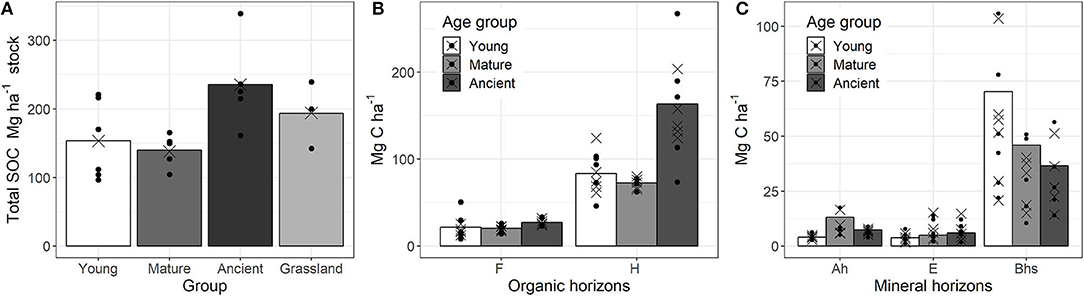
Figure 3. Pine forest and grassland total soil organic carbon (SOC) (A from left to right), pine chronosequence organic horizon SOC (B) and mineral horizon SOC (C) stocks (Mg ha−1) presented by average site measurements (black circles), statistical model predictions (black crosses) and average over all sites (bars). In order to illustrate correspondence of the measured data and the linear mixed effect model, we used shaded bars to indicate the average of measured values in a certain group, black circles show the actual measurements and their spread around a mean. Crosses show the predicted values that, after eliminating random effects, have much narrower spread. Moreover, crosses–predicted values clustering around the measured mean can provide a proof of a reasonable model fit to data.
Soil organic horizon SOC stock was dependent on forest age and horizon location (Table 3). Random variation accounted for <1% of total variation, so there was very little unexplained variation. The largest SOC stocks were accumulated in the ancient forest, while young and mature forests had similar amounts of SOC (Figure 3B). Similar trends in SOC accumulation were found for both F and H organic horizons, but the differences were more pronounced in the H horizon.
Mineral horizon SOC stocks were best described by forest age, horizon location, clay content, pH and almost all possible interactions of these four explanatory variables; only forest age and clay content interaction were not important (Supplementary Table 1). Forest age did not have a significant effect on SOC accumulation (Table 3). Random effects from sample clustering accounted for <1% of total variation. There were marked differences between the SOC accumulation in the different mineral soil horizons (Figure 3C). However, the variation was too large to detect significant differences.
Modeling With RothC 26.3
Measurements from the ancient forest and grassland sites were used to simulate the impact of reforestation of forest sites and afforestation of grassland. Steady state runs in forest and grassland sites showed measured differences and uncertainties in SOC stocks related to land use and specific site conditions (Figure 4). Mean measured total SOC stocks in grassland (SOCmeas, gra) were 191 Mg ha−1 and in the ancient forest (SOCmeas, old) were 240 Mg ha−1 (Table 4). These were used to determine plant inputs (PIss) and starting SOC pools; the results of the steady state run are shown in year−10 to−1 in Figure 4. The organic horizons were assumed to be in steady state with respect to the rate of accumulation (SOCac = 0.43 Mg ha−1y−1).
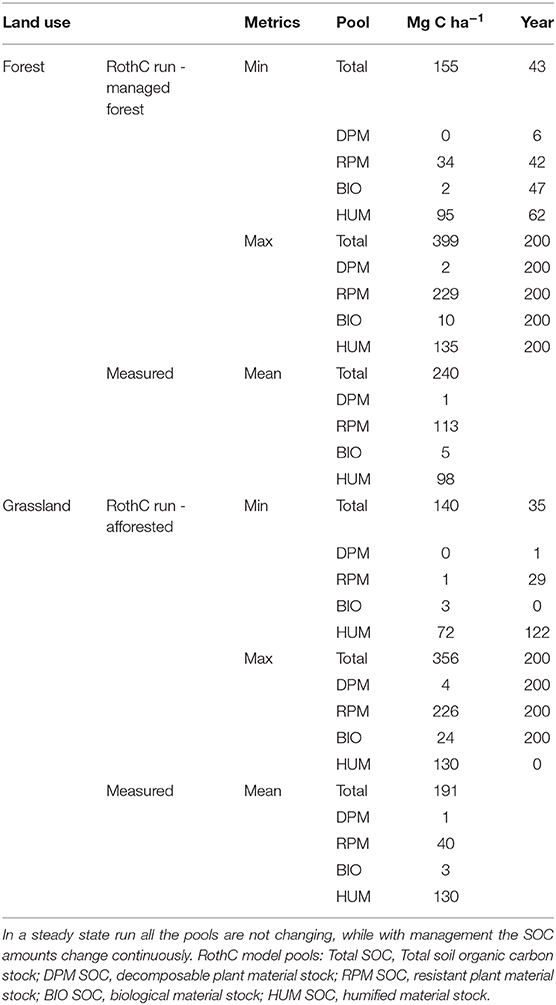
Table 4. Forest and grassland modeled SOC changes (Mg C ha−1) in RothC model pools and total SOC.
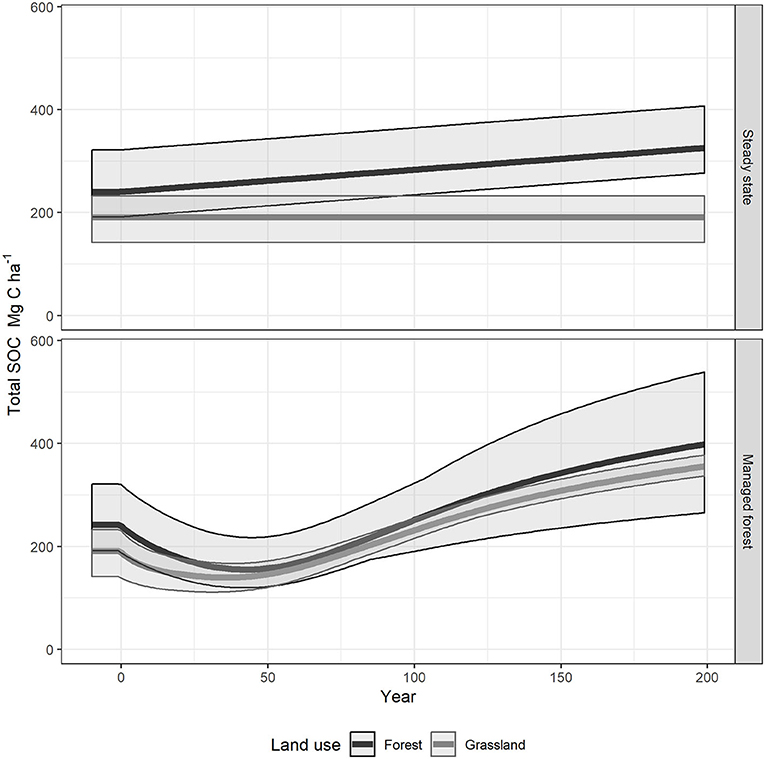
Figure 4. Soil organic carbon dynamics over 200-year long pine forest growth. The steady state soil is represented as the line before the year 0. The solid line shows the simulation average and the shaded area represents the minimum and maximum values. The steady state panel shows the influence on steady state and continuous accumulation in the F and H horizons assumption. The Managed forest panel shows how distributing plant inputs according to standing forest biomass affects SOC.
In the simulations of reforestation of forest sites, the initial very low plant inputs induced a temporary reduction in the simulated stock of SOC (Figure 4, Managed forest).
The RothC model pools reached their minimum value at different times, due to different pool decomposition rates. The pools with the fastest turnover rate, DPM, reached its minimum values at the year 6 (Table 4). By the end of simulation (200 years) of pine forest management, the SOC stocks had increased and all of the RothC model pools had reached a maximum SOC content (Figure 4, Managed forest). The total SOC stock simulated at 200 years was 399 Mg ha−1, 66% higher than the value measured in the ancient sites, SOCmeas, old (Figure 5). This over-prediction of the measured SOC was taken as an indication of the loss of SOC that occurred due to management factors, such as disturbance associated with harvesting operations. By year 200, the RPM pool had the highest over-prediction, by 103% (116 Mg ha−1 SOC) compared to steady state, while the HUM pool had increased by only 38% (37 Mg ha−1 SOC) and the BIO and DPM pools had increased much less (Figure 5). At this time, the RPM pool held 73% of all the extra SOC. This suggests that the disturbance due to harvesting operations had a much greater impact on the RPM than the HUM pool, with the fresh plant material in RPM tending to be lost more easily than the more recalcitrant and protected humified material in HUM. The DPM and BIO pools were over-predicted by much smaller amounts compared to the measured steady state (DPM by 1 Mg ha−1 and BIO by 5 Mg ha−1, Table 4). This is because the inherent within-year variation of these rapidly turning over pools allows them to quickly recover from any disturbance occurring during deforestation.

Figure 5. Average forest soil organic carbon stocks in the RothC pools during steady state run (Ss) and 200-year forest growth period (Min–minimum amount, Max–maximum amount), numbers above the bars indicate the percent change compared to the steady state. Panel names are the same as the acronyms used in Table 4.
In the afforested grassland, after 200 years of pine forest growth the SOC was overpredicted by 86% compared to SOCmeas, gra (Figure 6). In the afforested grassland sites, the pool with the fastest turnover rate, DPM, reached its minimum at year 1, while the HUM pool minimum was at year 122 (Table 4). The minimum total SOC stock was reached in year 35 and was 27% lower than the SOCmeas, gra (Figure 6). The maximum SOC stock in total and in the individual pools were largest at the end of the simulation, except for the HUM pool, which was the largest at year 0 when the management started and was the same as the steady state grassland HUM pool (Table 4). The largest SOC accumulation was in the RPM pool (186 Mg ha−1) (Table 4). This suggests that afforestation of grassland had a negative impact on the recalcitrant HUM pool while positively affecting the RPM pool, where the fresh plant material was accumulated.
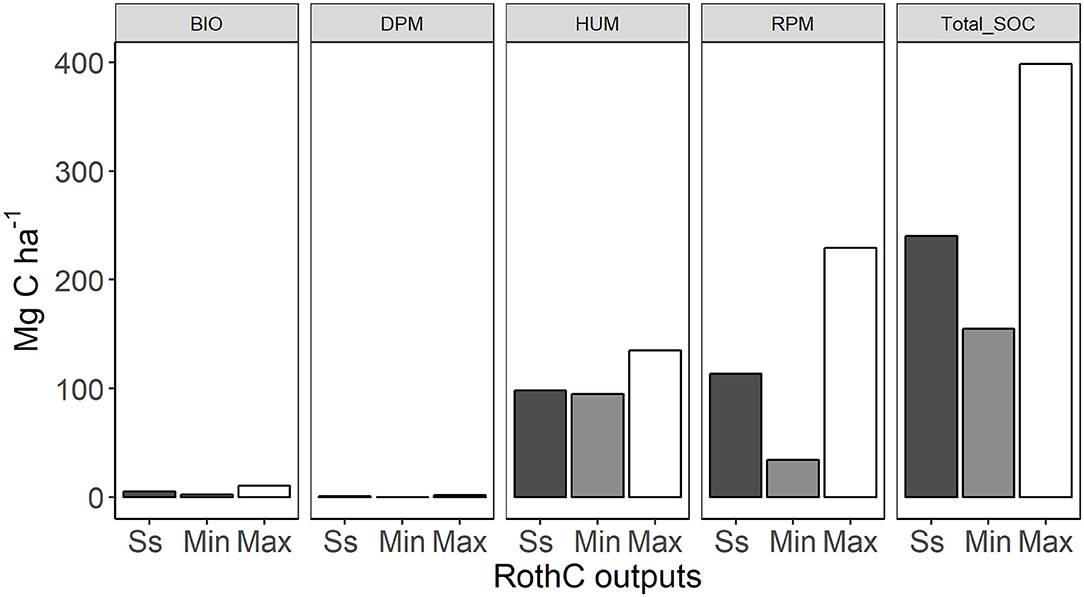
Figure 6. Average grassland soil organic carbon stocks in the RothC pools during steady state run (Ss) and after afforestation in 200-year period (Min–minimum amount, Max–maximum amount), numbers above the bars indicate the percent change compared to the steady state. Panel names are the same as the acronyms used in Table 4.
The organic horizons had a large influence on total forest SOC, because they constituted 85% of the total simulated SOC at year 200. Increasing or reducing plant inputs by 50% resulted in similar proportion gained or lost (±3%) from each RothC pool at the end of simulation (200 years) (Figure 7).
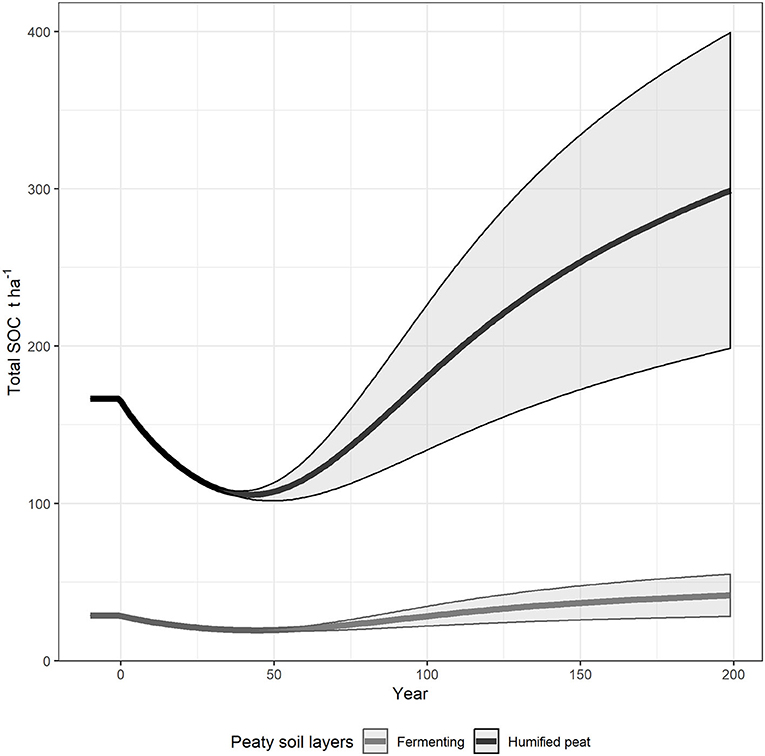
Figure 7. Sensitivity analysis of plant input by fragmentation F and humification H horizons. Plant inputs were distributed according to standing forest biomass and allowed to accumulate through simulation period. A solid line was average values, shaded area maximum represents 50% increase in plant inputs and minimum a 50% decrease.
The difference between the simulated value of SOC in the afforested grassland and reforested forest sites after 200 years was just 43 Mg ha−1 (Table 4), while the average difference in the SOC measured at the ancient forested and grassland sites was 49 Mg ha−1. This build-up of SOC after afforestation of grassland mainly occurred in the organic horizons.
Discussion
Soil Organic Carbon Changes in the Pine Chronosequence
Statistical analysis showed that forest age has a significant impact on total SOC stocks (Table 3). The ancient forest had significantly more SOC than the young forest; this is in line with findings of a worldwide meta-analysis (Nave et al., 2010) (Figure 3A). Noormets et al. (2015) reported that global mean SOC stock was 2-times higher in unmanaged stands, compared to managed stands. However, this was not a universal rule, rather just an indication of consistently higher SOC stocks in undisturbed forest soils (referred to as ancient stands in this study). The total SOC stocks in grassland were similar to those in the ancient forest stands; this is in line with European land use change studies (Thuille and Schulze, 2006; Hiltbrunner et al., 2013; Poeplau and Don, 2013) and a Scottish afforestation study (Beckert et al., 2016). However, the grassland soils studied held more SOC in the mineral horizons than forest soils. Grassland has higher root to shoot ratio than forest, and root C was linked with stable SOC formation in mineral soils (Rumpel and Kögel-Knabner, 2011; Hiltbrunner et al., 2013; Hu et al., 2016). Alsohis may be due to differences in soil texture in the more podzolic compared to cambic soil (See Table 1), which results in the SOC in the grassland on the cambic soil being less susceptible to environmental factors and more stable under a changing climate (Thuille and Schulze, 2006; Poeplau et al., 2011; Poeplau and Don, 2013).
By contrast, mature forests had similar organic horizon SOC stocks to young stands (Figure 3B). This could be attributed to the onset of thinning operations that would reduce organic horizons (Powers et al., 2012). Furthermore, young sites could have benefited from coarse roots and stumps left after harvesting, which act as long-term SOC pools and sources of nutrients for vegetation in forests (Palviainen and Finér, 2015). The thickness of the organic horizons was significantly affected by forest age (Table 2), but BD was not. Therefore, the change in thickness was the main cause of the SOC stock increase with age; this is in line with both Scottish (Chapman et al., 2013; Lilly et al., 2016) and international findings on podzols (Nave et al., 2010). The study of Chapman et al. (2003) showed that the Abernethy pine forest (20 km away from Glenmore forest), with 100–120 year old pines, has accumulated an average of 263 Mg ha−1 C in organic horizons. This was slightly more than the average SOC stocks (240 Mg ha−1) in the ancient pine site in this study, but Chapman et al. (2003) selected forests with almost no documented human disturbances, where pine trees were more dependent on natural fire regime, and these conditions could allow more SOC to accumulate in the top organic horizons.
In the mineral horizons, the SOC stocks were not related to forest age, which again was in agreement with the conclusions of Nave et al. (2010) on podzolized mineral soils. However, two other recent global meta-analyses came to diverging conclusions. Achat et al. (2015) in their European forest meta-analysis found a significant increase in SOC stocks after harvesting in the deeper mineral soil horizons, while the global meta-analysis of James and Harrison (2016) observed a loss. In our study, the SOC stocks in the young forest stand were very variable in the deeper mineral horizon, Bhs (Figure 3C). It could be hypothesized that increased inputs of the dead material from the previous stand (Powers et al., 2005; Palviainen et al., 2010; Olajuyigbe et al., 2011; Vesterdal et al., 2011) and leaching of dissolved organic C from the disturbed upper horizons (Magnusson et al., 2016) could have led to the incorporation of more SOC in this podzolic horizon. Moreover, pine trees have deeper rooting compared to grasses that can reach down to >1 m on podzols, while grassland has on average lower rooting depth and subsequently lower connected inputs of root exudate and necromass at depth (Jackson et al., 1996; Ostonen et al., 2007; Vanguelova et al., 2007). Our statistical model lacked the explanatory power to pick up these differences, due to a limited sampling plot number.
Our study relied on a limited number of independent sites and the detected differences in soil could have been affected by spatial heterogeneity within the sites (Vesterdal et al., 2011). However, variation in our study was controlled by sampling similar textured soils in a close proximity where predominant weather and hydrological conditions were similar. Vanguelova et al. (2013) showed that in UK forests on podzols, at least−20 sample plots are needed to reduce the coefficient of variation to 10%, the most variable part of podzol being organic horizons. The organic horizon heterogeneity was controlled by sampling 20 cores in the same site and taking the mean depth for F and H horizons. Therefore, we consider that site to site variation was controlled to the extent possible and should not preclude the reader from drawing relevant conclusions about SOC dynamics in a podzolic soils under pine forest.
Process-Based Modeling
The accumulation of SOC in the organic layers resulted in an additional 159 Mg ha−1 SOC (Table 4). The average SOC increase of F and H layers was 0.43 Mg ha−1 y−1; this was higher than reported by Poeplau et al. (2011) (0.38 Mg ha−1 y−1) in a global analysis of plant inputs, and almost two times higher than the Swedish national long term prognosis for actively managed forests (Berg et al., 2009). Vanguelova et al. (2019) found a range of SOC accumulation rates from 0.28 to 0.94 Mg ha−1 y−1 across a Sitka spruce chronosequnce, similar to that found for managed conifer woodland during the National Scottish Inventory of Soils (NSIS) resampling (Chapman et al., 2013). This is also very similar to the SOC accumulation of 0.53 Mg ha−1 y−1 in the F horizon observed in the current resurvey by the Scottish Soil Survey of 39 conifer sites which have been afforested during the last 30–40 years (Lilly et al., 2016). Extending rotations has been suggested as a tool to increase biomass stocks in other forest modeling studies (Kaipainen et al., 2004; Heinonen et al., 2017). Kaipainen et al. (2004) reported either stable or reduced SOC stocks after prolongation of rotation, due to an assumption that net primary production reduction would be immediately reflected in the SOC stock. The study from Finland suggested that the forest rotation should be prolonged to 200 years, because C continues to accumulate in the soil even after maximum net primary production is exceeded (Pukkala, 2018). However, there may be limitations on how much SOC can be stored in a mineral soil depending on soil parent material and texture, where sandy soils have the lowest capacity (Angst et al., 2018). Pine forest litter is considered low quality, therefore it is suggested that it would take longer to reach mineral soil saturation point (Castellano et al., 2015). Hence, prolonged rotations could deliver benefits even in mineral horizons.
The increase in total SOC stocks after distributing plant inputs according to forest biomass accumulation showed that the RothC model is sensitive to uneven distribution of plant inputs (Figure 4). The RothC model has been tested on many different forested ecosystems and produces satisfactory results (Paul et al., 2003; Rumpel et al., 2003; Falloon et al., 2006; Dondini et al., 2009; Palosuo et al., 2012), so the RothC simulations can be assumed to be robust for forests.
The largest over-estimate of SOC compared to the steady state occurred in the RPM pool, which represents resistant plant material (Zimmermann et al., 2007) (Figure 5), suggesting that this pool was most affected by disturbance due to deforestation operations. This outcome is expected, because the most labile SOC is likely to be most reactive to environmental or management changes (Jandl et al., 2007; Poeplau et al., 2011). This soil pool could be threatened by changing climate, due to a shift in accumulation patterns. Gielen et al. (2013) investigated warmer climate effects on pine forest and found no changes in mineral soil, but slight decrease in organic layers in Belgium. Gielen et al. (2011) also showed that leaching of dissolved organic C could account for 11% of net ecosystem productivity in a mature temperate pine forest and was equivalent to 1 Mg ha−1 y−1 C, which was higher than our organic layer yearly accumulation. However, in the UK the observed dissolved organic C leaching was lower; from 0.4 to 0.1 Mg ha−1 y−1 C in podzolic soils (Morison et al., 2012). The RothC model does not account for lateral losses, such as dissolved organic C leaching from the system or erosion due to heavy rainfall. Modeling results from Ota et al. (2013) showed that dissolved organic C is one of the important controls for surface SOC in forests. These processes may account for some of the losses of SOC due to the changes in management with afforestation or reforestation. Lastly, the insights from this simulation are applicable in pine forest on poor sandy soils, where the most of the SOC is not minerally bound and has prominent labile organic horizons. The results would have been very different on high clay soils which have more capacity to bind and protect SOC.
The lowest simulated SOC stocks were not in the young forest stands, but in the 43-year-old forest which were defined here as “mature forest” (Table 4). Our measured SOC trends confirmed the simulations; the mature sites had slightly less SOC compared to the young sites (Figure 3A). However, the signal was weak as the mature group was comprised of stands with variable ages. Our findings are in line with other studies that found significant harvesting impacts several decades after the event (Diochon et al., 2009; Prest et al., 2014). This suggests that it would be beneficial to select 40- to 50-year-old stands as one of the age groups in future chronosequence studies on pine forest SOC.
Simulation of grassland afforestation provided insights into SOC pool changes and probable losses through afforestation. The increase in the DPM and RPM pools (Table 4) was in line with the studies of Beckert et al. (2016) and Poeplau and Don (2013) that showed that conversion from grassland to forest may enrich particulate organic matter, which is associated with the more labile pools, DPM and RPM. The RothC model was very sensitive to plant input variation in the F and H layers, which contained the highest proportion of SOC in the afforested grassland (Figure 6). The mineral soil lost SOC throughout the simulation and at the end of the 200-year period had decreased to similar levels of SOC as found under the forest. This finding demonstrates how plant inputs drive long-term sequestration. This introduced additional uncertainty related to the chosen plant inputs from the newly established forest on grassland. The plant input levels were set according to the plant inputs interpolated from the SOC measurements in the ancient (steady-state) forest, but they could have been increased by the increased nutrient regime in the grassland soils, or decreased due to different species composition of understory plants in the grassland sites that were not well-adapted to conditions of afforestation. Immediately after conversion, all plant inputs were set to come from planted forest, which are small as the forest is still becoming established. Don et al. (2009) reported that during soil plowing, 30% of grassland vegetation was destroyed and gross primary productivity fell by 41%; we assumed the same plant inputs from understory after forest planting on grassland or forest sites, so plant inputs immediately after afforestation may have introduced an error. However, this is not likely to have a long-term impact, with plant inputs likely to become very similar in the two sites as the forests mature and the canopy closes. We observed that after 200 years of afforestation the SOC content of grassland soils would be very close to the ancient forest. Therefore, afforestation would not provide significant benefits in long term sandy podzolic soil SOC stocks.
Key limitations of the simulations described here are associated with the changes in the soil with depth. All of the layers in all of the simulations used the same rate modifiers, which are dependent on (among other things) temperature. This version of RothC (version 26.3) was developed for use in topsoils, where air temperature will provide a relatively consistent representation of the impacts of soil temperature on decomposition. In deeper soils, the relationship between air and soil temperature is likely to be different. Internal consistency with the steady state run will mean that these differences are implicitly accounted for in the simulations presented here, but if changes in climate were the focus of the work, the temperature differences in subsoil are not likely to be adequately described.
In this study, forest soil was simulated in the separate blocks that represented different depths, which did not interact. From the soil processes perspective, this is a major simplification, because organic matter is transported through the profile from the top downwards as DOC and particulate material or introduced directly by decaying tree roots (Rumpel and Kögel-Knabner, 2011; Ota et al., 2013). Including interactions between soil layers would allow movement of SOC to be better represented. Such development would improve the representation of SOC turnover processes, however, would not affect the SOC pool sizes, which are fitted to the measured SOC stocks, so should not impact the overall conclusions of this work.
A further issue with simulations at depth is the assumed size of the IOM pool. Because radiocarbon dating was not available, the generic relationship between IOM and total SOC developed by Falloon et al. (1998) was used to set the size of the IOM pool; again this relationship was developed using data for topsoils and might be different in deeper soils. Evidence from Eusterhues et al. (2005) and Rumpel et al. (2004) suggests that forest soil C age increases with depth, so these relationships are unlikely to hold in the deepest Bhs soil horizon. Better IOM pool estimation would have affected the SOC pool distribution, but again, in the simulations presented here, internal consistency with the steady state run should implicitly incorporate these differences and not introduce an error over the 200-year time period of the simulation. If simulations are required to run for millennia, the reduced recalcitrance of the decomposing pools might result in an overestimate of SOC losses.
It is difficult to apply process based models in large-scale simulations due to high computational costs and large information requirements (Dondini et al., 2018). They need to be either evaluated for the local conditions or applied with caution. Process-based models, such as RothC, represent a simplification of the system. If controlling conditions are optimal under most modeling cases, they may be excluded from the processes described in the model because they are not limiting factors, but need to be explicitly included in the models if conditions act as limiting factors (Tupek et al., 2019). However, providing accurate description of the response to climate is crucial to the accurate prediction of the impact of climate change on future changes in the SOC. This is described in process based models but will not be included in statistical models that can only interpolate observations from past conditions. Statistical models inform about current conditions, but future predictions are better simulated using an understanding of the underlying processes.
Conclusions
This study's aim was to evaluate changes in SOC in surface and sub-soils in a pine forest chronosequence and compare to adjacent grassland sites. We used measurements at these sites to interpolate the impacts on SOC turnover of forest growth and grassland afforestation. The interpolation approach was based on the RothC soil C model, which we modified to include a representation of forest growth and management.
The measured SOC stocks indicate a significant benefit of undisturbed–ancient stands for SOC storage and long-term C sequestration. Modeling outcomes provide more detailed insights into the changes occurring through forest growth. It suggests that managed pine forests could lose a significant amount of SOC through management operations. However, the modeled losses were very high, up to 60% of total SOC, which could indicate uncertainties in the modeling approach. Both approaches would point to prolonging forest rotations and reducing/eliminating forest thinning in order to reduce the amount of SOC loss.
Measured SOC stocks were similar in the young and mature managed forest stands; this could be explained through our modeling studies. The lowest modeled SOC stocks were not in the young sites, but at the age of 43 years. This shows the importance of selecting 40- to 50-year-old stands as one of the important age group in SOC studies in forests. These stands should have the lowest total SOC stocks compared to pre-harvest ancient stands. Further, the simulations show the timing of losses from the system, and so provide information that could be used to design improved chronosequence studies and shows how modeling studies can inform the future design and sampling efforts.
The grassland afforestation simulations showed that organic horizons would dominate SOC accumulation, while mineral soil horizons would become depleted in SOC compared to grasslands. The mineral soil depletion was introduced through a conservative assumption that pine forest will grow at the same pace and produce the same amount of litter on the deeper and more clay rich grassland soil than on the podzolic shallow soil that were prevalent at the pine forest. This would not be a desirable result in the context of climate change as organic horizons are less resilient to adverse environmental factors such as drought, fire, wind throw and insect infestations.
Data Availability Statement
The datasets generated for this study are available on request to the corresponding author.
Author Contributions
RR planned and executed fieldwork, did laboratory analysis, modeling, and took the lead in writing the manuscript. TR helped with fieldwork. EV contributed to site selection and result interpretation. TC consulted about the statistical approach and site selection. PS provided general ideas and edited manuscript. JS participated in all research steps of the project and contributed along the way with advise, editing, and modeling consultations. All authors discussed the results and contributed to the final manuscript.
Funding
The research was funded by the University of Aberdeen and Forest Research joint PhD training grant. James Hutton Institute provided help in kind. The NERC (Natural Environmental Resources Council) grant NE/P019455/1 was used to pay publishing fees.
Conflict of Interest
The authors declare that the research was conducted in the absence of any commercial or financial relationships that could be construed as a potential conflict of interest.
Acknowledgments
Andy Kennedy for teaching about the podzolic soil sampling and horizon recognition. Rothiemurhus estate owners and the forest manager–Piers Voisey. Forest Research agency Soil Sustainability Research and Forest Mensuration, Modeling and Forecasting Science groups for consultations, practical and financial support. Ron Summers and Samantha Broadmeadow for help with GIS maps. Dr Robert Wilson for the help with finding ancient pine woodland locations in Scotland. We acknowledge the E-OBS dataset from the EU-FP6 project ENSEMBLES (http://ensembles-eu.metoffice.com) and the data providers in the ECA&D project (http://www.ecad.eu). This work contributes to the UKRI-funded Soils-R-GRREAT project (NE/P019455/1). We thank to two reviewers for their insightful comments.
Supplementary Material
The Supplementary Material for this article can be found online at: https://www.frontiersin.org/articles/10.3389/fenvs.2020.527549/full#supplementary-material
References
Ågren, G. I., Hyvönen, R., and Nilsson, T. (2008). Are Swedish forest soils sinks or sources for CO2-model analyses based on forest inventory data. Biogeochemistry 89, 139–149. doi: 10.1007/s10533-007-9151-x
Achat, D. L., Fortin, M., Landmann, G., Ringeval, B., and Augusto, L. (2015). Forest soil carbon is threatened by intensive biomass harvesting. Sci. Rep. 5, 1–10. doi: 10.1038/srep15991
Angst, G., Messinger, J., Greiner, M., Häusler, W., Hertel, D., Kirfel, K., et al. (2018). Soil organic carbon stocks in topsoil and subsoil controlled by parent material, carbon input in the rhizosphere, and microbial-derived compounds. Soil Biol. Biochem. 122, 19–30. doi: 10.1016/j.soilbio.2018.03.026
Ashwood, F., Watts, K., Park, K., Fuentes-Montemayor, E., Benham, S., and Vanguelova, E. (2019). Woodland restoration on agricultural land: long-term impacts on soil quality. Restor. Ecol. 27, 1381–1392. doi: 10.1111/rec.13003
Balharry, D. (1975). “Cairngorms national nature reserve,” in Glen More Forest Park, Ciarngorms (Forestry Commission Giude), ed D. A. Woodburn (Edinburgh: Her Majesty's Stationery Office), 119–122.
Bárcena, T. G., Kiaer, L. P., Vesterdal, L., Stefánsdóttir, H. M., Gundersen, P., and Sigurdsson, B. D. (2014). Soil carbon stock change following afforestation in Northern Europe: a meta-analysis. Glob. Chang. Biol. 20, 2393–2405. doi: 10.1111/gcb.12576
Bastin, J.-F., Finegold, Y., Garcia, C., Mollicone, D., Rezende, M., Routh, D., et al. (2019). The global tree restoration potential. Science 365, 76–79. doi: 10.1126/science.aax0848
Beckert, M. R., Smith, P., Lilly, A., and Chapman, S. J. (2016). Soil and tree biomass carbon sequestration potential of silvopastoral and woodland-pasture systems in North East Scotland. Agrofor. Syst. 90, 371–383. doi: 10.1007/s10457-015-9860-4
Benham, S. E., Vanguelova, E. I., and Pitman, R. M. (2012). Short and long term changes in carbon, nitrogen and acidity in the forest soils under oak at the Alice Holt environmental change network site. Sci. Total Environ. 421–422, 82–93. doi: 10.1016/j.scitotenv.2012.02.004
Berg, B., Johansson, M.-B., Nilsson, Å., Gundersen, P., and Norell, L. (2009). Sequestration of carbon in the humus layer of Swedish forests—direct measurements. Can. J. For. Res. 39, 962–975. doi: 10.1139/X09-022
Bivand, R., and Lewin-Koh, N. (2015). maptools: Tools for Reading and Handling Spatial Objects. Available online at: https://cran.r-project.org/web/packages/maptools/index.html (accessed May 15, 2020).
Brown, P., Broomfield, M., Cardenas, L., Choudrie, S., Jones, L., Karagianni, E., et al. (2019). UK Greenhouse Gas Inventory 1990 to 2012: Annual Report for Submission Under the Framework Convention. National Atmospheric Emission Inventory.
Brown, R., and O'Suillivain, P. E. (1975). “Loch molrich,” in Glen More Forest Park, Ciarngorms (Forestry Commission Giude), ed D. A. Woodburn (Edinburgh: Her Majesty's Stationery Office), 17–25.
Buchholz, T., Friedland, A. J., Hornig, C. E., Keeton, W. S., Zanchi, G., and Nunery, J. (2014). Mineral soil carbon fluxes in forests and implications for carbon balance assessments. GCB Bioenerg. 6, 305–311. doi: 10.1111/gcbb.12044
Cairngorms National Park Authority (2015). Cairngorm and Glenmore Strategy: Strategic Environmental Assessment Environmental Report December 2015 Appendix 2: Environmental Baseline Topic 6:Biodiversity, Fauna and Flora. Cairngorms National Park Authority.
Castellano, M. J., Mueller, K. E., Olk, D. C., Sawyer, J. E., and Six, J. (2015). Integrating plant litter quality, soil organic matter stabilization, and the carbon saturation concept. Glob. Chang. Biol. 21, 3200–3209. doi: 10.1111/gcb.12982
Chapman, S. J., Bell, J. S., Campbell, C. D., Hudson, G., Lilly, A., Nolan, A. J., et al. (2013). Comparison of soil carbon stocks in Scottish soils between 1978 and 2009. Eur. J. Soil Sci. 64, 455–465. doi: 10.1111/ejss.12041
Chapman, S. J., Campbell, C. D., and Puri, G. (2003). Native woodland expansion: soil chemical and microbiological indicators of change. Soil Biol. Biochem. 35, 753–764. doi: 10.1016/S0038-0717(03)00091-9
Chen, S., Arrouays, D., Angers, D. A., Manuel, P. M., and Walter, C. (2019). Soil carbon stocks under different land uses and the applicability of the soil carbon saturation concept. Soil Tillage Res. 188, 53–58. doi: 10.1016/j.still.2018.11.001
Coleman, K., and Jenkinson, D. S. (1996). “RothC-26.3–a model for the turnover of carbon in soil,” in Evaluation of Soil Organic Matter Models: Using Existing Long-Term Datasets, eds D. S. Powlson, P. Smith, and J. U. Smith (Berlin; Heidelberg: Springer), 237–246. doi: 10.1007/978-3-642-61094-3_17
Committee on Climate Change (2019). Reducing Emissions in Scotland: 2019 Progress Report 99. Committee on Climate Change.
De Vos, B., Cools, N., Ilvesniemi, H., Vesterdal, L., Vanguelova, E., and Carnicelli, S. (2015). Benchmark values for forest soil carbon stocks in Europe: results from a large scale forest soil survey. Geoderma 251–252, 33–46. doi: 10.1016/j.geoderma.2015.03.008
Diochon, A., Kellman, L., and Beltrami, H. (2009). Looking deeper: an investigation of soil carbon losses following harvesting from a managed northeastern red spruce (Picea rubens Sarg.) forest chronosequence. For. Ecol. Manage. 257, 413–420. doi: 10.1016/j.foreco.2008.09.015
Don, A., Rebmann, C., Kolle, O., Scherer-Lorenzen, M., and Schulze, E. D. (2009). Impact of afforestation-associated management changes on the carbon balance of grassland. Glob. Chang. Biol. 15, 1990–2002. doi: 10.1111/j.1365-2486.2009.01873.x
Dondini, M., Abdalla, M., Aini, F. K., Albanito, F., Beckert, M. R., Begum, K., et al. (2018). “Projecting soil C under future climate and land-use scenarios (modeling),” in Soil Carbon Storage, ed B. Singh (Elsevier Inc). doi: 10.1016/B978-0-12-812766-7.00009-3. Available online at: https://www.sciencedirect.com/science/article/pii/B9780128127667000111
Dondini, M., Hastings, A., Saiz, G., Jones, M. B., and Smith, P. (2009). The potential of Miscanthus to sequester carbon in soils: comparing field measurements in Carlow, Ireland to model predictions. GCB Bioenerg. 1, 413–425. doi: 10.1111/j.1757-1707.2010.01033.x
Edwards, C., and Mason, W. L. (2006). Stand structure and dynamics of four native Scots pine (Pinus sylvestris L.) woodlands in northern Scotland. Forestry 79, 261–277. doi: 10.1093/forestry/cpl014
Edwards, P. N., and Christie, J. M. (1981). Yield models for forest management. For. Comm. Bookl. 48:32.
Ellert, B. H., and Bettany, J. R. (1995). Calculation of organic matter and nutrients stored in soils under contrasting management regimes. Can. J. Soil Sci. 75, 529–538. doi: 10.4141/cjss95-075
Eusterhues, K., Rumpel, C., and Kögel-Knabner, I. (2005). Stabilization of soil organic matter isolated via oxidative degradation. Org. Geochem. 36, 1567–1575. doi: 10.1016/j.orggeochem.2005.06.010
Falloon, P., Smith, P., Bradley, R. I., Milne, R., Tomlinson, R., Viner, D., et al. (2006). RothCUK–a dynamic modelling system for estimating changes in soil C from mineral soils at 1-km resolution in the UK. Soil Use Manag. 22, 274–288. doi: 10.1111/j.1475-2743.2006.00028.x
Falloon, P., Smith, P., Coleman, K., and Marshall, S. (1998). Estimating the size of the inert organic matter pool from total soil organic carbon content for use in the Rothamsted carbon model. Science 30, 1207–1211. doi: 10.1016/S0038-0717(97)00256-3
FAO (2015). World Reference Base for Soil Resources 2014. International Soil Classification System for Naming Soils and Creating Legends for Soil Maps, World Soil Resources Reports No. 106. FAO.
Forest Research (2018). Forestry Statistics 2018, Chapter 1 Woodland Area and Planting. Forest Research, p. 1–36.
Fraser, J., and Innes, R. A. (1975). “Forests and plantations,” in Glen More Forest Park, Ciarngorms (Forestry Commission Giude), ed D. A. Woodburn (Edinburgh: Her Majesty's Stationery Office), 48–56.
Fukami, T., and Wardle, D. A. (2005). Long-term ecological dynamics: reciprocal insights from natural and anthropogenic gradients. Proc. Biol. Sci. 272, 2105–2115. doi: 10.1098/rspb.2005.3277
Gielen, B., De Vos, B., Campioli, M., Neirynck, J., Papale, D., Verstraeten, A., et al. (2013). Biometric and eddy covariance-based assessment of decadal carbon sequestration of a temperate Scots pine forest. Agric. For. Meteorol. 174–175, 135–143. doi: 10.1016/j.agrformet.2013.02.008
Gielen, B., Neirynck, J., Luyssaert, S., and Janssens, I. A. (2011). The importance of dissolved organic carbon fluxes for the carbon balance of a temperate Scots pine forest. Agric. For. Meteorol. 151, 270–278. doi: 10.1016/j.agrformet.2010.10.012
Härkönen, S., Lehtonen, A., Eerikäinen, K., Peltoniemi, M., and Mäkelä, A. (2011). Estimating forest carbon fluxes for large regions based on process-based modelling, NFI data and Landsat satellite images. For. Ecol. Manage. 262, 2364–2377. doi: 10.1016/j.foreco.2011.08.035
Haylock, M. R., Hofstra, N., Klein Tank, A. M. G., Klok, E. J., Jones, P. D., New, M. G., et al. (2008). A European daily high-resolution gridded dataset of surface temperature and precipitation. J. Geophys. Res. 113:D20119. doi: 10.1029/2008JD010201
Heinonen, T., Pukkala, T., Mehtätalo, L., Asikainen, A., Kangas, J., and Peltola, H. (2017). Scenario analyses for the effects of harvesting intensity on development of forest resources, timber supply, carbon balance and biodiversity of Finnish forestry. For. Policy Econ. 80, 80–98. doi: 10.1016/j.forpol.2017.03.011
Hiltbrunner, D., Zimmermann, S., and Hagedorn, F. (2013). Afforestation with Norway spruce on a subalpine pasture alters carbon dynamics but only moderately affects soil carbon storage. Biogeochemistry 115, 251–266. doi: 10.1007/s10533-013-9832-6
Hobbie, E. A., Ouimette, A. P., Schuur, E. A. G., Kierstead, D., Trappe, J. M., Bendiksen, K., et al. (2013). Radiocarbon evidence for the mining of organic nitrogen from soil by mycorrhizal fungi. Biogeochemistry 114, 381–389. doi: 10.1007/s10533-012-9779-z
Hollis, J. M. (2008). Unpublished Internal Report Prepared by Cranfield University for the Defra PS2225 Project. Cranfield University.
Hu, Y. L., Zeng, D. H., Ma, X. Q., and Chang, S. X. (2016). Root rather than leaf litter input drives soil carbon sequestration after afforestation on a marginal cropland. For. Ecol. Manage. 362, 38–45. doi: 10.1016/j.foreco.2015.11.048
Hudiburg, T. W., Law, B. E., Wirth, C., and Luyssaert, S. (2011). Regional carbon dioxide implications of forest bioenergy production. Nat. Clim. Chang. 1, 419–423. doi: 10.1038/nclimate1264
ISO (2009). Soil Quality – Determination of Particle Size Distribution in Mineral Soil Material – Method by Sieving and Sedimentation. Available online at: https://www.iso.org/obp/ui/#isotd:iso:11277:ed-2:v1:en
Jackson, R. B., Canadell, J., Ehleringer, J. R., Mooney, H. A., Sala, O. E., and Schulze, E. D. (1996). A global analysis of root distributions for terrestrial biomes. Oecologia 108, 389–411. doi: 10.1007/BF00333714
James, J., and Harrison, R. (2016). The effect of harvest on forest soil carbon: a meta-analysis. Forests 7:308. doi: 10.3390/f7120308
Jandl, R., Lindner, M., Vesterdal, L., Bauwens, B., Baritz, R., Hagedorn, F., et al. (2007). How strongly can forest management influence soil carbon sequestration? Geoderma 137, 253–268. doi: 10.1016/j.geoderma.2006.09.003
Jandl, R., Rodeghiero, M., Martinez, C., Cotrufo, M. F., Bampa, F., van Wesemael, B., et al. (2014). Current status, uncertainty and future needs in soil organic carbon monitoring. Sci. Total Environ. 468–469, 376–383. doi: 10.1016/j.scitotenv.2013.08.026
Janssens, I. A., Freibauer, A., Schlamadinger, B., Ceulemans, R., Ciais, P., Dolman, A. J., et al. (2004). The carbon budget of terrestrial ecosystems at country-scale andndash; a European case study. Biogeosci. Discuss. 1, 167–193. doi: 10.5194/bgd-1-167-2004
Kaipainen, T., Liski, J., Pussinen, A., and Karjalainen, T. (2004). Managing carbon sinks by changing rotation length in European forests. Environ. Sci. Policy 7, 205–219. doi: 10.1016/j.envsci.2004.03.001
Kristensen, T., Ohlson, M., Bolstad, P., and Nagy, Z. (2015). Spatial variability of organic layer thickness and carbon stocks in mature boreal forest stands—implications and suggestions for sampling designs. Environ. Monit. Assess. 187:521. doi: 10.1007/s10661-015-4741-x
Lilly, A., Chapman, S. J., Perez-Fernandez, E., and Potts, J. (2016). Changes to C Stocks in Scottish Soils due to Afforestation. Aberdeen: Forestry Commission.
Lippke, B., Oneil, E., Harrison, R., Skog, K., Gustavsson, L., and Sathre, R. (2011). Life cycle impacts of forest management and wood utilization on carbon mitigation: knowns and unknowns. Carbon Manag. 2, 303–333. doi: 10.4155/cmt.11.24
Macpherson Grant, A. (1975). “History and tradition,” in Glen More Forest Park, Ciarngorms (Forestry Commission Giude), ed D. A. Woodburn (Edinburgh: Her Majesty's Stationery Office), 4–7.
Magnusson, R. I., Tietema, A., Cornelissen, J. H. C., Hefting, M. M., and Kalbitz, K. (2016). Tamm review: sequestration of carbon from coarse woody debris in forest soils. For. Ecol. Manage. 377, 1–15. doi: 10.1016/j.foreco.2016.06.033
Mason, B., Perks, M. P., and Mason, W. L. (2011). Sitka spruce (Picea sitchensis) forests in Atlantic Europe: changes in forest management and possible consequences for carbon sequestration. Scand. J. For. Res. 26, 72–81. doi: 10.1080/02827581.2011.564383
Matthews, R. W., Henshall, P. A., Jenkins, T. A. R., Mackie, E. D., and Dick, E. C. (2016a). Forest Yield: A PC-Based Yield Model for Forest Management in Britain. User Manual. Edinburgh: Forestry Commission.
Matthews, R. W., Jenkins, T. A. R., Mackie, E. D., and Dick, E. C. (2016b). Forest Yield: A Handbook on Forest Growth and Yield Tables for British Forestry. Edinburgh: Forestry Commission.
Meir, P., Cox, P., and Grace, J. (2006). The influence of terrestrial ecosystems on climate. Trends Ecol. Evol. 21, 254–260. doi: 10.1016/j.tree.2006.03.005
Morison, J., Matthews, R., Miller, G., Perks, M., Randle, T., Vanguelova, E., et al. (2012). Understanding the Carbon and Greenhouse Gas Balance of Forests in Britain. Report, Forestry Commission.
Nave, L. E., Swanston, C. W., Mishra, U., and Nadelhoffer, K. J. (2013). Afforestation effects on soil carbon storage in the United States: a synthesis. Soil Sci. Soc. Am. J. 77:1035. doi: 10.2136/sssaj2012.0236
Nave, L. E., Vance, E. D., Swanston, C. W., and Curtis, P. S. (2010). Harvest impacts on soil carbon storage in temperate forests. For. Ecol. Manage. 259, 857–866. doi: 10.1016/j.foreco.2009.12.009
Noormets, A., Epron, D., Domec, J. C., McNulty, S. G., Fox, T., Sun, G., et al. (2015). Effects of forest management on productivity and carbon sequestration: a review and hypothesis. For. Ecol. Manage. 355, 124–140. doi: 10.1016/j.foreco.2015.05.019
Olajuyigbe, S. O., Tobin, B., Gardiner, P., and Nieuwenhuis, M. (2011). Stocks and decay dynamics of above- and belowground coarse woody debris in managed sitka spruce forests in ireland. For. Ecol. Manage. 262, 1109–1118. doi: 10.1016/j.foreco.2011.06.010
Ostonen, I., Lõhmus, K., Helmisaari, H. S., Truu, J., and Meel, S. (2007). Fine root morphological adaptations in Scots pine, Norway spruce and silver birch along a latitudinal gradient in boreal forests. Tree Physiol. 27, 1627–1634. doi: 10.1093/treephys/27.11.1627
Ota, M., Nagai, H., and Koarashi, J. (2013). Root and dissolved organic carbon controls on subsurface soil carbon dynamics: a model approach. J. Geophys. Res. Biogeosci. 118, 1646–1659. doi: 10.1002/2013JG002379
Palosuo, T., Foereid, B., Svensson, M., Shurpali, N., Lehtonen, A., Herbst, M., et al. (2012). A multi-model comparison of soil carbon assessment of a coniferous forest stand. Environ. Model. Softw. 35, 38–49. doi: 10.1016/j.envsoft.2012.02.004
Palviainen, M., and Finér, L. (2015). Decomposition and nutrient release from Norway spruce coarse roots and stumps–A 40-year chronosequence study. For. Ecol. Manage. 358, 1–11. doi: 10.1016/j.foreco.2015.08.036
Palviainen, M., Finér, L., Laiho, R., Shorohova, E., Kapitsa, E., and Vanha-Majamaa, I. (2010). Carbon and nitrogen release from decomposing Scots pine, Norway spruce and silver birch stumps. For. Ecol. Manage. 259, 390–398. doi: 10.1016/j.foreco.2009.10.034
Paul, K. I., Polglase, P. J., and Richards, G. P. (2003). Predicted change in soil carbon following afforestation or reforestation, and analysis of controlling factors by linking a C accounting model (CAMFor) to models of forest growth (3PG), litter decomposition (GENDEC) and soil C turnover (RothC). For. Ecol. Manage. 177, 485–501. doi: 10.1016/S0378-1127(02)00454-1
Pinheiro, J., Bates, D., DebRoy, S., and Sarkar, D. (2007). nlme: Linear and Nonlinear Mixed Effects Models. R Package version 3, 1–97.
Pinheiro, J., Bates, D., DebRoy, S., Sarkar, D., and R Core Team. (2017). nlme: Linear and Nonlinear Mixed Effects Models. Available online at: https://cran.r-project.org/web/packages/nlme/index.html (accessed December 12, 2020).
Poeplau, C., and Don, A. (2013). Sensitivity of soil organic carbon stocks and fractions to different land-use changes across Europe. Geoderma 192, 189–201. doi: 10.1016/j.geoderma.2012.08.003
Poeplau, C., Don, A., Vesterdal, L., Leifeld, J., Van Wesemael, B., Schumacher, J., et al. (2011). Temporal dynamics of soil organic carbon after land-use change in the temperate zone-carbon response functions as a model approach. Glob. Chang. Biol. 17, 2415–2427. doi: 10.1111/j.1365-2486.2011.02408.x
Powers, D. M., Kolka, R. K., Bradford, J. B., Palik, B. J., Fraver, S., and Jurgensen, M. F. (2012). Carbon stocks across a chronosequence of thinned and unmanaged red pine (Pinus resinosa) stands. Ecol. Appl. 22, 1297–1307. doi: 10.1890/11-0411.1
Powers, R. F., Scott, D. A., Sanchez, F. G., Voldseth, R. A., Page-Dumroese, D., Elioff, J. D., et al. (2005). The North American long-term soil productivity experiment: findings from the first decade of research. For. Ecol. Manage. 220, 31–50. doi: 10.1016/j.foreco.2005.08.003
Prest, D., Kellman, L., and Lavigne, M. B. (2014). Mineral soil carbon and nitrogen still low three decades following clearcut harvesting in a typical Acadian forest stand. Geoderma 214–215, 62–69. doi: 10.1016/j.geoderma.2013.10.002
Pukkala, T. (2018). Carbon forestry is surprising. For. Ecosyst. 5, 1–11. doi: 10.1186/s40663-018-0131-5
R Core Team (2017). R: A Language and Environment for Statistical Computing. R Foundation for Statistical Computing. Available online at: https://www.r-project.org/ (accessed April 1, 2017).
Reidy, B., and Bolger, T. (2013). Soil carbon stocks in a sitka spruce chronosequence following afforestation. Irish For. 70, 200–219. Available online at: https://t-stor.teagasc.ie/handle/11019/582
Richter, D. D. B., Hofmockel, M., Callaham, M. A., and Powlson, D. S. (2007). Long-term soil experiments: keys to managing earth's rapidly changing ecosystems. Soil Sci. Soc. Am. J. 2, 266–279. doi: 10.2136/sssaj2006.0181
Rumpel, C., Balesdent, J., Grootes, P., Weber, E., and Kögel-Knabner, I. (2003). Quantification of lignite- and vegetation-derived soil carbon using 14C activity measurements in a forested chronosequence. Geoderma 112, 155–166. doi: 10.1016/S0016-7061(02)00302-6
Rumpel, C., Eusterhues, K., and Kögel-Knabner, I. (2004). Location and chemical composition of stabilized organic carbon in topsoil and subsoil horizons of two acid forest soils. Soil Biol. Biochem. 36, 177–190. doi: 10.1016/j.soilbio.2003.09.005
Rumpel, C., and Kögel-Knabner, I. (2011). Deep soil organic matter-a key but poorly understood component of terrestrial C cycle. Plant Soil 338, 143–158. doi: 10.1007/s11104-010-0391-5
Sierra, C. A., and Muller, M. (2015). A general mathematical framework for representing soil organic matter dynamics. Ecol. Monogr. 85, 505–524. doi: 10.1890/15-0361.1
Smith, J., Smith, P., Wattenbach, M., Zaehle, S., Hiederer, R., Jones, R. J. A., et al. (2005). Projected changes in mineral soil carbon of European croplands and grasslands, 1990–2080. Glob. Chang. Biol. 11, 2141–2152. doi: 10.1111/j.1365-2486.2005.001075.x
Smith, P., Davies, C. A., Ogle, S., Zanchi, G., Bellarby, J., Bird, N., et al. (2012). Towards an integrated global framework to assess the impacts of land use and management change on soil carbon: current capability and future vision. Glob. Chang. Biol. 18, 2089–2101. doi: 10.1111/j.1365-2486.2012.02689.x
Smith, P., Fang, C., Dawson, J. J. C., and Moncrieff, J. B. (2008). Impact of global warming on soil organic carbon. Adv. Agron. 97, 1–43. doi: 10.1016/S0065-2113(07)00001-6
Smout, T. C. (2003). People and Woods in Scotland: A History. Edinburgh: Edinburgh University Press.
Smout, T. C., and Lambert, R. A. (1999). Rothiemurchus: Nature and People on a Highland Estate, 1500-2000. Dalkeith Scotland: Scottish Cultural Press.
Smout, T. C., MacDonald, A. R., and Watson, F. (2007). “Rothiemurchus, 1650–1900,” in A History of the Native Woodlands of Scotland 1500-1920 (Edinburgh: Edinburgh University Press), 290–318. doi: 10.3366/edinburgh/9780748612413.003.0011. Available online at: https://b-ok.asia/ireader/902177
Summers, R. W., Mavor, R. A., MacLennan, A. M., and Rebecca, G. W. (1999). The structure of ancient native pinewoods and other woodlands in the Highlands of Scotland. For. Ecol. Manage. 119, 231–245. doi: 10.1016/S0378-1127(98)00515-5
The Scottish Government (2018). Scottish Greenhouse Gas Emissions 2016. Edinburgh: The Scottish Government.
The Scottish Government (2019). Scotland's Forestry Strategy 2019-2029. Edinburgh: The Scottish Government.
Thuille, A., and Schulze, E. D. (2006). Carbon dynamics in successional and afforested spruce stands in Thuringia and the Alps. Glob. Chang. Biol. 12, 325–342. doi: 10.1111/j.1365-2486.2005.01078.x
Tupek, B., Launiainen, S., Peltoniemi, M., Sievänen, R., Perttunen, J., Kulmala, L., et al. (2019). Evaluating century and yasso soil carbon models for CO2 emissions and organic carbon stocks of boreal forest soil with Bayesian multi-model inference. Eur. J. Soil Sci. 70, 847–858. doi: 10.1111/ejss.12805
Vanguelova, E., Nortcliff, S., Moffat, A. J., and Kennedy, F. (2007). Short-term effects of manipulated increase in acid deposition on soil, soil solution chemistry and fine roots in Scots pine (Pinus sylvestris) stand on a podzol. Plant Soil 294, 41–54. doi: 10.1007/s11104-007-9225-5
Vanguelova, E. I., Bonifacio, E., De Vos, B., Hoosbeek, M. R., Berger, T. W., Vesterdal, L., et al. (2016). Sources of errors and uncertainties in the assessment of forest soil carbon stocks at different scales-review and recommendations. Environ. Monit. Assess. 188:630. doi: 10.1007/s10661-016-5608-5
Vanguelova, E. I., Crow, P., Benham, S., Pitman, R., Forster, J., Eaton, E. L., et al. (2019). Impact of Sitka spruce (Picea sitchensis (Bong.) Carr.) afforestation on the carbon stocks of peaty gley soils–a chronosequence study in the north of England. For. An Int. J. For. Res. 92, 242–252. doi: 10.1093/forestry/cpz013
Vanguelova, E. I., Nisbet, T. R., Moffat, A. J., Broadmeadow, S., Sanders, T. G. M., and Morison, J. I. L. (2013). A new evaluation of carbon stocks in British forest soils. Soil Use Manag. 29, 169–181. doi: 10.1111/sum.12025
Vesterdal, L., Leifeld, J., Poeplau, C., Don, A., and van Wesemael, B. (2011). “Land-use change effects on soil carbon stocks in temperate regions–development of carbon response functions,” in Soil Carbon in Sensitive European Ecosystems: From Science to Land Management, eds R. Jandl, R. Mirco, and M. Olsson (John Wiley and Sons, Ltd). doi: 10.1002/9781119970255.ch3
Walton, J. (1975). “The plant life of the park,” in Glen More Forest Park, Ciarngorms (Forestry Commission Giude), ed D. A. Woodburn (Edinburgh: Her Majesty's Stationery Office), 26–30.
Watson, A. (2012). “Landforms and soils,” in Human Impacts on the Northern Cairngorms (Northants: Paragon Publishing, Rothersthorpe), 26–38.
Wickham, H. (2009). ggplot2 Elegant Grpahics for Data Analysis, 1st Edn. New York, NY: Springer-Verlag.
Wiesmeier, M., Urbanski, L., Hobley, E., Lang, B., von Lützow, M., Marin-Spiotta, E., et al. (2019). Soil organic carbon storage as a key function of soils-a review of drivers and indicators at various scales. Geoderma 333, 149–162. doi: 10.1016/j.geoderma.2018.07.026
Wood, S. N. (2011). Fast stable restricted maximum likelihood and marginal likelihood estimation of semiparametric generalized linear models. J. R. Stat. Soc. Ser. B Stat. Methodol. 73, 3–36. doi: 10.1111/j.1467-9868.2010.00749.x
Zerva, A., Ball, T., Smith, K. A., and Mencuccini, M. (2005). Soil carbon dynamics in a Sitka spruce (Picea sitchensis (Bong.) Carr.) chronosequence on a peaty gley. For. Ecol. Manage. 205, 227–240. doi: 10.1016/j.foreco.2004.10.035
Zimmermann, M., Leifeld, J., Schmidt, M. W. I., Smith, P., and Fuhrer, J. (2007). Measured soil organic matter fractions can be related to pools in the RothC model. Eur. J. Soil Sci. 58, 658–667. doi: 10.1111/j.1365-2389.2006.00855.x
Keywords: soil organic carbon (SOC), forest, pine, afforestation, RothC model, Scotland, sandy acidic soils
Citation: Ražauskaitė R, Vanguelova E, Cornulier T, Smith P, Randle T and Smith JU (2020) A New Approach Using Modeling to Interpret Measured Changes in Soil Organic Carbon in Forests; The Case of a 200 Year Pine Chronosequence on a Podzolic Soil in Scotland. Front. Environ. Sci. 8:527549. doi: 10.3389/fenvs.2020.527549
Received: 16 January 2020; Accepted: 30 September 2020;
Published: 16 November 2020.
Edited by:
Frank Hagedorn, Swiss Federal Institute for Forest, Snow and Landscape Research (WSL), SwitzerlandReviewed by:
Achouak Arfaoui, Ecole Supérieure d'Ingénieurs de Medjez El Bab, TunisiaGerrit Angst, Institute of Soil Biology (ASCR), Czechia
Copyright © 2020 Ražauskaitė, Vanguelova, Cornulier, Smith, Randle and Smith. This is an open-access article distributed under the terms of the Creative Commons Attribution License (CC BY). The use, distribution or reproduction in other forums is permitted, provided the original author(s) and the copyright owner(s) are credited and that the original publication in this journal is cited, in accordance with accepted academic practice. No use, distribution or reproduction is permitted which does not comply with these terms.
*Correspondence: Rita Ražauskaitė, rita.razauskaite@gmail.com