
Abstract
The magnetic diagnostic system at the optimized stellarator experiment Wendelstein 7-X (W7-X) includes a total number of 125 Mirnov coils, which are mounted at the inner plasma vessel wall. A wide range of expected signal amplitudes, frequencies and mode numbers is covered to account for the complex three-dimensional geometry of W7-X. The performed amplitude and phase calibration of individual coils including all relevant data acquisition system components allows a detailed spectral and mode analysis. The damped multiple signal classification method and stochastic system identification techniques are shortly described and applied. Two observations are emphasized within this work. Firstly, independent of magnetic configuration and heating scenario (electron cyclotron resonance heating and/or neutral beam injection), broadband fluctuations around 180 kHz have been measured. The nature of these fluctuations is possibly associated with ellipticity-induced Alfvén eigenmodes in the outer regions of the plasma. The latter was inferred by studying corresponding theoretically predicted Alfvén continua calculated with the 3D-MHD continuum code CONTI. Secondly, fast collapses of plasma current and energy, which occurred during recent operational phases at W7-X, show a clear magnetic signature. Short time scale Alfvénic bursts are revealed, which are induced during these sawtooth-like collapses.
Export citation and abstract BibTeX RIS

Original content from this work may be used under the terms of the Creative Commons Attribution 4.0 license. Any further distribution of this work must maintain attribution to the author(s) and the title of the work, journal citation and DOI.
1. Introduction
The third operational phase at the superconducting, optimized stellarator Wendelstein 7-X (W7-X, Greifswald, Germany) [1–3] ended in October 2018 and the machine is now being prepared for the upcoming high energy and long plasma pulse campaigns. So far the experiments could already successfully demonstrate important aspects of the optimization criteria [4–8], in particular the minimization of self-generated plasma currents [9, 10] and the reduction of neoclassical transport [11]. For fusion relevant long-pulse operation of up to 1800 s with high plasma beta of up to 5% the establishment of a good fast particle confinement scenario [12, 13] remains essential. However, fast particles, which are e.g. generated via high power neutral beam injection (NBI, [14]) or ion cyclotron resonance heating (ICRH, [15]), can excite Alfvén waves [16] and drive associated Alfvén eigenmodes (AEs). They have been observed and studied at a number of different fusion relevant experiments [17–22], including the partly optimized predecessor of W7-X, the advanced Wendelstein 7-AS stellarator [23]. An impact of AE activity on fast ion confinement is often observed in tokamaks [24–27] and also in stellarators due to the existence of stellarator-specific modes [28–30]. Resulting enhanced transport processes can lead to an increased loss of high energetic particles, which could affect diagnostic components [31] or severely damage the plasma vessel [32]. A substantial degradation of the plasma heating efficiency and of the overall plasma confinement would be the consequence.
During the last decade major improvements have been achieved in terms of developing a perturbative theory of AE. Common assumptions and predictions of the observed AE dynamic were adapted to the complex three-dimensional geometry of optimized stellarator experiments and a number of expected, dominant AE types were identified [33]. In order to sufficiently support the investigation of related fast dynamic processes and in particular to measure fluctuations of plasma density, temperature and magnetic field, a variety of different diagnostics were implemented at W7-X and went into operation during the recent campaigns. Table 1 summarizes relevant systems and gives an overview of their general capabilities. The soft x-ray multi-camera tomography system (XMCTS, [34]) measures soft x-ray radiation emitted from the plasma along 360 lines-of-sight. The spatial emission pattern in the poloidal cross section is obtained by tomographic reconstruction. Beryllium filters are used to select the energy range above 1 keV. Due to technical restrictions the bandwidth is currently limited to  0.1 MHz, but will be improved for future campaigns. Since the system is located at a fixed toroidal position at half module (HM) 11 (magenta triangles in figure 1(a)), it offers radial and poloidal resolution. The phase contrast imaging system (PCI, [35]) images line integrated absolute electron density fluctuations via changes of the refractive index, which act as a phase grid that scatters an incident laser beam. The location (HM50) and line-of-sight view is indicated in figure 1(a) as a green line. To study radial temperature profiles and fluctuations the electron cyclotron emission diagnostic (ECE, [36]) has been put into operation since the first campaign at W7-X (position in HM41 and line-of-sight view marked as a black line in figure 1(a)). The diagnostic comprises a radiometer with 32 channels that measures radiation around the second cyclotron resonance, i.e. emission between 125 and 165 GHz. The sampling rate of all described diagnostics is 2 MHz. We note that measurements, which were made by the Doppler reflectometry systems (HM21 and HM51, [37]) and the Langmuir or electromagnetic probes (incorporated in the probe heads of the multi-purpose probe manipulator, HM40, [38, 39]) also contribute to investigations of fluctuating plasma quantities as it is discussed in the given references.
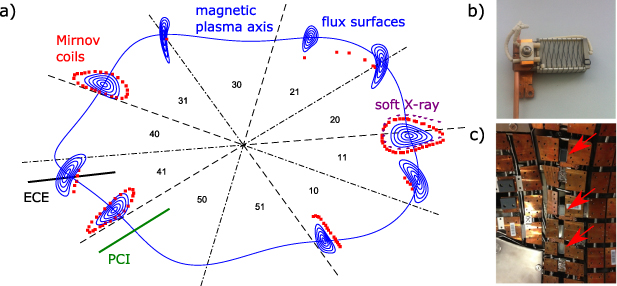
Figure 1. (a) Installed Mirnov coil arrays in W7-X (red squares). The numbering of the half modules (HM), the magnetic plasma axis (blue line) and flux surfaces at distinct toroidal locations (blue loops) are included. It is noted that the apparent overlap of flux surfaces with coil locations is merely a projection artifact. Also indicated are the line-of-sight views of the PCI (green line, HM50) and ECE (black line, HM41) diagnostics as well as the camera system of the soft x-ray diagnostic (magenta triangles, HM11). (b) individual Mirnov coil, (c) inner wall segment of W7-X including three installed Mirnov coils (pointed at by red arrows).
Download figure:
Standard image High-resolution imageTable 1. Comparison of basic operational parameters of different fluctuations diagnostics—Mirnov coils, soft-x-ray multi-camera tomography system (XMCTS), phase contrast imaging (PCI), electron cyclotron emission diagnostic (ECE). All diagnostic systems measure with a sampling rate of 2 MHz.
| Diagnostic | Bandwidth | Resolution |
|---|---|---|
| Mirnov |
 0.8 MHz 0.8 MHz | Poloidal/toroidal |
| XMCTS |
 0.1 MHz 0.1 MHz | Radial/poloidal |
| PCI |
 1 MHz 1 MHz | Poloidal |
| ECE |
 1 MHz 1 MHz | Radial |
In the context of this paper we focus on the magnetic fluctuation diagnostic consisting of 125 Mirnov coils in total (figure 1(a), red squares). Mirnov coils are well-known and often used in plasma experiments of all kinds. The measurement principle is relatively simple and the measurements are usually very reliable. Basically the amplitude, phase and frequency resolution of the directly observable magnetic fluctuations is determined by the dimensions of an individual coil and the number of windings. Finally the actual technical realization and the design of the corresponding electronics dictates the resulting sensitivity of a coil. The number and arrangement of the coils provides the achievable poloidal and toroidal mode resolution. This work describes the diagnostic capabilities, calibration and data evaluation procedures. Subsequently important observations made by the Mirnov diagnostic at W7-X during the recent campaigns are discussed. Section 2 gives an overview of the installation inside the plasma vessel. A description of the data acquisition system (DAQ) as well as newly performed calibrations of the Mirnov diagnostic follows. Relevant applied data analysis tools are introduced. In section 3 typical observations during plasma experiments in OP1.2 are presented to demonstrate the diagnostic capability. Therefore two aspects have been chosen, where Mirnov coil measurements and corresponding theoretical calculations contribute to ongoing investigations concerning plasma dynamics and stability of neoclassically optimized W7-X plasma configurations. Firstly Alfvénic broadband activity in a frequency range around 200 kHz is discussed. These magnetic fluctuations have been detected within a variety of different plasma scenarios. Although their amplitude is often weak, evidence is found that they are caused by ellipticity-induced Alfvén eigenmodes (EAE). Secondly, abrupt collapses of plasma current and energy have been detected in specific plasma scenarios involving externally driven toroidal currents via electron cyclotron current drive (ECCD) [40]. These sawtooth-like crashes significantly affect the stability of the plasma and even led to a number of fast total collapses, which could cause critical damage of vital parts of the machine and diagnostics in future high-energy plasmas. The analysis of their magnetic footprint (i.e. short time scale Alfvénic bursts) detected by the Mirnov coils contributes to ongoing related investigations. Basically both broadband fluctuation activity and short time scale magnetic bursts have been observed and analyzed in the past at other fusion relevant experiments [41, 42], although details regarding the frequency range and mode type and structure as well as the driving mechanism might differ. This paper concludes with a discussion and a summary in sections 4 and 5, respectively.
2. Commissioning of the Mirnov diagnostic
2.1. Experimental setup
125 individual Mirnov coils are installed in four out of five toroidal modules (red squares in figure 1(a)). They are located at the inner wall of the plasma vessel between CuCrZr heat shield elements (figure 1(c)). During plasma operation the coils are covered by graphite wall protection panels (not shown here). The harsh environment of the fusion experiment W7-X in terms of space, geometry and material constraints leads to demanding requirements for the technical realization of individual coils, signal cable shielding and routing. Figure 1(b) depicts a single coil with two layers (9 windings each) of an insulating, high temperature resistant Constantan®wire wound on a ceramic coil former (height 15 mm, width 26 mm, length 43 mm) resulting in a low self-inductance of ∼3.7 µH. The ceramic body has a high heat conductivity to avoid critical temperature gradients within the material and to provide sufficient cooling by attaching the coils to the water-cooled inner wall components. Between the two winding layers of the coil a center tap is directly connected to the plasma vessel ground to prevent potential DC charging during plasma operation. The twisted-pair signal cables are guided within a copper pipe toward the closest distribution box inside the plasma vessel behind the plasma facing components. Here the signal cables of nearby coils are bundled and routed within copper pipes to a vacuum port with suitable electrical feedthroughs. More details and specifications, describing design and construction of the coils as well as used materials, can be found in [43]. The design covers a wide dynamic range with respect to amplitude levels and relevant frequencies (table 2) as well as complex mode structure detection capability due to the arrangement of the individual coils (figure 1(a)).
Table 2. Relevant operational parameter for the Mirnov coil system, where the typically expected relative fluctuation amplitude is defined as δB/B0, with the magnetic fluctuations δB and the main magnetic field B0. m, n refer to poloidal and toroidal mode numbers, respectively.
| Number of installed coils | 125 |
| Frequency range | 1–800 kHz |
| Relative fluctuation amplitudes | 10−5–10−3 |
| Maximum induced voltage | ≈1 V |
| Mode resolution | m ≈ 20, n ≈ 10 |
The DAQ of the Mirnov diagnostic is build upon ATCA (advanced telecommunications computing architecture) ADC (analog to digital converter module) boards [44]. The technology is specifically capable of recording with high data rate in the quasi-steady state long-pulse operation at W7-X (planned up to 1800 s). It is similar compared to the DAQ systems of the magnetic equilibrium diagnostics [45] without the countermeasures against signal drifts, which become relevant for long-time integrated signals. The Mirnov coils are constructed to measure AC fluctuations above 1 kHz, therefore the compensation of DC-drifts can be neglected. In total four ATCA boards are distributed on two electrical racks, each board involving 32 measurement channels. A single signal, which is recorded in-vessel by an individual coil, is amplified by a pre-amplifier close to the feedthrough directly at the vacuum port to minimize loss of information over the 90–120 m long signal cables toward the diagnostic racks. The Mirnov DAQ is fully integrated into the general W7-X operational control system in a way that centrally pre-programmed experiments automatically start and stop the measurement and a timing module ensures synchronization with the general W7-X time. A specifically designed software, which is operated on a measurement PC, combines in total up to 64 individual channels of measured data with synchronized time stamps and transfers them to the W7-X archive data base. The individual components of the signal chain are depicted in figure 2.

Figure 2. Relevant components of Mirnov diagnostic system: (1) Mirnov coil installed in plasma vessel, (2) vacuum feedthrough, (3) pre-amplifier (maximal 1 m distance to the feedthrough), (4) long signal cables between torus hall and rack room (90–120 m), (5) signal receiver and power supply for pre-amplifier, (6) converter panel, (7) ATCA board including individual measurement ADCs, (8) Timing module, (9) PC.
Download figure:
Standard image High-resolution image2.2. Amplitude and phase calibration
An essential part of the diagnostic commissioning represents the calibration of the Mirnov diagnostic system. It has been performed step-wise individually for all relevant components (depicted in figure 2) determining the signal path of the coils measurements. Starting at the pick-up coil (figure 2, (1)), the signal cables are routed within copper pipes toward the closest vacuum feedthrough (figure 2, (2)). The low amplitude measurement signals are pre-amplified (figure 2, (3)) before they enter the DAQ in the electronic rack via 90–120 m long cables (figure 2, (4)). The individual DAQ components (figure 2, (5) signal receiver and power supply for pre-amplifier, (6) converter panel, (7) ATCA board including individual measurement ADCs), which are directly involved in the signal path, were also calibrated separately. Finally the timing module and the PC are labeled in figure 2 as (8) and (9), respectively.
The calibration measurement of the DAQ electronics was achieved by sending a differential sine signal of constant frequency, supplied by a function generator, to each of the relevant components via a transmitter (figure 3(a)) and detecting the response signal with a corresponding receiver (figure 3(b)). Electrical connectors and adapters (BNC, RJ45, LEMO—not shown here) of each individual DAQ component, the Mirnov coil signal cables and an oscilloscope were chosen to match both the electrical output of the transmitter (E-out) and the electrical input of the receiver (E-in). A PC, connected to the oscilloscope, was then used to automatically compare the received signal to the transmitted signal regarding amplitude and phase shift. The frequency of the supplied signal was increased step-wise (one hundred steps from 1 kHz to 1 MHz) and the amplitude was kept constant at 500 mVpp. The gain and phase response of the calibration setup itself has been determined (figure 3(c)) and corrected for in the final calibration curves for each component. The calibration procedure has been repeated at least ten times for an individual coil, which results in an accuracy of  1% and ≈1° regarding the amplitude and phase shift, respectively.

Figure 3. (a) transmitter and (b) receiver circuit, which have been used for calibration. The component values are: R1 = 500 Ω, R2 = 1 kΩ, R3 = 50 Ω, R4 = 100 Ω, R5 = 475 Ω, C1 = 0.1 µF, C2 = 10 µF (c) gain and phase response of the transmitter and receiver setup (E-out directly connected to E-in).
Download figure:
Standard image High-resolution imageFigures 4(a) and (b) show frequency dependent calibration curves of an example Mirnov coil QXM10CE040, which is located in HM10 at the outboard side. An almost constant frequency response for the gain and phase shift of the combined power supply and converter panel (i.e. the rack electronics, blue dashed curves in figure 4(a) and (b)) has been obtained. The phase shift slightly rises ( deg) for frequencies
  500 kHz. The characteristics of the pre-amplifier (solid red curves) and the long signal cables from the torus hall to the electronic rack (magenta dotted curves), however, are significant. They clearly dominate the resulting sensitivity and phase shift curves shown in figures 4(c) and (d), where the individual component calibration curves have been combined numerically. It is noted that each individual Mirnov coil was calibrated in a Helmholtz test-stand in a laboratory before installation [43]. It was found that the frequency response of the relevant poloidal pick-up direction shows an almost constant amplitude gain and phase shift in the frequency range from 1 to 1000 kHz (green dash-dotted curves in figure 4(a) and (b)).
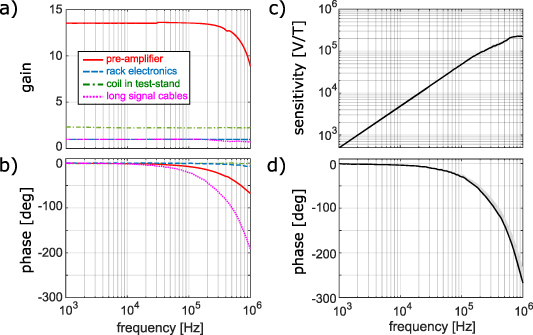
Figure 4. (a) Gain and (b) phase shift of individual DAQ components, i.e. the previously performed calibration of the coil in a Helmholtz test-stand (dash-dotted green lines), pre-amplifier (solid red lines), rack electronics (dashed blue lines) including power supply and converter panel and the long signal cables (dotted magenta lines) (c) final sensitivity and (d) phase shift of a single Mirnov coil considering (a) and (b). Exemplarily the curves are shown for the Mirnov coil QXM10CE040. The gray shaded area in sensitivity (barely visible) and phase indicates the variation considering many different coils, as it is described in the text.
Download figure:
Standard image High-resolution imageComparing the calibration curves of different coils, we find a variation in sensitivity and phase shift, which is indicated by the gray shaded area in figures 4(c) and (d). For the sensitivity a change of up to 10% above 200 kHz between different coils is derived (The gray shaded area in figure 4(c) is barely visible in this representation.). The phase shift variation is up to  for frequencies
  100 kHz (gray shaded area in figure 4(d)). The effect of the 90–120 m long signal cables from pre-amplifier at the vacuum feedthrough to the electronic rack is mainly responsible for the differences between individual coils.
2.3. Data analysis techniques
Advanced spectral as well as mode analysis techniques are applied to measured data and are accompanied by numerical calculations, which model the structure of possible stable and unstable modes considering the complex three-dimensional geometry of W7-X. A detailed description of the theoretical approach and used simulation codes to identify the nature of the observed MHD fluctuations is given in [46, 47]. The following paragraph summarizes the tools, which are relevant in the context of this work and emphasizes newly implemented improvements.
A standard non-parametric FFT algorithm is used to calculate spectrograms of measured time traces by single Mirnov coils. Considering the variety of events observed on very short time scales (e.g. pellet [48] and Tespel injection [49] or sawtooth-like plasma crashes due to externally driven plasma currents [40]) and in case of partly weak Alfvénic broadband fluctuation activity, the simple FFT analysis often remains insufficient in terms of frequency resolution versus time range length [50]. Therefore in addition the advanced parametric DMusic algorithm (Damped Multiple signal classification [51–53]) is used for calculating spectrograms. Features of interest, which are barely visible in standard FFT spectrograms, can become much more clearly pronounced, whereas in the corresponding context other less important features may fade or even vanish. That allows a significantly more profound follow-up analysis, e.g. for identifying complex mode structures related to certain frequency regimes.
For the latter the SSI method (Stochastic System Identification, [53–55]) is adapted to calculate mode number spectra. The implementation of the basic SSI algorithm has been complemented by an interface, which is specifically tailored to process measurements of poloidally and toroidally arranged Mirnov coils.
The three dimensional ideal MHD continuum code CONTI [56] is used to identify the type of the observed AE. Based on a numerical equilibrium provided by the VMEC code [57, 58], considering pressure profiles, which are e.g. measured by the Thomson scattering diagnostic [59], CONTI calculates the continuous frequency spectrum of Alfvén waves, which depends on the normalized toroidal flux label and poloidal and toroidal mode numbers. Empty frequency bands are revealed (so-called gaps within the continuum), where unstable modes could be excited [19, 60]. Considering experimentally estimated mode numbers for certain frequencies, specific AEs can be assigned to the observations.
In addition CONTI optionally delivers the full sound wave spectrum. Usually for observations at medium and lower frequencies (here  150 kHz) the coupling of sound waves to AEs deforms the gap structure of the continuum mainly close to the plasma core, which has to be considered for a more precise identification of a possible mode type. Another aspect, which also affects the location and structure of continuum gaps, is the quality of the measured plasma profiles. In the context of this work, the achieved accuracy of the profile fits is sufficient to discuss the relevant observations. Additionally the radial electric field could lead to a Doppler shift within the continuum of the order of up to a few 10 kHz. The gap structure can be distorted substantially, especially for low frequencies. Nevertheless the influence on the typical Alfvénic broadband activity around 200 kHz, which is discussed in this work, can be neglected, since the associated gap itself is rather wide and remains open, when taking the corresponding radial electric field into account (similar as in [46]).
Relevant gap modes are further analyzed using the ideal MHD-code CKA [61] to find the radial structure of corresponding AEs. The perturbative gyrokinetic, three-dimensional, electromagnetic particle-in-cell code EUTERPE (CKA-EUTERPE [62]) can be applied to study the power transfer between relevant modes and kinetic particles. The latter lays beyond the scope of this paper and is demonstrated in [46].
3. Experimental observations
3.1. Alfvénic broadband activity around 200 kHz
To illustrate typical measurement data of a Mirnov coil (here: QXM10CE040, installed in HM10) during plasma operation, the W7-X experiment ID 20180918.045 has been chosen (figure 5). Standard plasma parameters, depicted in figure 5(a), are the line integrated electron density [63] (blue line), a central ECE channel indicative for the electron temperature [36] (red line), diamagnetic energy [45] (magenta line) and toroidal plasma current [64] (black line). The plasma is heated via ECRH (electron cyclotron resonance heating [65]) with a constant power of 3 MW from 0–3 s and 4.5 MW from 3 to 6 s. At about 1.9 s frozen hydrogen pellets have been injected into the plasma [48] (green shaded region in figure 5(a)), which leads to an increase of density and energy and decrease of temperature and current. The energy reaches about 1 MJ, which marks a high performance phase of the plasma (red shaded region in figure 5(a)). The high energy plateau holds for approximately one confinement time (≈200 ms), followed by an energy and density decrease to a level, which is slightly higher compared to the pre-pellet phase at the beginning of the discharge. The underlying mechanisms of the observed dynamic of high performance plasmas at W7-X, also with respect to the previously published record triple product [66], are discussed in detail in [35, 67, 68].

Figure 5. (a) Measured plasma parameters of the W7-X experiment ID 20180918.045: line integrated electron density (blue), a central ECE channel indicative for the electron temperature (red), diamagnetic energy (magenta), net toroidal current (black). Also indicated are the pellet injection phase (light green) and the following high energy phase (light red). (b) Measured raw signal of Mirnov coil QXM10CE040 (installed in HM10).
Download figure:
Standard image High-resolution imageSeveral observations in the measured Mirnov coil raw data are noticeable (figure 5(b)). During the plasma pulse a reasonable signal-to-noise ratio S ≥ 20 is found, where the noise level is measured before the onset of the ECR heating. The magnetic fluctuation amplitude slightly decreases during the pellet injection phase (marked green in figure 5(b)). The individually injected pellets provoke short and strong magnetic bursts with a length of about 1 ms. During the high energy phase (marked red in figure 5(b)) the amplitude increases again to a similar level compared to the pre-pellet phase at the beginning of the discharge. Finally the magnetic fluctuation amplitude remains at a slightly higher level compared to the pre-pellet phase after the high energy phase abruptly ends and the plasma energy and density drop down by a factor of about two.
A spectral analysis of the measured Mirnov coil time trace shown in figure 5(b) is depicted in figure 6. Both plots were generated based on the same data, but different analysis methods have been used—a simple short-time FFT algorithm in figure 6(a) and the advanced spectral analysis method DMusic in figure 6(b). The previously mentioned short magnetic bursts due to injected pellets are clearly spread out over a wide range of frequencies (figure 6(a)). During the following high energy phase a well pronounced, narrow frequency band occurs at about  s around 30 kHz within the overall enhanced fluctuation activity for
  kHz. We note that it is also detected by the PCI and XMCTS system, but not shown here. Recent investigations, which are out of the scope of this work, show evidence, that these observations might be related to kinetic ballooning modes.
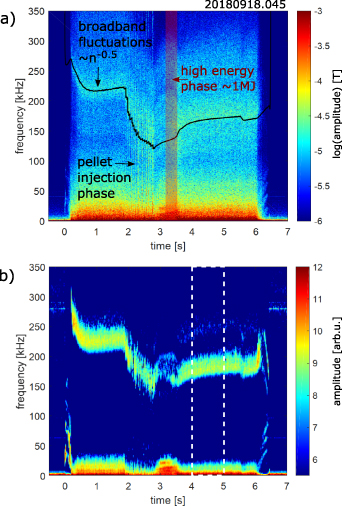
Figure 6. Spectral analysis for measured data of Mirnov coil QXM10CE040 (W7-X ID 20180918.045) (a) A simple FFT algorithm reveals broadband fluctuations existing between ∼150–250 kHz and showing typical Afvénic behavior following an n−0.5 trend. The pellet injection and the following high energy phase during this experiment are also indicated. (b) Considering the advanced spectral analysis method DMusic a much clearer picture of relevant fluctuation bands is obtained. Important for the appearance of the DMusic spectrogram are the parameters J = 600 and K = 125 (details in [46]). The time interval from 4–5 s is relevant for further analysis (cf figures 7, 8).
Download figure:
Standard image High-resolution imageFocussing on the broad band fluctuation around 200 kHz we notice that the dominating frequency follows n−0.5( n is the line integrated electron density) very well (black line in figure 6(a)) during the whole plasma pulse, which implies an Alfvénic character. In contrast to the simple FFT algorithm, which has been used to generate the spectrogram in figure 6(a), the more advanced method DMusic is able to provide a much clearer picture of the frequency band of interest (figure 6(b)). The overall signal amplitude decreases during the pellet injection and high energy phase, but recovers afterwards until the end of the discharge. The following analysis will refer to the highlighted time interval from 4 to 5 s.
The measured signals of in total 41 poloidally arranged Mirnov coils in HM11 are used to perform a poloidal mode number analysis using the SSI-Method. Within the time interval 4–5 s in the W7-X experiment 20180918.045 some slightly pronounced poloidal mode numbers m = 3, 11 for a corresponding frequency of 180 kHz (figure 7) are found. It is noted that for the calculation of this mode spectrum no experimentally derived information about the radial localization of the mode was available. Hence a mapping of the Mirnov coil positions to magnetic coordinates of a specific flux surface has not been performed, which neglects a possible distortion of the mode spectrum. However, since the almost equidistant coil positions at the given toroidal location in HM11 (cf figure 8(a)) reflect the triangular plasma shape well and the observed mode likely exists at a radially outer flux surface of the plasma (derived from a comparison to theoretical predictions, cf next paragraph and figure 8(b)), the distortion is assumed to be small. Improved mode spectra calculations taking into account an exact mapping of the poloidal coil positions to a given magnetic flux surface and considering an experimentally determined radial localization of the observed mode (e.g. by XMCTS or ECE diagnostic measurements) are being prepared and will be subject of a future publication.
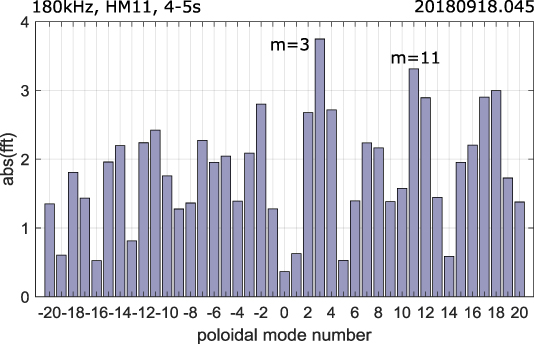
Figure 7. Mode analysis result by the SSI-method considering the dominant frequency of 180 kHz within the time interval 4–5 s of the W7-X experiment 20180918.045 involving 41 poloidally arranged Mirnov coils located in HM11.
Download figure:
Standard image High-resolution image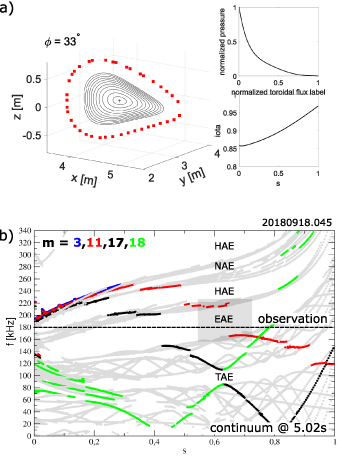
Figure 8. (a) On the left hand side the flux surfaces of the used VMEC equilibrium at the toroidal location φ = 33° of the Mirnov coil arrangement in HM11 are shown, where the Mirnov coils are indicated as red squares. The corresponding pressure and iota profiles are depicted on right hand side. (b) Alfvén continuum calculated with CONTI at 5.02 s of W7-X experiment 20180918.045. Explicit poloidal mode numbers are indicated by different colors and expected unstable Alfvén Eigenmodes (AE) within corresponding continuum gaps are stated (abbreviations described in the text). The observed frequency of 180 kHz is marked by the black dashed line.
Download figure:
Standard image High-resolution imageAlthough the experimentally deduced mode number spectrum is not very conclusive, a comparison with theoretical calculations delivers evidence for the type and location of the AE based on the observed mode number and frequency. Considering the relevant VMEC equilibrium (depicted in figure 8(a), left hand side: flux surfaces at the toroidal location φ = 33° of the Mirnov coil arrangement in HM11, Mirnov coils indicated as red squares; right hand side: corresponding pressure and iota profiles), the Alfvén continuum has been calculated with CONTI at 5.02 s (figure 8(b), gray lines). The full sound wave spectrum has been considered to account for the coupling effects to the Alfvén wave continuum, but for better readability the branches related to sound mode dispersion relations are not depicted in the continuum. Associated AEs are stated within the gaps as TAE—toroidally-induced AE, HAE—helicity-induced AE, EAE—ellipticity-induced AE and NAE—noncircularity-induced AE (Details and continuative literature for the different AEs are given in [19]). A selection of branches are colored corresponding to their poloidal mode numbers, which were chosen considering the findings of the experimental mode analysis (figure 7) and exist within the depicted frequency range. Several regions can be identified, where such a colored mode crosses a continuum gap. However, only within the gray shaded area in figure 8(b) frequency, mode number and strength (according to figure 7) match the observations well. Close to the observed frequency of 180 kHz (marked by the black dashed line within the continuum) the mode with poloidal mode number m = 11 is found (colored in red) at approximately s ≈ 0.65, where s is the normalized toroidal flux label. The dedicated gap is associated with EAE. We note that based on the same approximation, which has been used in [46], the expected Doppler shift at the identified location due to the radial electric field (measured by the Doppler reflectometry system) is of the order of 10 kHz and does not affect the findings so far.
The general appearance of the identified fluctuation band in W7-X plasmas is investigated. Therefore the spectrograms of about 490 discharges were automatically analyzed with respect to dominant frequency components. For each discharge a time interval with a length of 1 s has been determined, where plasma temperature, density and energy are constant or show only minor variations. Within this time period and in the frequency range from 100 to 400 kHz the amplitude maximum in most spectrograms is found at around 170–200 kHz (figure 9(a), underlaying histograms in gray). The individual W7-X experiments have been sorted by different main magnetic field configurations [69, 70] or applied plasma heating method. For each case the frequency distribution was calculated and drawn as an extra line (figure 9(a), left hand side configuration standard: blue, low iota: black, high iota: green, high mirror: red and right hand side heating method only ECRH: dashed line, additional or only NBI: dash-dotted line). They show very similar dominant frequencies around 170–200 kHz. Hence a significant shift of the dominant frequency regime with global parameters, like heating scenario and magnetic configuration is not found and the observed fluctuation band can be considered as a common W7-X plasma phenomenon.
The mentioned Alfvénic nature of the fluctuation activity between 150 and 250 kHz is reflected in figure 9(b). The colors have been chosen according to figure 9(a) (left hand side), whereas circles indicate plasma heating only via ECRH and crosses via additional or only NBI. In the same time period, where previously the dominant frequency component has been identified, the corresponding measured line integrated electron density is determined and plotted against the dominant frequency. Generally the resulting distribution is well approximated by the expected n−0.5 trend (black dashed line). The indicated trend fits best the measurements in discharges, which were operated in standard magnetic configuration. It slightly overestimates the observations in case of high iota and high mirror configurations and underestimates in case of the low iota configuration.
3.2. Short time scale Alfvénic bursts
Various aspects have been studied regarding potential benefits of an extra on- or off-axis plasma current drive [71], the so-called ECCD, which is driven by the ECR heating system. However within a number of W7-X experiments involving ECCD a disturbing observation was the appearance of fast, sawtooth-like plasma crashes. In some cases they even led to a total plasma collapse. On a time scale of up to 100 times faster than expected, compared to the plasma confinement time, the toroidal and poloidal plasma currents collapsed, causing high induced currents in the adjacent in-vessel components. Resulting mechanical forces due to the interaction of these induced currents and the main magnetic field could lead to severe damage of vital machine parts and relevant diagnostics. Fortunately this was not the case during past operational phases of W7-X and also has to be ruled out in future high-beta plasma experiments foreseen for later campaigns. Hence, understanding the nature of the observed crashes and related plasma collapses is important and detailed investigations concerning the underlying instability and trigger mechanism are underway [40, 72, 73].
In the context of this work a typical crash event is selected from the W7-X experiment ID 20180918.022. Figure 10(a)) shows the global plasma parameters, i.e. line integrated electron density (blue line), a central ECE channel indicative for the electron temperature (red line), diamagnetic energy (magenta line) and toroidal plasma current (black line). The plasma is heated via ECRH with a constant power of 2 MW (ECCD included). Abrupt crashes are clearly seen in the electron temperature (measured by the ECE diagnostic located in HM41) and the diamagnetic energy (measured by the compensated diamagnetic loop located in HM31). The magnetic fluctuations (measured by the Mirnov coil QXM11CE120 located in HM11, figure 10(b)) show related distinct, short-time peaks. In figure 11(a) a zoom into one selected crash event at 3.8146 s (marked with a light blue bar in figure 10(b)) is shown, which is complemented by the 46 kHz component of a calculated real-valued Morlet wavelet spectrum (red curve). The frequency spectrogram of the same crash, which has been calculated using DMusic (figure 11(b)), confirms the obviously good agreement of the fit and the measured data. During the crash a clear dominant fluctuation activity slightly below 50 kHz is found accompanied by some weaker signatures around 150 and 250 kHz. Considering only the time interval for the selected crash (3.8146–3.815 s) the SSI mode analysis of the measured data of 41 poloidally arranged Mirnov coils in HM11 indicates a slightly pronounced mode with a poloidal mode number of m = 7 for a corresponding frequency of 46 kHz (figure 11(c)).
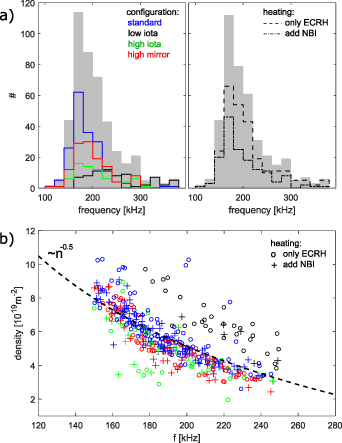
Figure 9. (a) The frequency distributions obtained from about 490 independent W7-X experiments clearly show a maximum around 170–200 kHz. The W7-X experiments have been sorted by the different magnetic configurations (left hand side) or heating mechanism (right hand side). The distributions are depicted by lines with corresponding colors or line styles (cf legend and main text). The underlaying gray histogram on each side indicates the sum of the individual lines. Measured data of Mirnov coil QXM10CE040 have been used. (b) For a selection of plasma pulses the associated measured line integrated electron density has been determined and plotted versus the dominant frequency (colors as in figure 9(a) left hand side, only ECRH: circles, additional or only NBI: crosses). An n–0.5 trend is indicated by the black dashed line.
Download figure:
Standard image High-resolution image
Figure 10. (a) Measured plasma parameters of the W7-X experiment ID 20180918.022: line integrated electron density (blue), a central ECE channel indicative for the electron temperature (red), diamagnetic energy (magenta), net toroidal current (black). (b) Measured raw signal of Mirnov coil QXM11CE120 (installed in HM11). The blue bar indicates the crash, which is discussed in the text.
Download figure:
Standard image High-resolution image
Figure 11. Measurement of Mirnov coil QXM11CE120. (a) Zoom into one crash event of W7-X experiment 20180918.022 at 3.8146 s (as indicated in figure 10(b) by the light blue bar). The 46 kHz component of a real-valued Morlet wavelet spectrum is overlaid (red curve). (b) Corresponding DMusic spectrogram, (c) SSI mode analysis result within the given time interval 3.8146–3.815 s (selected crash).
Download figure:
Standard image High-resolution image
4. Discussion
Referring to the typically observed Alfvénic broadband activity (section 3.1), a comparison of the measured (figure 7) mode numbers at the observed frequency of 180 kHz and the corresponding predicted continuum gap (figure 8) suggests that the detected magnetic fluctuations are related to an EAE at s ≈ 0.65. The question regarding a possible driving mechanism of the instability remains open and is still under investigation. In case of pure NBI heating scenarios it was studied whether the injected ions would have sufficient energy to overcome background damping and destabilize AE [46]. Theoretical modeling results however suggest that most likely a different excitation mechanism has to be responsible for the observations. CKA-EUTERPE calculations show that in principle an energy transfer from fast electrons to these modes is possible, which strongly depends on the profiles of the background plasma [37, 46]. This hypothesis is supported by the fact that these fluctuations occur independently of the plasma heating scenario, i.e. also in purely ECR heated plasmas in the absence of externally injected fast ion by NBI (cf figure 9(a)).
Regarding the magnetic fluctuations at about 50 kHz, which accompany the fast plasma crashes (figure 11, section 3.2), a preliminary follow up analysis with CKA indicates core-localized global AEs comparable to the experimental findings in both frequency and mode number. Currently the role of fast particles, which might be induced during the sawtooth-like crashes, and the effect of bulk gradients with respect to the driving mechanism and location of the modes are studied. These investigations have just been started to provide a more detailed characterization of the observed short time scale Alfvénic bursts and finally to contribute to the understanding of the dynamics of the fast plasma collapses.
5. Conclusion
Observations based on measurements by the Mirnov diagnostic valuably contribute to the understanding of mode dynamics and plasma performance at the optimized stellarator experiment W7-X. Individual coils have been calibrated considering all relevant electronics and DAQ systems. Advanced data analysis tools have been implemented and their capabilities demonstrated for two chosen aspects, i.e. broadband Alfvénic activity around 180 kHz and unwanted, short-time plasma collapses. Regarding the broadband fluctuations it was inferred, by analyzing accompanying theoretical calculations with CONTI, that the observations are possibly related to edge-localized EAEs. They occur within a wide range of plasma scenarios independent of global parameters like magnetic configuration or heating mechanism. In past experimental campaigns of W7-X fast ions, injected by NBI, do not have enough energy to excite such modes and overcome the plasma background damping [46]. Instead electron pressure gradients are believed to drive a conglomerate of often only weakly pronounced instabilities. At this point we conclude that the effect of the discussed Alfvénic activity on global energy transport processes within the recent W7-X campaigns is rather small. However in certain operational scenarios of W7-X, involving external plasma current drive (ECCD), unwanted fast plasma collapses were observed. Their trigger mechanism and the interplay of occurring instabilities and 3D-geometry effects related to magnetic islands and changes of the iota-profile are still not fully understood. In future experiments higher heating power for ECRH and NBI and additional heating systems like ICRH are foreseen and the understanding of fast particle driven MHD-instabilities will become crucial. A well-prepared sophisticated analysis strategy is indispensable specifically for high-performance high-beta scenarios. To account for the mostly non-evenly spaced Mirnov coils the implementation of Lomb-periodogram calculations [74] is under preparation. Improvements of related theoretical simulation codes taking into account the complex structure of the magnetic islands in W7-X (e.g. in CONTI) and the preparation of fully gyro kinetic calculations (e.g. with EUTERPE) are ongoing and will be subject of future publications.
Acknowledgments
This work has been carried out within the framework of the EUROfusion Consortium and has received funding from the Euratom research and training programme 2014–2018 and 2019–2020 under Grant Agreement Number 633053. The views and opinions expressed herein do not necessarily reflect those of the European Commission.