Quartz-Enhanced Photoacoustic Spectroscopy for Four-Component Gas Detection Based on Two Off-Beam Acoustic Microresonators
 Cheng Wang1
  Zongliang Wang
- 1Department of Information Engineering, Shandong Jiaotong University, Jinan, China
- 2School of Physics Science and Information Technology and Shandong Key Laboratory of Optical Communication Science and Technology, Liaocheng University, Liaocheng, China
A compact and portable quartz-enhanced photoacoustic spectroscopy gas sensor was developed for four-component gas detection using two off-beam acoustic microresonators The two AMRs were placed in parallel on opposing sides of a quartz tuning fork for photoacoustic signal enhancement. Four distributed feedback (DFB) lasers were connected to the four ends of the two off-beam AMRs using a fiber collimator for photoacoustic signal excitation. Four-component gas sensing was achieved via time-division multiplexing of the distributed feedback laser driver currents. The four-component gas sensing scheme was used to detect acetylene (C2H2) at 1,532.83 nm, methane (CH4) at 1,653.722 nm, water vapor (H2O) at 1,368.597 nm and carbon dioxide (CO2) at 1,577.787 nm for feasibility testing. Minimum detection limits of 3.6 ppmv for C2H2, 34.71 ppmv for CH4, 1.09 ppmv for H2O, and 341.18 ppmv for CO2 were obtained, and the linear responses reached 0.9982, 0.9969, 0.99843 and 0.99591 for C2H2, CH4, H2O and CO2, respectively, at 1.5 s intervals.
1. Introduction
The introduction Quartz-enhanced photoacoustic spectroscopy (QEPAS) was introduced by Kosterev et al. in 2002 [1] and offers portability, small volume and an excellent photoacoustic response. Because of these outstanding performance characteristics [2, 3], QEPAS was widely researched for use in trace gas detection. The developments and prospect of QEPAS gas sensing technique were summarized and discussed by Ma et al. [4, 5]. In the past years, the performance indexs have been greatly improved in these areas of photoacoustic spectroscopy (PAS) signal improvement, distributed gas sensing and multi-component gas detection. To enable further enhancement of the PAS signal and the minimum detection limit (MDL), an acoustic microresonator (AMR) is generally used to amplify the acoustic signal [6, 7]. Normally, there are two main types of AMR structure: the on-beam and the off-beam structures. The on-beam AMR consists of a pair of short metal tubes that are placed on the two sides of a quartz tuning fork (QTF) [8]. The off-beam AMR includes a relatively long tube with a small slit in its center that is placed on one side of the QTF [9].
Kosterev et al. first introduced the QTF and a resonant sound tube to detect and improve the acoustic signal and the normalized noise equivalent absorption (NNEA) coefficient obtained for methane (CH4) detection was 1.2 × 10⁻⁷ cm−1 W Hz–1/2 [1]. Dong et al. optimized the on-beam AMR structure and demonstrated a NNEA of 3.3 × 10⁻⁹ cm−1 W Hz–1/2 for acetylene (C2H2) detection [10]. Dong et al. used a single tube to construct an on-beam AMR to improve the acoustic signal. A NNEA of 1.21 × 10⁻⁸ cm−1 W Hz–1/2 was then obtained for carbon dioxide (CO2) detection [11]. Wang et al. proposed an on-beam structure that was based on three AMRs to improve the acoustic signal and obtained an MDL of 166 ppbv for water vapor (H2O) [12]. Liu et al. optimized the off-beam AMR to realize superior detection performance and a NNEA of 6.2 × 10⁻⁹ cm−1 W Hz–1/2 was obtained for H2O detection [13]. The above researches could improve the PAS signal intensity effectively by the application and optimization design of AMR structure. The QTF structure and the PAS excitation device were also able to be optimized for the performance improvement of QEPAS sensor. Ma et al designed a T-shaped QTF with a prong length of 9.4 mm and a resonance frequency of 9.38 kHz for H2O detection based on in-plane quartz-enhanced photoacoustic spectroscopy (IP-QEPAS), in which, the laser beam acted on the plane of the QTF for increasing the PAS signal intensity [14]. Ma et al also reported a multi-quartz-enhanced photothermal spectroscopy (M-QEPTS) which using multiple QTFs for increasing signal amplitude. The M-QEPTS technology realized a 1.51 times signal enhancement compared with the single QTF in C2H2 detection [15].
In addition, the increase of laser power also enhance the PAS signal intensity. Ma et al. used an erbium doped fiber amplifier (EDFA) to improve the PAS signal intensity in hydrogen cyanide detection based on QEPAS sensor [16]. The experimental results showed that a MDL of 29 ppb and NNEA coefficient of 1.08 × 10⁻⁸ cm−1 W Hz–1/2 were achieved. Moreover, the signal processing methods were applied in the QEPAS gas detection for signal-to-noize ratio (SNR) improvement. Ma et al developed the QEAPS sensor by adding H2O in the CH4 for increasing the relaxation rate and applying the wavelet filtering for SNR improvement [17]. In the distributed gas sensing, Ma et al realized the long distance distributed gas sensing based on the micro-nano fiber evanescent wave and EDFA. In the 3 km single mode fiber, three gas detection points were tested in C2H2 detection and the MDLs of the three detection points were 30, 51, and 13 ppm, respectively [18].
With the increasing variety of gases to be detected, the single-component gas QEPAS sensor is unable to meet the requirements of many application fields, including production safety, electrical power security, environmental monitoring, the food industry, and medical diagnostics. The single-component gas QEPAS sensor is costly and inconvenient to install in multi-component gas detection applications. Therefore, the multi-component gas QEPAS sensor has been studied extensively for detection of gases including H2O, C2H2, CO, CO2, CH4, NH3 and H2S. Kosterev et al. realized H2S, CO2 and CH4 gas detection using their QEPAS sensor [19]. Dong et al. detected CH4 and NH3 using a compact QEPAS gas sensor in combination with a control electronics unit, an acoustic detection module, and a switching module [20]. Wang et al. used a two-component QEPAS gas sensor to detect C2H2 and CH4 via time-division multiplexing (TDM) of the distributed feedback (DFB) laser driver currents [21]. Wu et al. detected H2O and C2H2 successfully via frequency division multiplexing of the fundamental frequency and the first overtone of the QTF [22]. Zhang et al. used three QTFs with different response frequencies to design a multi-gas QEPAS sensor for H2O, CH4, and C2H2 detection [23]. Ma et al. detected CO and N2O at 2,176.3 and 2,169.6 cm−1, respectively, using a DFB quantum cascade laser with a 4.61 µm central wavelength based on the QEPAS system [24]. Wu et al. demonstrated use of a DFB laser operating at 1,582 nm for detection of NH3 and H2S by controlling the operating wavelength of the DFB laser to be located at the two interference-free absorption lines of 6,322.45 and 6,328.88 cm−1 [25]. Ren et al. used a novel compact multipass gas cell to realize dual-species monitoring of CH4 and N2O [26]. Ramya et al. used a super-continuum light source that covered the spectral range from 1.6 to 2.0 μm to detect CH4, CO2, and H2O via the broadband PAS technique [27]. In above researches, the kinds of gas detection were not so many. If you are trying to detect a lot of gases, the gas detection devices are very complicated.
In this paper, we introduced a four-component QEPAS sensor based on an in-house-constructed QTF photo-acoustic gas cell consisting of two off-beam AMRs and only one QTF. The four DFB lasers were connected to the four fiber collimators, which were then responsible for laser beam alignment to the two AMRs. Using this structure, the laser power injected into the photoacoustic gas cell was higher than that obtained when using the 1 × 4 fiber coupler to input the laser beams, thus guaranteeing a superior MDL. The four component gases were detected by TDM of the DFB laser drive currents. Realization of TDM of the DFB laser drive currents has lower costs and is more convenient than TDM of the photoswitch. Additionally, only one lock-in amplifier was used in the entire QEPAS sensor, thus simplifying the sensor structure and reducing the overall cost. C2H2, CH4, H2O and CO2 were selected as sample gases for gas sensor performance testing. The experiments showed that the QEPAS sensor provided a remarkable linear response and MDLs for C2H2 at 1,532.83 nm, CH4 at 1,653.722 nm, H2O at 1,368.597 nm and CO2 at 1,577.787 nm.
2. QEPAS Spectrophone Structure Based on Two Off-Beam AMRs
The two off-beam ARMs and a bare QTF were used to construct the QEPAS spectrophone structure, for which detailed structural parameters are shown in Figure 1. The two off-beam ARMs are placed on two sides of the QTF and are located 0.7 mm from the top of the QTF; the detailed structural dimensions are shown in Figure 1A. The off-beam AMR structures are made from aluminum metal and have length, width, and height of 7.6, 3, and 1.5 mm, respectively. The resonant cavity with the diameter of 0.5 mm and length of 7.6 mm is located 0.8 and 2.1 mm from the top and the side of the AMR, respectively, for acoustic signal enhancement. At the center of the resonant cavity, there is a 0.5 mm-diameter hole connected to the resonant cavity to transmit the acoustic signal to the QTF. A traditional QTF is used to detect the acoustic signal; the dimensional parameters of the QTF are provided in detail in Figure 1B. The two QTF prongs both have a length, width and height of 0.6, 0.3, and 4 mm, respectively. Figure 1C shows the complete QEPAS spectrophone structure based on two off-beam AMRs. The two off-beam AMRs (AMR1 and AMR2) are located on two sides of the QTF, with their central holes focused on the gap between the two QTF prongs. The external structure of the spectrophone for gas input and output is made from aluminum metal.
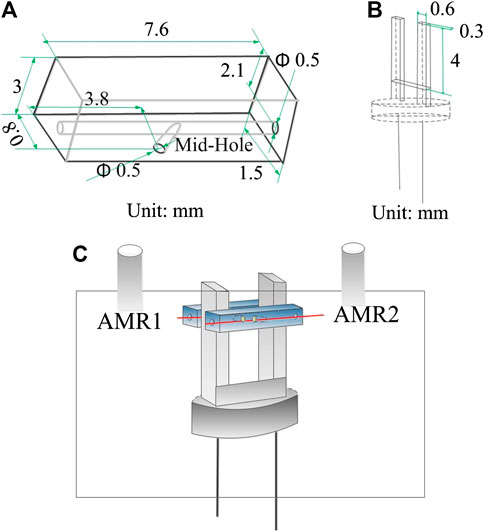
FIGURE 1. QEPAS spectrophone structure based on two off-beam AMRs. (A) Off-beam AMR structure parameters. (B) QTF dimensional parameters. (C) Complete QEPAS spectrophone structure.
3. TDM of DFB Laser Drive Currents
In the proposed scheme, four DFB lasers with center wavelengths that were located at the absorption lines of C2H2, CH4, H2O and CO2 were selected to test the feasibility of the four-component QEPAS gas sensor. Four-component gas detection was achieved via TDM, which was implemented by controlling the DFB laser current driver using a relay module with four channels. The drive currents of the DFB lasers were provided by an ARM7 processor, which generated a sawtooth wave, and a signal generator, which produced a high-frequency sine wave. The combined signal formed from the sawtooth wave and the high-frequency sine wave was provided by an adder device that was switched to each DFB laser via the relay module for four-component gas detection. The detailed drive currents for each DFB laser are shown in Figure 2. The drive current was transmitted first to the C2H2 laser, second to the CH4 laser, third to the H2O laser, and finally to the CO2 laser at 1.5 s intervals by the relay module. Therefore, the second harmonic (2f) PAS signals were acquired first for C2H2, second for CH4, third for H2O, and finally for CO2.
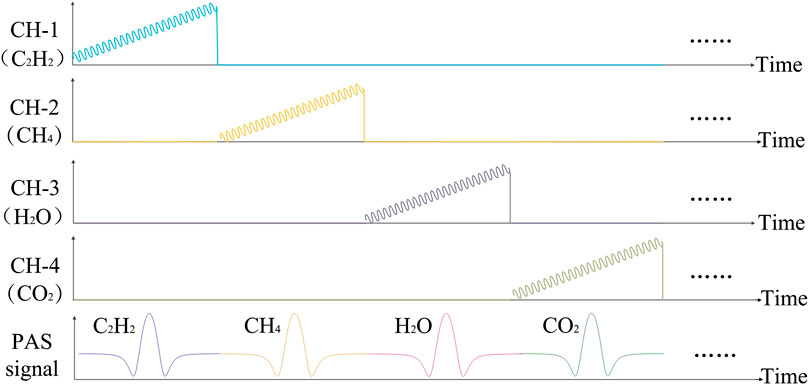
FIGURE 2. TDM of DFB laser drive currents.
4. Experimental Setup
C2H2, CH4, H2O and CO2 were chosen as the four component gases to test the feasibility and performance of the proposed QEPAS sensor in the experiments. According to the HITRAN 2008 molecular spectroscopic database, the four component gases of C2H2, CH4, H2O and CO2 have apparent laser absorption at 1,532.83, 1653.722, 1368.597 and 1,577.787 nm, respectively. The four DFB lasers with 14-pin butterfly-packages were used for C2H2, CH4, H2O and CO2 gas detection in the experiments and their center wavelengths were 1,532.8, 1653.7, 1368.1 and 1,577.2 nm, respectively. For ease of description, the four DFB lasers for C2H2, CH4, H2O and CO2 detection are called DFB-1, DFB-2, DFB-3 and DFB-4, respectively, in this paper. The experimental setup is shown in detail in Figure 3. An ARM7 processor (LPC1758, NXP, The Netherlands) and a signal generator (FY2300A, Feel Tech, China) were used to generate a sawtooth wave (cycle: 1.5 s) and a high-frequency sine wave (frequency: 16.378 kHz). The sawtooth wave and the high-frequency sine wave were combined using an adder device and were then transmitted to the relay module for drive current TDM for the four DFB lasers at 1.5 s intervals. On the basis of this current driver, temperature drivers provided by four thermoelectric cooler controllers (LTC1923, Linear Technology, USA) were also added to guarantee that the four lasers could operate normally. The four optical fiber isolators were connected between the DFB lasers and the optical fiber collimators to align the laser beams to the spectrophone structure to protect the lasers from damage being caused by an opposing laser beam. The two off-beam AMRs (designated AMR1 and AMR2) were placed on the two sides of the QTF to enhance the PAS signal and inject the four laser beams. The QTF was then responsible for detection of the PAS signal and conversion of this signal into an electrical current. The PAS electric current was then translated into a voltage using an in-house-constructed pre-amplifier which based on the CA3140, for the next processing step. Finally, a lock-in amplifier (MFLI, Zurich Instruments, Switzerland) was used to detect the PAS voltage and transfer it to a computer to perform the gas concentration calculations.
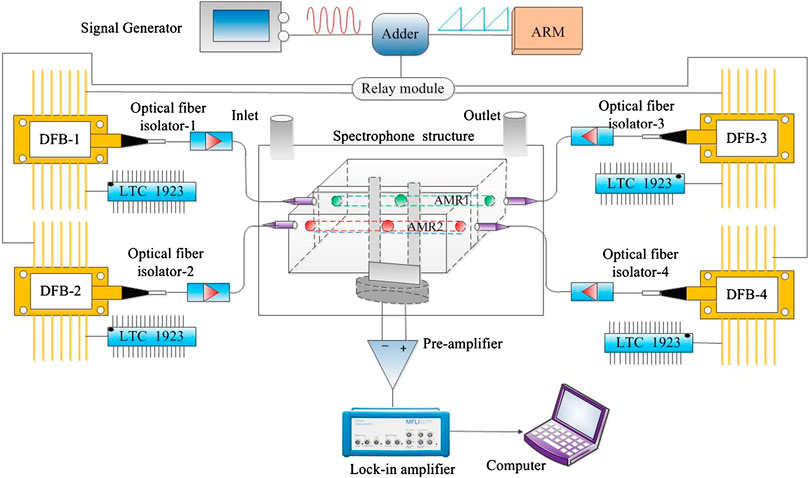
FIGURE 3. Experimental setup.
5. Experimental Results
To test the feasibility of the four-component QEPAS sensor, C2H2 at 2000 ppmv, CH4 at 8,000 ppmv, H2O at 1,500 ppmv and CO2 at 60,000 ppmv were detected using the experimental platform and the parameters shown in Figure 3 at normal atmospheric pressure and at room temperature (27°C). The 2f PAS signals and the noise values of the four component gases acquired by TDM of the drive currents at 1.5 s intervals are shown in Figure 4. The 2f PAS signals for C2H2, CH4, H2O and CO2 were 0.105, 0.0726, 0.148 and 0.0051 V, respectively. The noise values (i.e., the standard deviations) of the four components gases were also calculated based on the deviation of the 2f PAS signal from the gas absorption line, as shown in Figure 4. The noise values for C2H2, CH4, H2O and CO2 were 0.189, 0.315, 0.108 and 0.029 mV, respectively. Based on the 2f PAS signals and the noise values of the four component gases, MDLs of 3.6 ppmv for C2H2, 34.71 ppmv for CH4, 1.09 ppmv for H2O, and 341.18 ppmv for CO2 were obtained.
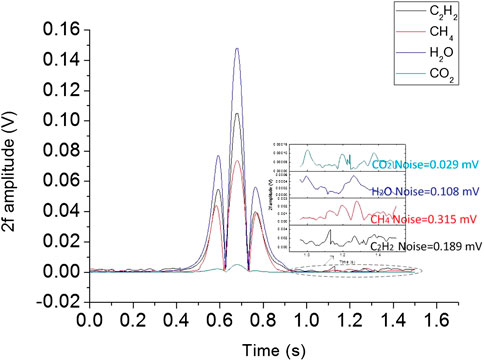
FIGURE 4. PAS signals and noises of C2H2, CH4, H2O and CO2.
Furthermore, the linearity of the results for C2H2, CH4, H2O and CO2 were also measured using the experimental platform and the parameters shown in Figure 3 at normal atmospheric pressure and room temperature (27°C) to evaluate the performance of the gas sensor in greater detail. The gas concentrations of C2H2, CH4 and CO2 were generated using a gas mixing plant (MFC-08, Beijing Builder Electronic Technology, Beijing, China), and the H2O gas concentration was generated using an in-house-constructed dew-point generator. The 2f PAS signals are described as a function of the gas concentration in Figure 5. The fitting curves in Figure 5 show that the R-square values of C2H2, CH4, H2O and CO2 are 0.9982 (Figure 5A), 0.9969 (Figure 5B), 0.99843 (Figure 5C) and 0.99591 (Figure 5D) within the gas concentration ranges of 500–3,000 ppmv, 2000–12,000 ppmv, 500–3,000 ppmv and 40,000–1,40,000 ppmv, respectively. The experimental results showed that the four-component QEPAS sensor had excellent linear responses to the different gas concentrations. In conclusion, the four-component QEPAS sensor proposed in this paper to detect C2H2, CH4, H2O and CO2 is feasible and provides reasonable detection performance.
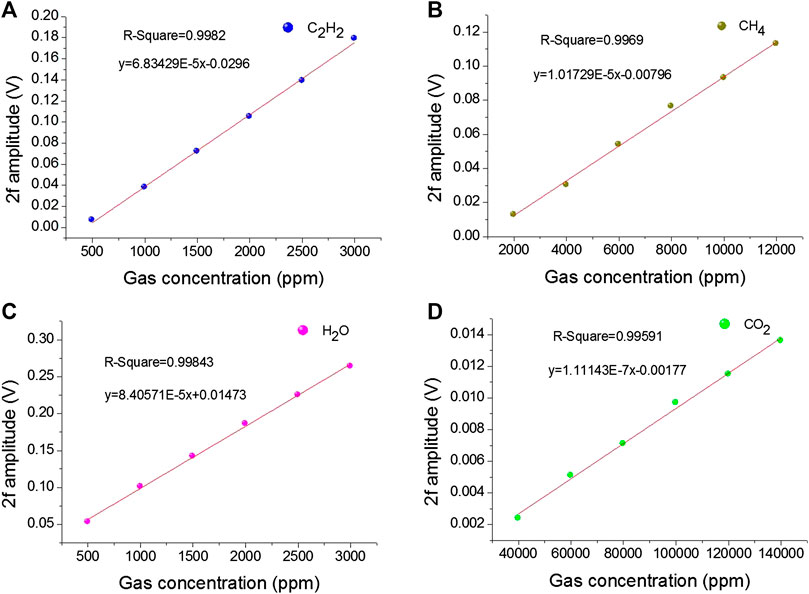
FIGURE 5. (A) 2f PAS signals as functions of the C2H2 gas concentration. (B) 2f PAS signals as functions of the CH4 gas concentration. (C) 2f PAS signals as functions of the H2O gas concentration. (D) 2f PAS signals as functions of the CO2 gas concentration.
6. Conclusion
In this paper, a four-component QEPAS gas sensor was developed based on TDM of the DFB laser drive currents. Two off-beam AMRs were placed in parallel on two opposing sides of the QTF for photoacoustic signal enhancement and injection of the four DFB laser beams. Four optical fiber collimators were connected between the DFB lasers and the two AMRs to align the laser beams to the spectrophone structure and thus excite the photoacoustic signal. TDM of the DFB laser drive currents is more convenient and can be performed at lower cost than TDM of the photoswitch. In addition, the four DFB laser beams are injected into the spectrophone structure through the two off-beam AMRs and the four optical fiber collimators rather than via a 1 × 4 fiber coupler. Therefore, the injected laser power is superior to that achieved in the gas sensor with the 1 × 4 fiber coupler. Four component gases comprising C2H2, CH4, H2O and CO2 were used in the experiments to test the feasibility and the performance of the four-component QEPAS gas sensor. The experimental results showed that MDLs of 3.6 ppmv for C2H2, 34.71 ppmv for CH4, 1.09 ppmv for H2O, and 341.18 ppmv for CO2 were obtained at the 1,532.83, 1653.722, 1368.597 and 1,577.787 nm absorption lines, respectively. In addition, the linear responses reached 0.9982, 0.9969, 0.99843 and 0.99591 for C2H2, CH4, H2O and CO2, respectively, at 1.5 s intervals. In conclusion, the four-component QEPAS gas sensor proposed in this paper is capable of detecting four component gases and will aid in promoting the development of multi-component gas detection.
Data Availability Statement
The original contributions presented in the study are included in the article/supplementary materials, further inquiries can be directed to the corresponding author.
Author Contributions
CW and ZW contributed to the conception of the study. CW, ZW, and XP contributed to design and perform the experiments. CW and XP were responsible for data processing. CW and ZW contributed to write and edit the manuscript.
Funding
This research was funded by Project of Shandong Province Higher Educational Science and Technology Program (J17KA073); Focus on Research and Development Plan of Shandong Province (2018GGX105011 and 2019GGX101055) and Natural Science Foundation of Shandong Province (ZR2019PF001).
Conflict of Interest
The authors declare that the research was conducted in the absence of any commercial or financial relationships that could be construed as a potential conflict of interest.
Acknowledgments
We thank David MacDonald, MSc, from Liwen Bianji, Edanz Editing China (www.liwenbianji.cn/ac), for editing the English text of a draft of this manuscript.
References
1. Kosterev AA, Bakhirkin YA, Curl RF, Tittel FK. Quartz-enhanced photoacoustic spectroscopy. Optic Lett (2002). 27:19024. doi:10.1364/OL.27.001902.
2. Patimisco P, Scamarcio G, Tittel FK, Spagnolo V. Quartz-enhanced photoacoustic spectroscopy: a review. Sensors (2014). 14:6165–206. doi:10.3390/s140406165.
3. Wang Q, Wang Z, Ren W, Patimisco P, Sampaolo A, Spagnolo V. Fiber-ring laser intracavity QEPAS gas sensor using a 7.2 kHz quartz tuning fork. Sensor Actuator B Chem (2018). 268:512–8. doi:10.1016/j.snb.2018.04.139.
4. Ma YF. Review of recent advances in QEPAS-based trace gas sensing. Appl Sci (2018). 8:1822. doi:10.3390/app8101822.
5. Ma YF. Recent advances in QEPAS and QEPTS based trace gas sensing: a review. Front Phys (2020). 8:268. doi:10.3389/fphy.2020.00268.
6. Kosterev AA, Tittel FK. Ammonia detection by use of quartz-enhanced photoacoustic spectroscopy with a near-IR telecommunication diode laser. Appl Optic (2004). 43:6213–7. doi:10.1364/AO.43.006213.
7. Petra N, Zweck J, Kosterev AA, Minkoff S, Thomazy ED. Theoretical analysis of a quartz-enhanced photoacoustic spectroscopy sensor. Appl Phys B Laser Optic (2009). 94:673–80. doi:10.1007/s00340-009-3379-1.
8. Cao YC, Jin W, Ho HL. Optimization of spectrophone performance for quartz-enhanced photoacoustic spectroscopy. Sensor Actuator B Chem (2012). 174:24–30. doi:10.1016/j.snb.2012.08.014.
9. Liu K, Guo X, Yi H, Chen W, Zhang W, Gao X. Off-beam quartz-enhanced photoacoustic spectroscopy. Optic Lett (2009). 34:1594–6. doi:10.1364/OL.34.001594.
10. Dong L, Kosterev AA, Thomazy D, Tittel FK. QEPAS spectrophones: design, optimization, and performance. Appl Phys B Laser Optic (2010). 100:627–35. doi:10.1007/s00340-010-4072-0.
11. Zheng HD, Dong L, Sampaolo A, Wu HP, Patimisco P, Yin XK, et al. . Single-tube on-beam quartz-enhanced photoacoustic spectroscopy. Opt Lett (2016). 41:978–81. doi:10.1364/OL.41.000978.
12. Wang ZL, Chang J, Wang C, Feng YW, Tian CW, Li HF, et al. . Three acoustic microresonator quartz-enhanced photoacoustic spectroscopy for trace gas sensing. Optic Commun (2019). 452:286–91. doi:10.1016/j.optcom.2019.07.061.
13. Liu K, Yi H, Kosterev AA, Chen W, Dong L, Wang L, et al. . Trace gas detection based on off-beam quartz enhanced photoacoustic spectroscopy: optimization and performance evaluation. Sci Rev Instrum (2010). 81:103103. doi:10.1063/1.3480553.
14. Ma YF, Qiao SD, Patimisco P, Sampaolo A, Spagnolo V. In-plane quartz-enhanced photoacoustic spectroscopy. Appl Phys Lett (2020). 116:061101. doi:10.1063/1.5142330.
15. Ma YF, Hu YQ, Qiao SD, He Y, Tittel FK. Trace gas sensing based on multi-quartz-enhanced photothermal spectroscopy. Photoacoustics (2020). 20:100206. doi:10.1016/j.pacs.2020.100206.
16. He Y, Ma YF, Tong Y, Yu X, Tittel FK. HCN ppt-level detection based on a QEPAS sensor with amplified laser and a miniaturized 3D-printed photoacoustic detection channel. Optic Express (2018). 26:9666–75. doi:10.1364/OE.26.009666.
17. Li Y, Wang RZ, Tittel FK, Ma YF. Sensitive methane detection based on quartz-enhanced photoacoustic spectroscopy with a high-power diode laser and wavelet filtering. Optic Laser Eng (2020). 132:106155. doi:10.1016/j.optlaseng.2020.106155.
18. He Y, Ma YF, Tong Y, Yu X, Peng ZF, Gao J, et al. . Long distance, distributed gas sensing based on micro-nano fiber evanescent wave quartz-enhanced photoacoustic spectroscopy. Appl Phys Lett (2017). 111:241102. doi:10.1063/1.5003121.
19. Kosterev AA, Dong L, Thomazy D, Tittel FK, Overby S. QEPAS for chemical analysis of multi-component gas mixtures. Appl Phys B Laser Optic (2010). 101:649–59. doi:10.1007/s00340-010-4183-7.
20. Dong L, Wright J, Peters B, Ferguson BA, Tittel FK, Whorter SM. Compact QEPAS sensor for trace methane and ammonia detection in impure hydrogen. Appl Phys B Laser Optic (2012). 107:459–67. doi:10.1007/s00340-012-4908-x.
21. Wang ZL, Chang J, Tian CW, Feng YW, Wang C, Zhang H, et al. . Two-component gas quartz-enhanced photoacoustic spectroscopy sensor based on time-division multiplexing of distributed-feedback laser driver current. Appl Optic (2019). 58:8479–85. doi:10.1364/AO.58.008479.
22. Wu H, Yin X, Dong L, Pei K, Sampaolo A, Patimisc P, et al. . Simultaneous dual-gas QEPAS detection based on a fundamental and overtone combined vibration of quartz tuning fork. Appl Phys Lett (2017). 110:121104. doi:10.1063/1.4979085.
23. Zhang QD, Chang J, Cong ZH, Sun JC, Wang ZL. QEPAS sensor for simultaneous easurements of H2O, CH4, and C2H2 using different QTFs. IEEE Photon J (2018). 10:6804308. doi:10.1109/JPHOT.2018.2880187.
24. Ma YF, Lewicki R, Razeghi M, Tittel FK. QEPAS based PPB-level detection of CO and N2O using a high power CW DFB-QCL. Optic Exp (2013). 21:1008–19. doi:10.1364/OE.21.001008.
25. Wu H, Dong L, Liu X, Zheng H, Yin X, Ma W, et al. . Fiber-amplifier-enhanced QEPAS sensor for simultaneous trace gas detection of NH3 and H2S. Sensors (2015). 15:26743–55. doi:10.3390/s151026743.
26. Ren W, Jiang W, Tittel FK. Single-QCL-based absorption sensor for simultaneous trace-gas detection of CH4 and N2O. Appl Phys B Laser Optic (2014). 117:245–51. doi:10.1364/CLEO_SI.2014.SM1E.4.
Keywords: photoacoustic spectroscopy, acoustic microresonators, quartz tuning fork, fiber gas sensor, off-beam
Citation: Wang C, Wang Z and Pang X (2020) Quartz-Enhanced Photoacoustic Spectroscopy for Four-Component Gas Detection Based on Two Off-Beam Acoustic Microresonators. Front. Phys. 8:594326. doi: 10.3389/fphy.2020.594326
Received: 13 August 2020; Accepted: 28 October 2020;
Published: 13 November 2020.
Edited by:
Lijun Huang, Huaihua University, ChinaReviewed by:
Youbin Yu, Zhejiang Sci-Tech University, ChinaYufei Ma, Harbin Institute of Technology, China
Copyright © 2020 Wang, Wang and Pang. This is an open-access article distributed under the terms of the Creative Commons Attribution License (CC BY). The use, distribution or reproduction in other forums is permitted, provided the original author(s) and the copyright owner(s) are credited and that the original publication in this journal is cited, in accordance with accepted academic practice. No use, distribution or reproduction is permitted which does not comply with these terms.
*Correspondence: Zongliang Wang, wangzongliang@lcu.edu.cn