Assessment of 11 Exploited Fish and Invertebrate Populations in the Japan Sea Using the CMSY and BSM Methods
 Shanshan Zhang
 Yibang Wang
 Yuanchao Wang
 Cui Liang
 Weiwei Xian
- 1Key Laboratory of Marine Ecology and Environmental Sciences, Institute of Oceanology, Chinese Academy of Sciences (CAS), Qingdao, China
- 2Laboratory for Marine Ecology and Environmental Science, Qingdao National Laboratory for Marine Science and Technology, Qingdao, China
- 3University of Chinese Academy of Sciences, Beijing, China
- 4Qingdao University of Science and Technology, Qingdao, China
- 5Center for Ocean Mega-Science, Chinese Academy of Sciences, Qingdao, China
The catch-maximum sustainable yield (CMSY) method and a closely related Bayesian state-space Schaefer surplus production model (BSM) were combined with published catch data and catch per unit effort (CPUE) time series or spawning stock biomass (SSB) data to evaluate fisheries reference points for exploited resources of the Japan Sea. Eleven fish and invertebrate stocks were assessed; outcomes obtained through this analysis were the carrying capacity, biomass trajectory, maximum sustainable yield, and related parameters of each stock. Results showed that the stock of Arctoscopus japonicus was slightly overfished; the stocks of Cleisthenes pinetorum, Hippoglossoides dubius, Paralichthys olivaceus, and Chionoecetes opilio were overfished; and the stocks of Eopsetta grigorjewi, Pagrus major, Gadus chalcogrammus, and Glossanodon semifasciatus were grossly overfished; Pseudopleuronectes herzensteini was proved to be severely depleted; only Pandalus eous was in good condition. These results are consistent with the few previous studies on the status of fish species around the Japan Sea, where overfishing is becoming increasingly apparent. These assessments provide a basis for guiding the use, management, and rebuilding of fishery resources in the Japan Sea.
Introduction
Fish biomass is declining worldwide due to overexploitation and poor fisheries management (Watson and Pauly, 2001; Tremblay-Boyer et al., 2011; Watson et al., 2013), as confirmed by regional studies (Christensen et al., 2003; Liang and Pauly, 2017; Froese et al., 2018). With the increase of fishing pressure since the 1960s, the biomass of the main commercial stocks in the northern hemisphere started to decline, and the situation worsened in the 1980s and 1990s (Pauly, 2008). The depletion of fishery resources resulted in a series of problems, which have greatly limited the functioning and productive capacity of marine ecosystems (Pauly and Zeller, 2016; Liu et al., 2019).
In order to alleviate fishing pressure and restore fishery resources, a series of management and protection measures, based on scientific stock assessments, have been implemented. However, most global fish stocks remain unassessed, due to the lack of data and/or experts. In developed countries, the proportion of assessed fish stocks ranges from 10 to 50%. In developing countries, the proportion is usually lower, between 5 and 20% (Costello et al., 2012). Traditional stock assessment methods are typically based both on survey and fishery data, which are hard to be accessed, and more than 90% of the global fishery stocks are data-limited (Geromont and Butterworth, 2015). Therefore, more assessment methods based on sparse data need to be developed and adopted (Liu et al., 2019). The Monte Carlo method for capturing maximum sustainable yield (CMSY) developed by Froese et al. (2017) and the closely related Bayesian state-space Schaefer production model (BSM) provide a new solution. These two methods use only catch data (CMSY) or catch and abundance data (BSM) to assess the status of developed fish stocks. The main advantage of BSM compared to other implementations of surplus production models is its focus on “informative priors” and the acceptance of short and incomplete catch per unit effort (CPUE; Froese et al., 2017). Froese et al. (2018) successfully applied these methods to 397 European stocks to examine their current status, exploitation pattern, future catch, and profitability.
Japan is one of the most important fishing countries in East Asia, and fishery production occupies an important position in its national economy. In 1997, the Japanese Fisheries Agency has introduced the Total Allowable Catch (TAC) system, combined with traditional effort limitations (Makino, 2011; FAO, 2018). Since then, the Fisheries Research Agency of Japan (FRA) has released annual assessment reports for main commercial stocks, based on data sets obtained from fisheries and research surveys, such as catches, fishing efforts, length frequencies, and catch-at-age data. Some basic information about the status of the exploited stocks are presented, mainly including (1) length composition and the age structure of the catch, (2) the estimation of recruitment, (3) the variation of catches and biomass, and (4) suggested next-year catches. However, the official assessments lack the estimation of maximum sustainable yield (MSY) and relative biomass (B/B0; stock size relative to unexploited stock), which are important fisheries reference points for management. Besides, the information published by FRA is exclusively in Japanese, and it makes much of the information relatively inaccessible outside Japan.
Therefore, in this contribution, we abstracted catch and biomass data of 11 exploited stocks in the Japan Sea from the official reports, including nine fish stocks (Arctoscopus japonicus, Cleisthenes pinetorum, Eopsetta grigorjewi, Hippoglossoides dubius, Pseudopleuronectes herzensteini, Paralichthys olivaceus, Pagrus major, Gadus chalcogrammus, and Glossanodon semifasciatus) and two invertebrate stocks (Chionoecetes opilio and Pandalus eous), and assessed them with CMSY and BSM methods. In the results, we provided estimates of the intrinsic population growth rate (r), carrying capacity (k), MSY, relative biomass, and stock status for the stocks in question, and then compared the MSY estimates with reported catches, calculating how much catch was lost due to the lack of MSY. Based on CMSY and BSM methods, this contribution presented new insights about the exploitation and status of these 11 stocks, which can make a point for better management.
Materials and Methods
Data Sources
Altogether, 11 stocks in the Japan Sea were analyzed (Table 1). Fishing entities exploring the stocks in the Japan Sea include Japan, South Korea, Russia, and North Korea. Japan is the dominant fishing nation in this area, and the catch and CPUE data from Japan represent the overall trend. Besides, the successive catch and biomass data are not available from other countries; thus, only fishery data from Japan were used in our contribution. All of the data used for stock assessments were abstracted from published reports from the Fisheries Agency of Japan in 2018 (full data set, see Supplementary Material 1 for details).
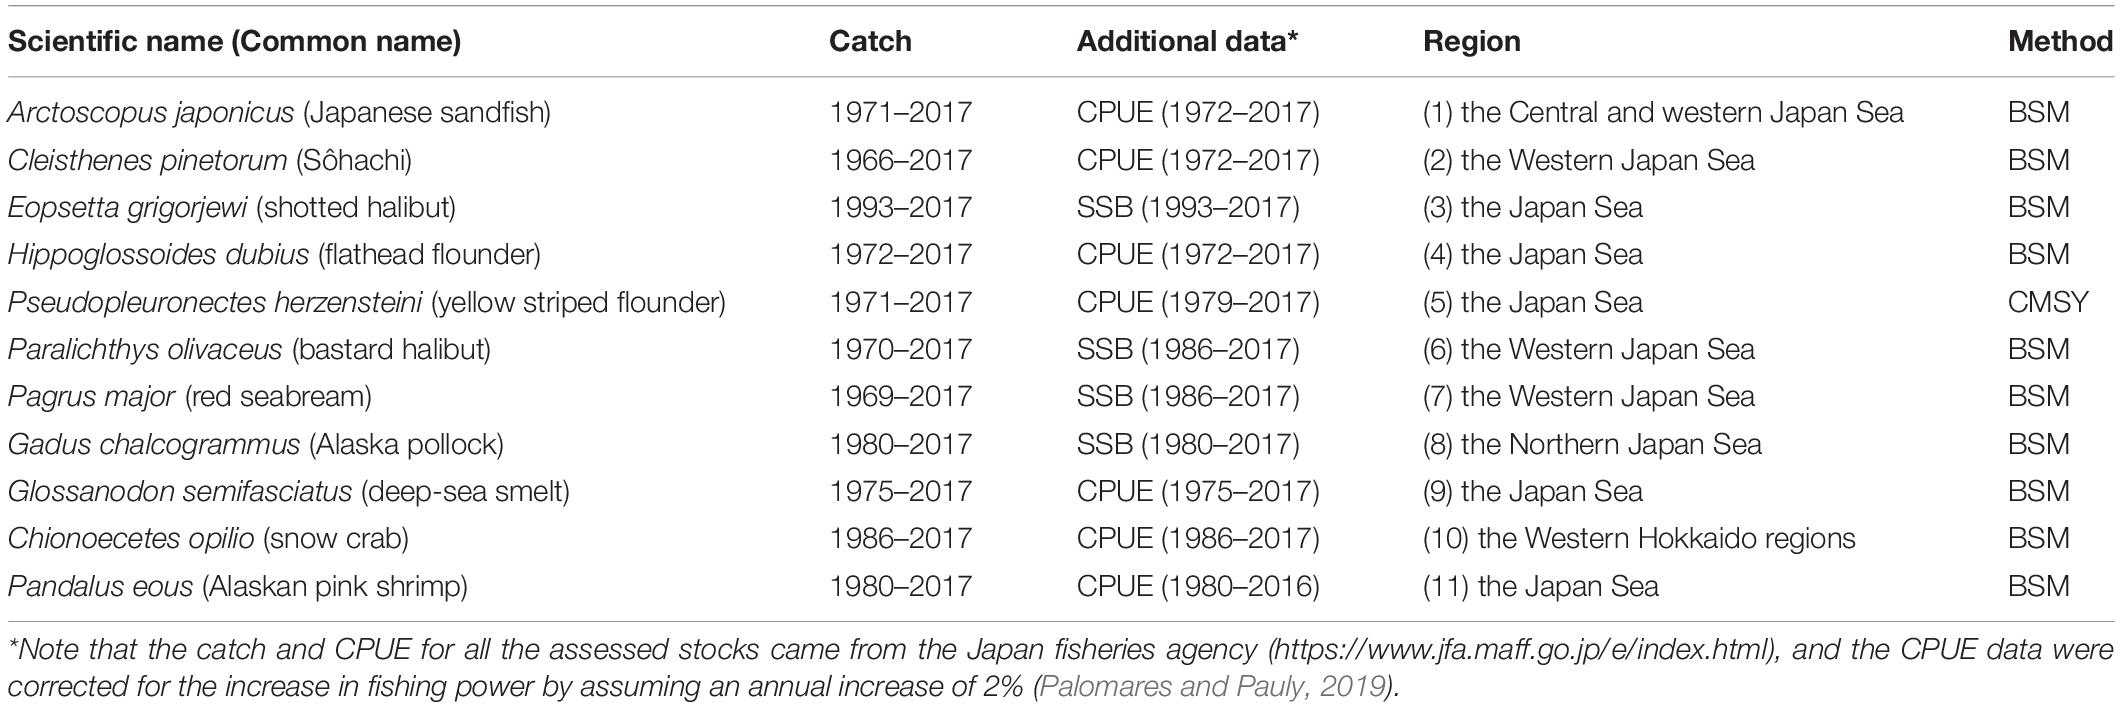
Table 1. Summary of catch and CPUE data of 11 exploited populations in the Japan Sea.
Methods of the CMSY and BSM
The CMSY and BSM methods used in this study are extensively described in Froese et al. (2017). Given that all 11 populations have available CPUE or SSB data in addition to their catch data, they were analyzed by both CMSY and BSM methods. All algorithms and analyses are implemented through the R code provided by Froese et al. (2017).
The prior of r range is required in implementing CMSY and BSM methods. To define the prior boundaries of r for the 11 stocks evaluated, the proxies of resilience provided in FishBase1 or SeaLifeBase2 were converted to r ranges (Table 2).
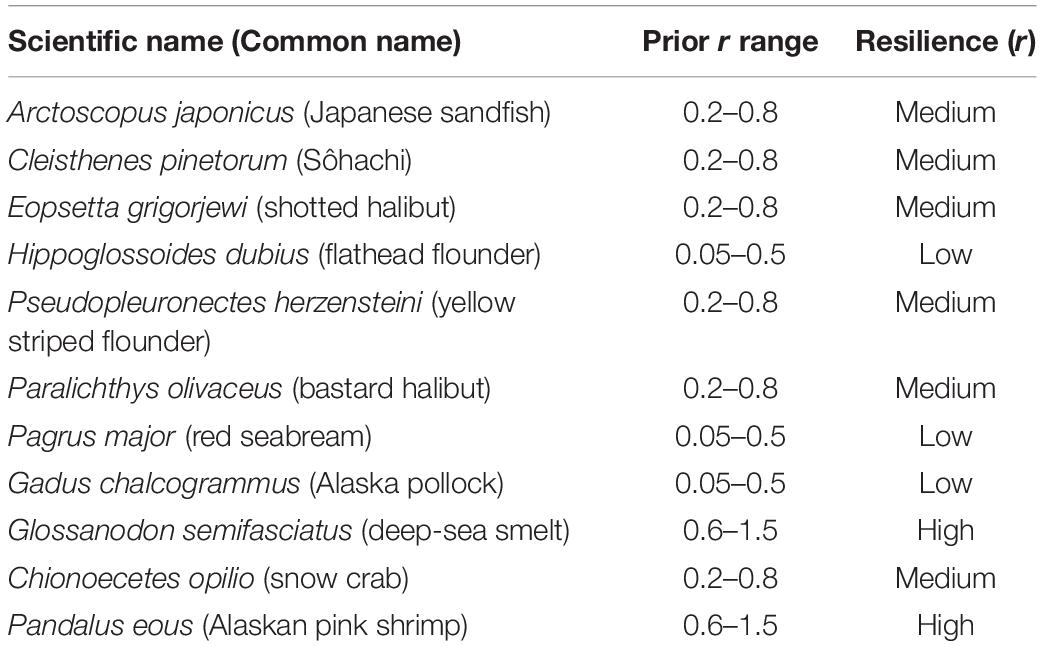
Table 2. Ranges of intrinsic population growth rates (year–1) suggested by FishBase (www.fishbase.org) and SeaLifeBase (www.sealifebase.ca) for the populations studied.
Setting Prior Biomass Ranges
Both the CMSY and BSM methods require estimates of relative biomass (Bt/k), the proportion of the carrying capacity that is present at the beginning and end of the time series, i.e., Bstart/k and Bend/k (Froese et al., 2017). Table 3 summarized prior estimates of relative biomass we set for the 11 stocks, based on their depletion level at the beginning and end of the time series, and optionally in an intermediate year. Data source came from published reports from the Fisheries Agency of Japan (2018), where biomass variation was presented. We set the initial depletion level of A. japonicus, H. dubius, P. olivaceus, G. chalcogrammus, and G. semifasciatus as low (Bstart/k = 0.4–0.8), and C. pinetorum, P. herzensteini, P. major, C. opilio, and P. eous as medium (Bstart/k = 0.2–0.6). For E. grigorjewi, whose time series of catch data begins after 1990, the Fisheries Agency of Japan (2018) reported low initial biomass due to the rapid development of fishing techniques; thus, we set its Bstart/k as strong (Bstart/k = 0.01–0.4). We chose a strong depletion at the end year of the time series for A. japonicus, E. grigorjewi, P. herzensteini, and G. chalcogrammus. For the other stocks, we found sources suggesting medium depletion. We also included intermediate biomass priors for some stocks in the analysis as this approach can greatly improve the accuracy of the models (Table 3; Froese et al., 2017).
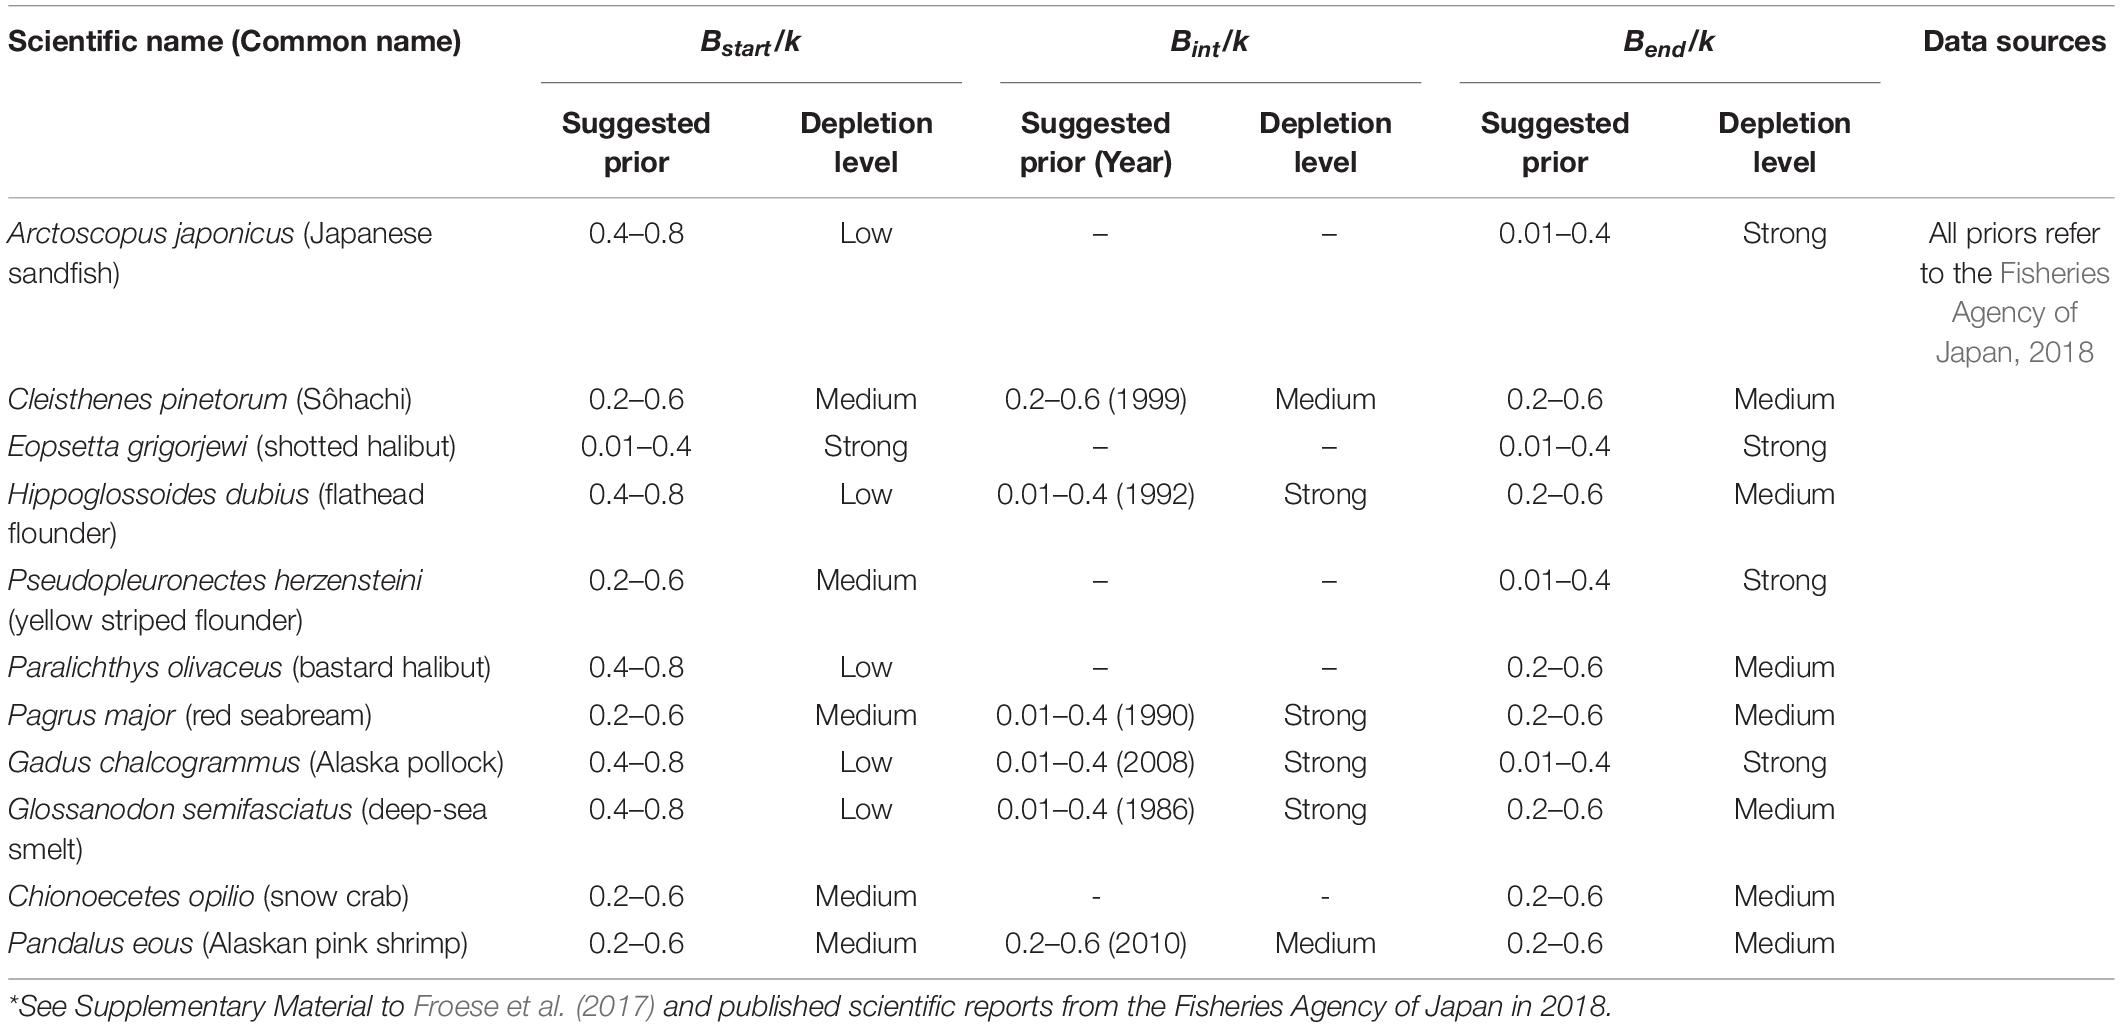
Table 3. Suggested ranges of Bstart/k, Bint/k, and Bend/k for the period before catch data became available*.
The CMSY method generates the geometric mean and 95% confidence intervals for each parameter estimate (Schaefer, 1954; Ricker, 1975). When additional constraints were available (e.g., CPUE or SSB), we also ran the BSM method (Froese et al., 2017). The predicted relative total biomass (B/BMSY) in the last year is used to assess the stock status derived from BSM and CMSY methods (Table 4; Palomares et al., 2018), where 2 × Bend/k = BMSY, as MSY is taken at 0.5 k.
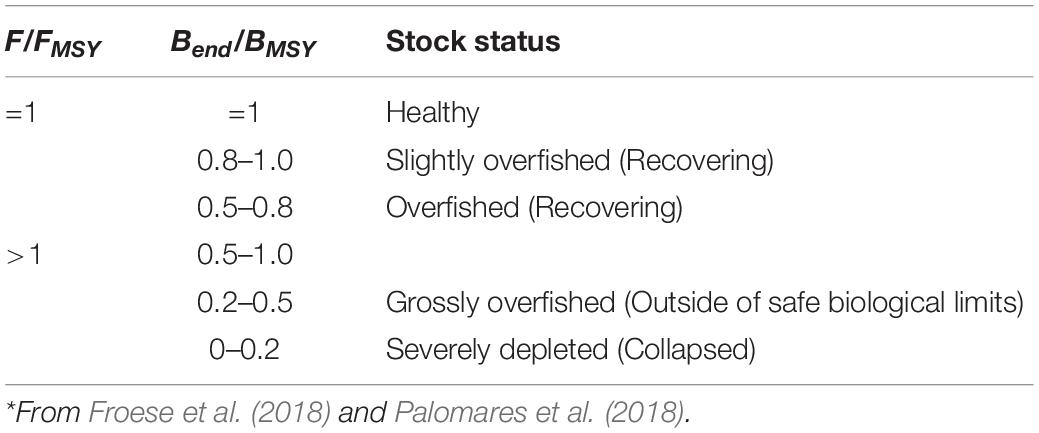
Table 4. Definition of fish stock status, based on F/FMSY and B/BMSY in the final year of a time series*.
Results
CMSY and BSM methods were applied to the 11 stocks. Given that BSM combines information from both catch and biomass data and had more reliable estimates, only BSM results were presented here. Most stocks covered in this study showed similar biomass trajectories, with high biomass occurring at the beginning of time series and low biomass in recent years. Here, we took P. olivaceus as an example to illustrate the output. The full results of the other species were presented in Supplementary Material 2.
Figure 1A shows a good correlation between carrying capacity (k) and r values with both CMSY and BSM methods producing a “best” r–k pair with a 95% confidence interval (CI). The biomass trajectories generated by CMSY and BSM for the P. olivaceus (Figure 1B) agree well with the CPUE observations. The predicted P. olivaceus catch over time shows fluctuations around the MSY (the MSY estimate was 1,440 tons per year; Table 5 and Figure 1C) of about ± 500 tons year–1, with an overall decline from 1980 to 2017. The predicted relative total biomass (B/BMSY) also declined from the mid-1970s to 2000 and then flattened. From the results of our assessment, the current status of P. olivaceus stock is overfished (Figure 1D; B/BMSY = 0.724). The match between the predicted P. olivaceus catch and the observed catch was within 95% confidence intervals for the entire model time period (Figure 1E). The CPUE observation was also within the 95% confidence interval of the predictions for the entire time period (Figure 1F). Residuals were very small and could be ignored (Supplementary Material 2).
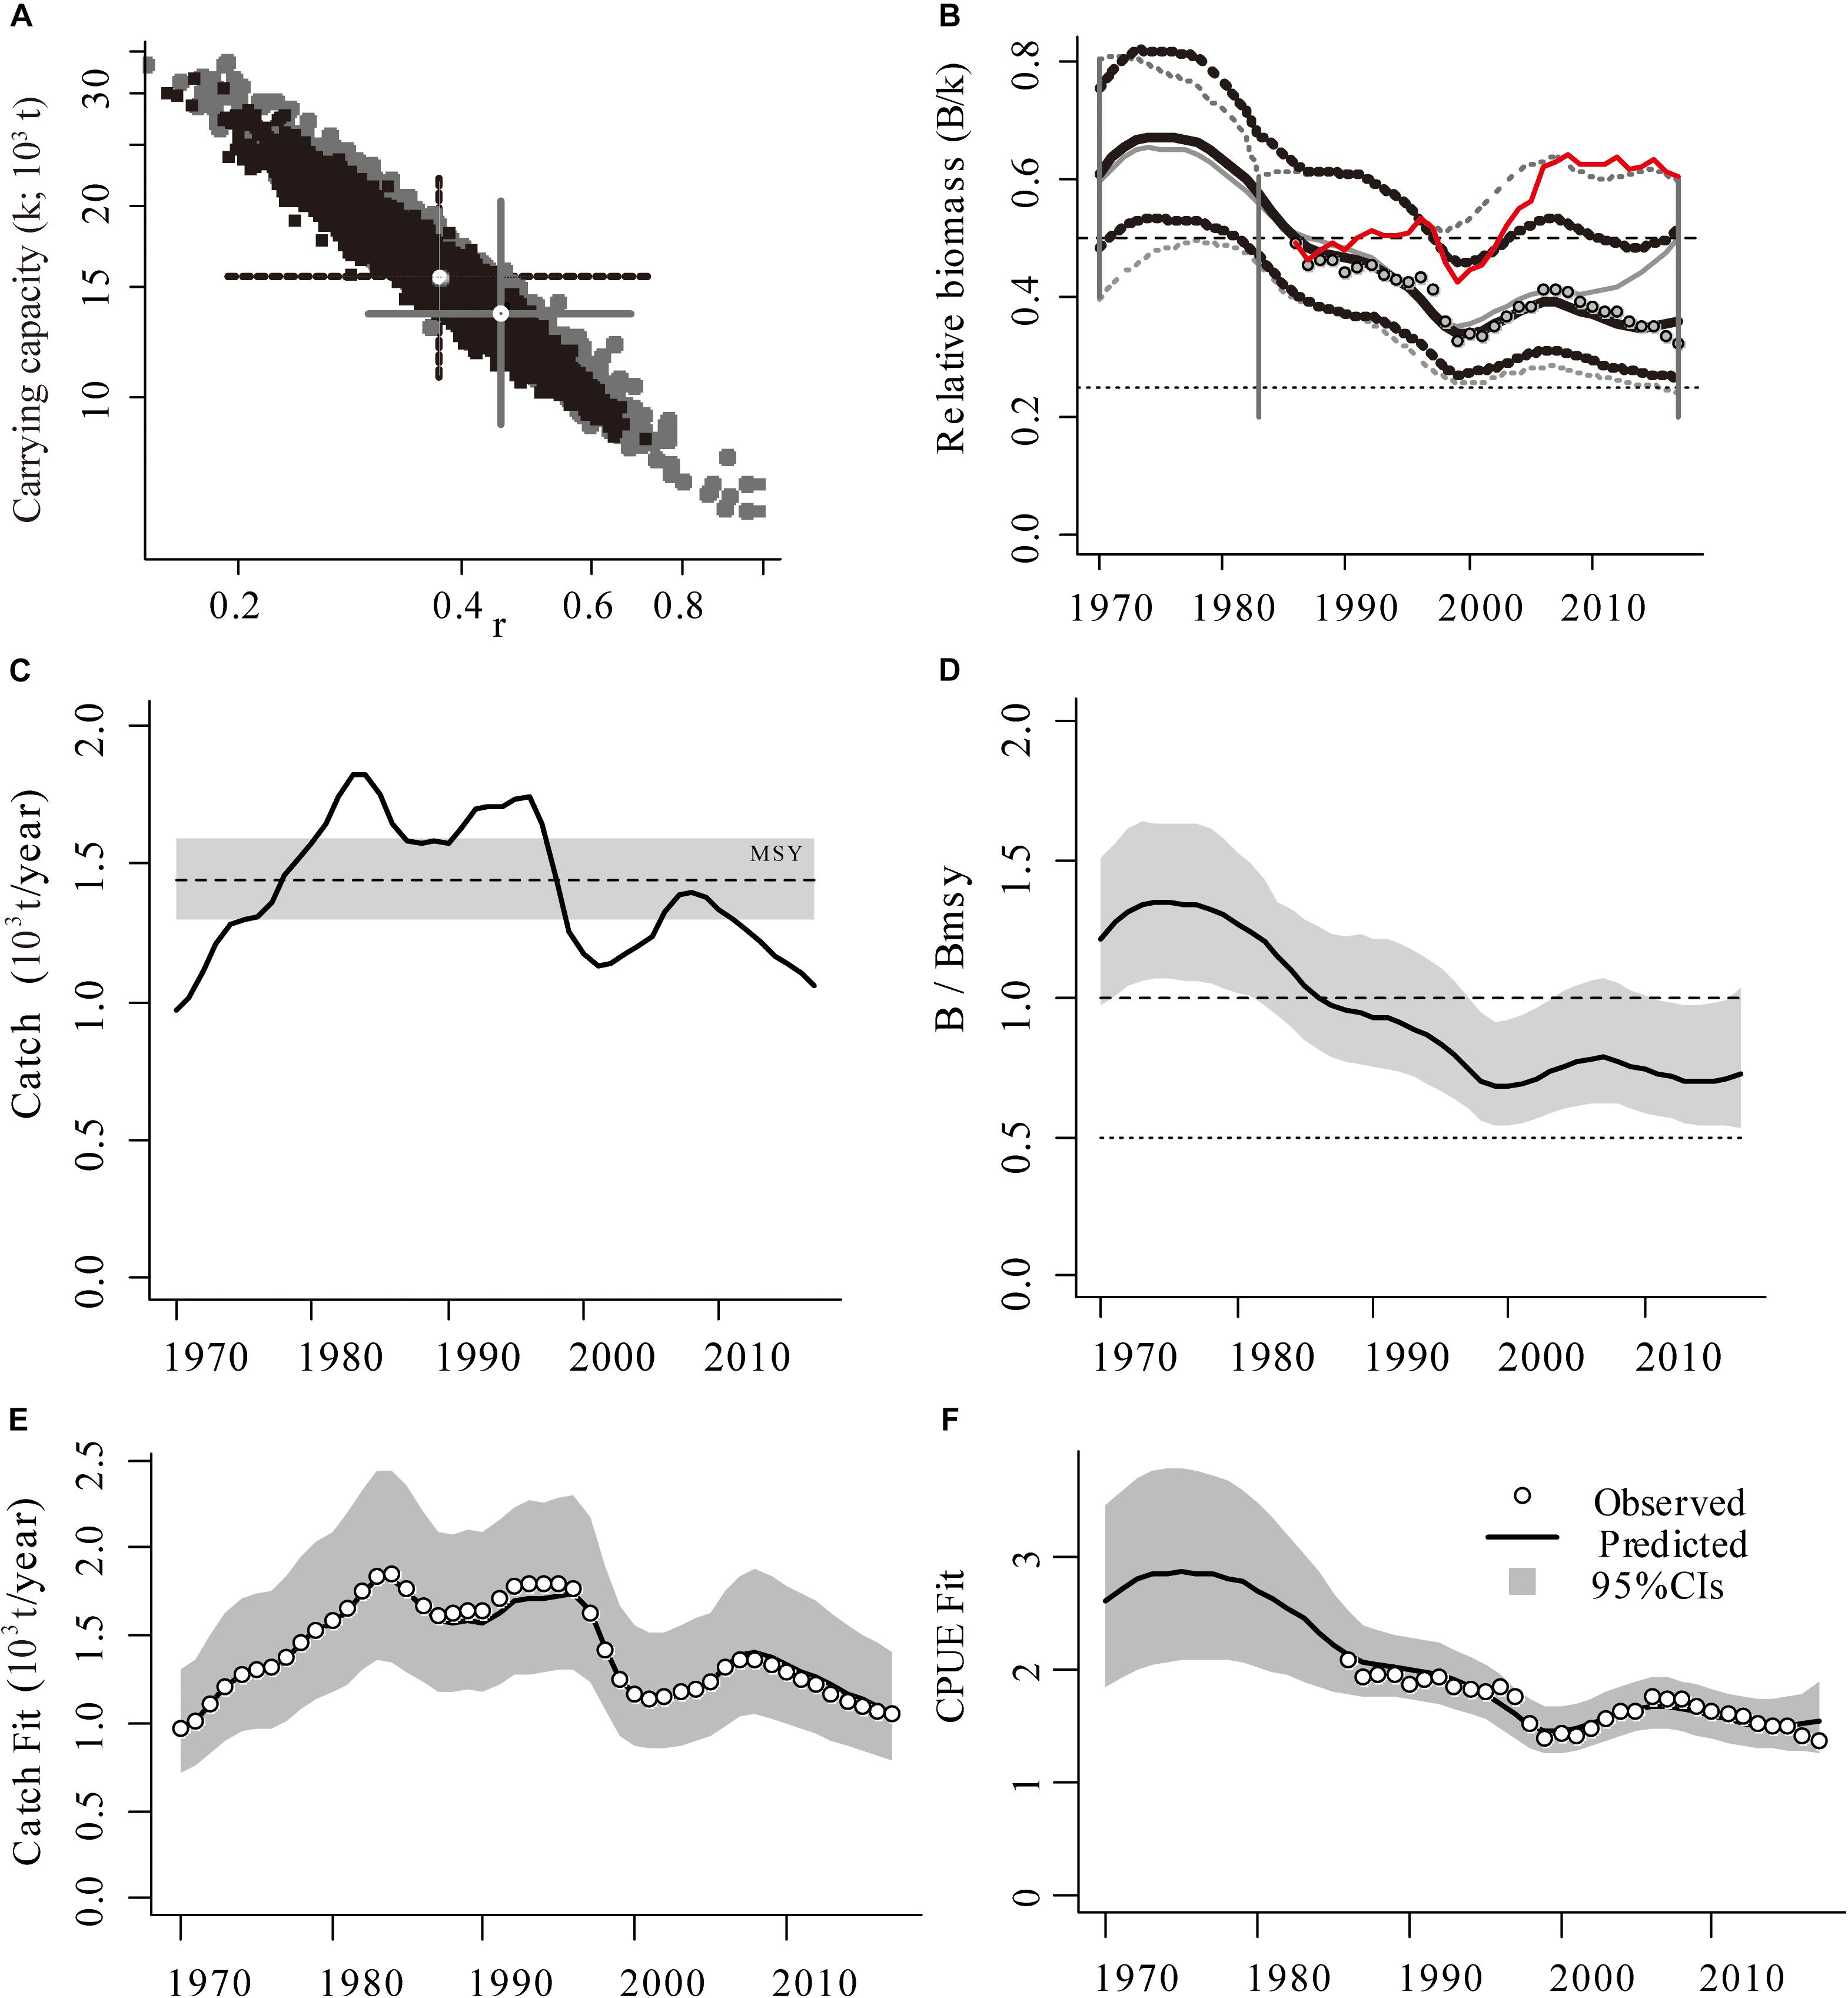
Figure 1. (A) Example of the viable r–k pairs from CMSY (in gray) and BSM (in black) methods. (B) The crosses indicate the most probable pairs and their 95% confidence intervals (solid cross: CMSY; dotted cross: BSM; Red curve: the correction of CPUE for effort creep). (C) Catches relative to MSY with indication of 95% confidence limits in gray, and (D) development of predicted relative total biomass (B/BMSY), with the gray area indicating uncertainty. (E) The fit of the median of predicted catch, with approximate 95% confidence limits, to the observed catch (points), and (F) a similar graph for predicted vs. observed CPUE (for Paralichthys olivaceus).
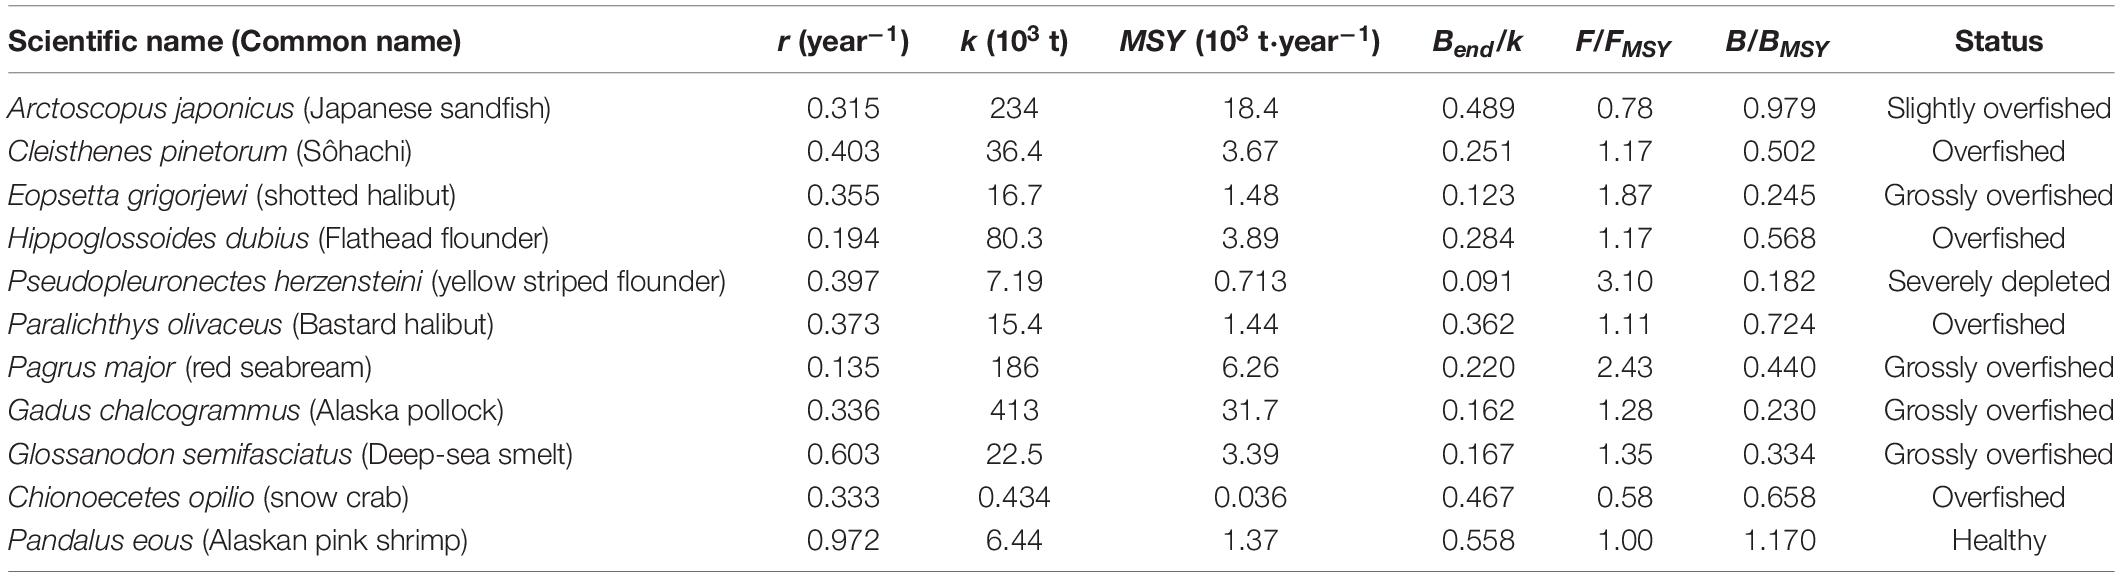
Table 5. Summary of r, k, MSY, relative biomass, and status for 11 populations assessed using the BSM methods.
Status of the 11 stocks can be defined according to their terminal B/BMSY estimates. Table 5 summarized r, k, MSY, relative biomass, and status for 11 stocks assessed using the BSM methods. Catch and relative biomass trajectories were visually shown in Figures 2, 3. Except for P. eous, the terminal B/BMSY values for the other 10 assessed stocks were less than 1, indicating that these stocks were overfished at different levels (Table 5). The stock of A. japonicus was slightly overfished (Table 5; 0.8 < B/BMSY < 1; Figure 2A) in recent years, although it suffered an overfished (Table 5; Bend/BMSY < 0.5) stage in the late 1990s. Four stocks, including C. pinetorum, H. dubius, P. olivaceus, and C. opilio were overfished (Table 5; 0.5 < Bend/BMSY < 0.8), as shown in Figures 2B,D,F,J, while they were in good condition in the early years of the time series. The stocks of E. grigorjewi, P. major, G. chalcogrammus, and G. semifasciatus (Figures 2C,G,H,I) were grossly overfished (Bend/BMSY < 0.5) according to the definition of fish stock status in Palomares et al. (2018). The stock of P. herzensteini was severely depleted (Figure 2E; Bend/BMSY < 0.2). Only P. eous was healthy (Bend/BMSY = 1) as shown in Figure 2K and Table 5.
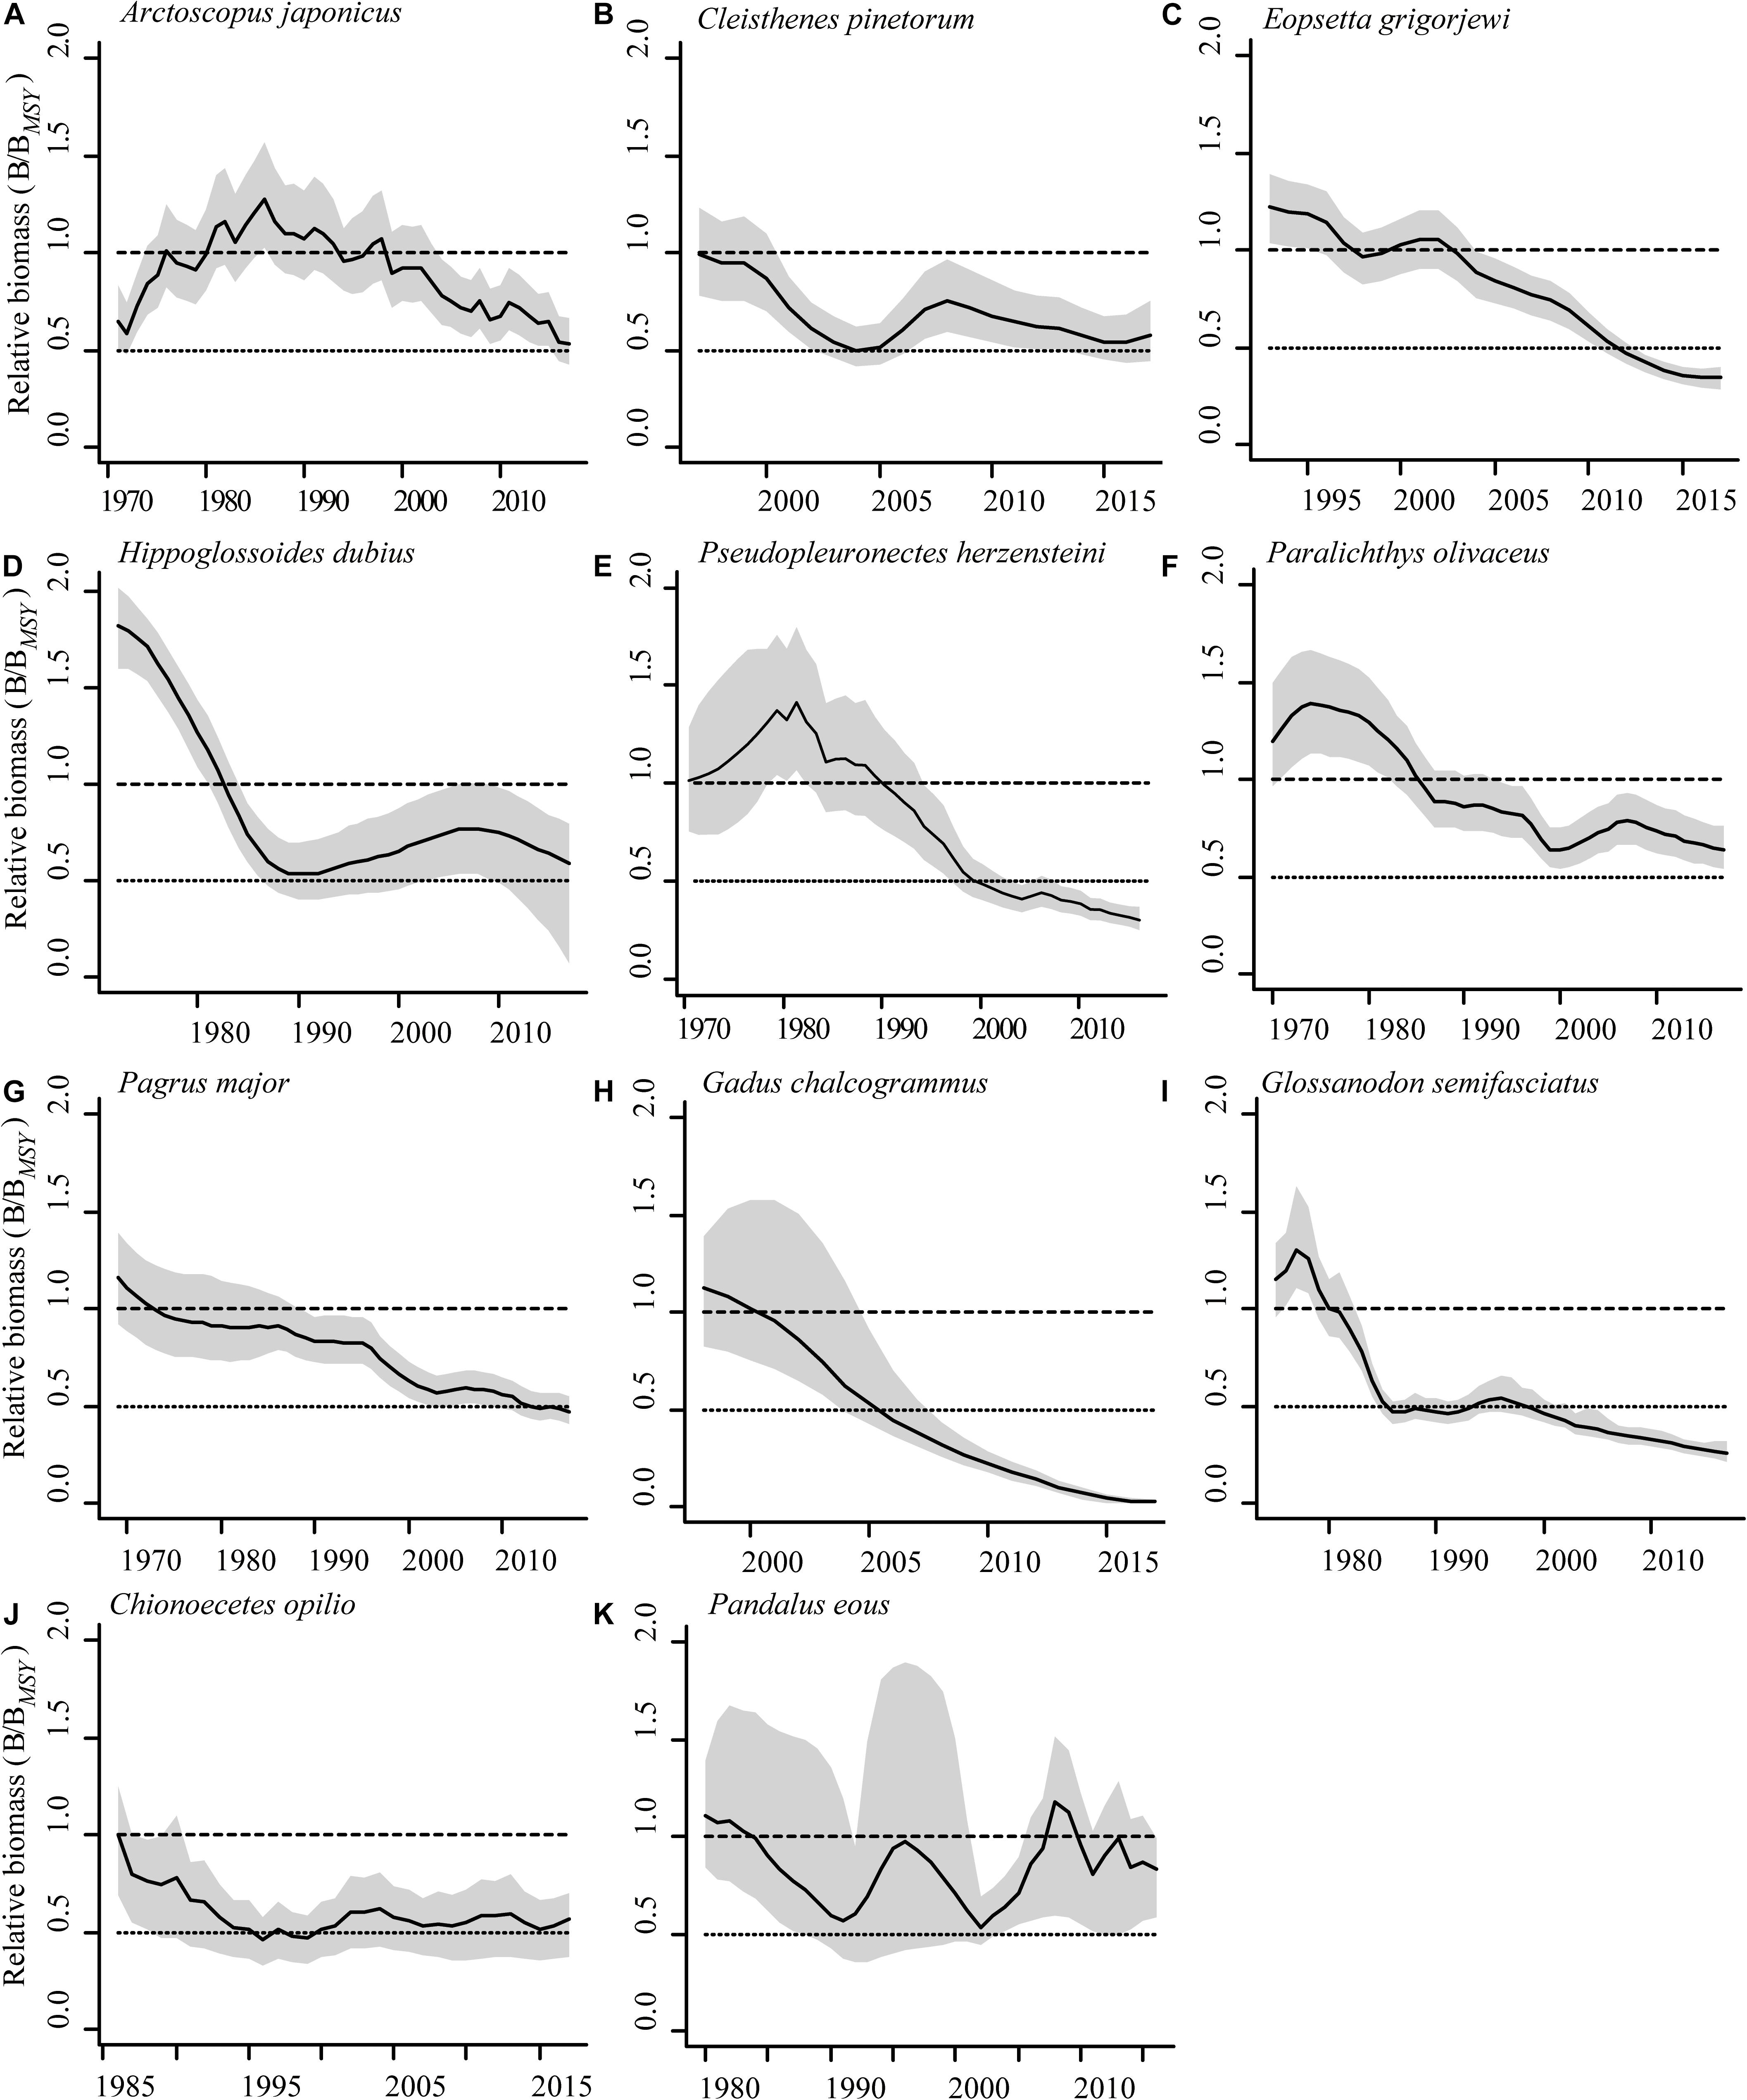
Figure 2. Trajectories of relative total biomass (B/BMSY) of 11 stocks in the Japan Sea.
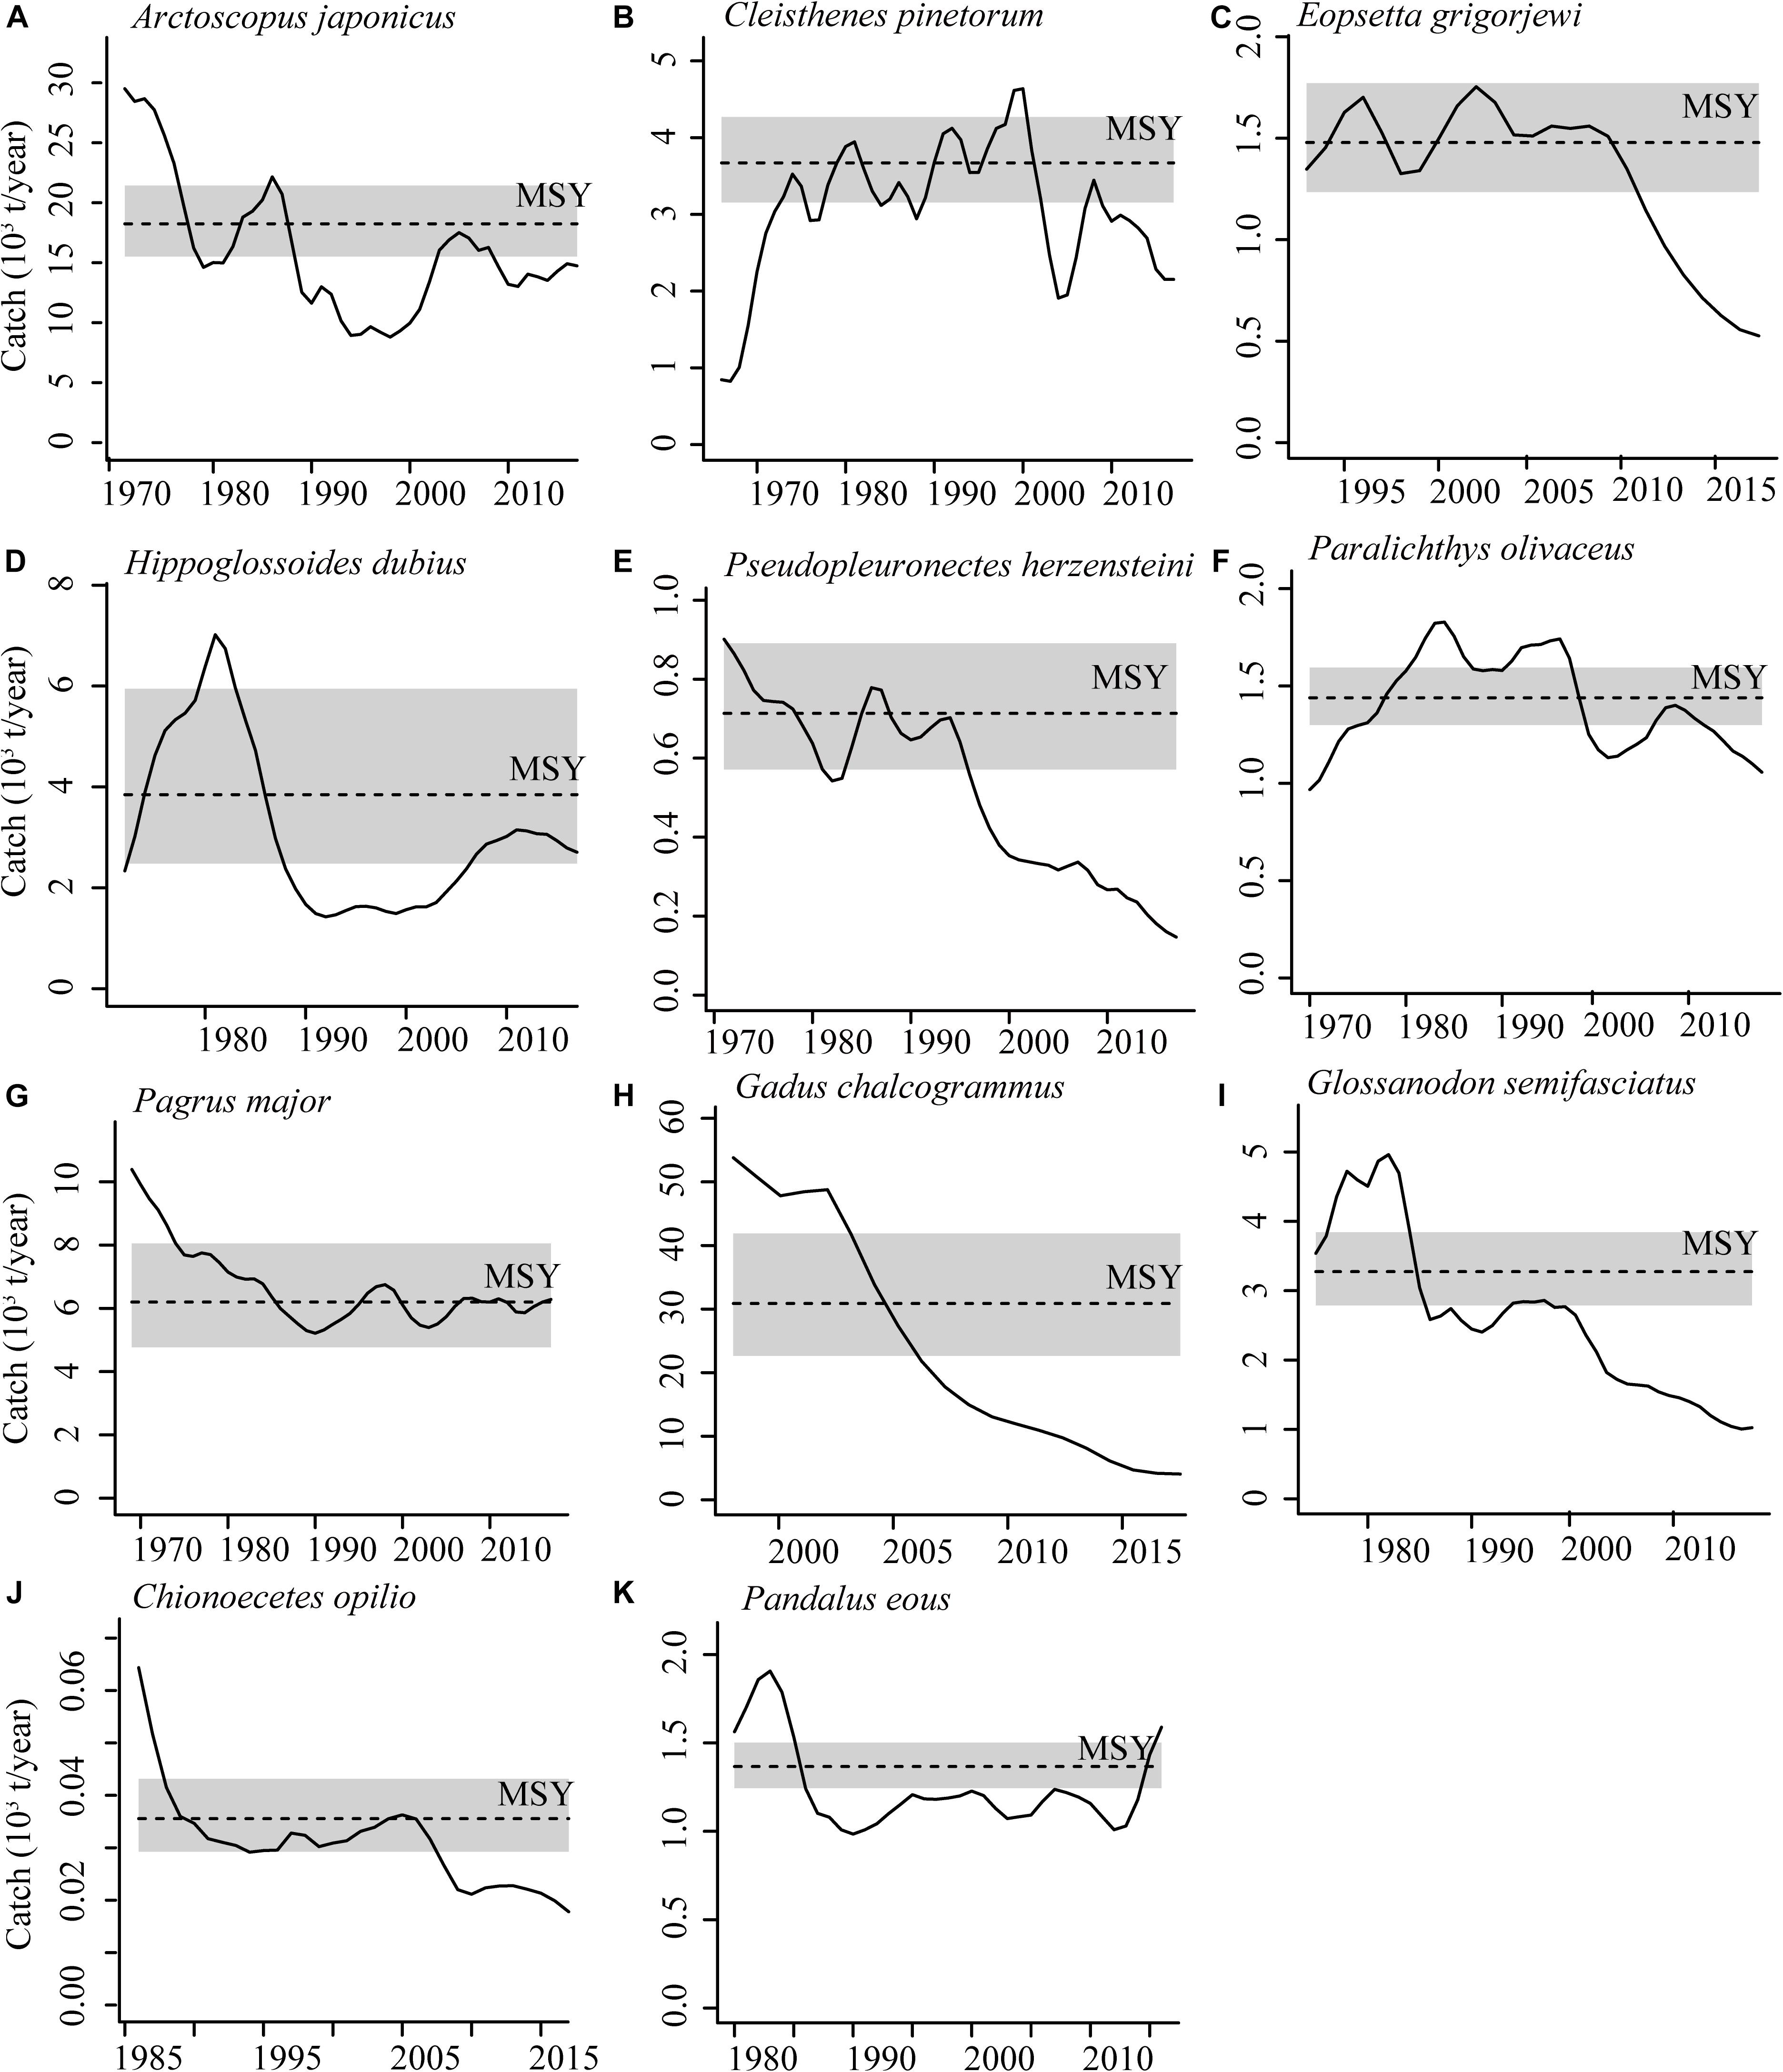
Figure 3. Trajectories of catch of 11 stocks in the Japan Sea.
A fishing pressure (F/FMSY)–stock state (B/BMSY) plot was used to further illustrate the status of 11 stocks in question. As was shown in Figure 4, eight stocks are overexploited and/or outside of safe biological limits in the final years of time series. C. opilio and A. japonicus are distributed in the yellow area, which means that they are benefiting from low fishing pressure, and the stocks are recovering. P. eous is distributed in a green area, indicating that it is exploited by sustainable fishing pressure and the biomass can produce high yields close to MSY (Figure 4).
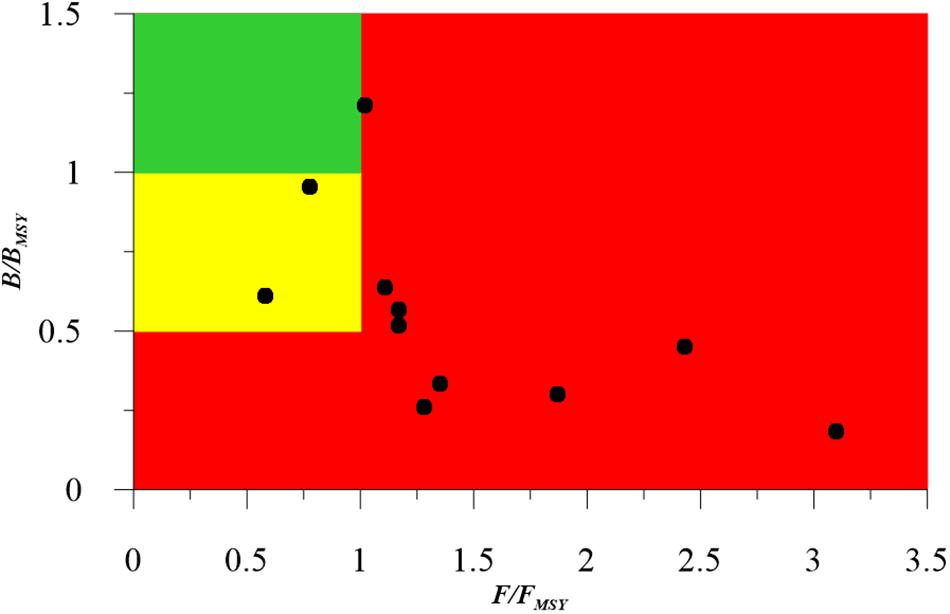
Figure 4. Presentation of 11 stocks in Japan Sea in a pressure (F/FMSY)–stock state (B/BMSY) plot, for the last years with available data (2016–2017). Red area: stocks that are being overfished or are outside of safe biological limits; yellow area: recovering stocks; green area: stocks subject to sustainable fishing pressure and of a healthy stock biomass that can produce high yields close to MSY.
With the MSY estimates given by the BSM method, we contrasted it with the corresponding reported catches, highlighting how much catch was lost due to inefficient management (Figure 3). The results showed that catch losses of the nine stocks (P. major and G. chalcogrammus not included) varied from 135 tons (C. opilio) to 106,022 tons (A. japonicus), with an average of 25,112 tons. The total catches of P. major and G. chalcogrammus were more than their total MSYs, which indicated that in recent years, the stocks in the Japan Sea were still in great fishing pressure.
Discussion
With the increased use of power trawlers and other new fishing gears, the growing demand for seafood has led to overexploitation of marine resources, and the fishing industry has witnessed a net decline in recruitment and profits in the past 20 years (Pitcher and Lam, 2015; Wang et al., 2020). The depletion of fishery resources would generate a major impact on fishing countries, especially for Japan, where the fishing industry plays an important role, and seafood is an essential source of animal protein.
Rational exploitation of fishery resources requires scientific stock assessment. Most traditional stock assessment models require large amounts of data, which limits their implementation to data-rich species (Carruthers et al., 2014). Relatively little attention has been paid to other species (Pauly, 2006; Costello et al., 2012). In this contribution, the data-limited stock assessment methods CMSY and BSM were applied to 11 important commercial fish and invertebrate stocks in the Japan Sea. The BSM method helped fully understand the nature of stock dynamics by using catch and biomass (CPUE or SSB) data and provided estimates for important fisheries reference points, i.e., MSY and relative biomass, which were not available in the original official assessment reports (Fisheries Agency of Japan, 2018). This study presented new insights about the exploitation and status of these 11 stocks and provided management implications for the stocks in question.
Long-term trends in fisheries production in Japan peaked in the late 1980s and then declined sharply with the collapse of Japanese sardine (Tian et al., 2006; Ren and Liu, 2020). The reason was mainly due to heavy fishing, followed by the effect of the reduction in seawater temperature during this period (Tian et al., 2006). In addition to Japanese sardines, the production of other fish species has also declined since the 1980s, such as the nine fish stocks in our contribution (Figure 3). The decline in catch generally corresponds to biomass depletion (Figure 2), and our results are consistent with the few previous studies on these stocks. An assessment of extinction risk for marine fishes also highlighted the over-fishing of P. major (Comeros-Raynal et al., 2016; Shin et al., 2018), which was consistent with our assessment (Figure 2G) and should be taken seriously. In addition, the status assessment conducted for the commercially important species P. herzensteini was also similar to our results (Figure 2E), which showed that the stock declined to a low level in recent years (Fisheries Research Institute of Hokkaido Research Organization, 2017; Joh and Wada, 2018). Based on the total catch, G. chalcogrammus is the second most important fish species in the world. From Alaska to northern Japan, about 3 million tons of G. chalcogrammus are caught annually (FAO, 2010). The Fisheries Agency of Japan and our BSM model have both reported the low level of G. chalcogrammus resource in 2018 (Fisheries Agency of Japan, 2018; Figure 3H).
Since 1950, global invertebrate catches have rapidly expanded with a sixfold increase in biomass and double the number of taxa reported. By 2004, 34% of invertebrate fisheries were overexploited, collapsed, or closed (Anderson et al., 2011). In the Japan Sea, catch of invertebrate species (e.g., crab, pink shrimp) was high during most of the 1970–1980s, but it declined to generally low catches in the 1990s (Tian et al., 2008). At the same time, a variety of stock management measures were carried out in the southwestern coastal regions of the Japan Sea (Yamasaki, 1994). These measures seem to have had a positive effect on the stocks: the declining trend of C. opilio in landings ceased in 1995 and the stocks gradually increased until 2000 (Kon et al., 2003). The population gradually recovered by 2011, but then dropped again before 2015; it seems to have improved in recent years (Mao et al., 2019). The results simulated by the BSM method in the study are similar to this trend (Figures 2J, 3J). P. eous is another important invertebrate fishery in the North Pacific due to its short life cycle (Koeller et al., 2003; Ouellet and Chabot, 2005). The biomass of P. eous along the coast of Honshu Island modeled by the BSM method showed a decreasing trend from the 1980s to the early 1990s, followed by a rapid increase from the end of the 1990s until 2000. P. eous is the only stock that our study found at a healthy level, which was also reported a high biomass level in the Fisheries Agency of Japan report (Fisheries Agency of Japan, 2018).
Among the 11 stocks in question, 10 stocks have current biomass that is smaller than 50% of unexploited biomass (Bend/B0 < 0.5 or Bend/BMSY < 1), which means that these stocks are not large enough to produce MSY or fulfill their ecosystem roles as prey or predator and are likely ill prepared for climate change due to restricted genetic variability. Moreover, our results showed that if the current fishing pressure was maintained, the stock status of eight stocks would be getting worse, except for C. opilio, A. japonicus, and P. eous, whose current fishing pressure was lower than or equal to the one that would generate MSY (Figure 4 and Table 5).
A proper conceptualization of MSY was first proposed by Schaefer (1954), and MSY has now been legally and widely adopted for world fisheries with intent to enable fishermen to obtain a maximum catch that is sustainable and to protect overfished stocks (CCRF, 2004; ISEU, 2006). Based on the estimates of MSY generated by the BSM method and the reported catches, nine stocks’ catches were lower than their MSYs, and the lost catch varied among different stocks. The other two stocks, i.e., P. herzensteini and P. major, whose reported catches were higher than their MSYs, correspond to high F/FMSY and low B/BMSY, indicating that both of them are suffering from overexploitation, and more efficient management measures are needed.
As one of the most important fishery countries, Japan has been committed to the rational exploitation and protection of fishery resources. Now, by using only fishery data, CMSY and BSM methods provide a new way to estimate stock dynamics and important fisheries reference points, which will enrich the current official reports, and solve the dilemma for data sparse stocks. We expect that the quantitative assessments conducted in our contribution will contribute to future improvements in fisheries and management systems in Japan Sea and help us understand the state of global fisheries resources in greater details.
Conclusion
The CMSY and BSM methods were used to estimate important fish stocks in the Japan Sea. Of 11 stocks studied, 1 stock was slightly overfished, 4 stocks were overfished, 4 stocks were grossly overfished, and 1 was severely depleted; only 1 stock, P. eous, was in good condition (healthy). This result suggests that fisheries managers in Japan should implement recovery measures. With regard to the CMSY and BSM methods we deployed, we conclude that the results obtained using these methods are very consistent with the limited observations of these 11 stocks in the Japan Sea. For the assessment of data-limited stocks, both are very effective and useful.
Data Availability Statement
All datasets generated for this study are included in the article/Supplementary Material.
Author Contributions
SZ analyzed the data and wrote the original draft. YBW and YCW collected the data and provided guidance on the data analysis and structure of our contribution. CL and WX were responsible for conceptualization, methodology, and reviewing and editing the manuscript. All authors contributed to the article and approved the submitted version.
Funding
This work was supported by grants from the National Natural Science Foundation of China (Nos. 41976094 and 31872568), the Key Deployment Project of Center for Ocean Mega-Science, Chinese Academy of Sciences (COMS2019Q14), and the Youth Innovation Promotion Association CAS.
Conflict of Interest
The authors declare that the research was conducted in the absence of any commercial or financial relationships that could be construed as a potential conflict of interest.
Acknowledgments
SZ acknowledges China Scholarship Council (CSC) for the support. We thank the Sea Around Us Pauly and M. L. Palomares for co-hosting a CMSY workshop in Qingdao in June 2019. We thank R. Froese for his participation via Skype at the workshop. We also thank Patricia L. Yager for her comments on our manuscript and polishing the language.
Supplementary Material
The Supplementary Material for this article can be found online at: https://www.frontiersin.org/articles/10.3389/fmars.2020.525363/full#supplementary-material
Footnotes
References
Anderson, S. C., Flemming, J. M., Watson, R., and Lotze, H. K. (2011). Rapid global expansion of invertebrate fisheries: trends, drivers, and ecosystem effects. PLoS One 6:e14735. doi: 10.1371/journal.pone.0014735
Carruthers, T. R., Punt, A. E., Walters, C. J., MacCall, A., McAllister, M. K., Dick, E. J., et al. (2014). Evaluating methods for setting catch limits in data-limited fisheries. Fish. Res. 153, 48–68. doi: 10.1016/j.fishres.2013.12.014
Christensen, V., Guénette, S., Heymans, J. J., Walters, C. J., Watson, R., Zeller, D., et al. (2003). Hundred-year decline of North Atlantic predatory fishes. Fish Fish. 4, 1–24. doi: 10.1046/j.1467-2979.2003.00103.x
Comeros-Raynal, M. T., Polidoro, B. A., Broatch, J., Mann, B. Q., Gorman, C., Buxton, C. D., et al. (2016). Key predictors of extinction in sea breams and porgies (Family: sparidae). Biol. Conservat. 202, 88–98. doi: 10.1016/j.biocon.2016.08.027
Costello, C., Ovando, D., Hilborn, R., Gains, S. D., Deschenes, O., and Lester, S. E. (2012). Status and solutions for the world’s unassessed fisheries. Science 338, 517–520. doi: 10.1126/science.1223389
Fisheries Agency of Japan (2018). Marine fisheries stock assessment for Japanese waters in 2018. Cianjhen: Fisheries Agency. Available online at: https://www.jfa.maff.go.jp/e/index.html
Fisheries Research Institute of Hokkaido Research Organization (2017). Reports of Stock Assessment for Fishery Resources Around Hokkaido in 2017. http://www.fishexp.hro.or.jp/exp/central/kanri/SigenHyoka/Kokai/. [in Japanese] (accessed January, 2020).
Froese, R., Demirel, N., Coro, G., Kleisner, K. M., and Winker, H. (2017). Estimating fisheries reference points from catch and resilience. Fish Fish. 18, 506–526. doi: 10.1111/faf.12190
Froese, R., Winker, H., Coro, G., Demirel, N., Tsikliras, A. C., Dimarchopoulou, D., et al. (2018). Status and rebuilding of European fisheries. Mar. Pol. 93, 159–170. doi: 10.1016/j.marpol.2018.04.018
Geromont, H. F., and Butterworth, D. S. (2015). FAO Report: a Review of Assessment Methods and the Development of Management Procedures for Data-poor Fisheries. The Marine Resource Assessment and Management Group (MARAM). South Africa: University of Cape Town.
ISEU (2006). Implementing Sustainability in EU Fisheries through Maximum Sustainable Yield, CEC, COM 360. Brussels: ISEU.
Joh, M., and Wada, A. (2018). Inter-annual and spatial difference in hatch date and settlement date distribution and planktonic larval duration in yellow striped flounder Pseudopleuronectes herzensteini. J. Sea Res. 137, 26–34. doi: 10.1016/j.seares.2018.04.002
Koeller, P. A., Covey, M., and King, M. (2003). Is size at sex transition an indicator of growth or abundance in pandalid shrimp? Fish Res. 65, 217–230. doi: 10.1016/j.fishres.2003.09.016
Kon, T., Adachi, T., and Suzuki, Y. (2003). Distribution of snow crab, Chionoecetes spp., larvae off Wakasa Bay in the Sea of Japan. Fish. Sci. 69, 1109–1115. doi: 10.1111/j.0919-9268.2003.00735.x
Liang, C., and Pauly, D. (2017). Fisheries impacts on China’s coastal ecosystems: unmasking a pervasive ‘fishing down’ effect. PLoS One 12:e0173296. doi: 10.1371/journal.pone.0173296
Liu, Z. L., Yuan, X. W., Yang, L. L., Yan, L. P., and Cheng, J. H. (2019). Stock assessment and management strategies for small yellow croaker in the East China Sea based on data-limited assessment models. J. Fish. Sci. China 26, 621–635. doi: 10.3724/SP.J.1118.2019.18291
Makino, M. (2011). Fisheries management in Japan: its institutional features and case studies. Springer Sci. Bus. Med. 2, 32–35. doi: 10.1007/978-94-007-1777-0
Mao, X., Guo, X., Kubota, T., and Wang, Y. (2019). Numerical studies on snow crab (Chionoecetes opilio) larval survival and transport in the Sea of Japan. Prog. Oceanograp. 179:102204. doi: 10.1016/j.pocean.2019.102204
Ouellet, P., and Chabot, D. (2005). Rearing Pandalus borealis (Krøyer) larvae in the laboratory. Mar. Biol. 147, 869–880. doi: 10.1007/s00227-005-1625-6
Palomares, M., and Pauly, D. (2019). On the creeping increase of vessels’ fishing power. Ecol. Soc. 24:31. doi: 10.5751/ES-11136-240331
Palomares, M. L., Froese, R., Derrick, B., Nöel, S., Tsui, G., Woroniak, J., et al. (2018). A Preliminary Global Assessment of the Status of Exploited Marine Fish and Invertebrate Populations. A Report Prepared by the Sea Around Us for OCEANA. Vancouver: The University of British Columbia.
Pauly, D. (2006). Major trends in small-scale marine fisheries, with emphasis on developing countries, and some implications for the social sciences. Maritime Stud. 4, 7–22.
Pauly, D., and Zeller, D. (2016). Catch reconstructions reveal that global marine fisheries catches are higher than reported and declining. Nat. Commun. 7:10244. doi: 10.1038/ncomms10244
Pitcher, T. J., and Lam, M. E. (2015). Fish commoditization and the historical origins of catching fish for profit. Maritime Stud. 14:2. doi: 10.1186/s40152-014-0014-5
Ren, Q., and Liu, M. (2020). Assessing northwest pacific fishery stocks using two new methods : the monte carlo catch-MSY (CMSY) and the Bayesian Schaefer Model (BSM). Front. Mar. Sci. 7:430. doi: 10.3389/fmars.2020.00430
Ricker, W. E. (1975). Computation and Interpretation of Biological Statistics of Fish Populations. Ottawa: Department of the Environment, Fisheries and Marine Service.
Schaefer, M. B. (1954). Some aspects of the dynamics of populations important to the management of the commercial marine fisheries. Int. Am. Trop. Tuna Com. Bull. 1, 23–56.
Shin, G. H., Shin, Y., Jung, M., Hong, J. M., Lee, S., Subramaniyam, S., et al. (2018). First draft genome for red sea bream of family Sparidae. Front. Genet. 9:643. doi: 10.3389/fgene.2018.00643
Tian, Y., Kidokoro, H., and Watanabe, T. (2006). Long-term changes in the fish community structure from the Tsushima warm current region of the Japan/East Sea with an emphasis on the impacts of fishing and climate regime shift over the last four decades. Prog. Oceanography 68, 217–237. doi: 10.1016/j.pocean.2006.02.009
Tian, Y., Kidokoro, H., Watanabe, T., and Iguchi, N. (2008). The late 1980s regime shift in the ecosystem of Tsushima warm current in the Japan/East Sea: Evidence from historical data and possible mechanisms. Prog. Oceanography. 77, 127–145. doi: 10.1016/j.pocean.2008.03.007
Tremblay-Boyer, L., Gascuel, D., Watson, R., Christensen, V., and Pauly, D. (2011). Modelling the effects of shing on the biomass of the world’s oceans from 1950 to 2006. Mar. Ecol. Prog. Ser. 442, 169–185. doi: 10.3354/meps09375
Wang, Y., Wang, Y., Liang, C., Zhang, H., and Xian, W. (2020). Assessment of 12 fish species in the northwest pacific using the CMSY and BSM methods. Front. Mar. Sci. 7:616. doi: 10.3389/fmars.2020.00616
Watson, R., Cheung, W. W. L., Anticamara, J., Sumaila, U. R., Zeller, D., and Pauly, D. (2013). Global marine yield halved as fishing intensity redoubles. Fish Fish. 14, 493–503. doi: 10.1111/j.1467-2979.2012.00483.x
Watson, R., and Pauly, D. (2001). Systematic distortions in world fisheries catch trends. Nature 414, 534–536. doi: 10.1038/35107050
Keywords: data-limited stock assessment, maximum sustainable yield, fisheries management, the Japan Sea and environs, CMSY and BSM
Citation: Zhang S, Wang Y, Wang Y, Liang C and Xian W (2020) Assessment of 11 Exploited Fish and Invertebrate Populations in the Japan Sea Using the CMSY and BSM Methods. Front. Mar. Sci. 7:525363. doi: 10.3389/fmars.2020.525363
Received: 09 January 2020; Accepted: 24 September 2020;
Published: 13 November 2020.
Edited by:
Maria Lourdes D. Palomares, University of British Columbia, CanadaReviewed by:
Gabriel Vianna, University of Western Australia, AustraliaRainer Froese, GEOMAR Helmholtz Center for Ocean Research Kiel, Germany
Copyright © 2020 Zhang, Wang, Wang, Liang and Xian. This is an open-access article distributed under the terms of the Creative Commons Attribution License (CC BY). The use, distribution or reproduction in other forums is permitted, provided the original author(s) and the copyright owner(s) are credited and that the original publication in this journal is cited, in accordance with accepted academic practice. No use, distribution or reproduction is permitted which does not comply with these terms.
*Correspondence: Cui Liang, liangc@qdio.ac.cn; Weiwei Xian, wwxian@qdio.ac.cn