Abstract
COVID-19 is a global pandemic declared by WHO. This pandemic requires the execution of planned control strategies, incorporating quarantine, self-isolation, and tracing of asymptomatic cases. Mathematical modeling is one of the prominent techniques for predicting and controlling the spread of COVID-19. The predictions of earlier proposed epidemiological models (e.g. SIR, SEIR, SIRD, SEIRD, etc.) are not much accurate due to lack of consideration for transmission of the epidemic during the latent period. Moreover, it is important to classify infected individuals to control this pandemic. Therefore, a new mathematical model is proposed to incorporate infected individuals based on whether they have symptoms or not. This model forecasts the number of cases more accurately, which may help in better planning of control strategies. The model consists of eight compartments: susceptible (S), exposed (E), infected (I), asymptomatic (A), quarantined (Q), recovered (R), deaths (D), and insusceptible (T), accumulatively named as SEIAQRDT. This model is employed to predict the pandemic results for India and its majorly affected states. The estimated number of cases using the SEIAQRDT model is compared with SIRD, SEIR, and LSTM models. The relative error square analysis is used to verify the accuracy of the proposed model. The simulation is done on real datasets and results show the effectiveness of the proposed approach. These results may help the government and individuals to make the planning in this pandemic situation.
1 Introduction
Many times, in the past, human pandemics and epidemics have destroyed humankind, usually, these pandemics have made many changes in the living of humankind. Similarly, due to the novel coronavirus, the whole world is again facing the deadly experience which affects human lives the most [1]. WHO declared the COVID-19 as an international pandemic on March 11, 2020 [2]. According to WHO, the continuing pandemic of novel coronavirus has asserted 5,31,806 deaths and 11,301,850 confirmed cases in the world, as of July 6, 2020 [2]. In India, 7,00,728 confirmed cases, and 19,721 deaths have been reported till July 6, 2020 [3]. The government of India also accepted it as pandemic and imposed a nation-wide lockdown on March 23, 2020. Almost the entire nation has been locked down and different preventative measures, like sanitization of containment zones, identifying close contacts, quarantining infected individuals, encouraging social consensus on individual-protection such as wearing a face-mask, using hand-sanitizer, and washing hands regularly, etc. have been employed. Although, the cases of novel coronavirus are continuing and the number of daily confirmed cases is making a new record.
COVID-19 has been showing unusual characteristics in comparison to earlier coronavirus (i.e., the SARS-CoV and MERS-CoV) epidemic [4]. A considerable number of transmissions of COVID-19 is observed via human-to-human contact with individuals having no symptoms or the mild symptom of the disease [5]. The Immense viral capacity of SARS-Cov-2 was observed within the upper respiratory system of patients with mild symptoms or without symptoms [6]. Therefore, the subclinical infection may play an important part in maintaining the epidemic. Mathematical modeling is one of the prominent techniques for predicting and controlling the spread of coronavirus [7,8,9,10]. The popular SIR model [11] characterized the spread of infection using susceptible, infected, and removed compartments. Generally, new factors are incorporated in the SIR model to obtain more relevant information is a common practice. Therefore, several mathematical models have been introduced by improving the SIR model to capture the dynamics of COVID-19. Lin et al. [12] developed a conceptual SEIR model which includes factors like individual reaction and government activity. Giordano et al. [4] developed the SIDARTHE model which incorporates undetected and detected infected individuals. Prem et al. [13] studied the impact of control strategies through the SEIR model. Peng et al. [14] developed a generalized SEIR model that covered the transmission of COVID-19 in the latent period. The novel coronavirus tends to transmit from human-to-human within the latent period [15]. Till today, no proper vaccine or treatment is available for the disease. Hence, the best way to control the spread of the pandemic is the prediction of the number of infected cases that benefit the authorities in better planning of control strategies. Commonly used models like SIR [16,17,18], SEIR [18], and SEIJR [19] are not appropriate to predict the impact of the epidemic because they include a limited number of factors and ignored some important factors like asymptomatic cases, quarantined cases, etc. Moreover, recurrent neural networks (RNN), such as long-short term memory (LSTM), models are generally focused on the number of infectious. The main drawback of the LSTM based models is that these models do not consider the effect of quarantined cases, asymptomatic cases, protected population, etc. Therefore, it motivates us to propose a model that includes the ignored factors to estimate the number of infected cases accurately. The high number of asymptomatic cases have been reported in India. So, it is important to incorporate asymptomatic cases in the mathematical model. In this paper, we proposed a new mathematical model (SEIAQRDT) by extending the generalized SEIR model given by Peng et al. [14] for India and its highly affected states. The proposed eight compartmental model incorporates factors such as susceptible, exposed, infected, asymptomatic, quarantined, recovered, dead, and insusceptible. In this model, asymptomatic and symptomatic patients are treated differently. The nation-wide lockdown and compulsion on wearing of face-mask to get an accurate prediction are also considered. The simulation results offered by the proposed model are very close to the actual data as compared to other models. This paper divided into 5 sections. Section 1 gives an introduction. A brief overview of the related works is given in Section 2. In Section 3, we discuss the newly proposed mathematical model and its parameter values. In Section 4, the simulation results and discussion for India and its majorly affected states are presented. The performance of the proposed model is compared with three different models (SIRD, SEIR, and LSTM models) for different countries. Section 5 gives the conclusion and possible future works.
2 Literature Review
In this section, currently available epidemiological models for prediction of coronavirus (COVID-19) are briefly discussed. These models help to estimate the number of COVID-19 patients. Some of the popular mathematical models (e.g. SIR, SEIR, SEIJR, SEIAR, and SEIRD) are widely used to estimate the future outbreak of communicable diseases.
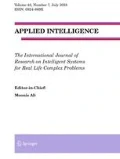
Zareie et al. [20] applied the SIR model to the prediction of coronavirus spread in Iran based on China parameters. Zhang et al. [21] proposed the SEIR model which illustrates the relation among susceptible, exposed, infectious, and recovered individuals. It is the widely used model that predicted the outbreak of coronavirus in China as well as in other countries. Fan et al. [22], Geng et al. [23] and Zhou et al. [24] used this model for the prediction of the outbreak of the coronavirus in China. This model accepts a limited amount of actual data and offers a correct prediction for the small period but the prediction for a long period is not much accurate. Yang et al. [25] proposed the modified SEIR model by introducing the two new parameters move-in and move-out for the inflow and outflow of susceptible individuals respectively. The basic structure of the different compartmental models for the prediction of infected cases is shown in Fig. 1. Lin et al. [12] discussed the conceptual SEIR model by incorporating the factors government action and public perception. Read et al. [26] proposed the extended version of the SEIR model.

4 different compartmental models for the prediction of the total number of infected cases
It includes one more factor asymptomatic individual during the incubation period in the SEIR model. It precisely segregates an isolated individual from the other populations. However, it is difficult to collect precise data for individuals which makes it difficult to get the best-fit parameters. Hence, the long-term forecasting is distant from the real data. The major difference between the SEIJR and the SEIAR is that isolated individuals are replaced with asymptomatic individuals. Bai et al. [27] applied this model and show similar properties to the SEIJR model. Additionally, this model deals with the zoonotic force of pneumonia and daily new infected cases. This model is applied by Wu et al. [28] and its simulation is very accurate to pandemic’s actual data at the starting stage.
The models discussed above have their specific properties. However, no one is perfect for long-range forecasting because of the number of parameters and model accuracy. Therefore, one more parameter i.e. the dead individual has been introduced by Huang et al. [29] in the SEIAR model to improve the accuracy of the model for long-term prediction. They also include two new factors, i.e., time of isolation initiation and intensity of isolation that the government has taken. The accuracy of this model is also better than the previously discussed models. Some artificial intelligence models are also applied to estimate the number of infected cases of coronavirus [30, 31]. Pathan et al. [32] applied the recurrent neural network-based LSTM model to predict the time-series of COVID-19 through mutation rate analysis. Kirbas et al. [33] predicted the total number of cases of Denmark, Belgium, Germany, France, United Kingdom, Finland, Switzerland, and Turkey with the help of the LSTM model. Jana et al. [34] studied the COVID-19 dynamics transmission for the USA and Italy with the help of the convolution LSTM model. Arora et al. [35] applied deep LSTM, convolutional LSTM, and Bi-directional LSTM to predict the confirmed cases for India and performed the comparative analysis for these models. LSTM models are generally focused on the number of infectious. The main drawback of the LSTM based models is that these models do not consider the effect of quarantined cases, asymptomatic cases, protected population, etc. These factors are essential to study the impact of COVID-19.
3 Model Formulation
In this section, we present a new mathematical model for the prediction of the number of coronavirus cases. In this model, we consider asymptomatic and quarantine as a separate compartment. The basic reproduction number and stability analysis is also discussed.
3.1 Generalized SEIR model with asymptomatic cases
To describe the pandemic of a novel coronavirus in India and its states, eight compartmental mathematical model, namely SEIAQRDT, is proposed. In this model, S(t) represents the susceptible population at time t, E(t) represents the exposed population (population those are infected but do not infect others within the latent period), I(t) represents the infectious (symptomatic) population (that have the scope to infect others and still not quarantined), A(t) represents infectious (asymptomatic) population (that have scope to infect others, but have no symptoms of the disease), Q(t) represents the quarantined population (the confirmed population that is infectious), R(t) represents the recovered population, D(t) represents the death population, and T(t) represents the protected population. The systematic compartmental diagram is shown in Fig. 2.

Compartmental diagram for SEIAQRDT model
The system of differential equations which describe the COVID-19 epidemic in India and its states are as follows:
with initial conditions S(0) > 0, E(0) ≥ 0, I(0) > 0, Q(0) ≥ 0, R ≥ 0, D ≥ 0, T ≥ 0.
The total population of a particular region is assumed to be constant, which is represented by N = S + E + I + Q + R + D + T.
Parameters and their definition | |
|---|---|
Symbol | Definition |
α | Protection rate |
β | Infection rate |
N | Total population |
η | Inverse of the average latent time |
𝑝 | Probability of symptomatic infectious |
γ | Quarantine rate |
λ(t) | Recovery rate (time-dependent) |
κ(t) | Mortality rate (time-dependent) |
Where β is the transmission rate for infectious (symptomatic) individuals and qβ is transmission rate for asymptomatic individuals (qβ < β, i. e. , q < 1). α is the protection rate (it includes the effect of control measures). (1 − p) is the probability of asymptomatic infectious. To consider the dynamics of the proposed model, the recovery rate λ(t) and the mortality rate κ(t) are considered as a time-dependent function.
3.2 Basic Reproduction Number
The reproduction number is one of the prominent states in the investigation of contagious disease. It helps in deciding that the diseases disappear or it will continue with the time. Generally, it is illustrated by R0, which provides the number of secondary cases. The Original infectious person can transmit disease in a population where each individual is susceptible. If R0 > 1 disease will remain in the population and if R0 < 1 disease is under control and it will die out. Therefore, in the case of the COVID-19 pandemic, there is a need to plan an effective strategy to make the reproduction number smaller than one [1, 8, 36, 37].
For system (1), a disease-free equilibrium point exists which is denoted by e0. Where S = N (1 − α) and E = I = A = Q = R = D = 0. As α is the protection rate through which people are protected and therefore the susceptible population is calculated as S = N(1 − α). Thus, R0 is computed mathematically, and to calculate the reproduction number, we employ the next generation matrix method [8]. The reproduction number for the proposed system is calculated using equation R0 = ρ(FV−1), where ρ represents the spectral radius of the matrix FV−1 [17]. With
and
Hence, the reproduction number is
Theorem 1. If R0 < 1, the disease-free equilibrium is locally asymptotically stable, and if R0 > 1, then the disease-free equilibrium is unstable and a pandemic exists in the population [11].
3.3 Stability analysis of disease-free equilibrium
The Jacobian matrix for the model (1) at the disease-free equilibrium point is
The characteristic equation for the matrix J is:
where
Since one of the eigenvalues of the matrix J is zero. Hence, the system is singular. Due to this, the stability of the system (1) near the disease-free equilibrium cannot be concluded using eigenvalues. However, from theorem 1, the system (1) is unstable. We obtained R0 > 1 for India and its states.
4 Numerical simulations & discussion
In this section, we present the numerical simulations for India and its most affected states. The comparison of simulation results with real data is also made from March 14, 2020 to July 03, 2020. The real data of India, Maharashtra, Tamil Nadu, Gujarat, and Delhi [3] is used for comparison. We also compare the results of the proposed model with other state-of-the-art works reported by different authors [25, 31, 38, 39].
4.1 India
The model fitting of cumulative cases in India reported till July 03, 2020 shows a satisfactory estimation. The model also shows the fitting of recovered and death cases. The number of quarantined cases is also considered as active cases. The total active cases are the sum-up of quarantined, hospitalized, and self-isolation cases which are also fitted in our model. In addition to quarantined cases, asymptomatic cases are also incorporated. The data for fitting is examined from the second week of March. The evolution of the total number of cases, deaths, recovered and quarantined cases have been tracked very closely with the data up to July 03, 2020. The model predicts the peak of the daily number of cases in the first or second week of September with an estimation error may be less than 5%. The recent situation includes protective measures like nation-wide lockdown, wearing of face-mask, and identification of containment zones. Hence, it is observed that the number of cases is much higher if these restrictions were not imposed. Around 2.4 million cumulative cases are approximated till the second last week of August whereas 1.85 million people will be recovered from COVID-19 and around 0.06 million deaths are estimated in India by the second last week of August. The number of asymptomatic cases is approximated around 0.09 million based on the assumption that the probability of transmission of asymptomatic infectious is lower than symptomatic patients, whereas the recovery rate is assumed the same for both the cases. In the proposed model, recovery rate and mortality rate for India and its states are given as follows.
All the parameters are fitted with the help of LSQCURVEFIT function in MATLAB. The error is minimized using minsum(FUN(X, XDATA) − YDATA). ^ 2 formula. The function FUN takes X and XDATA as inputs and returns a vector (or matrix) of function values FUN(X, XDATA) where FUN and YDATA (observed output) are of the same size. The function X = LSQCURVEFIT(FUN, X0, XDATA, YDATA, LB, UB, OPTIONS) is used to optimize the parameters [40]. The function X starts at X0 = [tpop − Q(1) − R(1) − D(1) − E0 − I0 − A0, E0, I0, Q(1), R(1), D(1)] where tpop represents the total population. The terms Q(1), R(1), D(1), Io, and A0 represent the number of active, recovered, death, confirmed, and asymptomatic cases reported on March 14, 2020, respectively. It is assumed that initially there are no asymptomatic patients i.e. A0 = 0 and the number of exposed cases is equal to the number of infected cases. For the simulation results of the proposed model, options are considered as follows:
• p. addoptional(‘tolX’, 1e−5) is option for optimset. It sets the tolerance for X to 10−5.
• p. addoptional(‘tolFUN’, 1e−5) is option for optimset. It also sets the tolerance for FUN to 10−5.
• p. addoptional(′dt′, 0.1) is option for optimset. It sets the time step for fitting to 0.1.
The fitted parameters for India are given in Table 1.
In Fig. 3, C represents the total number of cases, Q represents the total quarantined cases, R represents the total recovered, D represents the total deaths, and A represents estimated total asymptomatic cases from the SEIAQRDT model. The total number of cases in India initiating from March 14, 2020 to July 12, 2020 is shown in Fig. 3. The total number of cases observed in the second week of July is around 0.86 million whereas 0.57 million recovered. Asymptomatic cases are observed at around 0.045 million. In the current situation R0 =1.1121 which is greater than one. It indicates that the epidemic exists and will remain in the population. The long-term prediction in India is shown in Fig. 4. With the help of the fitted parameters, the cumulative number of confirmed cases, quarantined cases, recovered and death cases are estimated.

Prediction and comparison in India till July 12, 2020 Cumulative (confirmed cases, recovered, deaths, quarantined and asymptomatic infectious with real data)

Prediction and comparison in India for long-term Cumulative (confirmed cases, recovered, deaths, quarantined and asymptomatic infectious with real-data)
In Fig. 5(a), it is observed that the curve for cumulative cases starts to flatten at the end of October. In Fig. 5(b), daily-reported cases in India are shown in the bar diagram. The peak of the number of cases in India is observed in the first or second week of September. It is also noticed in Fig. 5(b) that around 23% of cases will be removed from the population in the second or third week of October.

Prediction in India (a) Cumulative cases in India in the first week of October (b) Bar diagram for daily new cases in India
4.2 Maharashtra
Maharashtra is the most affected state from COVID-19 in India from the beginning. Hence, it is very important to discuss the scenario of the state. The estimation of the cumulative number of cases, deaths, recovered, and quarantined cases are forecasted with data up to July 03, 2020. The model predicts the peak of the daily number of cases in the last week of July or the first week of August. Around 0.496 million cumulative cases are approximated at the second last August whereas 0.36 million people will be recovered from COVID-19 in the second last week of August and around 0.024 million deaths are estimated by the second last week of August in the recent circumstances. The number of asymptomatic cases is approximately 0.015 million. In this case, R0 = 1.3733 which is larger than one. It indicates that the epidemic exists and will remain in the population. The fitted parameters for Maharashtra are shown in Table 2. The recovery and mortality rates are time-dependent functions which are the same as λ(t) and κ(t), respectively.
In Fig. 6, the total number of cases in Maharashtra initiating from March 14, 2020 to July 12, 2020 is shown. The total number of cases observed at the end of the second week of July is around 0.24 million whereas 0.14 million recovered. Asymptomatic cases are observed at around 0.0105 million. Figure 7 shows the long-term forecast. With the help of the fitted parameter, the cumulative number of confirmed infectious cases, quarantined cases, recovered and death cases are estimated.

Prediction and comparison in Maharashtra till July 12, 2020 Cumulative (confirmed cases, recovered, deaths, quarantined and asymptomatic infectious with real data)

Prediction and comparison in Maharashtra for long-term Cumulative (confirmed cases, recovered, deaths, quarantined and asymptomatic infectious with real data)
In Fig. 8(a), it is observed that the curve for cumulative cases starts to flatten at the end of October or the starting of November. In Fig. 8(b), daily-reported cases in Maharashtra are shown in the bar diagram. The model predicts the peak of the daily number of cases in the last week of July or the initial week of August. Around 90% of cases will be removed from the total population at the end of October.

Prediction in Maharashtra (a) Cumulative cases in Maharashtra in the first week of October (b) Bar diagram for daily new cases in Maharashtra
4.3 Tamil Nadu
In the initial stage of COVID-19 in India, the number of cases was less in Tamil Nadu, but presently it is the second most affected state. Nowadays, the daily count has reached near to 7000. Due to this, it is important to consider cases in Tamil Nadu separately. The estimation of the cumulative number of cases, deaths, recovered, and quarantined cases are forecasted with data up to July 03, 2020. The model predicts the peak of the daily number of cases in the first or second week of August. Around 0.42 million cumulative cases are observed in the second last week of August whereas 0.296 million people will be recovered from COVID-19 in the second last week of August and around 0.0038 million deaths may be reported till the second last week of August in the current scenario. The number of asymptomatic cases is approximately 0.017 million. R0 = 1.361 is calculated for Tamil Nadu which is more than one. Therefore, the epidemic will exist in the population for a smaller period. The fitted parameters for simulation are taken from Table 3.
The total number of cases in Tamil Nadu starting from March 14, 2020 to July 03, 2020 is shown in Fig. 9. The total number of cases observed in the second week of July is around 0.142 million whereas 0.087 million recovered. Asymptomatic cases are observed at around 0.0085 million. In Fig. 10, long-term prediction in Tamil Nadu is shown. With the help of the fitted parameter, the cumulative number of confirmed infectious cases, quarantined cases, recovered and death cases are estimated.

Prediction and comparison in Tamil Nadu till July 12,2020 Cumulative (confirmed cases, recovered, deaths, quarantined and asymptomatic infectious with real data)

Prediction and comparison in Tamil Nadu for long-term Cumulative (confirmed cases, recovered, deaths, quarantined and asymptomatic infectious with real data)
In Fig. 11(a), it is observed that the curve for cumulative cases starts to flatten in the last week of October or the first week of November. In Fig. 11(b), daily-reported cases in Tamil Nadu are shown in the bar diagram. The model predicts the peak of the daily number of cases in the second or third week of August. Around 90% of cases will be removed from the total population at the end of October.

Prediction in Tamil Nadu (a) Cumulative cases in Tamil Nadu in the first week of October (b) Bar diagram for daily new cases in Tamil Nadu
4.4 Gujarat
In the initial stage of COVID-19 in India, the number of cases is less in Gujarat. Gujarat reaches the third position in the list of most affected states which crosses the 0.01 million number of cases. The estimation of the cumulative number of cases, deaths, recovered, and quarantined cases are predicted with data up to July 03, 2020. The model predicts that the daily number of cases reported gets constant from the second week of July. Around 0.062 million cumulative cases are observed at the second last week of August whereas 0.053 million people will be recovered from COVID-19 s last week of August and around 0.0048 million deaths are estimated in Gujarat by the second last week of August in the current scenario including all the preventive measures that are imposed. The number of asymptomatic cases is approximately 0.0028 million. The fitted parameters for the model are given in Table 4. The recovery and mortality rate for Gujarat is different from other states. The time-dependent recovery and death rate are taken from Eq. (2).
where λ(1), λ (2), λ (3), κ(1), κ(2) and κ(3) are fitted coefficient.
In Fig. 12, the total number of cases in Gujarat starting from March 21, 2020 to July 12, 2020 is shown. The total number of cases in the second week of July is estimated at around 0.039 million whereas 0.031 million will be recovered in the second week of July. Asymptomatic cases are observed at around 0.0023 million. In Fig. 13, long-term prediction is shown. With the help of the fitted parameter, the cumulative number of confirmed infectious, quarantined, recovered, and death cases are estimated.

Prediction and Comparison in Gujarat till July 12 Cumulative (confirmed cases, recovered, deaths, quarantined and asymptomatic infectious with real data)

Prediction and Comparison in Gujarat for long-term Cumulative (confirmed cases, recovered, deaths, quarantined and asymptomatic infectious with real data)
In Fig. 14(a), it is observed that the curve for cumulative cases does not start to flatten at the first end of October. In Fig. 14(b) daily-reported cases are shown in the bar diagram. It is observed that the daily new cases in Gujarat get constant from the second week of July.

Prediction in Gujarat (a) Cumulative cases in Gujarat till the first week of October (b) Bar diagram for daily new cases in Gujarat
4.5 Delhi
In the initial stage of COVID-19 in India, the number of cases is quite high in Delhi. The model predicts the peak of the daily number of cases at the end of September. Around 0.46 million cumulative cases are observed at the second last week of August whereas 0.44 million people will be recovered from COVID-19 at the second last week of August and around 0.007 million deaths are estimated by the second last week of August in the current scenario including all the preventive measures that are imposed. The number of asymptomatic cases is approximated to 0.05 million. In this case, R0 = 2.3678 which is greater than one. Hence, the cases for novel coronavirus will remain in the population. The fitted parameters for the model are shown in Table 5.
In Fig. 15, the total number of cases in Delhi starting from March 14, 2020 to July 12, 2020 is shown. The total number of cases is recorded at the end of July is around 0.145 million whereas 0.115 million will be recovered. Asymptomatic cases are observed at around 0.024 million. In Fig. 16, long-term prediction in Delhi is shown. With the help of the fitted parameter, the cumulative number of confirmed infectious, quarantined, recovered and death cases are estimated.

Prediction and comparison in Delhi till July 12 Cumulative (confirmed cases, recovered, deaths, quarantined and asymptomatic infectious with real data)

Prediction and Comparison in Delhi for long-term Cumulative (confirmed cases, recovered, deaths, quarantined and asymptomatic infectious with real data)
In Fig. 17(a), it is observed that the curve for cumulative cases starts to flatten at the end of October. In Fig. 17(b), daily-reported cases in Delhi are shown in the bar diagram. The peak of the number of cases in Delhi will be observed at the end of August. Around 63% of cases will be removed from the total population at the end of October. Table 6 shows the relative error between the actual data and the data obtained from the proposed model. The relative error (%) for India varies from 0.02 to 1.81 and the average relative error is only 0.699%. Moreover, the state’s relative error varies from 0 to 2.45 and the average relative error for states is 0.869%. Hence, the average relative error for the SEIAQRDT model is less than 1% for India and its states.

Prediction in Delhi (a) Cumulative cases in Delhi in the first week of October (b) Bar diagram for daily new cases in Delhi
The simulation results of the proposed (SEIAQRDT) model and the SIRD model are compared with the real data of China. The estimated values of infected cases for China using SIRD are taken from [39] for comparison purposes. The data thief software [41] is used to extract the data from the figure. Table 7 shows China’s real infected cases (reported), infected cases estimated using the SIRD model with relative error, and infected cases estimated using SEIAQRDT model with relative error for the period from Feb 16 to March 1. The relative error for the proposed model varies from 0.01 to 3.39 and the average relative error is 0.86%, whereas the relative error for the SIRD model varies from 0.37 to 9.78 and the average relative error is 3.99%.
Figure 18 shows the comparison between the real infected cases, estimated infected cases with SEIAQRDT model, and estimated infected cases with SIRD model for China. In this figure, it can be seen that the estimated infected cases with SEIAQRDT model are either touching the real infected cases or very close to real infected cases. However, the estimated infected cases with SIRD are away (distant) from the real data points except starting and ending points. Table 8 shows Canada’s real infected cases (reported), infected cases estimated using SEIAQRDT model with relative error, and the infected cases estimated using LSTM model with relative error from April 14 to April 28. The relative error for the SEIAQRDT simulation model varies from 0.2578 to 1.356 and the average relative error is 0.78%, whereas relative error for the LSTM model varies from 1.4975 to 5.05 and the average relative error is 3.58%.

Figure 19 shows the comparison between SEIAQRDT model and the LSTM model with real infected cases of Canada. The real data is represented by the red dots and the predicted number of total infected cases by LSTM model is shown by the blue line. The red line represents the total number of infected cases estimated by the SEIAQRDT model. In this case, the prediction with SEIAQRDT model is very close to real data. The average relative error is higher for the LSTM model as compared to SEIAQRDT. Results show that the SEIAQRDT model fits the data better than LSTM model.

Table 9 shows China’s real infected cases (reported), infected cases estimated using SEIAQRDT model with relative error, and the infected cases estimated using SEIR model with relative error for the period from Feb 13 to Feb 27. The relative error for the SEIAQRDT model varies from 0.0057 to 4.7397, whereas relative error for SEIR model varies from 1.0343 to 17.4131. Figure 20 shows the comparison between the proposed model and the SEIR model with real infected cases of China. The average relative error of SEIR model is 7.1523% which is very high as compared to the average error of the proposed model i.e. 1.3657%. Figure 20 shows that the SEIAQRDT model predicts the total number of infected cases better than the SEIR model.

Table 10 shows India’s real infected cases (reported), infected cases estimated using SEIAQRDT model with relative error, and the infected cases estimated using LSTM model with relative error for the period from March 26 to April 09. The relative error for the SEIAQRDT model varies from 0.2787 to 1.084 and the average relative error is 0.6915%, whereas the relative error for LSTM model varies from 0.7733 to 8.62.
Figure 21 shows the comparison between SEIAQRDT model and the SEIR model with real infected cases of India. In this case, the average relative error of the LSTM model is 4.4182%, which is higher than the average relative error of the proposed model i.e. 0.6915%. The SEIAQRDT model is compared with SIRD, SEIR, and LSTM models for different country’s data. The LSTM models are mainly focused on the number of infectious. The main drawback of the LSTM based models is that these models do not consider the effect of quarantined cases and asymptomatic cases. In all the cases, simulation results show that the SEIAQRDT model fits the data better than the other models. The reason for this superiority is that the SEIAQRDT model takes suspected, infected with and without symptoms, recovered, quarantined, death, and exposed cases, whereas SIRD and SEIR model considered only four factors.

5 Conclusion
The COVID-19 epidemic is exerting an unusual weight on social life in many countries, including India. Although nation-wide lockdown and other preventive majors are imposed in India still the number of cases is getting increased. In this study, we proposed the SEIAQRDT model including asymptomatic cases for the prediction of COVID-19 disease. The real data for total cumulative cases, daily infected cases, total recovered, total deaths, and total quarantined individuals have been incorporated. The numerical simulations are presented for India and four major states (Maharashtra, Tamil Nadu, Gujarat, and Delhi). The estimated number of cases using the SEIAQRDT model has been compared with SIRD, SEIR, and LSTM models. The estimated data with SEIARQDT model is very near to actual data. The relative error square analysis is used to verify the accuracy of the proposed model. The proposed model has average relative error of 0.86% (3.99% with SIRD) and 1.36% (7.15% with SEIR) for China, 0.69% (3.59% with LSTM) for India and 0.77% (4.42% with LSTM) for Canada. The average relative error for SEIAQRDT model with a higher number of factors is very less in comparison to the average relative error for the other models. These results may help to recognize the impact of coronavirus and to prevent the spread of the virus on a large scale. In the future, the proposed model can be extended by introducing additional factors like environmental transmission, effect of vaccines, treatment strategies, effect of delay, impact of unlocking, etc. Moreover, the fractional-order derivative can also be applied in the present model.
References
Kamrujjaman M, Mahmud MS, Islam MS (2020) Coronavirus outbreak, and the mathematical growth map of COVID-19. Annu Res Rev Biol 35(1):72–78. https://doi.org/10.9734/arrb/2020/v35i130182
WHO. Coronavirus disease (COVID 19) pandemic. Available from: https://www.who.int/emergencies/diseases/novel-coronavirus-2019. Accessed 6 July 2020
Covid19 India. Available from: https://www.covid19india.org/. Accessed 6 July 2020
Giordano G, Blanchini F, Bruno R, Colanary P, Filippo AD, Matteo AD, Colaneri M (2020) Modelling the COVID-19 epidemic and implementation of population-wide interventions in Italy. Nat Med 26:855–860. https://doi.org/10.1038/s41591-020-0883-7
Wang Y, Wang Y, Chen Y, Qin Q (2020) Unique epidemiological and clinical features of the emerging 2019 novel coronavirus pneumonia (COVID19) implicate special control measures. J Med Virol 92(6):568–576
Zou L, Ruan F, Huang M, Liang L, Huang H, Hong Z, Yu J, Kang M, Song Y, Xia J, Guo Q, Song T, He J, Yen HL, Peiris M, Wu J (2020) SARS-CoV-2 viral load in upper respiratory specimens of infected patients. N Engl J Med 382(12):1177–1179
Anderson RM, May RM (1992) Infectious diseases of humans: dynamics and control. Oxford University Press Inc., New York
Diekmann O, Heesterbeek JAP (2000) Mathematical epidemiology of infectious diseases: model building, analysis and interpretation. John Wiley and Sons, Chichester
Hethcote H (2000) The mathematics of infectious diseases. SIAM Rev 42(4):599–653
Brauer F, Chavez CC (2012) Mathematical models in population biology and epidemiology. Springer, New York, NY. https://doi.org/10.1007/978-1-4614-1686-9
Kermack WO, McKendrick AG (1927) A contribution to the mathematical theory of epidemics. Proceedings of the royal society of London. Series A Contain Papers Mathematical Phys Charact 115(772):700–721
Lin Q, Zhao S, Gao D, Lou Y, Yang S, Musa S, Wang M, Cai Y, Wang W, Yang L, He D (2020) A conceptual model for the outbreak of Coronavirus disease 2019 (COVID-19) in Wuhan, China with individual reaction and governmental action. Int J Infect Dis 93:211–216
Prem K, Liu Y, Russell TW, Kucharski AJ, Eggo RM, Davies N, Flasche S, Clifford S, Pearson CAB, Munday JD, Abbott S, Gibbs H, Rosello A, Quilty BJ, Jombart T, Sun F, Diamond C, Gimma A, Zandvoort KV, Funk S, Jarvis CI, Edmunds WJ, Bosse NI, Hellewell J, Jit M, Klepac P (2020) The effect of control strategies to reduce social mixing on outcomes of the COVID-19 epidemic in Wuhan, China: a modelling study. The Lancet Public Health, 5(5). https://doi.org/10.1016/S2468-2667(20)30073-6
Peng L, Yang W, Zhang D, Zhuge C, Hong L (2020) Epidemic analysis of COVID-19 in China by dynamical modeling. arXiv preprint arXiv:.06563
López L, Rodo X (2020) A modified SEIR model to predict the COVID-19 outbreak in Spain and Italy: simulating control scenarios and multi-scale epidemics. Available at SSRN: https://doi.org/10.2139/ssrn.3576802
Cantó B, Coll C, Sánchez E (2017) Estimation of parameters in a structured SIR model. Adv Diff Eqs 2017(1):33
Chen Y, Cheng J, Jiang Y, Liu K (2020) A time delay dynamical model for outbreak of 2019-nCoV and the parameter identification. J Inverse Ill-Posed Prob 28(2):243–250
Ma S, Xia Y (2008) Mathematical understanding of infectious disease dynamics, Lecture Notes Series, Institute for Mathematical Sciences, National University of Singapore. World Scientific 16:240. https://doi.org/10.1142/7020
Liu C, Ding G, Gong J, Wang L, Cheng K, Zhang D (2004) Studies on mathematical models for SARS outbreak prediction and warning. Chin Sci Bull 49(21):2245–2251
Zareie B, Roshani A, Mansournia MA, Rasouli MA, Moradi G (2020) A model for COVID-19 prediction in Iran based on China parameters. J Arch Iran Med 23(4):244–248
Zhang LJ, Wang FC, Zhuang XQ et al (2019) Global stability analysis on one type of SEIR epidemic model with floating population. J Institute Dis Prev 21(2):78–81
Ru-Guo F, Wang YB, Luo M et al (2020) SEIR-based novel pneumonia transmission model and inflection point prediction analysis. J Univ Electron Sci Technol China 49:1–6
Geng H, Xu A, Wang X, Zhang Y, Yin X, Mao MA et al (2020) Analysis of the role of current prevention and control measures in the epidemic of new coronavirus based on SEIR model. J Jinan Univ 41(2):1–7
Zhou T, Liu Q, Yang Z, Liao J, Yang K, Bai W, Lu X, Zhang W (2020) Preliminary prediction of the basic reproduction number of the Wuhan novel coronavirus 2019-nCoV. J Evidence-Based Med 13(1):3–7
Yang Z, Zeng Z, Wang K, Wong SS, Liang W, Zanin M, Liu P, Cao X, Gao Z, Mai Z, Liang J, Liu X, Li S, Li Y, Ye F, Guan W, Yang Y, Li F, Luo S, Xie Y, Liu B, Wang Z, Zhang S, Wang Y, Zhong N, He J (2020) Modified SEIR and AI prediction of the epidemics trend of COVID-19 in China under public health interventions. J Thoracic Dis 12(3):165–174
Read JM, Bridgen JR, Cummings DA, Ho A, Jewell CP (2020) Novel coronavirus 2019-nCoV: early estimation of epidemiological parameters and epidemic predictions. MedRxiv. https://doi.org/10.1101/2020.01.23.20018549
Bai Y, Liu K, Chen Z (2020) Early transmission dynamics of novel coronavirus pneumonia epidemic in Shaanxi Province [J]. Chin J Nosocomiol 30(6):834–838
Wu JT, Leung K, Leung GM (2020) Nowcasting and forecasting the potential domestic and international spread of the 2019-nCoV outbreak originating in Wuhan, China: a modelling study. Lancet 395(10225):689–697
Huang G, Pan Q, Zhao S, Gao Y, Gao X (2020) Prediction of COVID-19 outbreak in China and optimal return date for university students based on propagation dynamics. J Shanghai Jiaotong Univ 25:140–146
Santosh K (2020) AI-driven tools for coronavirus outbreak: need of active learning and cross-population train/test models on multitudinal/multimodal data. J Med Syst 44(5):1–5
Tomar A, Gupta N (2020) Prediction for the spread of COVID-19 in India and effectiveness of preventive measures. Sci Total Environ 728:138762. https://doi.org/10.1016/j.scitotenv.2020.138762
Pathan RK, Biswas M, Khandaker MU (2020) Time series prediction of COVID-19 by mutation rate analysis using recurrent neural network-based LSTM model. Chaos, Solitons, and Fractals 138:110018. https://doi.org/10.1016/j.chaos.2020.110018
Kırbaş İ, Sözen A, Tuncer AD, Kazancıoğlu FŞ (2020) Comparative analysis and forecasting of COVID-19 cases in various European countries with ARIMA, NARNN and LSTM approaches. Chaos Solitons Fractals 138:110015. https://doi.org/10.1016/j.chaos.2020.110015
Paul SK, Jana S, Bhaumik P (2020) A multivariate spatiotemporal spread model of COVID-19 using ensemble of ConvLSTM networks. medRxiv. https://doi.org/10.1101/2020.04.17.20069898
Arora P, Kumar H, Panigrahi BK (2020) Prediction and analysis of COVID-19 positive cases using deep learning models: A descriptive case study of India. Chaos Solitons Fractals 139:110017
Murray JD (2002) Mathematical biology: I. An introduction. Springer, New York, NY. https://doi.org/10.1007/b98868
Martcheva M (2015) An introduction to mathematical epidemiology. Springer, Boston, MA. https://doi.org/10.1007/978-1-4899-7612-3
Chimmula VKR, Zhang L (2020) Time series forecasting of COVID-19 transmission in Canada using LSTM networks. Chao, Solitons Fractals 135:109864
Fanelli D, Piazza F (2020) Analysis and forecast of COVID-19 spreading in China, Italy and France. Chaos Solitons Fractals 134:109761
MathWorks lsqcurvefit (2016) Function details for lsqcurvefit - atlas user documentation. https://www.atlas.aei.uni-hannover.de/~valentin.frey/profile/file73.html. Accessed 6 July 2020
Flower A, McKenna JW, Upreti G (2016) Validity and reliability of GraphClick and DataThief III for data extraction. Behav Modif 40(3):396–413
Dong E, Du H, Gardner L (2020) An interactive web-based dashboard to track COVID-19 in real time. Lancet Inf Dis. 20(5):533–534. https://doi.org/10.1016/S1473-3099(20)30120-1
Worldometers.info. (2020) Canada coronavirus. https://www.worldometers.info/coronavirus/country/canada/. Accessed 6 July 2020
Acknowledgments
The authors would like to thank the editor and anonymous reviewers for their valuable comments on the revision of the manuscript, which improved its quality.
Author information
Authors and Affiliations
Corresponding author
Additional information
Publisher’s note
Springer Nature remains neutral with regard to jurisdictional claims in published maps and institutional affiliations.
Rights and permissions
About this article

Cite this article
Kumari, P., Singh, H.P. & Singh, S. SEIAQRDT model for the spread of novel coronavirus (COVID-19): A case study in India. Appl Intell 51, 2818–2837 (2021). https://doi.org/10.1007/s10489-020-01929-4
Accepted:
Published:
Issue Date:
DOI: https://doi.org/10.1007/s10489-020-01929-4