A Diver-Portable Respirometry System for in-situ Short-Term Measurements of Coral Metabolic Health and Rates of Calcification
 Walter Dellisanti1,2,3
  Ryan H. L. Tsang4
  Put Ang Jr.4,5 Jiajun Wu1,3
  Mark L. Wells6,7*
  Leo L. Chan1,2,3*
- 1State Key Laboratory of Marine Pollution, City University of Hong Kong, Hong Kong, China
- 2Department of Biomedical Sciences, City University of Hong Kong, Hong Kong, China
- 3Shenzhen Key Laboratory for the Sustainable Use of Marine Biodiversity, Research Centre for the Oceans and Human Health, City University of Hong Kong, Shenzhen Research Institute, Shenzhen, China
- 4Marine Science Laboratory, Chinese University of Hong Kong, Hong Kong, China
- 5Institute of Space and Earth Information Science, The Chinese University of Hong Kong, Hong Kong, China
- 6School of Marine Sciences, University of Maine, Orono, ME, United States
- 7State Key Laboratory of Satellite Ocean Environment Dynamics, Second Institute of Oceanography, Ministry of Natural Resources, Hangzhou, China
Underwater visual monitoring methods are used broadly to evaluate coral reef conditions in the natural environment, but quantitative measurements of the coral holobiont has been largely restricted to photophysiological assessment of the endosymbionts. An underwater respirometer has been designed to make routine, diver-operated, non-invasive measurements at coral surfaces, but the realistic in situ accuracy and precision capabilities of this device has not been critically assessed; an essential step if these measurements are to be useful for quantifying spatial and seasonal patterns of coral metabolism. We developed specific protocols for this system to survey shallow coral colonies and detect metabolic profiles (respiration, photosynthesis, and biocalcification), diel cycles (day and night), and photosynthesis-irradiance curves. Analysis of data from in situ and laboratory-controlled conditions showed good replication among coral colonies and high precision measurements of temperature, oxygen and pH fluxes over 15-min incubation times without noticeable detrimental effects on coral health. Moreover, marked differences were observed in coral calcification rates between estuarine-influenced and coastal marine conditions, despite the absence of significant differences in visual appearance or other health indicators, revealing the system’s potential for early detection of marginally adverse conditions for coral metabolism. Its ease of operation and rapid quantification of the physiological status of the corals make this respirometer well suited for use by reef scientists, monitoring agencies, and stakeholders in biogenic reefs conservation efforts. Moreover, the high spatial and temporal resolution of these underwater respirometer data will have the potential to discriminate the effects of local stressors on coral health from those generated by broader changes associated with climate drivers.
Introduction
Warm-water coral reef systems are critical marine resources, yet their health and capacity for growth are under increasing threats from climate stressors. Although many shallow marine ecosystems will be influenced by shifting climate, the risks to coral reef systems are of particular concern due to their demonstrated sensitivity to altered environmental conditions and their central role in broadly sustaining marine biodiversity. Rising seawater temperatures and ocean acidification (Gruber, 2011; Ciais et al., 2013; Kuffner et al., 2015) are identified as the primary climate drivers influencing coral metabolic status, oxidative stress (Coles and Brown, 2003), bleaching events (Fitt et al., 2001) and reduced rates of biocalcification (Hoegh-Guldberg et al., 2007; Hughes et al., 2017). Environmental changes that lead to decreased coral food supply can exacerbate these impacts (Borell and Bischof, 2008). The scale and duration of mass bleaching events have increased significantly over the past three decades, leading to widespread coral death (Pandolfi et al., 2011; Donner et al., 2017). In addition to the accumulating impacts from global change, many nearshore corals, and particularly the urban reefs (Heery et al., 2018), are subjected to changing local stressors, including increased turbidity, nutrient loading, and as a consequence, greater dissolved oxygen fluctuations (Wong et al., 2018). Higher environmental variability in these areas has led to the selection of more stress-tolerant species (Darling et al., 2012) but less diverse reefs (Duprey et al., 2017). It is becoming increasingly important to discriminate between local and climate derived coral stress when developing coral reef mitigation and preservation strategies. Quantifying the status of coral health in present-day ocean conditions along with the early indicators of changing stress is key to understanding, forecasting, and responding to manifest effects of climate and regional anthropogenic stressors on future coral reef ecosystems (Hoegh-Guldberg et al., 2017).
Identifying sensitive indicators of coral physiology to assess chronic and acute stress has thus become a keen objective over the past few decades, and different tools and strategies have been developed for both laboratory and field studies (Rinkevich, 1995; Weber et al., 2007; van Oppen et al., 2017). Coral metabolism has been a focus of study since the development of techniques to precisely assess the carbonate system-O2 relationships in seawater (Gattuso et al., 1999). Laboratory experiments historically have relied on the destructive sampling of whole corals or fragments of coral colonies for shore-based study under artificial settings that do not fully reflect the natural or fluctuating conditions that corals experience in situ. Field assessments, in turn, have depended largely on measuring proxies for benthic metabolism as a whole and lack the needed resolution to evaluate the physiological status of individual coral taxa (Bates et al., 2010; Courtney et al., 2018). More recently, the net autotrophic/heterotrophic coral metabolism within the three-dimensional structure of reef systems has been investigated non-invasively using eddy correlation techniques with acoustic Doppler velocimeters coupled with oxygen microsensors (Long et al., 2013). However, to be effective this approach requires quantitative measures of water flow dynamics over the reef and the temporal and spatial distributions of dissolved oxygen in surrounding waters; information lacking for most reef systems. The net photosynthesis or respiration of groups or large individual coral colonies can be estimated in benthic chambers through the study of the dissolved oxygen dynamics (Kuhl et al., 1995; Yates and Halley, 2003; Camp et al., 2015), and although short-term incubations show no visual signs of coral stress, these methods still may not adequately reproduce the water flow characteristics necessary for representative coral health (Camp et al., 2015). But even with suitable care, the apparatus for these studies is cumbersome, making the approach poorly suited for the wider observation of reef systems.
Investigation of oxygen and pH dynamics at the scale of individual coral polyps now is possible using diver-operated microelectrodes on motorized platforms (Weber et al., 2007; Jimenez et al., 2011; Schrameyer et al., 2014). Oxygen dynamics near the coral-water interface shift from supersaturation during the daytime, as a consequence of photosynthesis by the dinoflagellate endosymbionts, to hypoxia at night from respiration of the holobiont and surface-associated bacteria (Shashar et al., 1993; Kuhl et al., 1995; Gardella and Edmunds, 1999). Measurements of similar micro-gradients and diel fluctuations in pH gradients, as well as dissolved inorganic carbon (DIC), can indirectly inform on carbonate availability for coral biocalcification under natural in situ regimes of dissolved oxygen, seawater pH and irradiance (Weber et al., 2007; Wangpraseurt et al., 2014). The collective application of these non-destructive tools has revolutionized the study of in situ coral physiological status, but they are labor-intensive and impractical for the broader surveys needed to assess the health of coral systems in the context of ecosystem stress.
Despite these remarkable advances, using endosymbiotic O2 production and holobiont respiration as indicator of coral health still has significant limitations. This dynamic balance results from a composite of metabolic processes; for example, increased respiration can result from both enhanced coral feeding or oxidative stress. A key coral-centric gauge is the rate of calcification. Scleractinian corals build their CaCO3 skeletons through the uptake of calcium and carbonate ions from seawater. Biomineralization occurs within the few nanometers of space between the basal calicoblastic epithelium and the skeleton surface (Falini et al., 2015; Reggi et al., 2016), and CaCO3 deposition rates are energy dependent due in part to the metabolic control of pH within the interstitial layer (Cohen and Holcomb, 2009; Venn et al., 2011). Ocean acidification, resulting from coastal processes or elevated atmospheric pCO2, increase the energy requirements for calcification, and thereby can decrease calcification rates when coral energy reserves are low (McCulloch et al., 2012). Acidification or other environmental stressors also may affect the interaction between the endosymbionts and corals, thereby limiting the net productivity of the symbiosis (Anthony et al., 2008), and thus energy supply. With the forecast of decreased plankton (food) productivity with global warming (Brierley and Kingsford, 2009), and its likely negative effect on coral energy reserves, synergies between ocean acidification and increased temperatures may exacerbate effects on coral biocalcification rates, making it a key indicator of coral physiological status.
A diver-operated instrument has been developed—the Community In situ Metabolism (CISME) device (CISME Instruments, LLC)—to assess coral health in situ through quantifying the rates of coral gross photosynthesis (Pg) and respiration (R), the associated changes in pH, and coral calcification rates (CA) (Murphy et al., 2012). As with any field-based instrument, exploring the analytical reproducibility is of paramount concern, particularly when applied in complex reef systems. We tested this device under well-controlled conditions in laboratory aquaria, and in the field on coral communities in Hong Kong waters with the aim to provide an independent assessment for its practical use as a tool for studying and observing corals in situ, and to quantify the effective precision, stability, and repeatability of these physiological measurements. Our findings show that the device had no negative impact on corals, and the measured physiological rates can be combined with water column environmental data to quantify daily variations in coral metabolism. Sensitive measures of R, Pg, and CA at high spatial and temporal resolutions across reef systems not only will provide early indications of stress onset or altered levels, but also will aid reef conservation efforts by helping to resolve those effects attributable to local stressors versus broader climate-driven change.
Materials and Methods
Instrumentation
The diver-operated instrument (Figure 1) is commercially available as the Community In situ Metabolism device (CISME Instruments LLC, www.cisme-instruments.com). The analysis principle is the comparison of net oxygen production rates measured under controlled irradiance to net oxygen utilization rates under dark conditions. Simultaneously, the change in pH can be used to estimate the DIC flux within the chamber during incubations (Figure 2). The magnitude of oxygen and pH changes under light and dark conditions is interpreted as a proxy for health of the coral holobiont.
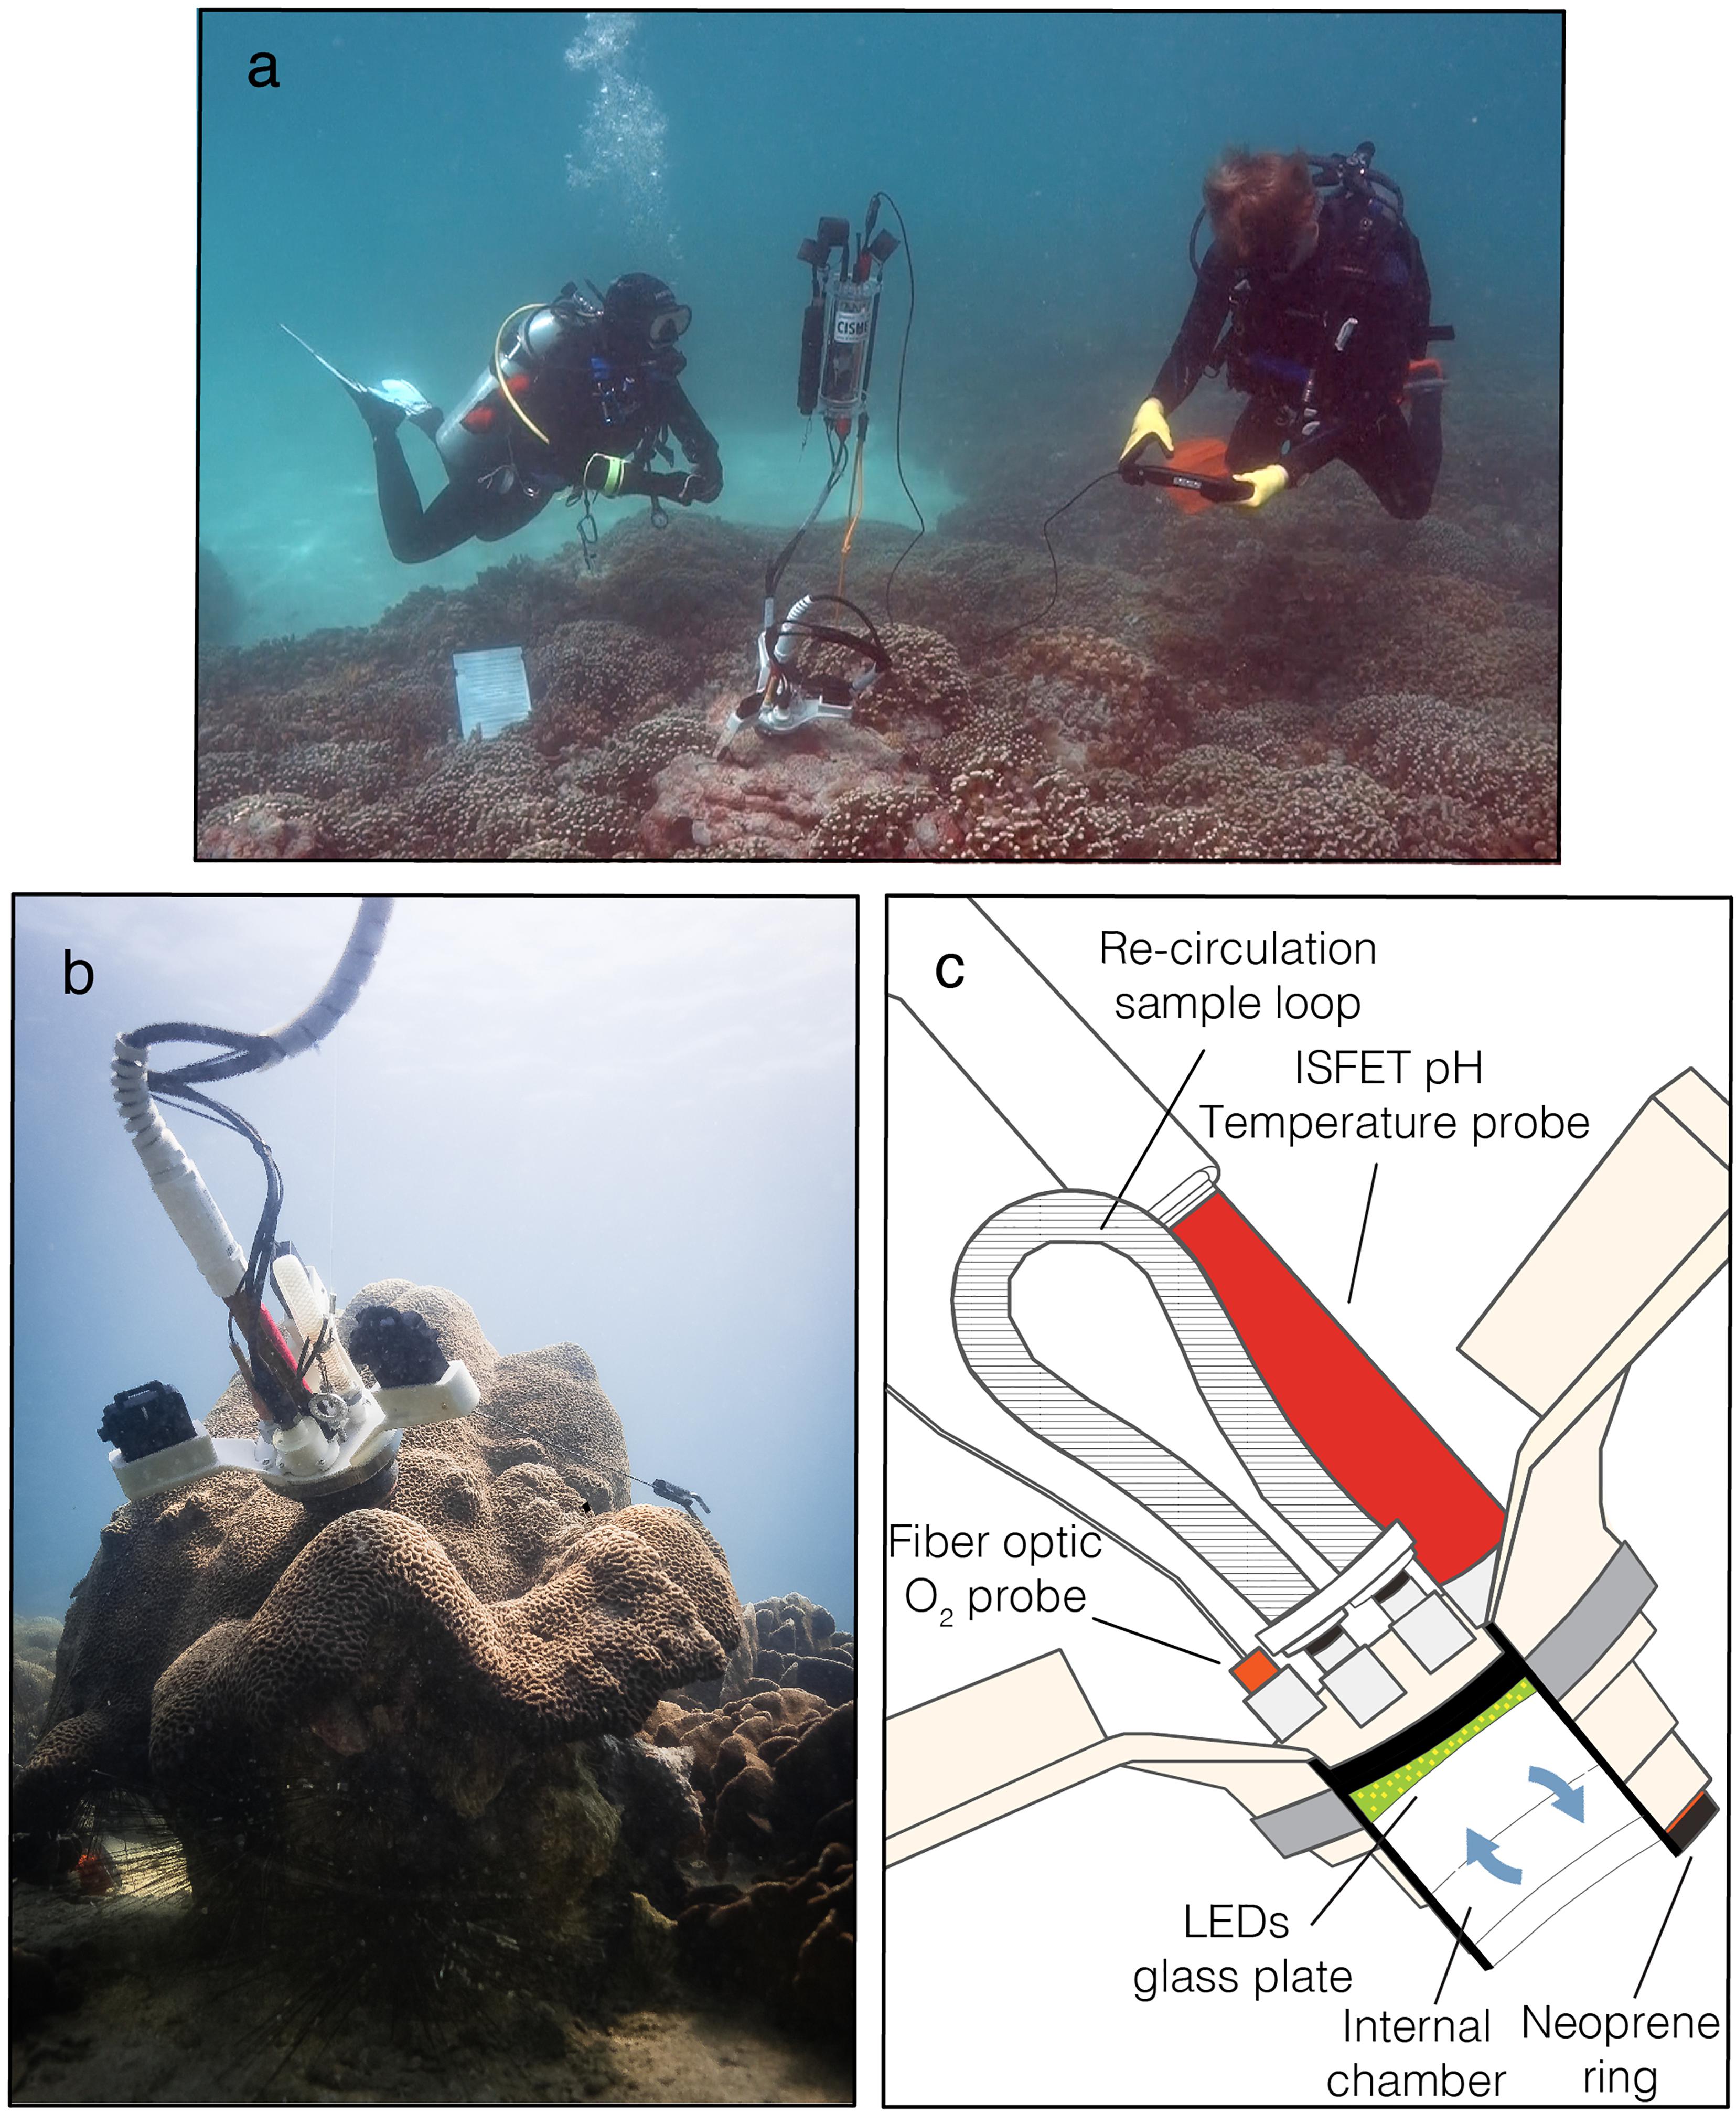
Figure 1. The CISME system operated by SCUBA divers to survey shallow coral colonies. The system simultaneously measures temperature and changes in dissolved oxygen and pH on flat surfaces of stony corals under regulated light and dark conditions. (a) The whole system includes the electronic housing, the incubation head and the tablet. The housing is slightly positive while the incubation head is deployed on surveyed coral. The divers can control the system and adjust the settings using the tablet according to the experimental investigation. Underwater photo credits: Dr. Alina Szmant. (b) Close-up of CISME deployment: the incubation head is attached to the coral surface with retractile anchors that allows the sealing during the incubation. (c) The technical detail (perspective section) of incubation head shows sensors and the LEDs illumination array. The seawater is being recirculated within the chamber and a discrete water sample can be collected through the removal of sample loop.
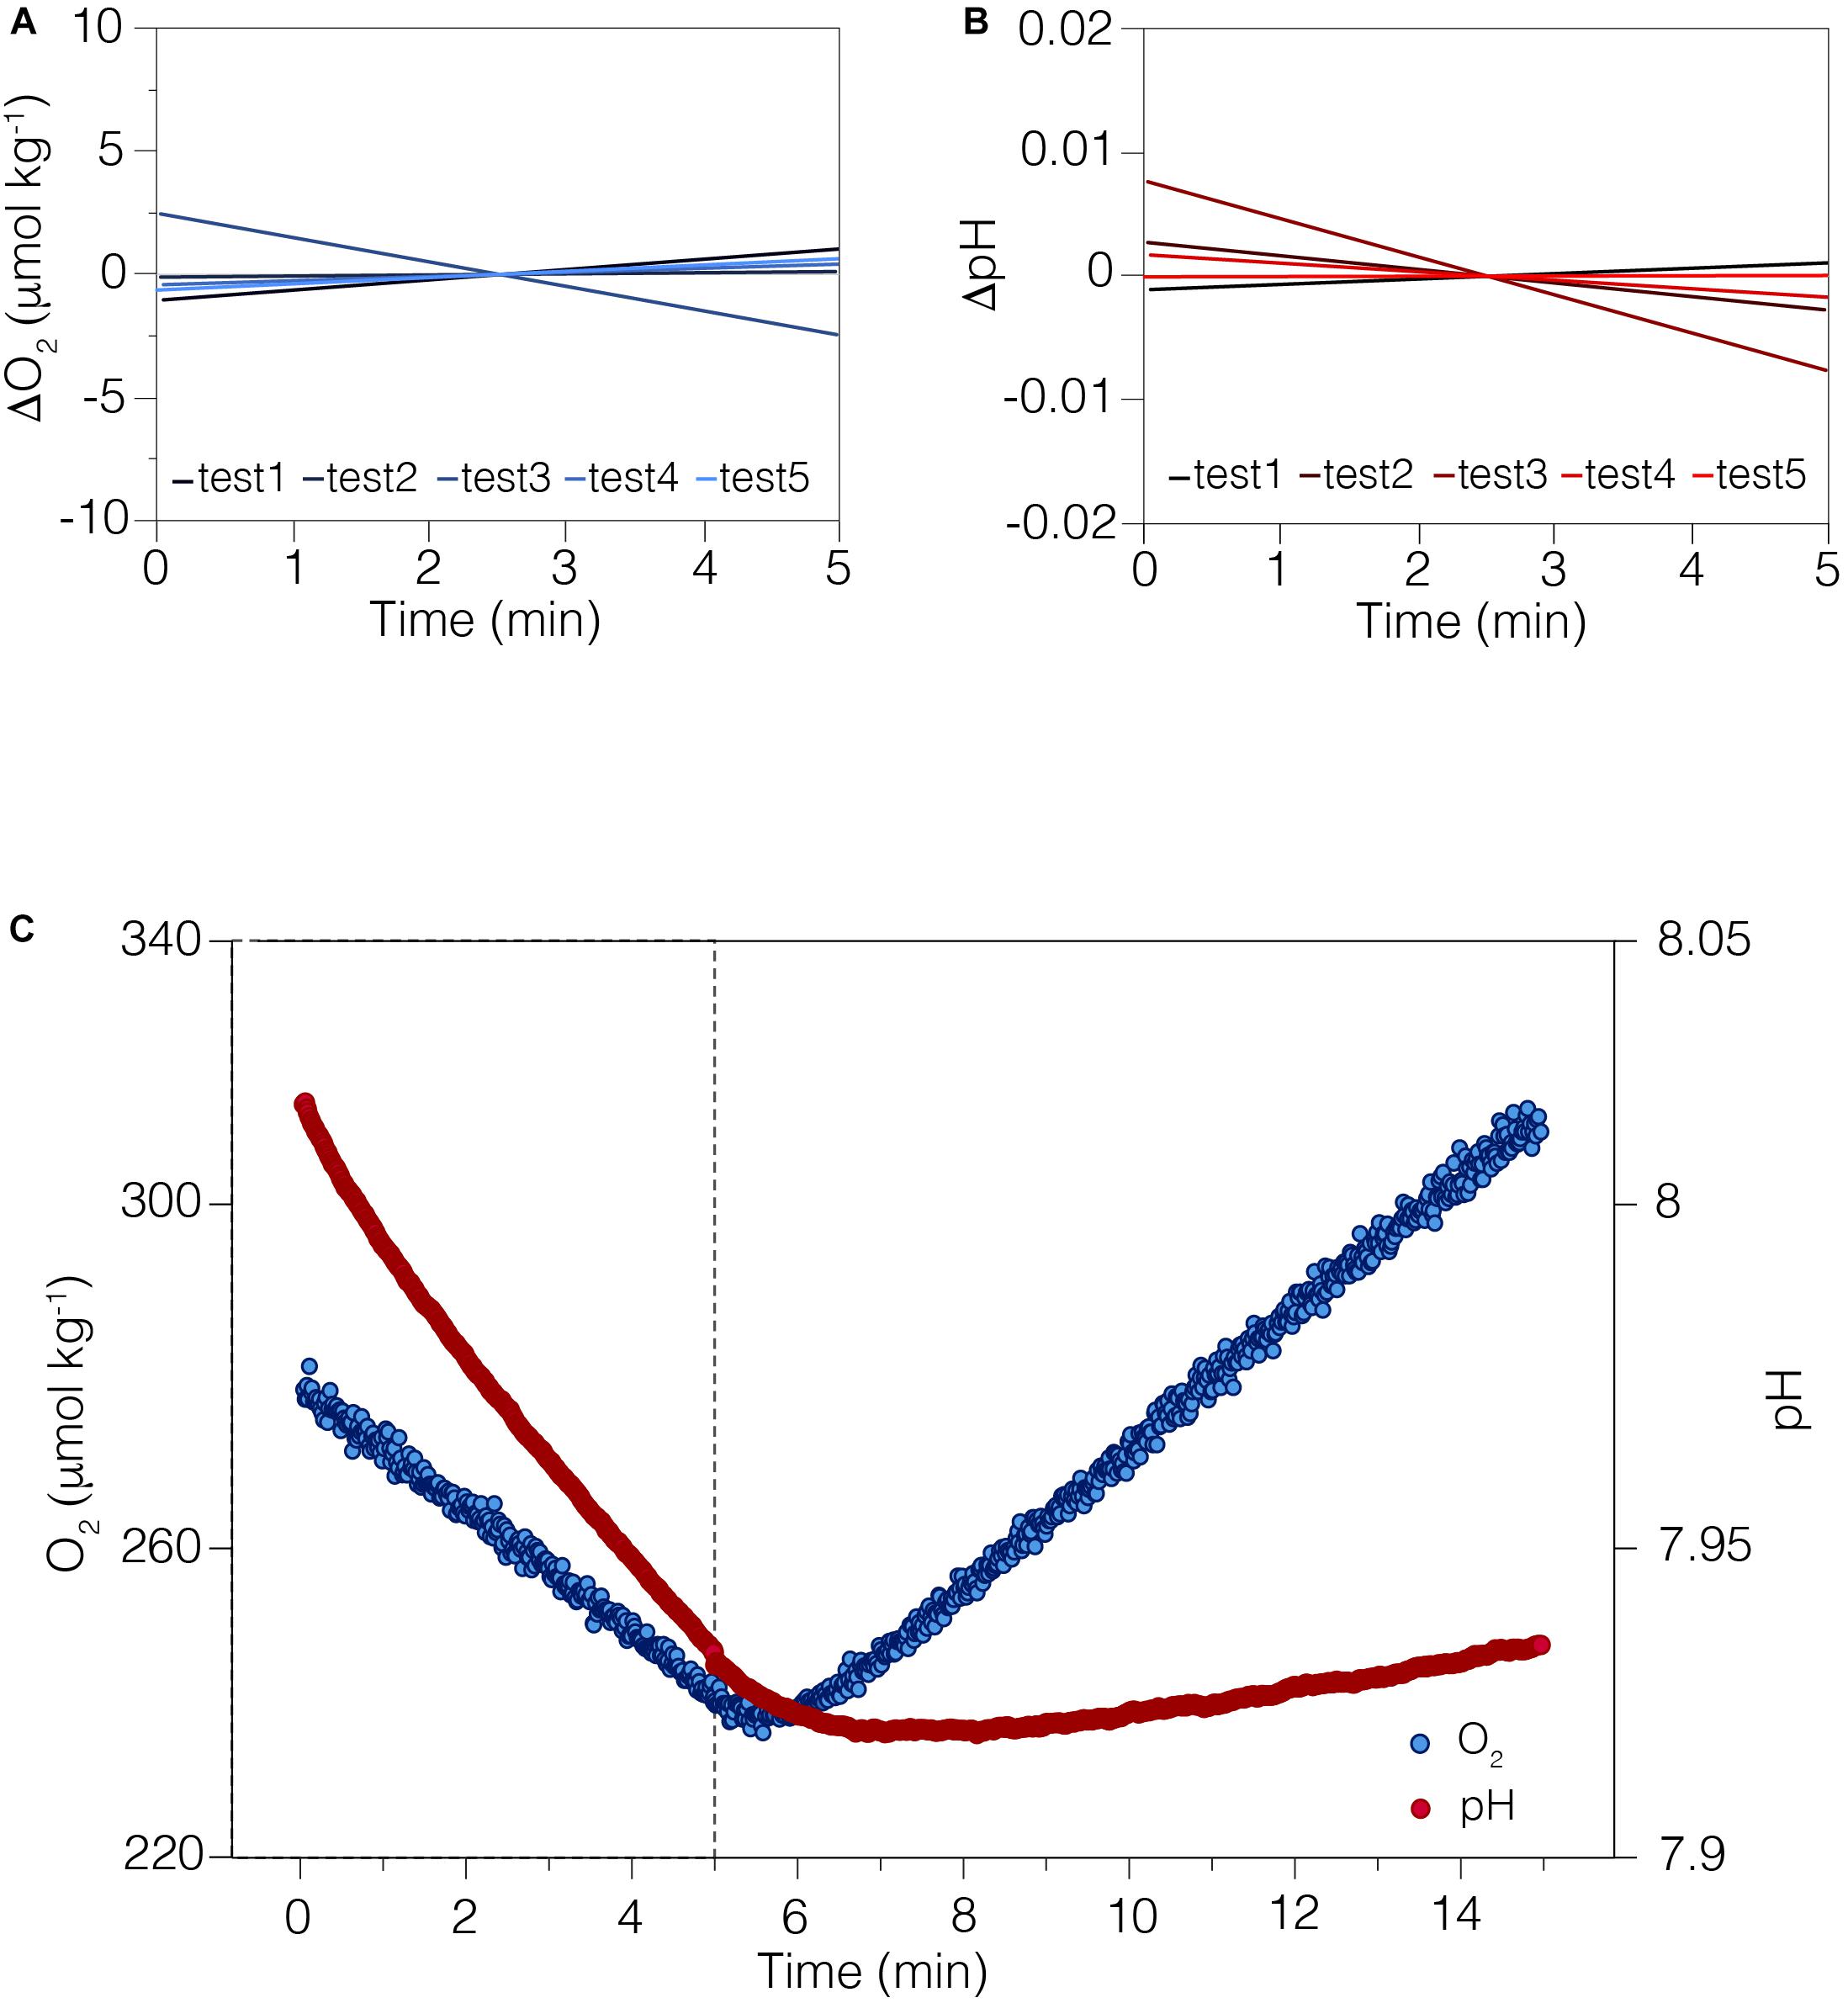
Figure 2. The sensors performance during CISME deployments. (A) The stability of the O2 sensor measured in filtered seawater over the 5-min in an open container in laboratory-controlled conditions. Trend lines of five independent test show anomalies from the mean. (B) The stability of the pH sensor over the 5-min in an open container in laboratory-controlled conditions. Trend lines of five independent test show anomalies from the mean. The slight trend in both sensors is likely due to small changes in temperature during the test. (C) Real-time O2 and pH data stream and status of analysis displayed on the tablet during typical 15-min incubation on coral surface, 5-min in the dark followed by 10-min in regulated light conditions. The analytical precision, defined as one standard deviation over time, for O2 was ±2.33 mmol kg– 1 and ± 0.02 pH.
The system comprises three interconnected components: the electronic control module and tablet, contained in transparent sealed housings, and the incubation chamber head (Figure 1). Control of the device, sensor output data, instrument status, and all menu options are displayed on the tablet (iDive Housing) using the instrument mobile App v1.20 (Mera). The incubation chamber head contains O2, pH and temperature sensors, a water circulation pump, and the light-emitting diode (LED) illumination array (Figure 1c). On deployment, a neoprene ring on the exterior of the head is pressed gently against the coral surface to provide a sealed attachment, creating a small fluidic chamber (5.5 cm diameter, ∼70 mL volume). The upper surface holds an array of LEDs behind a glass plate the intensity of which can be controlled by the user. The water flow is regulated to ∼0.9 L min–1 (pump at 5000 rpm) but it can be adjusted up to ∼1.3 L min–1 (7000 rpm, Supplementary Figure S1 online). Sensor data (O2 and pH) are live-streamed on the tablet so that the diver can monitor for anomalies, in which case the deployment settings then can be adjusted through the underwater interface, or conditions altered according to the experimental design (Figure 2C). The chamber water is circulated through a sample loop (∼18 mL volume) attached to the upper side of the incubation head with sealing, quick-disconnect fittings, enabling multiple samples to be collected on a single deployment or dive. The disconnected sample loops remained sealed for transport to the surface, where the water was collected for total alkalinity (At) measurements to quantify coral calcification rates. No special cleaning steps were used after deployments, with the system simply being rinsed well after each dive with freshwater and placed in a shaded place until the transportation to the laboratory.
Sensor Calibrations
Dissolved oxygen was measured within the chamber using an O2 sensitive fluorescent indicator (PreSens Precision Sensing GmbH) on a fiber-optical cable. The reference dye and O2 probe were excited by a green LED and the overall luminescence measured (Murphy et al., 2012). Sensors were calibrated at the beginning of the study under laboratory-controlled conditions. The dissolved oxygen measurements were calibrated using the 2-point calibration method, measuring the O2 concentration at 0% (N2-gas bubbling) and 100% (air-saturated water) (Supplementary Figure S2a online). The ion-selective field effect transistor pH sensor (Durafet, Honeywell Inc.) is highly precise and stable in seawater (Martz et al., 2010), in contrast with standard glass electrodes. The sensor was calibrated first with National Bureau of Standards (NBS) buffers (pH 4.01, 7.00, 10.06) at 25°C (Supplementary Figure S2b online) and then corrected for accuracy (± 0.003; n = 5) using the average offset from Tris buffer #T32 certified seawater reference material (CRM) provided by the A. Dickson Laboratory, Scripps Institution of Oceanography. The ISFETTM Temperature sensor was calibrated in a temperature-controlled water bath and compared to Onset HOBOTM light/temperature data logger (Supplementary Figure S2c online). The LED light intensity is adjustable (0–100%) by varying its voltage supply through the instrument’s application. The light output (0–2500 mmol m–2 s–1; Figure 3A) was measured with a LiCorTM light-meter and compared to in situ irradiance recorded with the Onset HOBO light/temperature data logger.
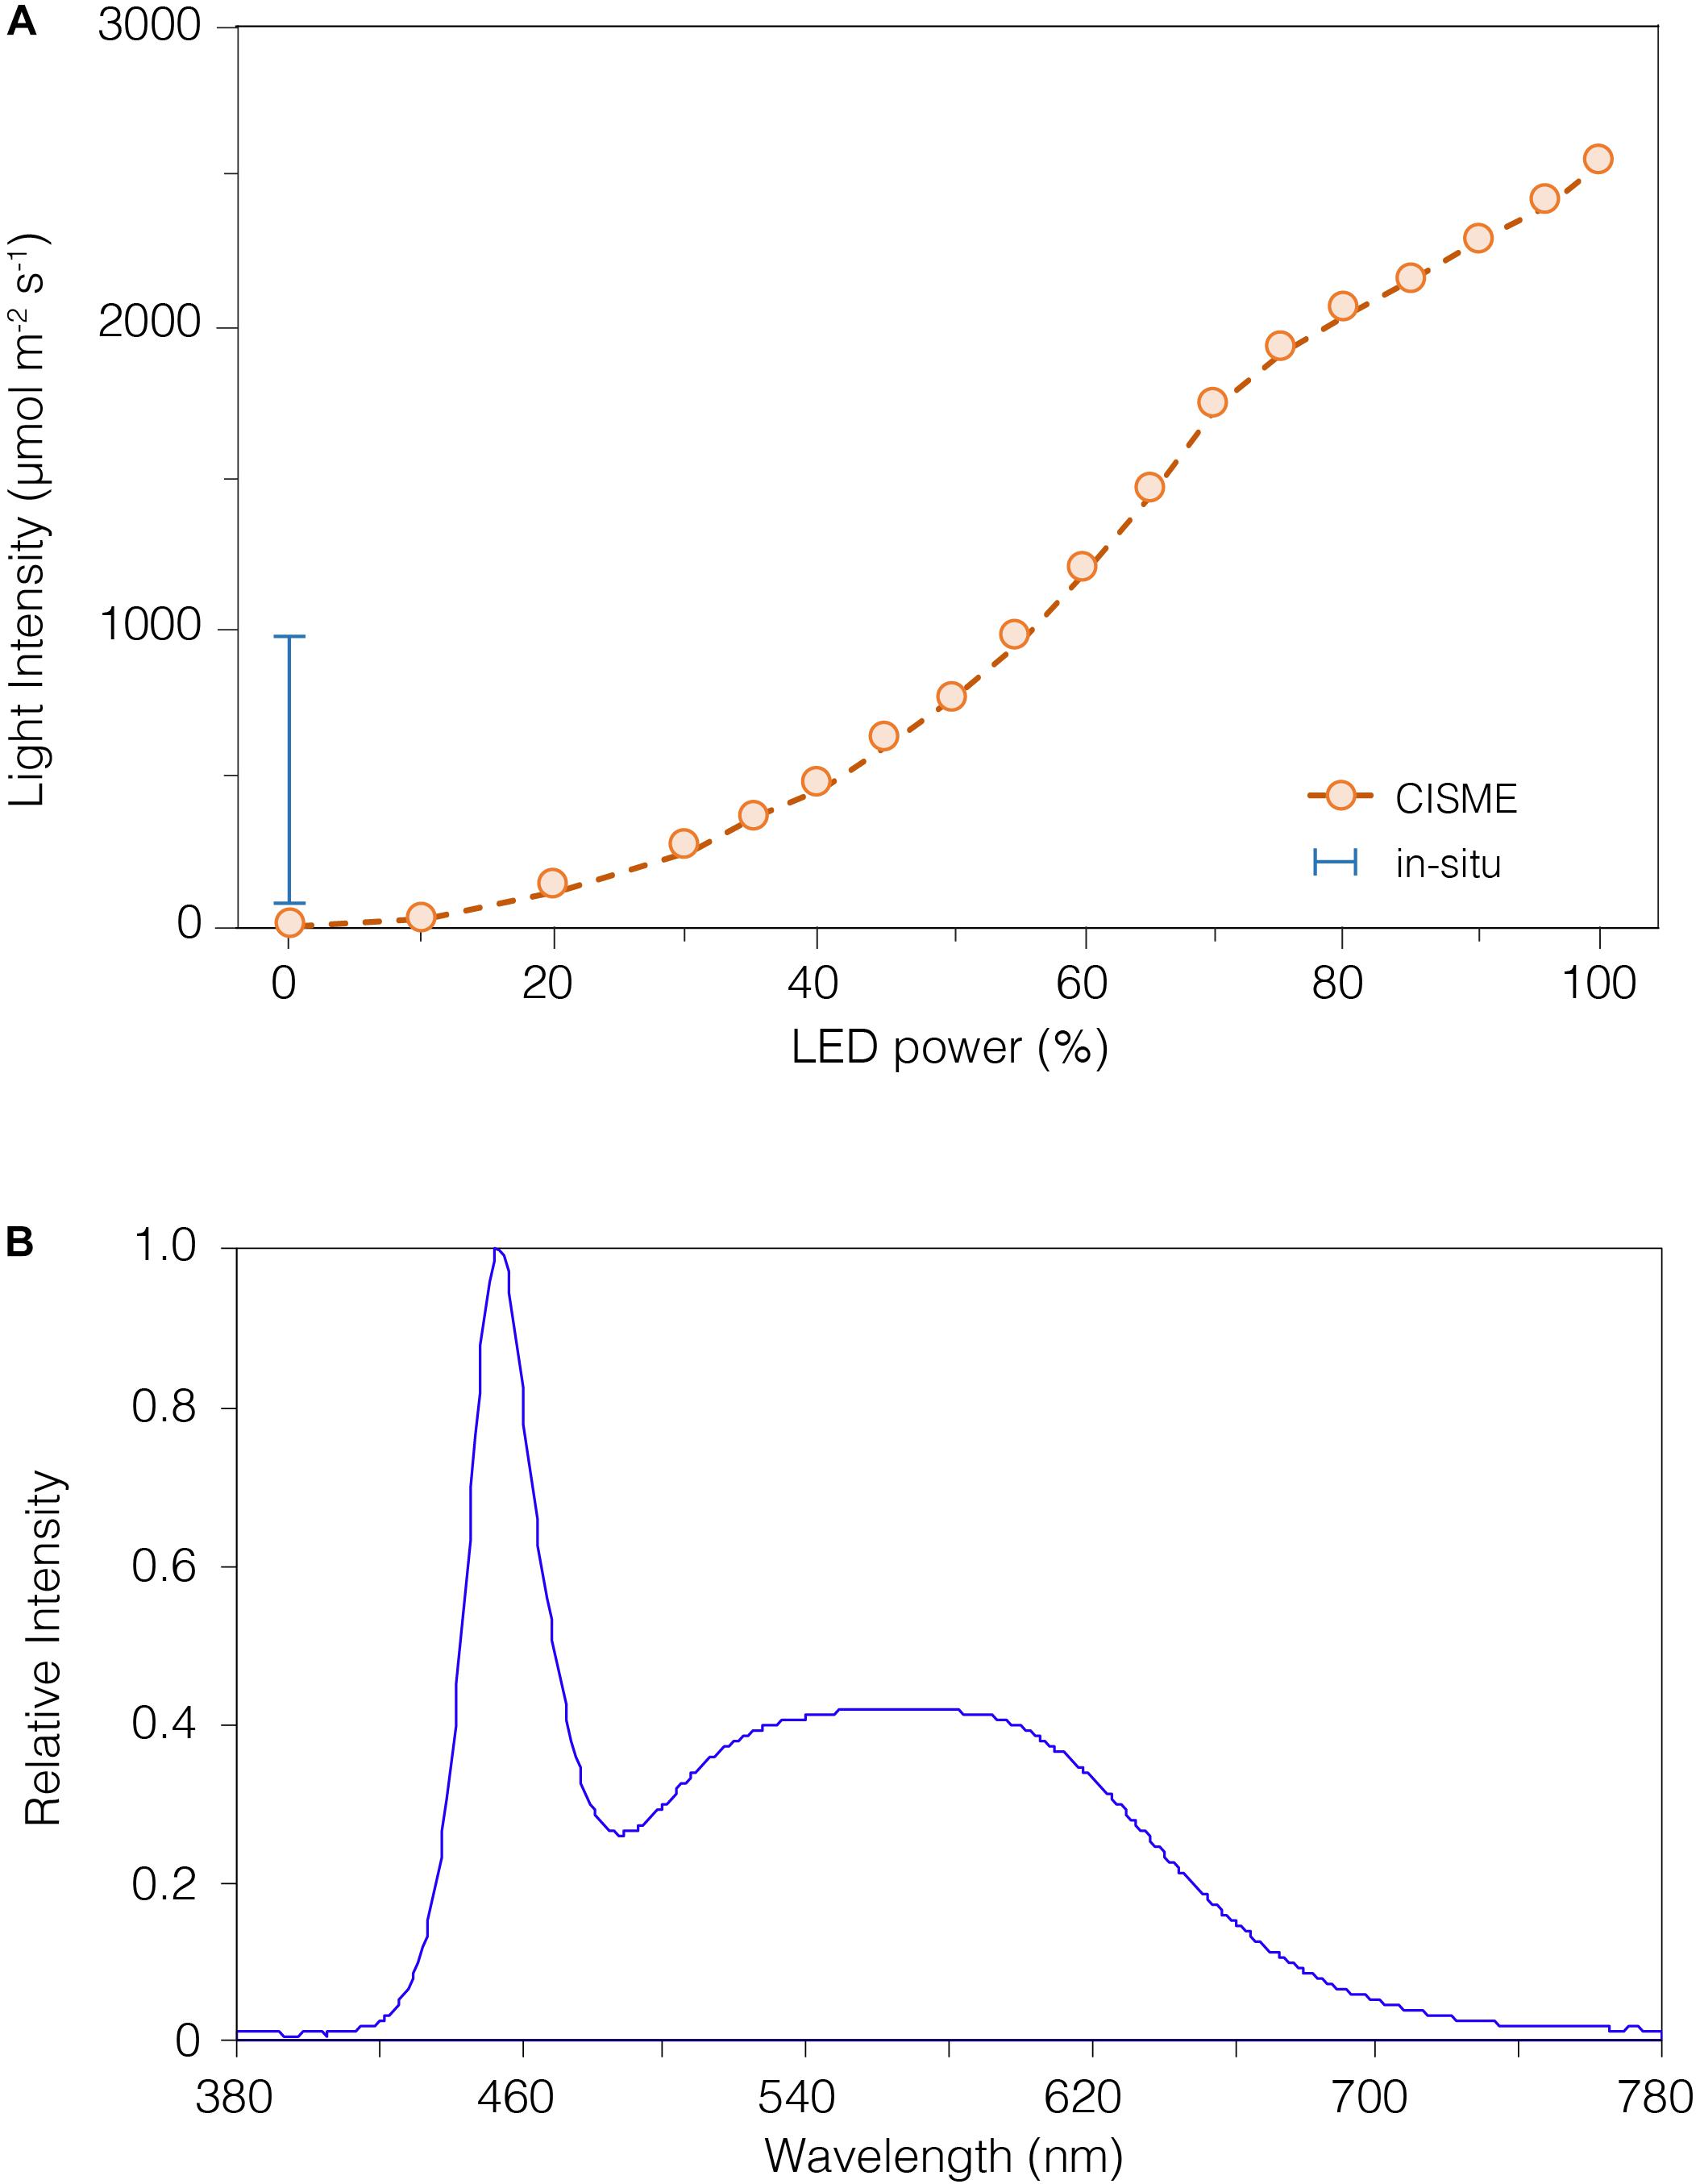
Figure 3. The light intensity of the LED array can be regulated by altering the input power. (A) The non-linear relationship between LED power and light intensity (open circles), as measured using a LiCor light-meter. The light intensity can be adjusted up to ∼2500 μmol m– 2 s– 1, or near maximal levels of natural light at sea level. Daily in situ light levels measured with a HOBO logger are depicted by the range bar for reference. The in situ light was measured by the HOBO logger during an 18-month survey and showed a median of ∼410 μmol m– 2 s– 1, which was the level selected for our study. (B) The LED array emitted a light at 380–780 nm, as measured in sub-aerial conditions with a UPRTrek LED-meter. The highest peak was recorded at 450 nm (violet-blue light), and the color temperature recorded was 7000°K (Luxeon warm white). While the shape of this spectrum differs from natural sunlight, it encompasses the range of photosynthetically active radiation (PAR) and has very limited contribution from damaging UV (<400) wavelengths.
Instrument Operating Protocols
The incubation protocols were optimized to avoid visually detectable stress on the corals (Figure 4; Supplementary Table S2 online) and to reduce the necessary dive durations. The measurements were initiated by measuring the decrease in oxygen concentrations over 5 min in the dark to quantify respiration. LEDs on the chamber ceiling were then turned on at 460 mmol m–2 s–1, simulating the average in situ light levels, and the increase in oxygen concentrations due to net photosynthesis (Pn) measured over 10 min. Here, identical settings were used to measure i) differences in the metabolic rates of corals in situ and in the laboratory experiments, ii) metabolic changes in the morning, afternoon and night metabolism, iii) the reproducibility of measurements from the same or different spots on a single coral colony, iv) the response of metabolic indicators among different colonies of the same genus measured on the same dive, and v) the replication of photosynthesis – irradiance curves from a single colony.
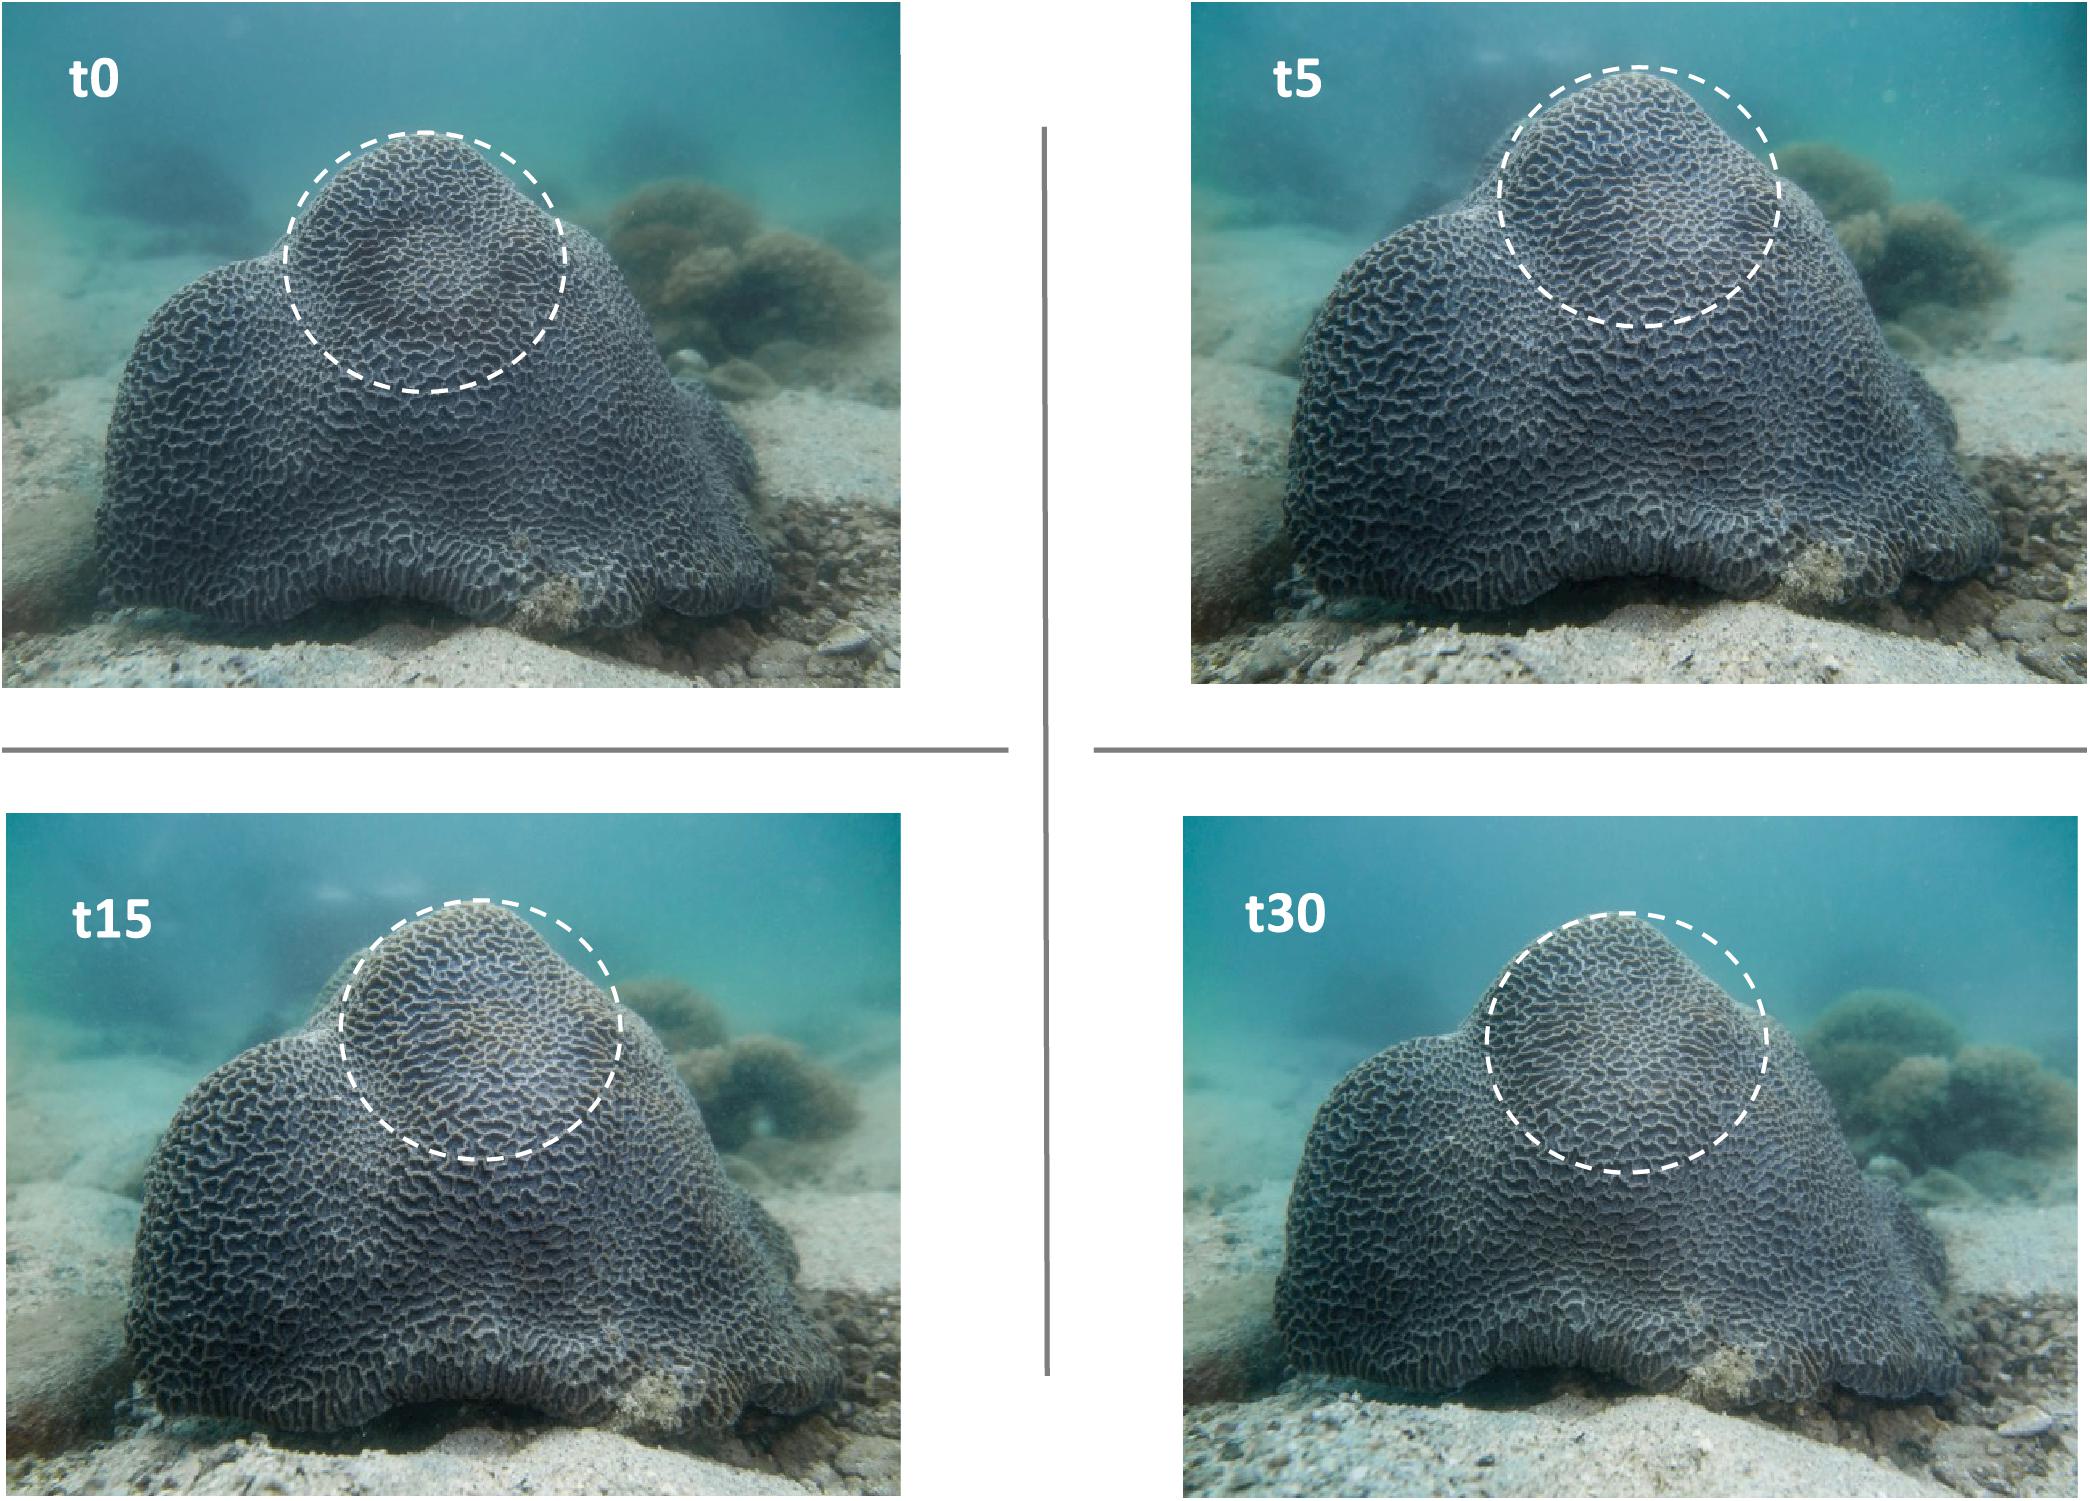
Figure 4. The CISME neoprene ring leaves a visible mild discoloration on the coral tissues on removal (t = 0). This visible spot disappears completely within 30 min after deployment, indicating there is no longer term coral stress. The same is true after multiple measurements of the same spot on the corals (see Figure 6A).
Quantification of Metabolic Rates
Dissolved oxygen and pH data were recorded every 1–2 s and displayed in real-time on the tablet. After downloading these data, R and Pn were calculated by regressing the change in oxygen concentrations against time during 5-min dark (R) and 10-min light incubations (Pn) on the coral surfaces (Figure 2C). Pg was calculated by adding the absolute value of R to Pn. Pg:R ratios were then calculated as measure of energetic daily productivity of corals. The respiratory (RQ) and photosynthetic (PQ) quotients were estimated from calculation of DIC fluxes during incubations with CO2Sys program (Pierrot et al., 2006; see section “Coral Energetics”).
Measurement of At and pH enabled full characterization of the seawater carbonate system (CO2, HCO3–, CO32–, H+, and OH–), and thereby informed on the availability of carbon substrates for calcification (Pierrot et al., 2006). The parameters of the seawater carbonate system (DIC, pCO2, Ωa) were calculated from measurements of temperature, salinity, pH and total alkalinity using the CO2Sys v2.3 program (Pierrot et al., 2006) using the carbonic acid dissociation constants K1, K2 from Leuker et al. (2000), KHSO4 concentration from Dickson (1990) and KHF from Perez and Fraga (1987).
The sample loop containing chamber water was removed after the light incubations, and the sealed loop returned to the surface (within 30 min) where it was transferred into 20 mL glass vials containing 15 mL of saturated solution of HgCl2 (0.08% final concentration). Samples were stored in the dark at 4°C until analysis for At using a calibrated, open-cell potentiometric acid-titration with a G20s Mettler-Toledo automatic titrator equipped with a DGi115-SC electrode (Dickson et al., 2007). Analytical precision was ±1.1 mmol kg–1 and the accuracy was ±8.2 (n = 14) μmol kg–1 (2209.12 mmol kg–1 measured), as calculated from the average (±1 std) offset from CRM values (batch #168 for CO2 and #A11 for titrant, 2207.62 mmol kg–1). CA rates were then determined with the alkalinity anomaly technique (Schoepf et al., 2017) using the following formula:
where DAt (mmol kg–1) is the difference in At between standard seawater and sample loop water, V (L) is the total volume of the chamber (0.088 L), r is the seawater density (∼1.023 g cm–3), t (h) is the incubation time (15 min) and S is the coral surface area investigated (24.5 cm2).
All data were normalized to the two-dimensional coral surface area within the chamber. In cases where the coral surface had irregularities (e.g., bioerosion, disease, attached particles), corrected coral tissue surface areas were calculated using digital photographic techniques. Briefly, an 18 × 13 cm stainless steel frame (NikonosTM Close Up Unit) was mounted with a digital camera in a diving housing, and the frame positioned surrounding the coral target region for photographs. The digital photographs were analyzed with the computer image program GIMP (Version 2.8, www.gimp.org). The lens distortion was corrected with the image software. The temporary ring left after removal of the incubation chamber was selected and the number of pixels representing coral tissue then calculated:
where pixels start is the original number of pixels in the photograph, and pixels final is the number of pixels of corrected surface area (with non-coral parts removed).
Survey and Collection of Coral Fragments
The in situ measurements and collection of coral fragments for the laboratory experiments were carried out in a shallow area (2–4 m depth) region of Mirs Bay at Chek Chau, Port Island (Hong Kong, 22.502° N –114.356° E). This site contains abundant and easily accessible massive coral colonies of Hong Kong’s flagship coral species, Platygyra spp., which has a boulder-like shape that is well suited for deployments of this instrument. Here, twelve apparently healthy colonies of Platygyra spp. were randomly selected and fragments (surface area 30–45 cm2) were collected with a hammer and chisel. Six of these fragments were analyzed immediately in situ, and then all twelve fragments were transported within two hours to the laboratory in transparent zip-lock bags. Further underwater surveys were performed to investigate the difference of metabolic rates on six independent Platygyra spp. colonies (Figure 6B), while measures at stepped increasing irradiance levels were taken on a single independent colony of Platygyra sp. (Figure 6C) located at the same study site.
We also used the instrument to investigate Cyphastrea sp. at East Dam, Sai Kung (Hong Kong, 22.360° N – 114.376° E). Here, we conducted in situ measurements on the same spot (n = 5) and different spots (n = 4) of an independent colony of Cyphastrea sp. (Figure 6A).
Both East Dam and Mirs Bay are well known diving sites located in sheltered areas and are largely free from direct runoff or anthropogenic pressures. The underwater instrument surveys were conducted following the established practices of coral monitoring programs in Hong Kong waters, which include the collection of water column parameters, sunlight intensities and rainfall amounts. These sites were chosen so that CISME findings would augment the existing long-term monitoring datasets (Wong et al., 2018).
A further assessment of coral health was carried out to compare the metabolic rates of Platygyra spp. in two nearby sites; A Ye Wan (n = 3), Tung Ping Chau Marine Park (22.546° N – 114.431° E), and Gruff Head (n = 3), Hoi Ha Wan Marine Park (22.475° N – 114.324° E). Both sites are located in Marine Parks but have different temporal trends in coral coverage (Wong et al., 2018) and are subjected to different hydrodynamics and freshwater discharge conditions.
All underwater surveys using the instrument presented in this study were conducted from November 2017 to July 2018 (with exception for Marine Parks’ survey conducted during the summer 2019), usually between 1000 h and 1300 h, excluding the afternoon and diel cycles experiments. Environmental conditions at both the survey site and in the laboratory aquaria (Table 1) were measured with a YSI multiparameter sonde (YSI Exo2 Water Sonde) calibrated prior to each sampling day with standard materials (Xylem Ltd). The pH was measured on the total hydrogen ion scales and calibrated with a Tris buffer (CRM #T32). Discrete water samples (500 mL) were collected in both sites for the determination of total alkalinity (At). Supplementary Information about water quality parameters and climatological data were drawn from the Environmental Protection Department (www.epd.gov.hk) and Hong Kong Observatory of the Government of Hong Kong S.A.R., China (www.hko.gov.hk).
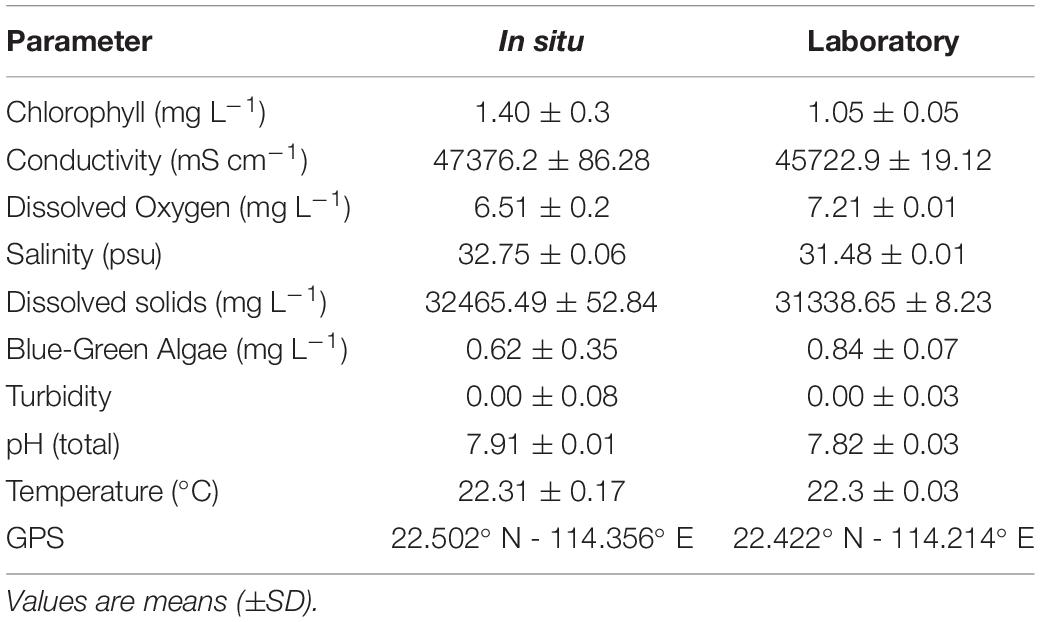
Table 1. Environmental conditions of seawater at different locations (in situ vs. laboratory) on 13th April 2018.
Laboratory Conditions
Laboratory experiments were conducted to evaluate the reproducibility of metabolic indicator measurements under well-regulated conditions in flowing seawater aquaria. We studied the precision of metabolic responses using repeated measurements from the same point on the coral surface, among coral fragments under the same environmental conditions, and on different coral fragments at different times of the day and night. The findings were compared to coral metabolic indicators of corals in situ under similar temperature and salinity conditions as in the laboratory aquaria.
Coral incubations were conducted in flowing seawater aquaria at the Simon F.S. Li Marine Science Laboratory, the Chinese University of Hong Kong (22.422° N – 114.214° E). The coral fragments were allowed to recover for three weeks in an outdoor tank (300 L) equipped with natural flow-through seawater (1 L min–1). The outdoor tank was under a plastic rooftop with natural light filtered to 25% intensity (Supplementary Table S1 online). Besides sensor calibrations, all the laboratory experiments were carried out in the same outdoor setup between April to August 2018 as previously described by Dellisanti et al. (2020). The metabolic rates were measured in laboratory conditions during three weeks acclimation (Figures 5A,B); morning and afternoon conditions (Figures 5C,D) and during the diel cycle (Figures 5E,F). In this way, the coral fragments experienced the same light and flow conditions, but were subject to the natural fluctuations in source water conditions near the mouth of Shing Mun river, Tolo Harbor. This region can be subjected to variable water quality from terrestrial runoff events and limited anthropogenic discharges (EPD, 2017).
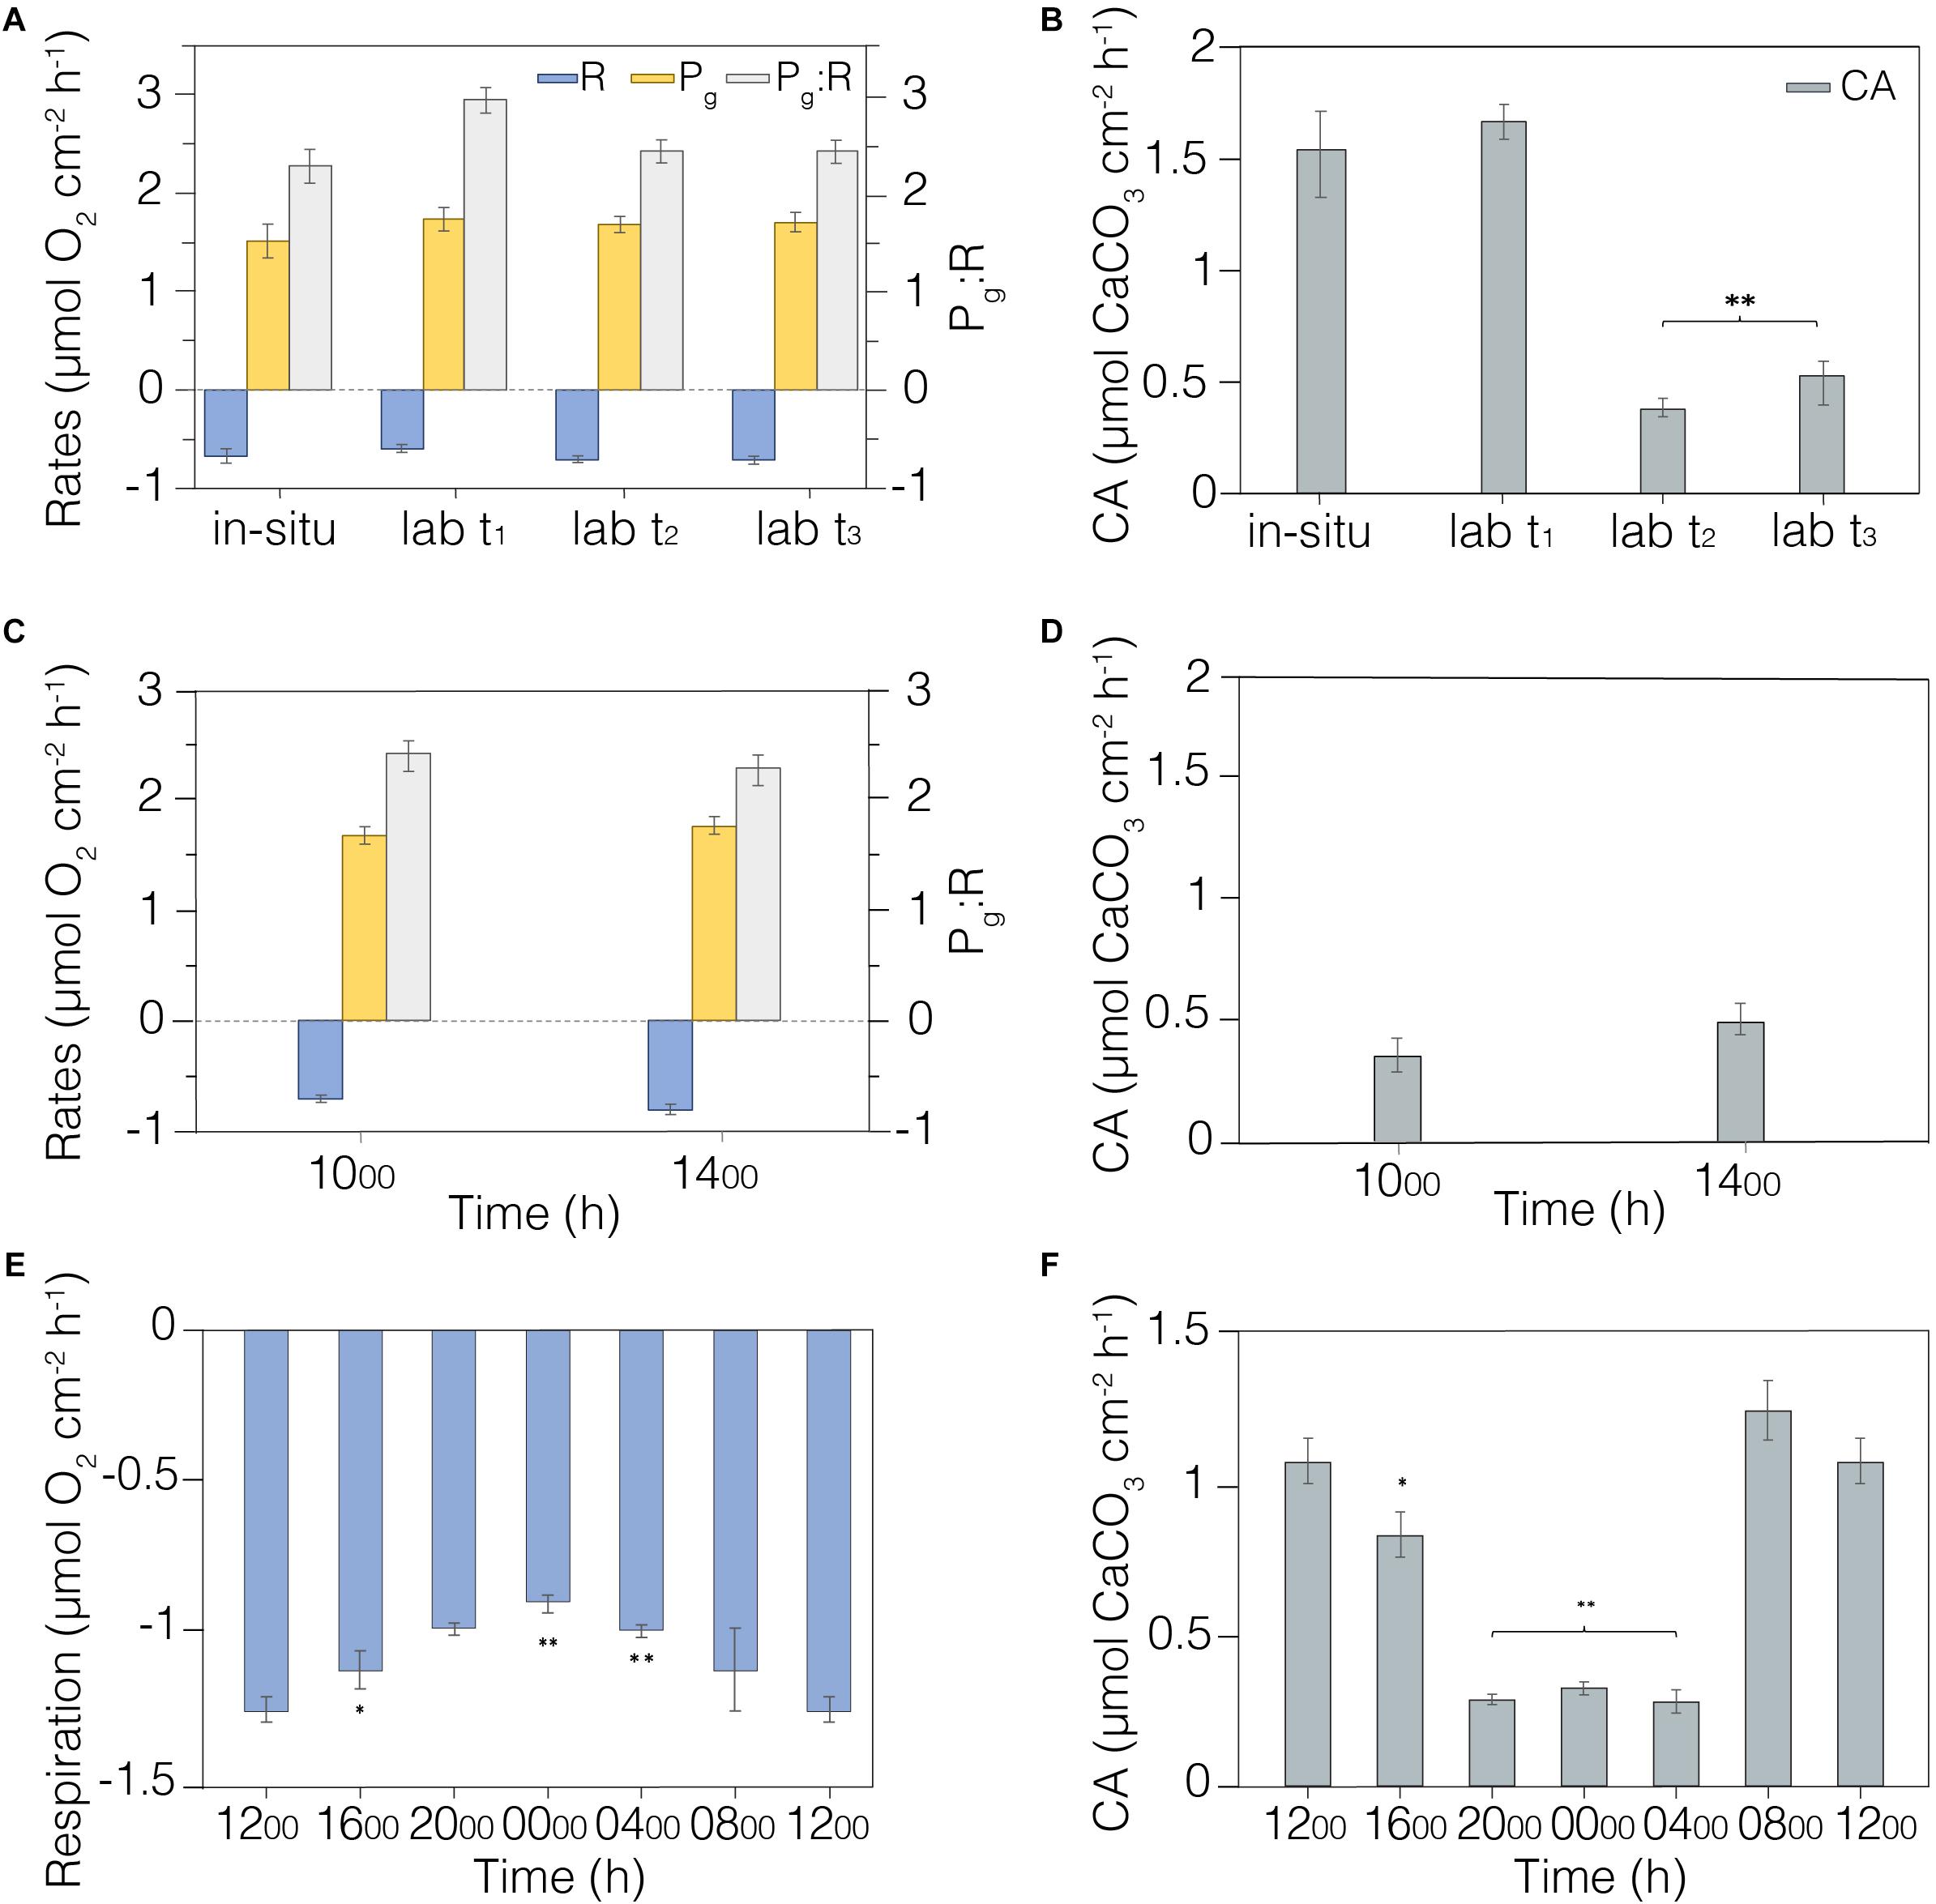
Figure 5. Metabolic rates measured in laboratory conditions. (A) Field and laboratory comparison of metabolic rates (R, Pg, and Pg:R) measured in situ (n = 6) and in laboratory-controlled conditions during the acclimation period (n = 12). (B) Calcification rates measured in situ (n = 6) and in laboratory acclimation tank (n = 12). (C) Morning and afternoon metabolisms (R, Pg, and Pg:R) were verified during measurements at two time period ranges (1000–1300 h and 1400–1700 h; n = 12). (D) Calcification rates measured in morning (1000–1300 h) and afternoon (1400–1700 h); n = 12. (E) Diel coral respiration was investigated using measurements taken every four hours (n = 4); values at 1200 h are the same. (F) Calcification rates measured every four hours (n = 4); values at 1200 h are the same. Average and standard error shown. **Indicates significative differences p < 0.01; *indicates significative differences p < 0.05. The legend is shown in the first panel.
Statistical Analysis
All metabolic rates data (respiration, photosynthesis and calcification) were processed by the Dixon’s Q test to identify and reject a single outlier (two-sided test) prior to further statistical analysis. A paired t-test (p < 0.05) was used to compare metabolic variables during each incubation (in situ vs. laboratory; morning vs. afternoon; diel cycle; coral spots and light intensities). The coefficient of variation (CV%) was used to compare the variability of measurements and calculated as ratio of standard deviation to the mean values of measurements. Results were considered significant with p < 0.05. Statistical analysis was performed with IBM SPSS Statistics v26.0 (IBM Corp., Armonk, United States).
Results
Instrument Performance
Both the O2 and pH sensors were tested under temperature-controlled (±0.01°C) indoor conditions in the laboratory, and achieved good precision and accuracy; the O2 sensor (PreSens) precision was ±2.33 mmol kg–1 (±1.04% saturation) in filtered (0.22 mm) seawater, and the ion-selective field effect transistor pH sensor (ISFET Durafet, Honeywell Inc.) precision was ±0.02 pH (measured pH 8.07) in Tris buffered seawater (calculated pH 8.09 from batch #T32 CRM, A. Dickson Laboratory, Scripps Institution of Oceanography) (Figures 2A,B). An example of the real-time O2 and pH data stream acquired during a typical deployment on corals -5 min dark incubation followed by 10 min incubation - is shown in Figure 2C. The LED color temperature and light spectrum, measured using a UPRTrek LED-meter, was warm white and 380–780 nm, Figure 3B). The LEDs intensity chosen for all light incubations was ∼460 mmol m–2 s–1 (equivalent to 40% setting) as close as possible to the median irradiance over 18 months of in situ measurements (∼410 mmol m–2 s–1; Onset HOBO data logger).
Instrument Deployments
The instrument and coupled devices were easily handled underwater and could be transported by a single diver. Even so, good scientific diving expertise and an understanding of the ecological purpose of respirometry measurements is necessary to maintain diver safety and protect the surrounding corals. On the bottom, release of the carabiners connecting the components together enabled straightforward deployment of the incubation chamber, with the slightly positive buoyant control module floating free of the coral surface (Figure 1a). The incubation chamber could be optimally positioned with information from the sensor feedback on the user interface and secured to the coral with retractile anchors (Figure 1b). Working in pairs in good marine conditions, divers were able to survey 5 to 6 colonies in less than 120 min; i.e., within the no-decompression time limits for shallow depths (<4 m depth).
Close attachment of the incubation chamber to the coral surface was essential to enable measurements of short-term changes in oxygen, pH and alkalinity. Although a visible ring spot initially was left on the coral surface after the attachment, it faded quickly after removal of the incubation chamber and vanished completely within 15–30 min (Figure 4). Longer-term studies in laboratory aquaria confirmed that there were no negative visible effects or mortality caused by even repeated attachment of the instrument’s chamber to the same general spot on the corals.
Laboratory Experiments
We first scrutinized the coral fragments for signs of longer-term stress associated with collection and transportation to the laboratory aquaria. Incubation measurements were recorded on six Platygyra spp. colonies in situ on 13th April 2018, while fragments (n = 12) were collected from other Platygyra spp. colonies in the vicinity. Coral metabolic indicators were measured on the fragments after 3 days (t1) of acclimation and weekly over the next 2 weeks (t2 and t3). There were no significant changes in respiration (R; p = 0.438) or gross photosynthesis (Pg; p = 0.179) measured as the group mean over this 2-week interval (R = 0.67 ± 0.03 mmol O2 cm–2 h–1; Pg = 1.66 ± 0.05 mmol O2 cm–2 h–1; n = 6), and R and Pg were equivalent to those measured in situ (Figure 5A, Table 2). However, Pg:R ratios were 23% higher in the laboratory after 3-days acclimation (p < 0.01) than in situ, but then stabilized during the second week of acclimation to levels similar to those measured in situ (p = 0.403; Pg:R = 2.38 ± 0.05; ure 5a). Calcification rates (CA) in the laboratory aquaria were similar to in situ values at t1 (p = 0.573; 1.68 ± 0.09 mmol CaCO3 cm–2 h–1) but by t2 the rates had dropped significantly to 0.38 ± 0.05 mmol CaCO3 cm–2 h–1 (p < 0.01) and remained unchanged at t3 (Figure 5B, Table 2).
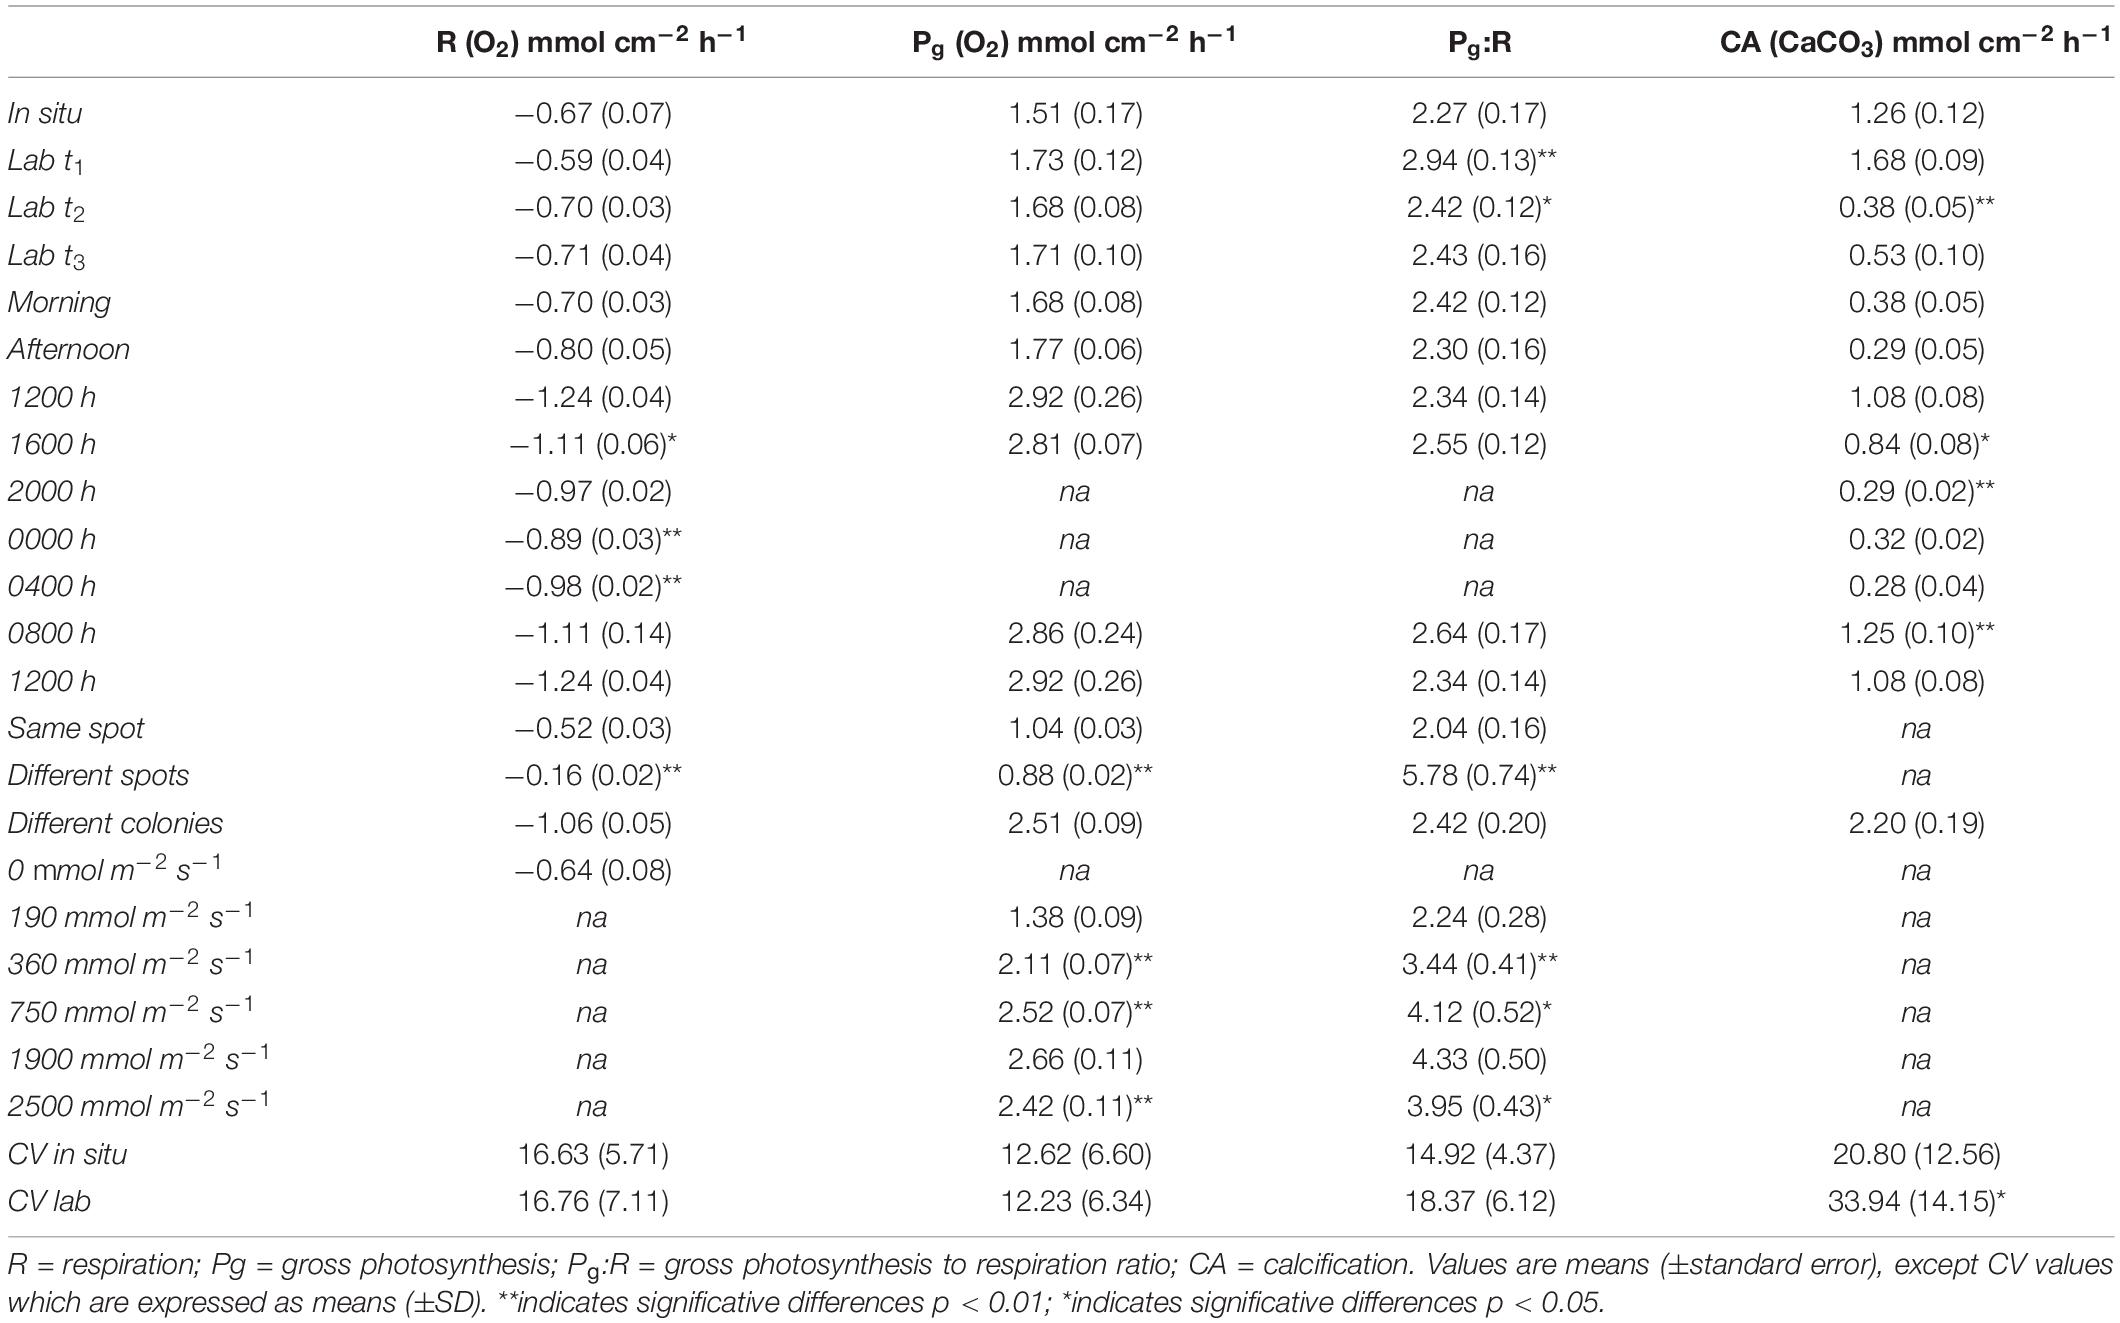
Table 2. Metabolic rates measured in different conditions in this study.
Changes in irradiance have the potential to affect net photosynthetic rates, and so there was concern that metabolic status estimates could change over the course of the day. Indeed, the irradiance in laboratory aquaria was higher in the morning (46.24 ± 21.84 μmol m–2 s–1) compared to afternoon (7.57 ± 3.32 μmol m–2 s–1) due to shading by the adjacent building (Supplementary Table S1). Measurements were taken every 20 min on the Platygyra spp. fragments (n = 12) during morning (1000-1300 h) and afternoon (1400–1700 h). There were no significant differences between morning and afternoon in R (p = 0.199), Pg (p = 0.573), Pg:R (p = 0.403) (Figure 5C), or CA (p = 0.18) (Figure 5D). The coefficient of variation (CV) of replicate measurements of R and Pg in the morning or afternoon was better than 20%, while the afternoon Pg:R ratios were slightly more variable (±23.1%, Figure 5C). CA rates estimated from changes in At in had a greater CV in the morning (37.6%) and afternoon (53.9%), indicating a greater fluctuation in DIC uptake rate among the fragments. Even so, grouping measurements from the morning and afternoon yielded precisions of <7% for R, Pg and Pg:R and 15% for CA: R = 0.75 ± 0.05 mmol O2 cm–2 h–1, Pg = 1.73 ± 0.05 mmol O2 cm–2 h–1, Pg:R = 2.36 ± 0.06, and CA = 0.34 ± 0.05 mmol CaCO3 cm–2 h–1. Although these results showed that the metrics of analyses were uniform from late morning to early afternoon under natural sunlight conditions, we conservatively restricted all subsequent laboratory and in situ sampling to between 1000–1300 h.
We quantified coral R and CA over a diel cycle to gain better insight into the natural metabolic transitions. Oxygen consumption and changes in alkalinity were measured every four hours on Platygyra spp. fragments (n = 4) in the laboratory aquaria (Figures 5E,F). R decreased steadily by about 2% per hour from noon to midnight, with midnight values being ∼30% lower than that at noon (1.24 ± 0.04 vs. 0.89 ± 0.03 mmol O2 cm–2 h–1; Table 2). This decrease became significant (p < 0.01) after 2000 h. A similar diel trend was observed in rates of CA, whereby maximum rates of 1.25 ± 0.10 mmol CaCO3 cm–2 h–1 occurred during the morning and mid-day but decreased sharply by ∼27% to a minimum of 0.30 ± 0.01 mmol CaCO3 cm–2 h–1 during the dark hours.
In situ Experiments
Assessing the functional, or effective measurement precision of these analyses among coral fragments within a controlled uniform environment is an important step, but it also is necessary to assess this measurement precision in natural reef environments. We measured this precision in situ on a single colony of Cyphastrea sp. using repeated short-term deployments (15 min) on a single dive at the same position on the colony (n = 5), and then among different spots (n = 4) on the colony (Figure 6A). The CV for repeated measures of R, Pg and Pg:R on the same spot were 12.0%, 5.4%, and 17.3%, respectively, while the variation measured across different positions on the same colony was greater for R and Pg:R (> 25%), but lower for Pg (<5%). Measurements of in situ metabolism on different colonies of Platygyra spp. in the same dive site also showed good replication (Figure 6B), with the CV in R and Pg being 12.02% and 8.8%, respectively, while Pg:R and CA being somewhat higher (20.48% and 21.13%) (n = 6). These metabolic rates were similar to those measured in the laboratory aquaria (Pg = 2.51 ± 0.09 mmol O2 cm–2 h–1; R = 1.06 ± 0.05 mmol O2 cm–2 h–1; Pg:R = 2.42 ± 0.20; CA = 2.20 ± 0.19 mmol CaCO3 cm–2 h–1; Table 2).
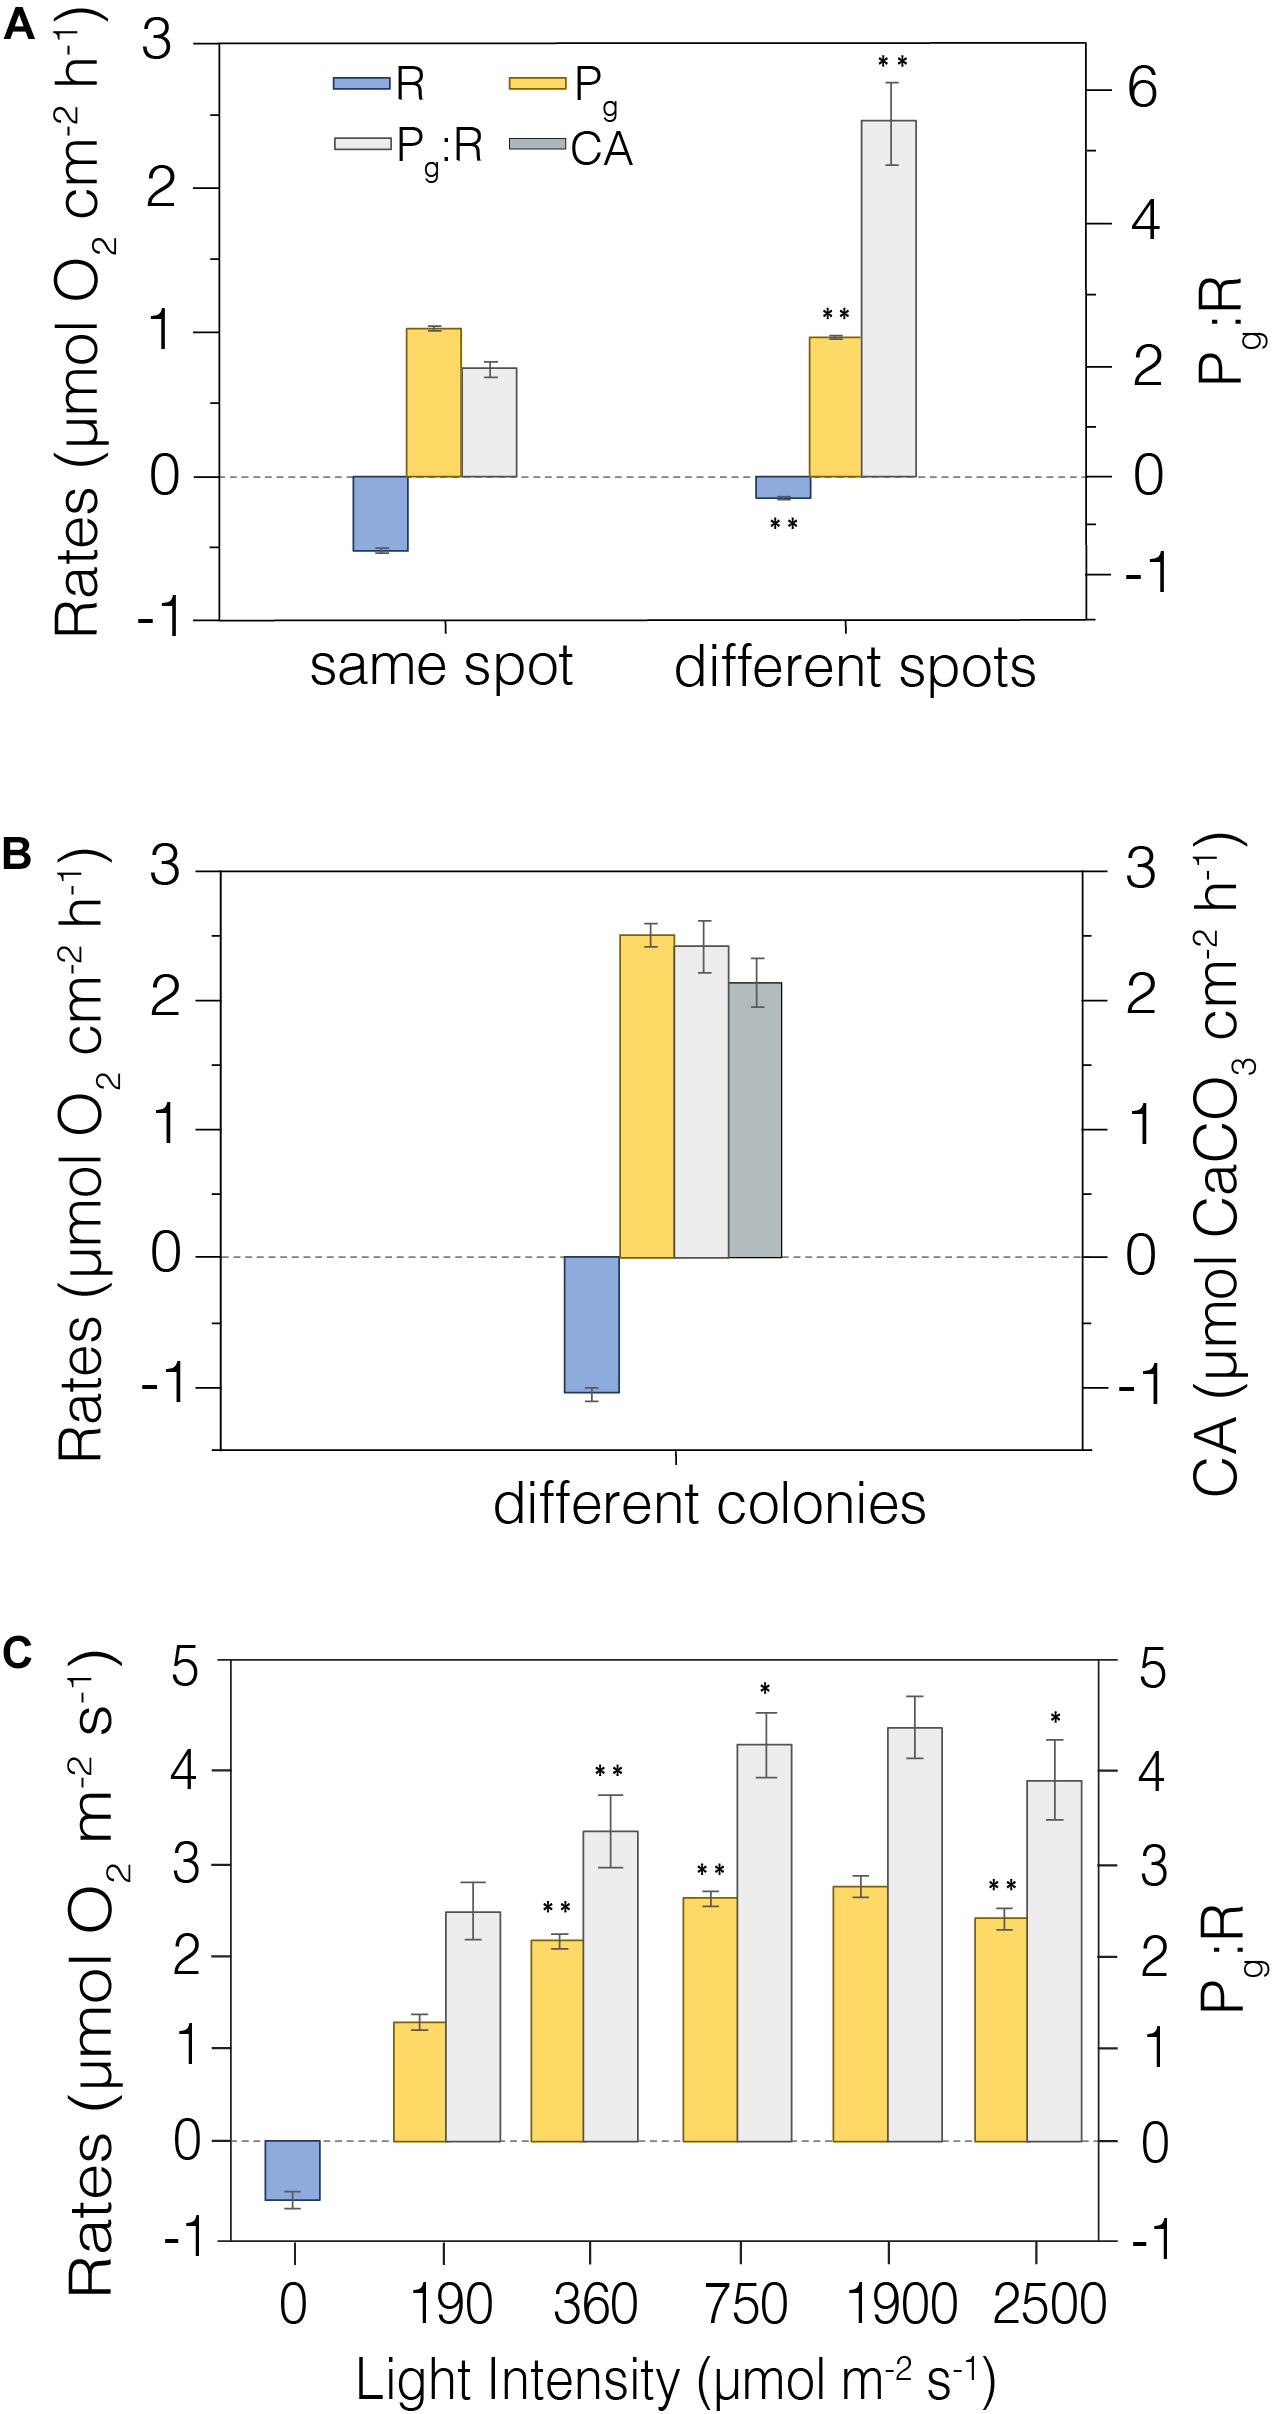
Figure 6. Metabolic rates measured in situ. (A) Repeated CISME measurements taken from the same precise location on a coral surface relative to repeated measurements taken from independent locations on a single Cyphastrea sp. colony (n = 4). (B) CISME measurements from Platygyra spp. colonies in the same dive site (n = 6). (C) Photosynthesis and respiration rates as a function of stepped increasing simulated PAR in the CISME chamber (n = 5); the measurements were made on a colony experiencing in situ incident radiation of ∼400 μmol m– 2 s– 1. Average and standard error shown. Average and standard error shown. **indicates significative differences p < 0.01; *Indicates significative differences p < 0.05. Legend is shown in the first panel.
The photosynthetic production of the coral holobiont changes with irradiance (Sawall and Hochberg, 2018), and so we used repeated measurements to evaluate the precision of net photosynthesis (Pn) and R as a function of PAR intensity. Measurements were taken at five irradiance levels from 0–2500 mmol m–2 s–1 on a single Platygyra sp. colony (Figure 6C). The maximum Pg and Pg:R ratios were detected at ∼1980 mmol m–2 s–1 (2.66 ± 0.11 mmol O2 cm–2 h–1 and 4.33 ± 0.50, respectively), but these values were very similar to those observed at ∼750 mmol m–2 s–1 (p > 0.05; Table 2). As with the earlier laboratory and field measurements, the variation in Pg was generally <10%, although the variation in R and Pg:R was greater (>20%) (Figure 6C).
The precision of measurements for each parameter taken in the laboratory-controlled conditions and in situ was compared (Figure 7). The variability among replicate measurements was similar between laboratory and field data, with higher variability observed in CA rates in the laboratory aquaria relative to field rates (p < 0.05, Figure 7, Table 2).
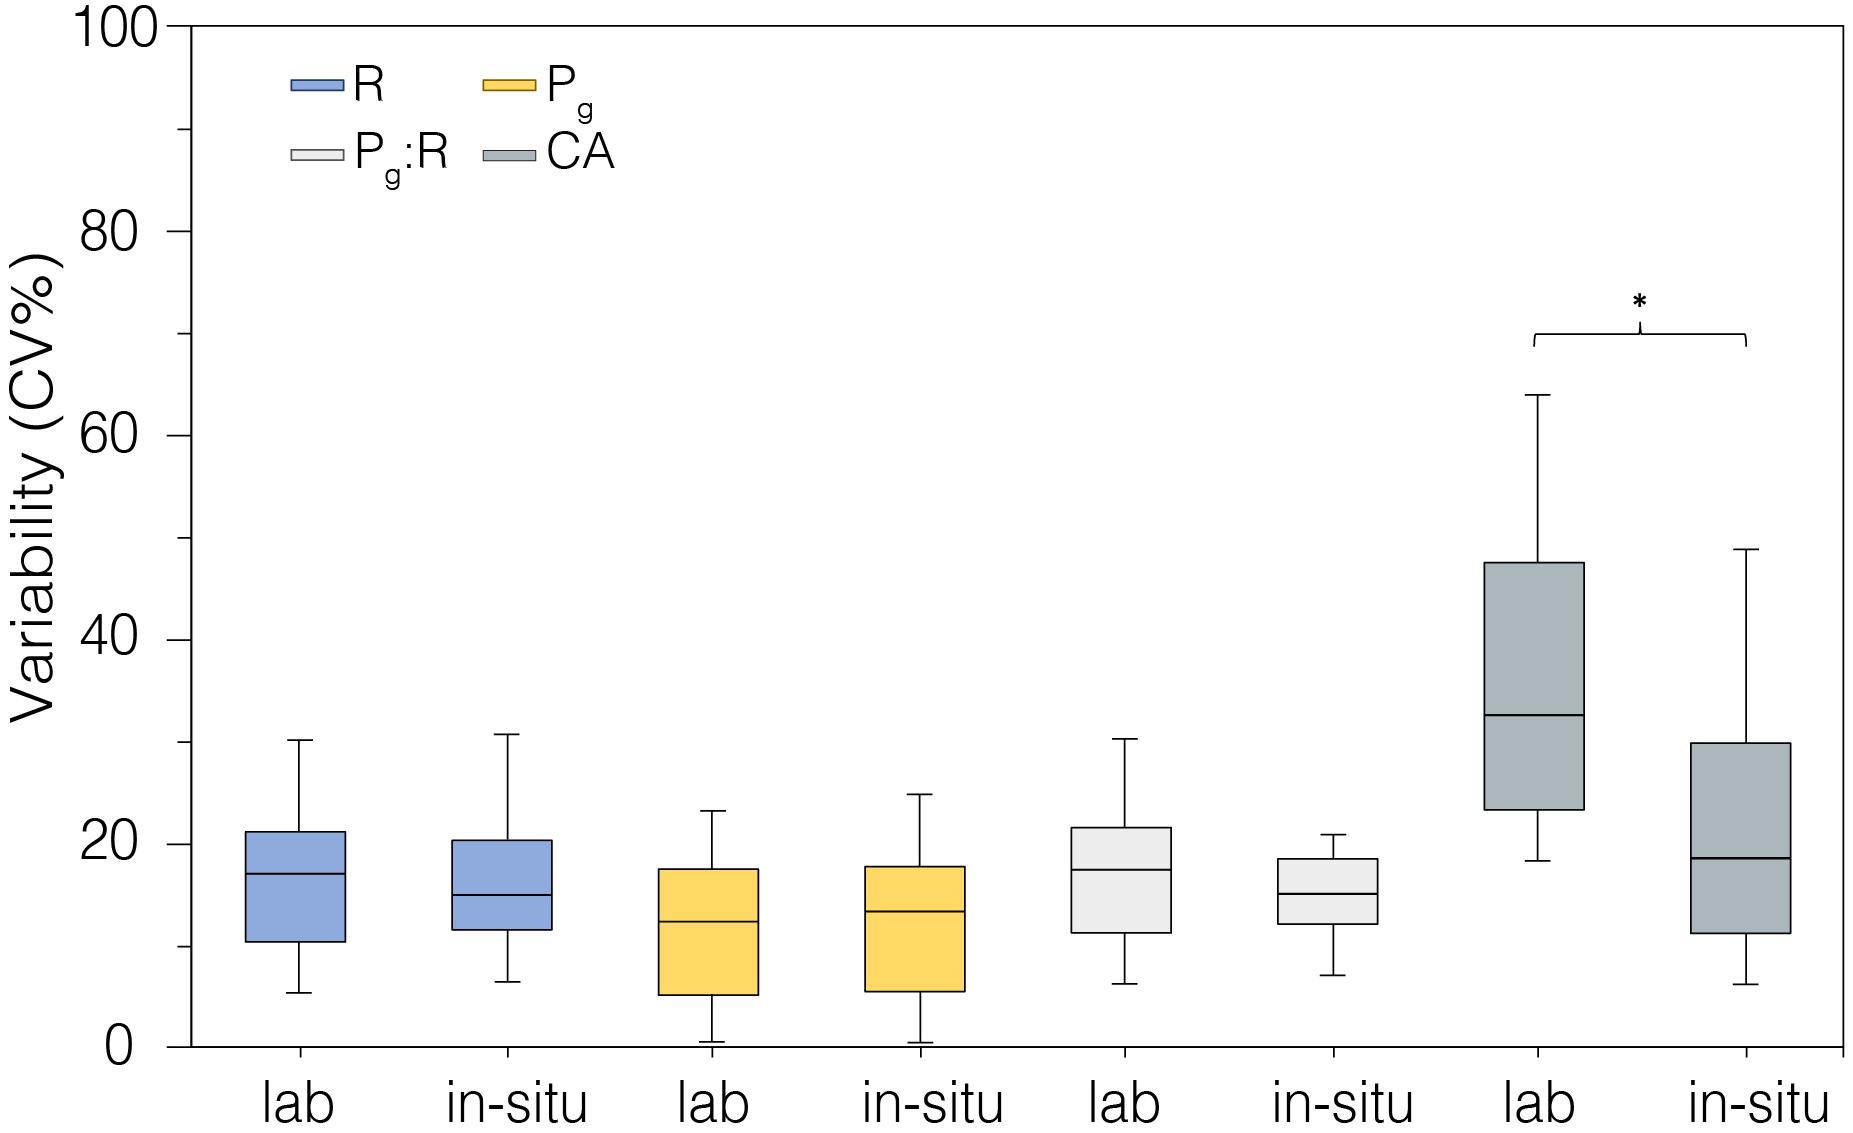
Figure 7. Coefficient of variability (CV%) calculated from metabolic rates measured in laboratory-controlled conditions (n = 18) and in situ (n = 18). *indicates statistical difference p < 0.05.
We compared the in situ metabolic data (O2 vs. CaCO3 production) of corals from Mirs Bay with those in laboratory conditions. Data collected in situ showed a weak positive relationship between measured O2 production (from gross photosynthesis) and daily calcification (1.18 ± 0.40, R2 = 0.27), but no discernable relationship was observed in the laboratory aquaria (5.35 ± 4.11, R2 = 0.01; Figure 8).
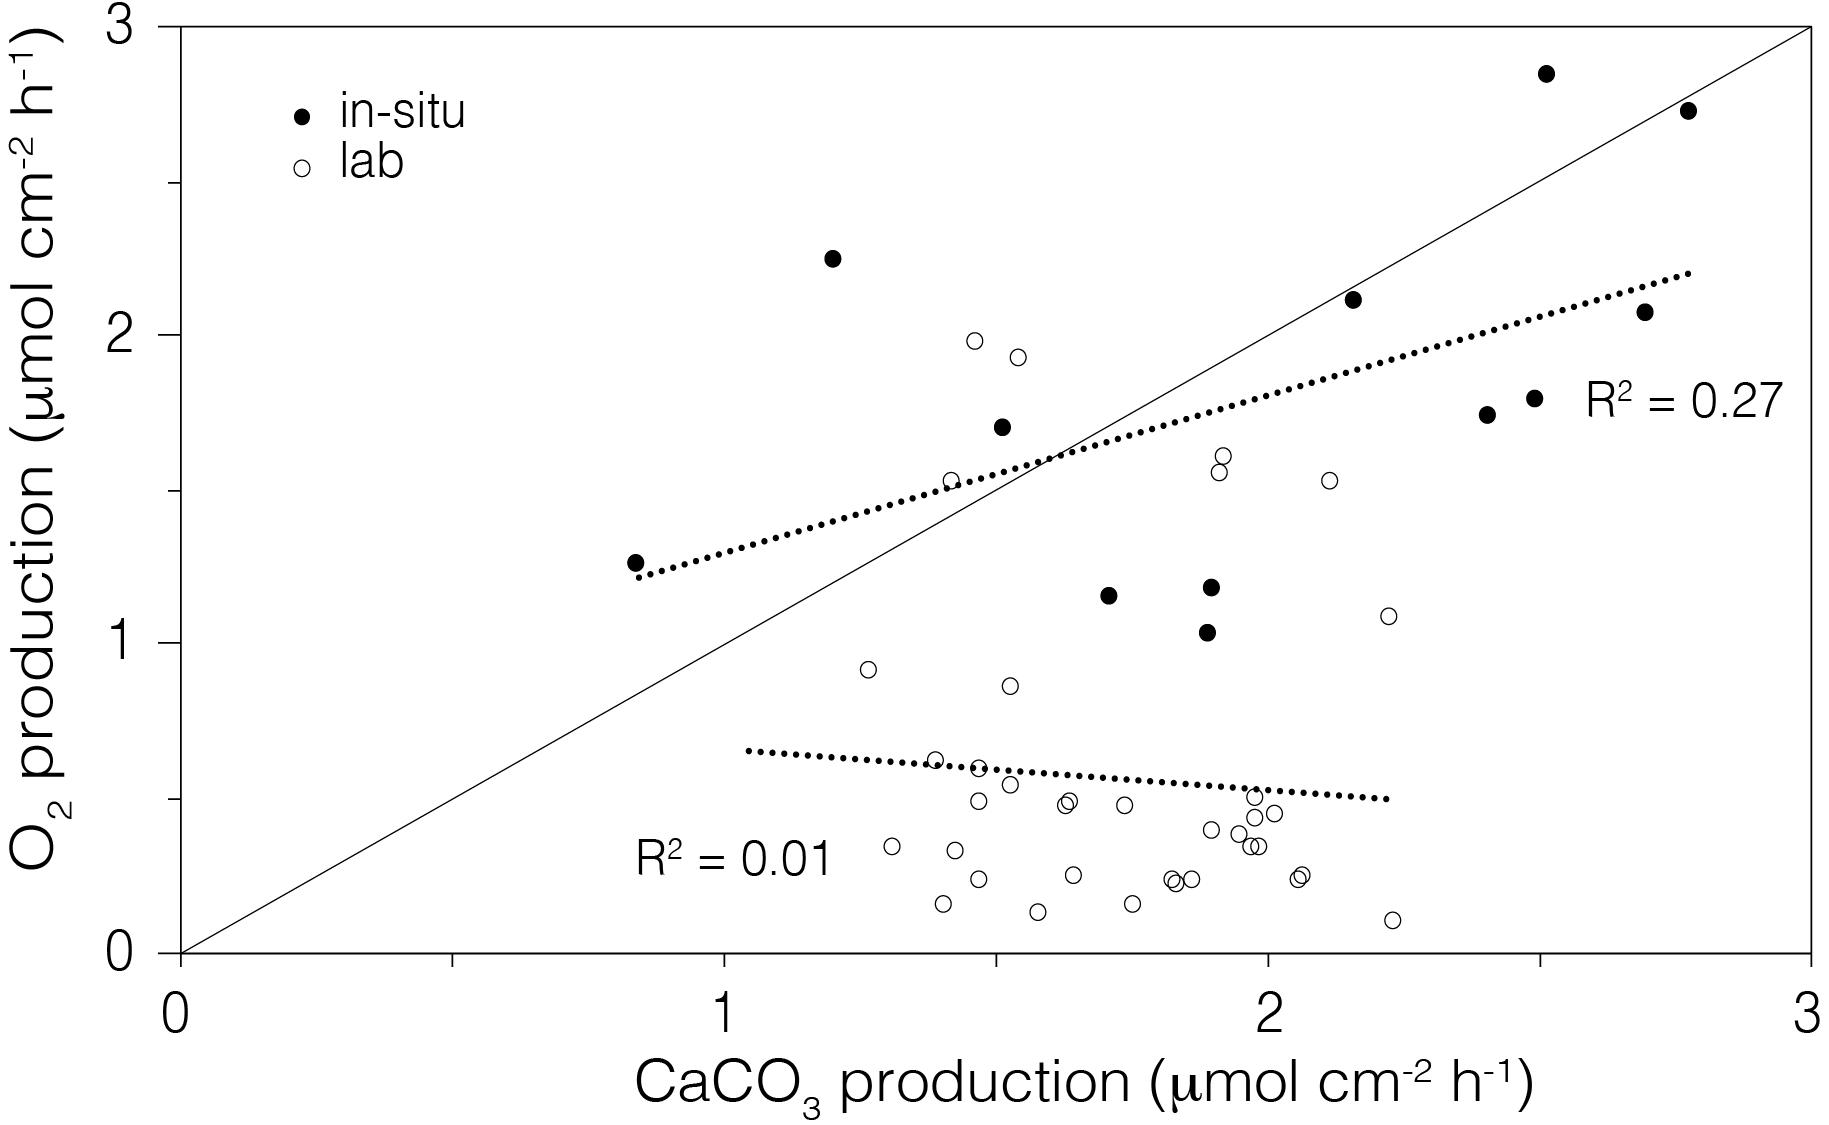
Figure 8. Comparison of the average rate of O2 production (gross photosynthesis) to the average rate of calcium carbonate production (daily calcification) in the laboratory aquaria (open circle) and in situ (closed circle) corals. The line shows the 1:1 relationship between the moles of O2 produced and moles of CaCO3 precipitated.
Finally, we conducted a preliminary assessment of how well the instrument could discriminate the metabolic status (R, Pg, Pg/R, and CA) of coral at different geographic locations in the Hong Kong region (Figure 9). Colonies of Platygyra spp. were sampled in A Ye Wan (n = 3), Tung Ping Chau Marine Park, and Gruff Head (n = 3), Hoi Ha Wan Marine Park. Measured levels of R, Pg and Pg/R were similar across both sites, but calcification rates were essentially zero in corals at Gruff Head (-0.18 ± 0.16 μmol CaCO3 cm–2 h–1) relative to that measured in A Ye Wan (1.57 ± 0.13 μmol CaCO3 cm–2 h–1) (Figure 9).
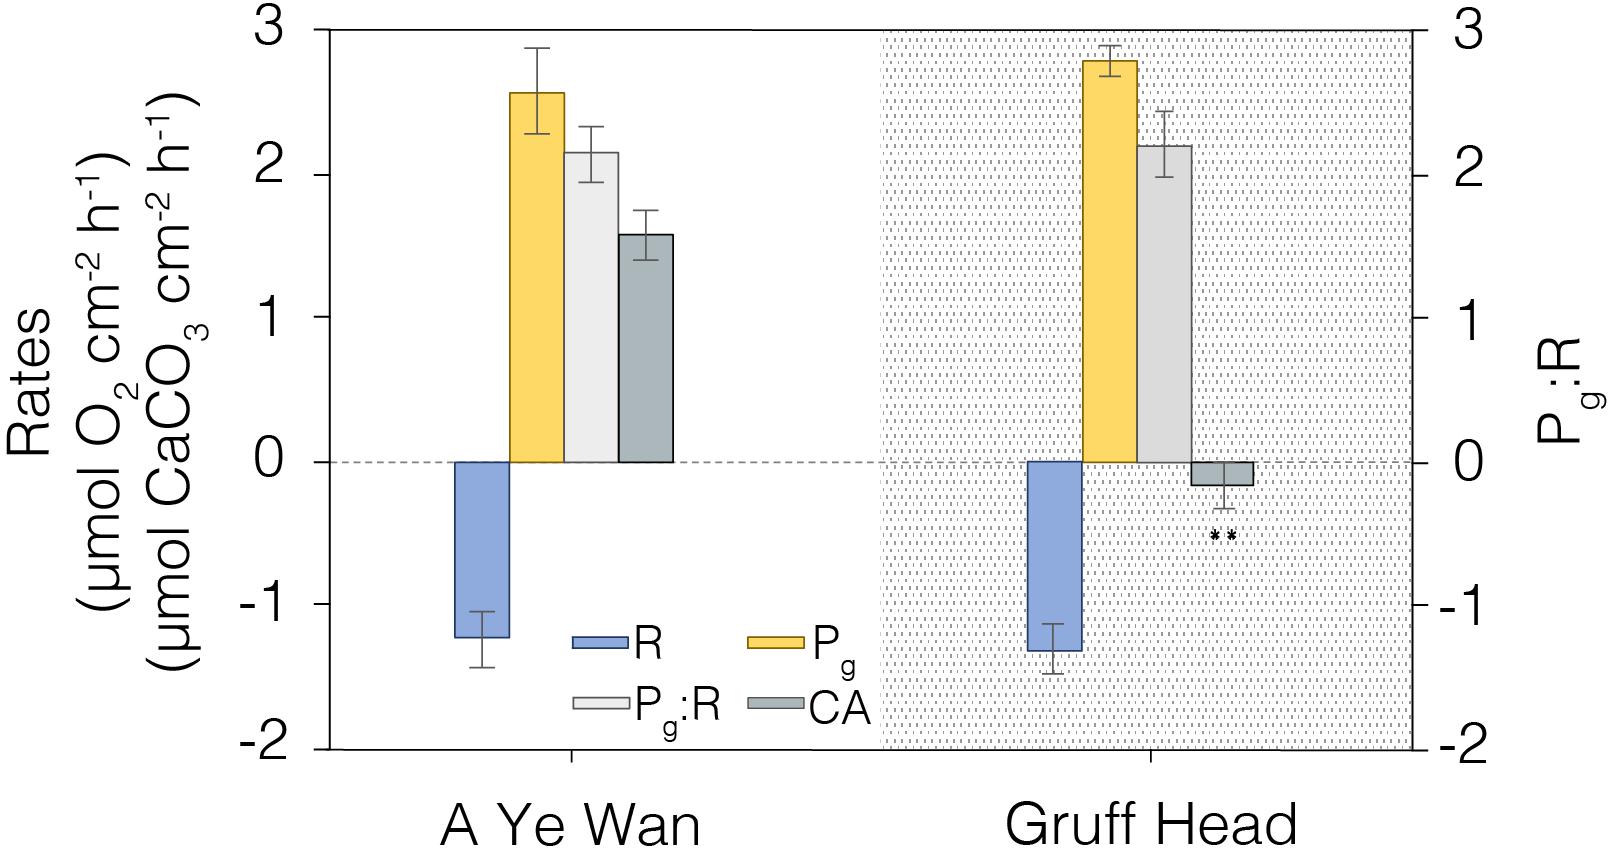
Figure 9. A comparison of coral metabolic rates measured in summer, 2019 at A Ye Wan (n = 3), Tung Ping Chau Marine Park, and Gruff Head (n = 3), Hoi Ha Wan Marine Park. Average and standard error shown. **Indicates significative differences p < 0.01.
Discussion
The purpose of this study was to evaluate the precision and accuracy of a novel underwater respirometry system for the measurement of sensitive indicators of stress on coral health. Assessing the metabolic status of corals and reef systems has relied on a variety of approaches and quantitative indicators. Microsensor O2 profiles at the coral diffusive boundary layer yield insights at the single polyp, or multiple polyp scales (Kuhl et al., 1995; Larkum et al., 2003; Yates and Halley, 2003; Camp et al., 2015; Nelson and Altieri, 2019), but these technologies are not logistically suited for surveying. Pulse amplitude modulated (PAM) fluorimetry can rapidly provide indications of coral health by quantifying the photophysiology of endosymbionts (Beer et al., 1998; Ralph et al., 1999), but cannot yield information on coral growth. At the other end of the spectrum, reef-scale net ecosystem production and calcification can be estimated through measuring a combination of seawater pH, DIC, At, or pCO2 to constrain the seawater carbonate system (Anthony et al., 2011; McMahon et al., 2018), however, they require substantial observational infrastructures. The underwater respirometry system tested here (CISME) can bridge small-scale to reef system approaches by providing quantitative metabolic data at colony scales with an easily portable, self-contained unit that can be used effectively without expert training or elaborate observational networks.
The preliminary work investigating the functionality of the instrument was promising (Murphy et al., 2012; Dellisanti et al., 2020), but significant questions remained about its effective reproducibility in coral studies. That is, do these metabolic measures yield sufficient accuracy and precision to enable meaningful quantitative comparisons among laboratory and field studies, across reef systems, and over the time scales needed to establish the effect of climate drivers? Our study investigated this question.
Instrument Performance
The instrument design combines the detection of in situ metabolic indicators with comparative ease of use by scientific divers. The instrument is reasonably compact, can be operated in both deep and reasonably turbulent waters, and the output data can be processed using basic statistics and commonly available free software. To our knowledge it is the first system that enables practical measurements of underwater respirometry sufficiently rapidly to survey several coral colonies in shallow marine areas on a single dive, while simultaneously enabling the collection of other standard coral monitoring data. Measurements of dissolved O2 and pH fluxes are considered to be drivers and indicators of coral energetic dynamics, including respiration, photosynthesis and calcification (Falkowski et al., 1984; Cohen et al., 2016), and the non-invasive sampling of these parameters with this instrument enables the in situ analysis of coral metabolic processes. This innovative underwater respirometer, used in conjunction with standard coral and environmental monitoring practices (e.g., spatial surveys, water quality indicators, etc.), represents a significant advance in the capacity to study and evaluate the status of reef ecosystems.
Our findings show that the instrument provided highly precise and accurate measurements of coral-induced changes in dissolved O2 and seawater pH compared to other studies using benthic chambers (Yates and Halley, 2003; Camp et al., 2015). The alkalinity anomaly method for determining short-term calcification rates, using open-cell potentiometric acid-titration (Dickson et al., 2007), is more accurate than the buoyant weight methods (Schoepf et al., 2017). Moreover, combining pH measurements and alkalinity enables characterization of the seawater carbonate system, providing estimates of the DIC composition and aragonite saturation (Ωa) state. We recognize that alkalinity and total dissolved inorganic carbon (vs. pH) yields more precise calculations of the carbonate system (Riebesell et al., 2011) but higher levels of precision generally are not required for the study of biological systems (e.g., the Global Ocean Acidification Observation Network; www.goa-on.org).
Corals are delicate, slow-growing organisms that can easily be damaged by physical disturbance, so an overriding concern of any in situ methods is whether corals are negatively impacted by the measurement process itself. In this case, a soft neoprene ring is pressed against the coral surface using stabilizing harnesses to create a small chamber (Figure 1c). Most deployments lasted 15 min in duration, the minimum time to ensure significant changes in At could be detected, but shorter times could be used if calcification rates were not measured. On removal of the chamber, a mucoid “ring” was routinely observed where the neoprene was in contact with the coral, but this feature was short-lived (Figure 4). While coral polyps on the periphery of the chamber (i.e., under the neoprene seal) exhibited signs of short term stress (mucus production), there were no negative effects observed on coral morphology or energetics with repeated discrete measurements at different times on the same region of coral fragments in laboratory aquaria or in situ (Figures 5, 6). This independence between peripheral and within-chamber polyps is consistent with indications of semi-autonomy among neighboring polyps (Nothdurft and Webb, 2009). The implication then is that the chamber measurement over these 15-min deployments adequately reflects the ambient metabolic state of the sampled coral surface.
The benefit of short-term incubations is the potential for replicate measurement to capture the variability in metabolic status in situ over the same coral structure, among colonies having varying proximity to local point-source stressors (e.g., anthropogenically influenced discharges), or the cumulative local and global impacts on corals over time or latitudinal ranges. However, our findings show that the choice of the deployment spot is crucial and based on the morphology of the coral colony. For instance, the variability of measurements taken on a single Cyphastrea spp. coral colony was much higher when measured on different spots (Figure 6A), likely due to its encrusting-irregular surface. On the other hand, the boulder morphology of Platygyra spp. was more practical and precise when the energetics were compared between five colonies (Figure 6B). We were able to examine the metabolic status of 6 coral colonies on a single dive in shallow waters, lowering incubation times from hours (e.g., Camp et al., 2015) to minutes. Single measurements of oxygen fluxes (R or Pg) could be processed within 5 min on the underwater tablet, allowing replication at both temporal and spatial scales. Four to six replicates were used in field studies here to assess this variability; more than would be practical for general reef survey protocols.
Coral Metabolic Rates
Corals experience natural day-to-night variations in the gradient of dissolved oxygen and DIC between coral tissue and the surrounding waters (Allemand et al., 2011; Schoepf et al., 2017). Under sunlight, the photosynthetic production by the endosymbionts yields O2, energy as ATP, and carbohydrates to the coral tissue (Falkowski et al., 1984). Most of the photo-produced O2 (78–90%) is consumed by respiration (Kuhl et al., 1995; Al-Horani et al., 2003b; Levy et al., 2004) while the excess is released to the surrounding water (Al-Horani et al., 2003a, 2007). Many coral species, such as Platygyra spp., shift to heterotrophic feeding at night extending their polyps on planktonic prey, when they become dependent on O2 flux from the external environment for respiration (Al-Horani et al., 2003a). The night-time decrease in available O2 can limit coral respiration, and thereby the needed adenosine triphosphate (ATP) supply to fuel dark calcification (Al-Horani et al., 2007); a significant problem for reefs exposed to low night-time dissolved O2 concentrations. Indeed, night-time respiration under our laboratory setting was ∼ 29% lower than the daytime measured rates (Figure 5C), in general agreement with other findings (Schneider et al., 2009). Even though the flowing seawater in our aquaria was well oxygenated, night-time calcification rates were ∼73% lower than daytime rates (Figure 5C), consistent with earlier findings that daily photosynthesis has a major role in enhancing the calcification process (Falkowski et al., 1984; Cohen et al., 2016).
Measurements of R were highly replicable in laboratory-controlled conditions and similar to that measured in situ (Figure 5). The endosymbiont contribution to the O2 consumption/CO2 production in dark conditions (Kuhl et al., 1995; Hawkins et al., 2016) was not considered here; it was assumed that short incubation times (5 min) were insufficient for any flux from the symbionts to significantly alter the seawater chemistry in the benthic chamber. However, cellular respiration of the coral holobiont produces CO2, causing pH to decrease, so care must be taken during respirometry measurements to ensure that the resultant shift in Ωa does not substantially affect calcification rates (Andersson et al., 2011). Our data showed a reduction of 0.1 Ωa per minute of dark incubation, which with our local seawater would lead to carbonate dissolution conditions (Ωa ≤ 1) in the chamber after 20 min of dark incubation. In the protocols proposed here, we selected 5 min dark incubations, resulting in an overall reduction of about 0.5 to 2.5 Ωa (Supplementary Table S2 online), even shorter dark incubations would be necessary in reef systems having lower initial Ωa levels.
The ratio of oxygen produced through photosynthesis and oxygen consumed by dark respiration provides an energetic measure of coral capacity for self-maintenance and growth. Pg:R ratios measured on Platygyra spp. and Cyphastrea spp. did not differ among different experimental treatments and always remained above the minimum level for functional autotrophy (e.g., =2, Coles and Jokiel, 1977), although the ratios were lower than measured for other species in Hong Kong waters (McIlroy et al., 2019). Moreover, differences in Pg:R values largely resulted from variations in R rather than Pg. These findings would suggest that these corals were near their physiological limits (i.e., maximum Pg) when we measured these metabolic rates; i.e., during the wet season between April to August 2018. However, a more detailed survey on seasonal and spatial pattern of coral metabolism would be needed to confirm this tentative conclusion.
We compared the precision of measurements for each parameter taken in the laboratory-controlled conditions and in situ (Figure 7). The variability among replicate measurements was very similar between laboratory and field data. Our R, Pg, and Pg:R data (n = 18) suggest that the natural variation of metabolic parameters between fragments or colonies belonging to the same species is about ± 20%, and it might depend on polyp vs endosymbionts symbiotic status of single colonies. The higher variability of CA in the laboratory aquaria over time relative to that in situ (p < 0.05, Figure 7) likely was related to both lower, and more variable alkalinity in the Tolo Harbor source waters compared to the more stable, and higher alkalinity in Mirs Bay (2042.76 ± 158.27 mmol kg–1 vs. 2270.84 ± 88.74 mmol kg–1, respectively; n = 18; Table 1). The outer-estuarine seawater source for the outdoor tanks is more directly influenced by freshwater discharge than the field site, and thus would be more susceptible to natural fluctuations of seawater chemistry. Moreover, the significant reduction of natural light intensities in laboratory versus in situ conditions, from 395.48 ± 168.5 to 20.73 ± 23.43 mmol m–2 s–1 (Supplementary Table S1, online) may also have contributed to lower CA (Figures 5B,D).
Conducting reef surveys logistically requires sampling at different times of the day (i.e., light levels), so how much variability occurs between the morning and afternoon sampling of coral metabolic indicators? We found there was no difference in the rates of R, Pg, or CA in multiple measures during the morning (1000–1300 h) and afternoon (1400–1700 h) in the natural light exposed aquaria (Figure 5C), although discrete measurements showed a slight trend consistent with light levels decreasing from 46.24 ± 21.84 (morning) to 7.57 ± 3.32 mmol m–2 s–1 (afternoon; Supplementary Table S1, online). However, R and CA rates were slightly reduced in the afternoon (1600 h) by 11 and 23%, respectively, when we quantified the rates over the diel cycle (Figures 5E,F; p < 0.05), likely reflecting the greater variation in day-time light levels during this experiment (from 126.9 ± 37.28 in the morning to 27.18 ± 3.89 mmol m–2 s–1 in the afternoon; Supplementary Table S1, online). Nevertheless, these results demonstrate the flexibility in the practical application of the instrument as a reef survey tool.
Coral Energetics
The instrument also fills an important methodological gap by quantifying the energetic costs of individual in situ corals under present day conditions, thereby informing on the potential impacts under future scenarios. In their overall energetics, corals consume oxygen during aerobic respiration to break down glucose and create ATP, while simultaneously, under sunlight conditions, endosymbiont-mediated photosynthesis produces glucose, releasing O2 as a by-product. This positive feedback loop (Gardella and Edmunds, 1999) fuels the metabolically demanding process of calcification (Cohen and Holcomb, 2009), where a plasma membrane Ca2+ - ATPase regulates the exchange of Ca2+ and H+ from the calicoblastic cells into the calcifying space (Murphy and Richmond, 2016). In this framework, 1 ATP is consumed by coral respiration per mmol of CaCO3 produced, with the overall energetic expenditure for calcification being ∼30% of the total energy budget (Cohen and McConnaughey, 2003). The in situ metabolic data for corals from Mirs Bay showed a weak positive relationship between measured gross photosynthesis and daily calcification, indicating that the environmental conditions (e.g., alkalinity, sunlight irradiance) supported a more sustainable coral growth compared to corals maintained in the laboratory aquaria (Figure 8). Although the Pg of the laboratory-housed coral fragments were sufficient to maintain healthy colonies, consistent with their robust visual appearance, their rates of calcification (i.e., growth) were substantially lower than that of in situ corals having equally robust visual appearance and equivalent Pg (Figure 5B). These findings illustrate the potential deeper insights that would stem from use of this respirometry instrument in spatial and temporal assessments of the health status of reef systems.
As a further example of this point we conducted a preliminary assessment of the potential effects of local stressors by comparing coral metabolic indicators between two Hong Kong marine parks. Tung Ping Chau Marine Park hosts visually robust corals and the A Ye Wan shore has the highest coral coverage in Hong Kong (>50%); a low stress endmember for the Hong Kong region. In contrast, the Gruff Head area in Hoi Ha Wan Marine Park, situated ∼10 km across Mirs Bay, has a much lower coverage of corals (∼20%) that is in a state of decline (Wong et al., 2018). Gruff Head experiences higher freshwater and anthropogenic inputs from both Tolo Harbor and Channel and the local river in Hoi Ha, especially during the summer (wet season). Both sites had similar hardy rates of Pg, R, and Pg:R, suggestive of healthy corals, but dramatically different levels of CA, with rates equivalent to zero for Gruff Head (Figure 9). That is, unlike corals at A Ye Wan, corals at Gruff Head were maintaining their physiology but not growing during the summer sampling period. Although the relative status of corals in these two marine parks cannot be adequately assessed from this single point sampling, these data illustrate the strength of this combination of metabolic indicators for investigating spatial distributions of local stressor effects.
The change in O2 and pH during our deployments can provide information about individual coral metabolic quotients (Q) (Gattuso and Jaubert, 1990), whereby the photosynthetic quotient (PQ) is the ratio of oxygen production and carbon sequestration through photosynthesis and the respiratory quotient (RQ) is the ratio of carbon release and oxygen consumption during dark respiration. Estimates of these values for reef systems are generally assumed on the order of ∼1 (Muscatine et al., 1981; Atkinson and Falter, 2003; Taddei et al., 2008; Falter et al., 2012; Takeshita et al., 2016, 2018; Bednarz et al., 2018), but few data sets are available on coral reefs, and we are unaware of any calculated from single coral colonies in situ. The positive (production) and negative (respiration) change in pH measured during our deployments (e.g., Figure 2C) enables direct estimation of these coral metabolic quotients (Gattuso and Jaubert, 1990) through the calculation of DIC with the CO2Sys program (Pierrot et al., 2006). However, O2 and DIC fluxes are dependent on many factors, and metabolic quotients can be variable. Indeed, the PQ calculated from our measurements was 1.22 ± 0.33 mol O2:mol C in laboratory but was substantially lower in situ, at 0.66 ± 0.38 mol O2:mol C, spanning the reported range for whole reef systems. Low PQ could occur due to super saturation of oxygen in seawater or hydrodynamics at the surface of corals as observed in previous studies (Atkinson and Grigg, 1984; Taddei et al., 2008; Bolden et al., 2019) coupled with the DIC bioavailability. Conversely, our estimated single colony RQ was substantially higher than the reported community estimates in the laboratory (1.47 ± 0.42 mol C:mol O2) and particularly in situ (1.83 ± 0.44 mol C:mol O2; Supplementary Table S3, online), suggesting a deeper investigation on the stoichiometry of metabolic quotients should be implemented in future coral reef ecology studies (Takeshita et al., 2016). Moreover, it has been suggested that large variability of Q could be due to environmental factors, diel cycle and sampling bias (Bolden et al., 2019). The carbon fluxes estimated from metabolic rates detected by this respirometry system could allow a further investigation about coral health under different conditions. Taken together with seawater carbonate system, a more general information on the coral health status can be extrapolated into the metabolic “pulse” of coral communities (Cyronak et al., 2018, Bolden et al., 2019).
The present study focused on massive and encrusting coral colonies, and though the respirometry system can be applied to other benthic organisms (Murphy et al., 2012) there are limitations to its use. The chamber head area (24.5 cm2) can be too large when there is no clear flat surface, or with coral colonies in early growth stages. A smaller chamber head is available, but the lower volume might necessitate shorter incubations, with potentially less reliable R and Pg determinations, and likely prevent the analytical resolution of calcification rates (at least without more sophisticated alkalinity methods). The study of branching corals still would require fragmentation to introduce coral pieces to the chamber, obviating the benefits of non-destructive sampling of coral metabolic rates. There also are some concerns that corals with rough polyps (e.g., Lithopyllon spp., Goniopora spp., Fungia spp.) may prevent adequate seal formation between the neoprene ring and coral surface, and thus they may not be suitable for these measurements. In its present form then, the best approach for using this system for coral monitoring likely would require selecting morphologically suitable “sentinel” coral colonies that could be revisited on regular time intervals.
A major ethical issue in coral research is balancing the needs for collection of coral fragments to study in the laboratory against the necessary goal of protecting reef systems. The underwater respirometry system evaluated here also is capable of non-destructive in situ experimentation. For example, the effect of changing irradiance on R, Pg, and CA can be studied through programming of the LED array. The detachable chamber recirculation loop (Figure 1) can be used to introduce alternate chemical or biological conditions to evaluate their effects on coral metabolism; e.g., changes in At, turbidity, or plankton abundance. These studies could focus on short-term effects during single deployments, but also could evaluate longer-term outcomes by resampling the exposed coral spot over days or weeks. Our point is that this respirometry system has strong potential not only for in situ assessment of the health of individual corals in reef systems, but also for investigating aspects of coral metabolism without the need of the destructive collection of corals. There also are potential useful applications for studying non-coral calcifying incrusting organisms, such as microbial mats and crustose coralline algae.
Accurate and precise assessment of coral metabolic processes is key to improving our knowledge of the reef building species, and how their ecosystems are influenced to varying degrees by the combination of local and global anthropogenic disturbance. The Community In situ Metabolism (CISME) respirometry system enables comparatively rapid, non-destructive measurement of coral physiological indicators, with a level of precision and accuracy that enables the detection of small differences in coral metabolism among corals and over their natural diel cycles. The system is better suited for high spatial and temporal resolution sampling than other methods (Weber et al., 2007; Long et al., 2013, Camp et al., 2015). It can be an important tool then for studying the effects of local stressors (point and regional scale). Its practicality and low cost of use also would help support the continuous collection of observations needed to detect effects associated with interannual and decadal scale ocean-atmosphere climate variability (e.g., El Niño Southern Oscillation, Pacific Decadal Oscillation, North Atlantic Oscillation), as well as the evolution of climate-driven changes in marine systems. Further development and application of this instrument and similar methodologies will improve our ability to generate rich and timely information about the energetic status of corals, which is urgently needed for coral reef management and conservation efforts.
Data Availability Statement
The original contributions presented in the study are publicly available. This data can be found here: PANGAEA accession number PDI-25286.
Author Contributions
WD, RT, PA, and MW conceived and conducted the experiments. WD, RT, and MW analyzed the results. All authors reviewed the manuscript.
Funding
This study was supported by the Collaborative Research Fund (C7013-19G) of the Hong Kong Research Grants Council; the National Natural Science Foundation of China (41641047); the Internal Research Project of State Key Laboratory of Satellite Ocean Environment Dynamics, Second Institute of Oceanography, State Oceanic Administration (No. SOEDZZ1702), and the SKLMP Seed Collaborative Research Fund (SCRF/0027).
Conflict of Interest
The authors declare that the research was conducted in the absence of any commercial or financial relationships that could be construed as a potential conflict of interest.
Acknowledgments
We thank all the persons involved who provided support for the experiments, in particular Mr. Oliver Petterson Stubbs for helping to collect coral fragments, Mr. Kelvin So, Ms. Zoe Wong, Mr. Jeffrey Chung, and Dr. Alan Lin for the assistance during the laboratory work, Ms. Mirna Zordan for the technical artwork, and Prof. John Hodgkiss for the proof-reading. We thank the Marine Parks Division, Agriculture Fisheries and Conservation Department, HKSARG, for the permission to use data collected within Marine Parks. We are particularly grateful to the two reviewers, whose detailed and thoughtful comments greatly improved the manuscript.
Supplementary Material
The Supplementary Material for this article can be found online at: https://www.frontiersin.org/articles/10.3389/fmars.2020.571451/full#supplementary-material
References
Al-Horani, F. A., Al-Moghrabi, S. M., and de Beer, D. (2003a). Microsensor study of photosynthesis and calcification in the scleractinian coral, Galaxea fascicularis: active internal carbon cycle. J. Exp. Mar. Bio. Ecol. 142, 419–426. doi: 10.1007/s00227-002-0981-8
Al-Horani, F. A., Al-Moghrabi, S. M., and de Beer, D. (2003b). The mechanism of calcification and its relation to photosynthesis and respiration in the scleractinian coral Galaxea fascicularis. Mar. Biol. 142, 419–426.
Al-Horani, F. A., Tambutté, E., and Allemand, D. (2007). Dark calcification and the daily rhythm of calcification in the scleractinian coral, Galaxea fascicularis. Coral Reefs 26, 531–538. doi: 10.1007/s00338-007-0250-x
Allemand, D., Tambutté, E., Zoccola, D., and Tambutté, S. (2011). “Coral calcification, cells to reefs,” in Coral Reefs: An Ecosystem in Transition, eds Z. Dubinsky and N. Stambler (Cham: Springer), 119–150. doi: 10.1007/978-94-007-0114-4_9
Andersson, A. J., Mackenzie, F. T., and Gattuso, J.-P. (2011). “Effects of Ocean acidification on benthic processes, organisms and ecosystems,” in Ocean Acidification, eds J.-P. Gattuso and L. Hansson (Oxford: OUP), 122–153.
Anthony, K., Kleypas, A., and Gattuso, J.-P. (2011). Coral reefs modify their seawater carbon chemistry–implications for impacts of ocean acidification. Glob. Change Biol. 17, 3655–3666. doi: 10.1111/j.1365-2486.2011.02510.x
Anthony, K. N., Kline, D. I., Diaz-Pulido, G., Dove, S., and Hoegh-Guldberg, O. (2008). Ocean acidification causes bleaching and productivity loss in coral reef builders. Proc. Natl. Acad. Sci. U.S.A. 105, 17442–17446. doi: 10.1073/pnas.0804478105
Atkinson, M. J., and Falter, J. L. (2003). “Coral reefs,” in Biogeochemistry of Marine Systems, eds K. Black and G. Shimmield (Boca Raton, FL: CRC Press), 44–64.
Atkinson, M. J., and Grigg, R. W. (1984). Model of a coral reef ecosystem. Coral Reefs 3, 13–22. doi: 10.1007/BF00306136
Bates, N. R., Amat, A., and Andersson, A. J. (2010). Feedbacks and responses of coral calcification on the Bermuda reef system to seasonal changes in biological processes and ocean acidification. Biogeosciences 7, 2509–2530. doi: 10.5194/bg-7-2509-2010
Bednarz, V. N., Naumann, M. S., Cardini, U., van Hoytema, N., Rix, L., Al-Rshaidat, M. M. D., et al. (2018). Contrasting seasonal responses in dinitrogen fixation between shallow and deep-water colonies of the model coral Stylophora pistillata in the northern Red Sea. PLoS One 13:e0199022. doi: 10.1371/journal.pone.0199022
Beer, S., Ilan, M., Eshel, A., Weil, A., and Brickner, I. (1998). Use of pulse amplitude modulated (PAM) fluorometry for in situ measurements of photosynthesis in two Red Sea faviid corals. Mar. Biol. 131, 607–612. doi: 10.1007/s002270050352
Bolden, I. W., Sachs, J. P., and Gagnon, A. C. (2019). Temporally-variable productivity quotients on a coral atoll: implications for estimates of reef metabolism. Mar. Chem. 217:103707. doi: 10.1016/j.marchem.2019.103707
Borell, E. M., and Bischof, K. (2008). Feeding sustains photosynthetic quantum yield of a Scleractinian coral during thermal stress. Oecologia 157, 593–601. doi: 10.1007/s00442-008-1102-2
Brierley, A. S., and Kingsford, M. J. (2009). Impacts of climate change on marine organisms and ecosystems. Curr. Biol. 19, 602–614. doi: 10.1016/j.cub.2009.05.046
Camp, E. F., Krause, S.-L., Santos, L. M. F., Naumann, M. S., Kikuchi, R. K. P., Smith, D. J., et al. (2015). The “Flexi-Chamber”: a novel cost-effective in situ respirometry chamber for coral physiological measurements. PLoS One 10:e0138800. doi: 10.1371/journal.pone.0138800
Ciais, P., Sabine, C., Bala, G., Bopp, L., Brovkin, V., Canadell, J., et al. (2013). “Carbon and other biogeochemical cycles,” in Climate Change: The Physical Science Basis. Contribution of Working Group I to the Fifth Assessment Report of the Intergovernmental Panel on Climate Change, eds T. F. Stocker, D. Qin, G.-K. Plattner, M. Tignor, S. K. Allen, J. Boschung, et al. (Cambridge, MA: Cambridge University Press), 106.
Cohen, A. L., and Holcomb, M. (2009). Why corals care about ocean acidification: uncovering the mechanism. Oceanography 22, 118–127. doi: 10.5670/oceanog.2009.102
Cohen, A. L., and McConnaughey, T. A. (2003). “Geochemical perspectives on coral mineralization,” in Biomineralization, eds P. M. Dove, S. Weiner, S. Weiner, and J. J. deYoreo (Chantilly: The Mineralogical Society of America), 151–187. doi: 10.1515/9781501509346-011
Cohen, I., Dubinsky, Z., and Erez, J. (2016). Light enhanced calcification in hermatypic corals: new insights from light spectral responses. Front. Mar. Sci. 2:122. doi: 10.3389/fmars.2015.00122
Coles, S. L., and Brown, B. E. (2003). Coral bleaching – capacity for acclimatization and adaptation. Adv. Mar. Biol. 46, 183–223. doi: 10.1016/S0065-2881(03)46004-5
Coles, S. L., and Jokiel, P. L. (1977). Effects of temperature on photosynthesis and respiration in hermatypic corals. Mar. Biol. 43, 209–2016. doi: 10.1007/BF00402313
Courtney, T. A., De Carlo, E. H., Page, H. N., Bahr, K. D., Barro, A., Howins, N., et al. (2018). Recovery of reef-scale calcification following a bleaching event in Kâne’ohe Bay. Hawai’i. Limnol. Oceanogr. 3, 1–9. doi: 10.1002/lol2.10056
Cyronak, T., Andersson, A. J., Langdon, C., Albright, R., Bates, N. R.\, Caldeira, K., et al. (2018). Taking the metabolic pulse of the world’s coral reefs. PLoS ONE 13:e0190872. doi: 10.1371/journal.pone.0190872
Darling, E. S., Alvarez-Filip, L., Oliver, T. A., McClanahan, T. R., and Coté, I. M. (2012). Evaluating life history strategies of reef corals from species traits. Ecol. Lett. 15, 1378–1386. doi: 10.1111/j.1461-0248.2012.01861.x
Dellisanti, W., Tsang, R. H. L., Ang, P. Jr., Wu, J., Wells, M. L., and Chan, L. L. (2020). Metabolic performance and thermal and salinity tolerance of the coral Platygyra carnosa in Hong Kong waters. Mar. Poll. Bull. 153:111005. doi: 10.1016/j.marpolbul.2020.111005
Dickson, A. G. (1990). Standard potential of the reaction: AgCl(s) + 12H2(g) = Ag(s) + HCl(aq), and and the standard acidity constant of the ion HSO4- in synthetic sea water from 273.15 to 318.15 K. J. Chem. Thermodyn. 22, 113–127. doi: 10.1016/0021-9614(90)90074-Z
Dickson, A. G., Sabine, C. L., and Christian, J. R. (2007). Guide to Best Practices for Ocean CO2 Measurement. Sidney: North Pacific Marine Science Organization.
Donner, S. D., Rickbeil, G. J. M., and Heron, S. F. (2017). A new, high-resolution global mass coral bleaching database. PLoS One 12:e0175490. doi: 10.1371/journal.pone.0175490
Duprey, N. N., McIlroy, S. E., Ng, T. P. T., Thompson, P. D., Kim, T., Wong, J. C. Y., et al. (2017). Facing a wicked problem with optimism: issues and priorities for coral conservation in Hong Kong. Biodivers. Conserv. 26, 2521–2545. doi: 10.1007/s10531-017-1383-z
Falini, G., Fermani, S., and Goffredo, S. (2015). Coral biomineralization: a focus on intra-skeletal organic matrix and calcification. Semin. Cell. Dev. Biol. 46, 17–26. doi: 10.1016/j.semcdb.2015.09.005
Falkowski, P. G., Dubinsky, Z., Muscatine, L., and Porter, J. W. (1984). Light and the bioenergetics of a symbiotic coral. Bioscience 34, 705–709. doi: 10.2307/1309663
Falter, J. L., Lowe, R. J., Atkinson, M. J., and Cuet, P. (2012). Seasonal coupling and de-coupling of net calcification rates from coral reef metabolism and carbonate chemistry at Ningaloo Reef, Western Australia. J. Geophys. Res. 117:C05003. doi: 10.1029/2011JC007268
Fitt, W. K., Brown, B. E., Warner, M. E., and Dunne, R. P. (2001). Coral bleaching: interpretation of thermal tolerance limits and thermal thresholds in tropical corals. Coral Reefs 20, 51–65. doi: 10.1007/s003380100146
Gardella, D. J., and Edmunds, P. J. (1999). The oxygen microenvironment adjacent to the tissue of the scleractinian Dichocoenia stokesii and its effects on symbiont metabolism. Mar. Biol. 135, 289–295. doi: 10.1007/s002270050626
Gattuso, J.-P., and Jaubert, J. (1990). Effect of light on oxygen and carbon dioxide fluxes and on metabolic quotients measured in situ in a zooxanthellate coral. Limnol. Oceanogr. 35, 1796–1804. doi: 10.4319/lo.1990.35.8.1796
Gattuso, J.-P., Frankignoulle, M., and Smith, S. V. (1999). Measurement of community metabolism and significance in the coral reef CO2 source-sink debate. PNAS 96, 1317–1322. doi: 10.1073/pnas.96.23.13017
Gruber, N. (2011). Warming up, turning sour, losing breath: ocean biogeochemistry under global change. Philos. T. R. Soc. A 369, 1980–1996. doi: 10.1098/rsta.2011.0003
Hawkins, T. D., Hagemeyer, J. C. G., Hoadley, K. D., Marsh, A. G., and Warner, M. E. (2016). Partitioning of respiration in an animal-algal symbiosis: implication for different aerobic capacity between Symbiodinium spp. Front. Physiol. 7:128. doi: 10.3389/fphys.2016.00128
Heery, E. C., Hoeksema, B. W., Browne, N. K., Reimer, J. D., Ang, P. O., Huang, D., et al. (2018). Urban coral reefs: degradation and resilience of hard coral assemblages in coastal cities of East and Southeast Asia. Mar. Poll. Bull. 135, 654–681. doi: 10.1016/j.marpolbul.2018.07.041
Hoegh-Guldberg, O., Mumby, P. J., Hooten, A. J., Steneck, R. S., Greenfield, P., Gomez, E., et al. (2007). Coral reefs under rapid climate change and ocean acidification. Science 318, 1737–1742. doi: 10.1126/science.1152509
Hoegh-Guldberg, O., Poloczanska, E. S., Skirving, W., and Dove, S. (2017). Coral reef ecosystems under climate change and ocean acidification. Front. Mar. Sci. 4:158. doi: 10.3389/fmars.2017.00158
Hughes, T. P., Kerry, J., Alvarez-Noriega, M., Álvarez-Romero, J. G., Anderson, K. D., Baird, A. H., et al. (2017). Global warming and recurrent mass bleaching of corals. Nature 543, 373–377. doi: 10.1038/nature21707
Jimenez, I. M., Kuhl, M., Larkum, A. W. D., and Ralph, P. J. (2011). Effects of flow and colony morphology on the thermal boundary layer of corals. J. R. Soc. Interface 8, 1785–1795. doi: 10.1098/rsif.2011.0144
Kuffner, L. B., Lidz, B. H., Hudson, J. H., and Anderson, J. S. (2015). A century of ocean warming on Florida Keys coral reefs: historic in situ observation. Estuar. Coasts 38, 1085–1096. doi: 10.1007/s12237-014-9875-5
Kuhl, M., Cohen, Y., Dalsgaard, T., Jorgensen, B. B., and Revsbech, N. P. (1995). Microenvironment and photosynthesis of zooxanthellae in scleractinian corals studied with microsensors for O2, pH and light. Mar. Ecol. Prog. Ser. 117, 159–172. doi: 10.3354/meps117159
Larkum, A. W. D., Koch, E. M., and Kuhl, M. (2003). Diffusive boundary layers and photosynthesis of the epilithic algal community of coral reefs. Mar. Biol. 142, 1073–1082. doi: 10.1007/s00227-003-1022-y
Leuker, T. J., Dickson, A. G., and Keeling, C. D. (2000). Ocean pCO2 calculated from dissolved inorganic carbon, alkalinity, and equations for K1 and K2: validation based on laboratory measurements of CO2 in gas and seawater at equilibrium. Mar. Chem. 70, 105–119. doi: 10.1016/S0304-4203(00)00022-0
Levy, O., Dubinsky, Z., Schneider, K., Achituv, Y., Zakai, D., and Gorbunov, M. Y. (2004). Diurnal hysteresis in coral photosynthesis. Mar. Ecol. Prog. Ser. 268, 105–117. doi: 10.3354/meps268105
Long, M. H., Berg, P., de Beer, D., and Zieman, J. (2013). In situ coral reef oxygen metabolism: an eddy correlation study. PLoS One 8:e0058581. doi: 10.1371/journal.pone.0058581
Martz, T. R., Connery, J. R., and Johnson, K. S. (2010). Testing the Honeywell Durafet for seawater pH applications. Limnol. Oceanogr. 8, 172–184. doi: 10.4319/lom.2010.8.172
McCulloch, M., Falter, J., Trotter, J., and Montagna, P. (2012). Coral resilience to ocean acidification and global warming through pH up-regulation. Nat. Clim. Change 2:1473. doi: 10.1038/nclimate1473
McIlroy, S. E., Thompson, P. D., Yuan, F. L., Bonebrake, T. C., and Baker, D. M. (2019). Subtropical thermal variation supports persistence of corals but limits productivity of coral reefs. Proc. R. Soc. B Biol. Sci. 286:20190882. doi: 10.1098/rspb.2019.0882
McMahon, A., Santos, I. R., Schulz, K. G., Cyronak, T., and Maher, D. T. (2018). Determining coral reef calcification and primary production using automated alkalinity, pH and pCO2 measurements at high temporal resolution. Estuar. Coast. Mar. Sci. 209, 80–88. doi: 10.1016/j.ecss.2018.04.041
Murphy, B. A., Mazel, C. H., Whitehead, R., and Szmant, A. M. (2012). “CISME: a self-contained diver portable metabolism and energetics system,” in Proceedings of the Oceans, Hampton Roads, VA, 1–7. doi: 10.1109/OCEANS.2012.6405075
Murphy, J. W. A., and Richmond, R. H. (2016). Changes to coral health and metabolic activity under oxygen deprivation. PeerJ 4:e1956. doi: 10.7717/peerj.1956
Muscatine, L., McCloskey, L. R., and Marian, R. E. (1981). Estimating the daily contribution of carbon from zooxanthellae to coral animal respiration. Limnol. Oceanogr. 26, 601–611. doi: 10.4319/lo.1981.26.4.0601
Nelson, H. R., and Altieri, A. H. (2019). Oxygen: the universal currency on coral reefs. Coral Reefs 38, 177–198. doi: 10.1007/s00338-019-01765-0
Nothdurft, L. D., and Webb, G. E. (2009). Clypeotheca, a new skeletal structure in scleractinian corals: a potential stress indicator. Coral Reefs 28, 143–153. doi: 10.1007/s00338-008-0439-7
Pandolfi, J. M., Connolly, S. R., Marshall, D. J., and Cohen, A. (2011). Projecting coral reef futures under global warming and ocean acidification. Science 333, 418–422. doi: 10.1126/science.1204794
Perez, F. F., and Fraga, F. (1987). Association constant of fluoride and hydrogen ions in seawater. Mar. Chem. 21, 161–168. doi: 10.1016/0304-4203(87)90036-3
Pierrot, D., Lewis, E., and Wallace, D. W. R. (2006). MS Excel Program Developed for CO2 System Calculations. ORNL/CDIAC-105a. Oak Ridge: Carbon Dioxide Information Analysis Center.
Ralph, P., Gademann, R., Larkum, A. W. D., and Schreiber, U. (1999). In situ underwater measurement of photosynthetic activity of coral zooxanthellae and other reef-dwelling dinoflagellate endosymbionts. Mar. Ecol. Prog. Ser. 180, 139–147. doi: 10.3354/meps180139
Reggi, M., Fermani, S., Levy, O., Dubinsky, Z., Goffredo, S., and Falini, G. (2016). “Influences of coral intra-skeletal organic matrix on calcium carbonate precipitation,” in The Cnidaria, Past, Present and Future, eds S. Goffredo and Z. Dubinsky (Cham: Springer), 207–222. doi: 10.1007/978-3-319-31305-4_13
Riebesell, U., Fabry, V. J., Hansson, L., and Gattuso, J.-P. (2011). Guide to Best Practices for Ocean Acidification Research and Data Reporting. Brussels: Publications Office of the European Union.
Rinkevich, B. (1995). Restoration strategies for coral reefs damaged by recreational activities: the use of sexual and asexual recruits. Restor. Ecol. 3, 241–251. doi: 10.1111/j.1526-100X.1995.tb00091.x
Sawall, Y., and Hochberg, E. J. (2018). Diel versus time-integrated (daily) photosynthesis and irradiance relationship of coral reef organisms and communities. PLoS One 13:e0208607. doi: 10.137/journal.pone.0208607
Schneider, K., Levy, O., Dubinsky, Z., and Erez, J. (2009). In situ diel cycles of photosynthesis and calcification in hermatypic corals. Limnol. Oceanogr. 54, 1995–2002. doi: 10.4319/lo.2009.54.6.1995
Schoepf, V., Hu, X., Holcomb, M., Cai, W.-J., Li, Q., Wang, Y., et al. (2017). Coral calcification under environmental change: a direct comparison of the alkalinity anomaly and buoyant weight techniques. Coral Reefs 36, 13–25. doi: 10.1007/s00338-016-1507-z
Schrameyer, V., Wangpraseurt, D., Hill, R., Kuhl, M., Larkum, A. W. D., and Ralph, P. J. (2014). Light respiratory processes and gross photosynthesis in two scleractinian corals. PLoS One 9:e110814. doi: 10.1371/journal.pone.0110814
Shashar, N., Cohen, Y., and Loya, Y. (1993). Extreme diel fluctuations of oxygen in diffusive boundary layers surrounding stony corals. Biol. Bull. 185, 455–461. doi: 10.2307/1542485
Taddei, D., Cuet, P., Frouin, P., Esbelin, C., and Clavier, J. (2008). Low community photosynthetic quotient in coral reef sediments. Comptes Rendus Biol. 331, 668–677. doi: 10.1016/j.crvi.2008.06.006
Takeshita, Y., Cyronak, T., Martz, T. R., Kindeberg, T., and Andersson, A. J. (2018). Coral reef carbonate chemistry variability at different functional scales. Front. Mar. Sci. 5:175. doi: 10.3389/fmars.2018.00175
Takeshita, Y., McGillis, W., Briggs, E. M., Carter, A. L., Donham, E. M., Martz, T. R., et al. (2016). Assessment of net community production and calcification of a coral reef using a boundary layer approach. J. Geophys. Res. Oceans 121, 5655–5671. doi: 10.1002/2016JC011886
van Oppen, M. J. H., Gates, R. D., Blackall, L. L., Cantin, N., Chakravarti, L. K., Chan, W. Y., et al. (2017). Shifting paradigms in restoration of the world’s coral reefs. Glob. Change Biol. 23, 3437–3448. doi: 10.1111/gcb.13647
Venn, A., Tambutté, E., Holcomb, M., Allemand, D., and Tambutté, S. (2011). Live tissue imaging shows reef corals elevate pH under their calcifying tissue relative to seawater. PLoS One 6:e20013. doi: 10.1371/journal.pone.0020013
Wangpraseurt, D., Polerecky, L., Larkum, A. W. D., Ralph, P. J., Nielsen, D. A., Pernice, M., et al. (2014). The in-situ light microenvironment of corals. Limnol. Oceanol. 59, 917–926. doi: 10.4319/lo.2014.59.3.0917
Weber, M., Faerber, P., Meyer, V., Lott, C., and Eickert, G. (2007). In situ applications of a new diver-operated motorized microsensor profiler. Environ. Sci. Technol. 41, 6210–6215. doi: 10.1021/es070200b
Wong, K. T., Chui, A. P. Y., Lam, E. K. Y., and Ang, P. Jr. (2018). A 30-year monitoring of changes in coral community structure following anthropogenic disturbances in Tolo Harbour and Channel, Hong Kong. Mar. Poll. Bull. 133, 900–910. doi: 10.1016/j.marpolbul.2018.06.049
Keywords: coral monitoring, coral physiology, underwater, non-invasive, holobiont
Citation: Dellisanti W, Tsang RHL, Ang P Jr, Wu J, Wells ML and Chan LL (2020) A Diver-Portable Respirometry System for in-situ Short-Term Measurements of Coral Metabolic Health and Rates of Calcification. Front. Mar. Sci. 7:571451. doi: 10.3389/fmars.2020.571451
Received: 10 June 2020; Accepted: 14 October 2020;
Published: 12 November 2020.
Edited by:
Massimo Ponti, University of Bologna, ItalyReviewed by:
Arjun Chennu, Leibniz Centre for Tropical Marine Research (LG), GermanyChristian Lott, HYDRA Marine Sciences, Germany
Copyright © 2020 Dellisanti, Tsang, Ang, Wu, Wells and Chan. This is an open-access article distributed under the terms of the Creative Commons Attribution License (CC BY). The use, distribution or reproduction in other forums is permitted, provided the original author(s) and the copyright owner(s) are credited and that the original publication in this journal is cited, in accordance with accepted academic practice. No use, distribution or reproduction is permitted which does not comply with these terms.
*Correspondence: Mark L. Wells, mlwells@maine.edu; Leo L. Chan, leochan@cityu.edu.hk