Characterization of the Viscoelastic Properties of Ovarian Cancer Cells Membranes by Optical Tweezers and Quantitative Phase Imaging
 Thompson Lu
 Bahman Anvari
- Department of Bioengineering, University of California, Riverside, Riverside, CA, United States
Ovarian cancer is the deadliest gynecological cancer in women. It is a highly metastatic disease with pelvis, regional lymph nodes, and peritoneal cavity as major sites for tumor deposits. Mechanical properties of ovarian cancer cells can play a major role in metastasis as the cells detach from the ovaries and undergo deformation during the metastatic process. Herein, we have characterized the viscoelastic properties of the plasma membrane of normal epithelial (IOSE364) and cancerous (SKOV3) ovarian cells by optical tweezers and quantitative phase imaging. Using optical tweezers, we obtained time-resolved force profiles associated with membrane tethers pulled from the cells. We used quantitative phase imaging to measure the diameter of membrane tethers, and subsequently, estimated the membrane bending modulus and membrane tension in the tether. Our results indicate that the force (190 ± 76 pN) (mean ± standard deviation) required to separate the membrane of SKOV3 cells from the cytoskeleton was significantly lower (p = 0.0004) than the force (350 ± 81 pN) for IOSE364 cells. The mean stiffness (2.8 ± 0.8 pN/μm) of membrane tethers pulled from SKOV3 cells was significantly lower (p = 0.032) than the value for IOSE 364 cells (3.7 ± 0.8 pN/μm). Mean value of the force relaxation characteristic time associated with diffusive flow of lipids was also significantly lower (p = 0.018) for SKOV3 membranes (12.9 ± 6.9 s) as compared to the value for IOSE 364 membranes (20.4 ± 6.2 s). Similarly, the mean value of the membrane bending modulus for SKOV3 cells [(0.51 ± 0.23) × 10–18 J] was significantly lower (p = 0.007) than the value for IOSE364 cells [(1.29 ± 0.32) × 10–18 J]. Overall, our results suggest that the membranes of SKOV3 cells are less resistant to mechanical deformation. Increased membrane susceptibility to mechanical deformation may be a facilitating factor in the metastatic behavior of cancerous ovarian cells. Characterization of membrane biomechanics may provide a useful diagnostic biomarker for assessment of the metastatic potential of ovarian cancer, and a target for development of therapeutics.
Introduction
Ovarian cancer is one of the deadliest cancers in women with estimated 22,000 new cases and approximately 14,1000 deaths in 2020 [1]. Only about 20% of cases are diagnosed at stage I where the disease is confined to the ovaries. Once the disease spreads into the pelvis (stage II), and metastasizes to other parts of the abdomen and/or regional lymph nodes (stage III), the chance of patient survival diminishes to about 35% [2]. Therefore, metastasis is a key determinant in survivability of patients with ovarian cancer.
Passive dissemination and hematogenous metastasis are considered as the main mechanisms for ovarian cancer metastasis [3]. In passive dissemination, cancer cells detach from the ovaries, and are carried by peritoneal fluid and ascites, reaching the pelvis and peritoneal cavity [4, 5]. In hematogenous metastasis, ovarian cancer cells at the primary site invade through the basal membrane of the blood or lymphatic vessels to intravasate into the circulation. Cancer cells then extravasate out of the circulation at the metastatic site [3]. Under either of the two mechanisms, the mechanical properties of the cell are the key determinants of its deformability during the detachment, intravasation, and extravasation processes that ultimately result in metastasis.
Utilizing various techniques such as the optical stretcher, atomic force microscopy (AFM), shear assays, and magnetic tweezers, the invasiveness of metastatic cancer cells has been demonstrated to correlate with their viscoelastic properties [6–11]. For example, using a shear assay technique, Hu et al. found that the stiffness of MCF-10A normal breast cells was about 10 times higher than that the stiffness of the highly metastatic MDA-MB-231 breast cancer cells, and attributed these differences to differences in the levels of actin expression and organization [11].
While the role of the cytoskeleton, and particularly actin, in relation to the mechanical characteristics of ovarian and other cancerous cells have been extensively studies [12–15], changes in the mechanical properties of the membrane of ovarian cells as they transition from normal to becoming malignant has been less studied. In this study, we have utilized optical tweezers in combination with quantitative phase imaging (QPI) to characterize the mechanical properties of the membranes of cancerous and normal ovarian cells. Specifically, optical tweezers were used to obtain dynamic force profiles associated with membrane tethers pulled from these cells. By fitting the relaxation phase of the force profiles with biphasic exponential functions, the viscoelastic properties of the cell membrane could be quantified. We used QPI to estimate the diameter of the membrane tethers pulled from these cells, and subsequently used this information to quantify the bending modulus and membrane tension associated with these tethers. We found that there were statistically significant differences in some of the viscoelastic properties of the membranes of ovarian cancerous cells as compared to those for normal ovarian cells. Our findings suggest that membrane biomechanics may provide a useful diagnostic biomarker for assessment of the metastatic potential of ovarian cancer, and a target for development of therapeutics.
Materials and Methods
Optical Tweezers and Quantitative Phase Imaging Setup
The instrumentation platform combining optical tweezers and QPI is reported in our previous publication [16], and shown in Figure 1. An optical trap was formed using a 1,064 nm Nd:YVO4 (Coherent, Prisma-1064-8-V). The laser beam was expanded and collimated before entering an inverted microscope (Nikon, Ti-Eclipse) to fill the back aperture of a 1.3 NA ×100 oil immersion objective (MO) (Nikon, 100x Plan Fluor) lens. A dichroic mirror (DM) (Chroma, Z900DCSP) was used to reflect the laser light into the MO, which focused the light to form an optical trap.
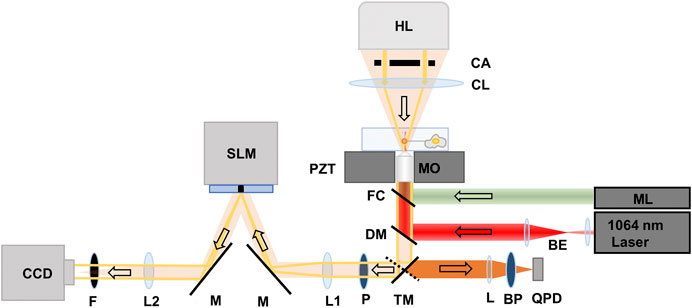
FIGURE 1. Schematic of the instrumentation platform consisting of optical tweezers and quantitative phase imaging system. BE: Beam expander, BS: Beam splitter, ML: Mercury lamp, TM: Mirror on a turret, L: focusing lens (f = 25 mm), BP: bandpass filter, QPD: Quadrant photodiode, DM: Dichroic mirror, FC: Filter cube, MO: Microscope objective, PZT: Piezo-electric translation stage, CL: Condenser lens, CA: Condenser annulus, HL: Halogen lamp, P: polarizer, M: Mirror, SLM: Spatial light modulator, L1 and L2: achromatic doublets (f = 500 mm), F: IR Filter, CCD: Charge-coupled detector camera. The arrows point to the direction of light propagation.
Fluorescent 4.2 µm diameter sulfate-modified polystyrene beads (Thermofisher, F8858) were trapped, and used as handles to extract tethers from the cells, and as probes for measuring the resulting force profiles. The beads have an excitation spectrum between 480 and 590 nm. Excitation light from a mercury lamp (ML) (Nikon Intenslight, C-HGFI) passed through a filter cube (FC) (Nikon, TRITC TE 2000) that transmitted the light in the range of 525–560 nm to illuminate the trapped bead and passed emitted fluorescent light from the bead in the range of 570–620 nm. Fluorescence emission from the bead was passed through the DM and a mirror on a directional turret that directed the bead fluorescence to a quadrant photodetector (QPD) (First Sensor, QP1-6-T05-SD2). The emitted light was focused by a lens (L) (f = 25 mm) and filtered by a bandpass filter (BP) (Chroma, 605 ± 25 nm) before reaching the QPD.
We used fluorescent beads to overcome an artifact in the force measurements due to the presence of the cell when it is in close proximity to the bead (<0.5 µm apart from each other). Specifically, shadow of the cell projected onto the photodetector induces an artifact in the force measurement that can be as high as 75 pN [17]. When using fluorescent beads, the optical signal for force measurement is only transmitted by the bead and does not include a contribution form the cell. Hence, we used the fluorescence image projected onto the QPD as the signal to quantify the bead displacement from the trapping center during tether pulling experiments.
To calibrate the output voltage of the QPD for force measurements, a drag force with known value based on Stokes’ Law, was applied to the trapped bead while recording the resulting differential signal (sum-and-difference output voltage in mV) from the QPD. The drag force was generated by driving a piezoelectric translation-stage (Physik Instrumente, Model P-527.C3, Waldbronn, Germany) at known velocities. The resolution of the piezoelectric stage was 10 nm in x and y directions, and 2 nm in z directions (laser beam propagation direction). There was a linear relationship between the applied drag force and the QPD differential output voltage (Supplementary Figure S1).
The relationship between the bead displacement and QPD signal was determined by moving a bead immobilized on a poly-d-lysine coated coverslip at known displacements with the piezoelectric translation-stage while recording the QPD differential voltage signal. There was a linear relationship between bead QPD output signal and the bead displacement (Supplementary Figure S2). The differential output voltage from the QPD amplifier was digitized using an analog-to-digital converter (BNC2110, National Instruments, Austin, TX) and subsequently, recorded by LabVIEW software (LabVIEW 7, National Instruments, Austin, TX). Data collection frequency was 2,500 Hz. In our tether pulling experiments, approximately 400 mW of laser was delivered to the sample plane. As determined by the product of the slopes of the two calibration curves (Supplementary Figures S1,S2), this power corresponds to trap stiffness of 227 pN/μm.
For QPI, samples were illuminated from a 100 W halogen lamp source through a condenser annulus and a condenser lens. We used the same 100× oil immersion objective for both optical trapping and QPI. Un-scattered light through the sample formed an image of the condenser annulus at the focal plane of lens L1 (f = 500 mm), on a reflective spatial light modulator (SLM) (Hamamatsu LCOS-SLM X-10468). The SLM was used to introduce four phase shifts in π/2 increments to the un-scattered light. The same directional mirror used to direct fluorescence emission from the bead to the QPD was used to send light to the SLM system.
The image of the un-scattered light interfering with the scattered light through the sample was focused onto an electron-multiplying charge-coupled device (EM-CCD) (C9100-13, Hamamatsu) by a lens L2 (f = 500 mm). An IR filter (F) was placed in front of the EM-CCD to filter the extraneous 1,064 nm light from the optical trap. To accommodate full re-arrangement of the nematic liquid crystals in the SLM, field delays of 83 ms (SLM response time for π/2 modulation) were used between the phase modulations. We acquired 12 phase shifted images every second to yield quantitative phase resolved images at 3 frames per second.
Using the four different intensity images,
We obtained phase maps as:
where β is the ratio of the amplitude of the scattered to un-scattered light [16, 18].
The QPI system was calibrated using 400 and 630 nm polystyrene beads, with index of refraction npolystyrene = 1.59 in air, seeded on glass bottom dishes [16]. The EM-CCD was calibrated with a 10 µm spacing ruler, and the pixel size was determined as 150 nm/pixel. The spatial noise of the QPI system was determined by measuring the standard deviation of phase from background of the sample plane, and estimated as ∼ 0.02 rad. We estimated the tether diameter (dtether) at the end of force relaxation as [16]:
where λ is the center excitation wavelength of the lamp (595 nm),
Cell Culture
We used SKOV3 and IOSE364 as the respective cancerous and normal epithelial ovarian cell lines. The SKOV3 (ATCC) cell line was grown in T-25 tissue culture flasks containing Rosewell Park Memorial Institute (RPMI 1640) supplemented with 10% fetal bovine serum (FBS) and 1% antibiotic-antimycotic. The IOSE364 (Canadian Ovarian Tissue Bank) cell line was grown in T-25 culture flasks with 50/50 by volume mixture of MCDB105 and 199 media containing 10% FBS and 1% gentamycin. Both cell lines were incubated in an air jacked incubator at 37°C with 5% CO2. At 80–90% confluency, the cells were passaged onto poly-d-lysine coated glass bottom dishes (MatTek P35GC-1.0-14C). Experiments were performed on cells passaged onto the glass bottom dishes after 24 h incubation. Prior to placing the cells into the setup, they were washed with isotonic phosphate buffer saline (PBS) and the medium was replaced with their respective cell media (RPMI for SKOV3, MCDB105/199 for IOSE364) without FBS, and containing the fluorescent sulfate-modified polystyrene beads.
Tether Extraction Protocol
Adherent, non-round cells with a long axis diameter of ∼20 µm were selected for tether pulling to ensure that healthy cells were being investigated. An optically trapped bead was brought to a cell of interest using the piezo-translation stage. Cell-bead attachment was determined by a displacement of the bead from the center of the optical tweezers, as indicated by the change in voltage from the output of the QPD. After about 30 s of bead-cell attachment, the cell was displaced away from the bead at velocity 1 μm/s for 20 µm. Pulling was stopped at that time, allowing for force relaxation to equilibrium. Time-resolved force profiles were recorded throughout the tether formation and relaxation processes. For analysis of the force profiles, we pulled 8 tethers from 8 different IOSE364 cells, and 15 tethers from 15 different SKOV3 cells (i.e., one tether per cell).
Data Analysis
Force relaxation profiles were fitted with biphasic exponential function:
where Feq is the tether force at the end of relaxation, and τshort and τlong are two characteristic times associated with the tether force relaxation dynamics. The shorter characteristic time (τshort) represents the Marangoni convective flow of lipids from a region of low membrane tension to region of high membrane tension [20, 21]. The longer characteristic time (τlong) is attributed to the diffusive flow of the lipids [22, 23]. The biphasic function is consistent with the solution to a second order generalized Kelvin model of force relaxation [24], and has been used in fitting the relaxation profiles [22, 23]. We estimated Feq by averaging the force during the last 10 s of the force relaxation profile.
Using Feq, we estimated the tether stiffness (ktether) as:
where L′ is the length of the tether at the end of elongation (∼20 µm) and dL is the increase in the tether length during relaxation (estimated to be 0.197 ± 0.07 µm for IOSE364 and 0.215 ± 0.1 µm for SKOV3).
Results for various physical properties are reported in box-and-whisker plots. The bottom line of the box represents the 25th quartile, and the top line represents the 75th quartile of the data. Median values of each quantity are indicated by the horizontal lines within each box. Mean values are indicated by the square in the center of the box and whisker plot. The whiskers show the range of measured values. We used two-tailed Student’s t-test with unequal variance in our statistical analysis of the various parameters.
Results and Discussion
A video of a tether pulling process from an SKOV3 cells is provided in Supplementary Video S1. Illustrative force profiles associated with tethers pulled from IOSE346 and SKOV3 cells, and the corresponding biphasic exponential fits to force relaxations are presented in Figure 2. Both normal and cancerous ovarian cells exhibit similar profiles. These profiles are also consistent with those associated with tethers pulled from other cell types, including guinea pig outer hair cells (OHCs) [25], human embryonic kidney (HEK) cells [22], and mouse microglial cells [26]. Prior to the start of pulling, the force is negative due to cell pushing the bead in the opposite direction to that of the stage movement. Once pulling starts, the force steeply increases until reaching a maximum value (Fmax), followed by a sudden reduction from Fmax, consistent with other studies [22, 27–29]. Subsequently, the force is increased as the tether is elongated. When pulling stops, force relaxation to equilibrium takes place.
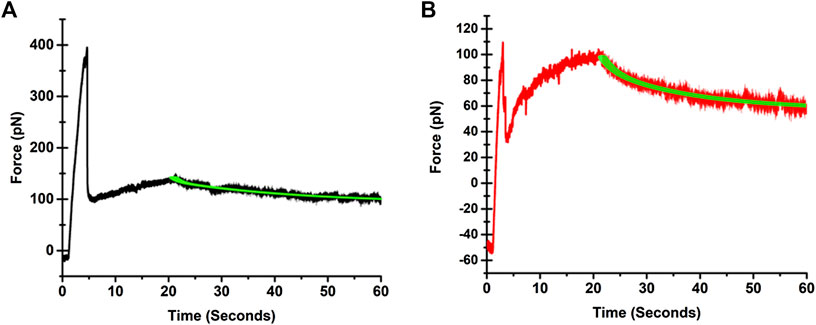
FIGURE 2. Illustrative force profiles associated with tethers pulled from (A) IOSE364, and (B) SKOV3 cells. The black trace for the IOSE364 cell, and the red trace for the SKOV3 cell are the measured force profiles. The biphasic exponential fits to the force relaxation measurements are shown by the green traces. The expressions for the fits are
Our pulling velocity of 1 μm/s is at the lower end of what is reported as the intermediate velocity range (1–100 μm/s), or the permeation regime [30]. Velocities lower than the permeation regime (e.g., 0.01 μm/s) are associated with the spontaneous dissociation velocity of membrane-cytoskeleton binders. At such ultra-low pulling velocities, the cell membrane composed of lipids and integral proteins behave as an ultra-viscous sheet. At ultra-high velocities above the permeation regime (>100 µm), the binders are indicated to be torn out [30].
The mean ± standard deviation (SD) values of Fmax for tethers pulled from IOSE364 and SKOV3 were 350 ± 81 pN and 190 ± 76 pN, respectively (Figure 3A). Value of Fmax is associated with the enregetic processes to bend the cell membrane, surmount the membrane-cytoskeleton adhesion (W0), and overcome the viscous resistance as the pulling process begins. The statistically signficant (p = 0.0004) reduction in the mean value of Fmax for SKOV3 cells suggests that the net sum of these energetics is lowered for SKOV3 cells. Following results and discussion provide further insight into these energetics.
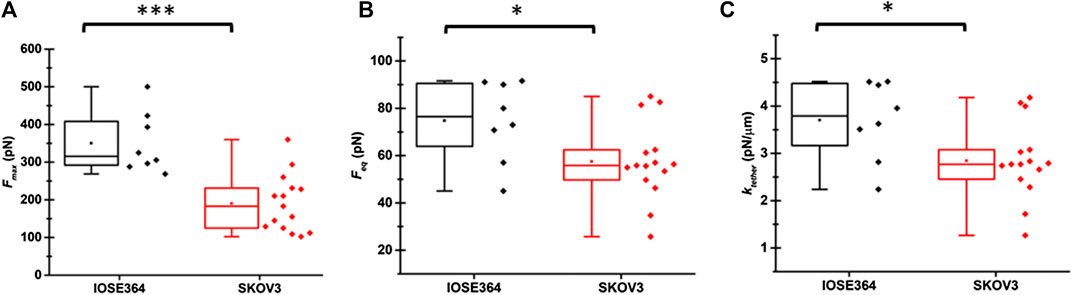
FIGURE 3. Box-and-whisker plots of (A)Fmax, (B)Feq, and (C)ktether for tethers pulled from IOSE364 and SKOV3 cells. Individual values of the date are shown by black symbols for IOSE tethers, and red symbols for SKOV3 tethers. Number of tethers were 8 for IOSE364, and 15 for SKOV cells. One tether was pulled from each cell. Asterisks *, and *** indicate statistically significant differences at p < 0.05, and p < 0.001, respectively. The specific values are p = 0.0004 (A), p = 0.034 (B), and p = 0.032 (C).
As the tether is elongated in the permeation regime, the cell body membrane lipids are drawn into the tether as they flow around transmembrane proteins and/or slip against the underlying cytoskeleton. This viscous drag of the lipids gives rise to increased membrane tension in the tether. At the end of tether elongation (i.e., at the onset of force relaxation), the membrane tension in the tether (σtether) is higher than the tension in the membrane of the cell body, a state that drives the lipid transport of the lipids until force relaxation is completed and equilibrium reached. At equilibrium, the net flow of the lipids is zero, and σtether is balanced against the lateral (in-plane) tension in the cell membrane (σcell), and the tension resulting from W0 [30, 31]:
The mean ± standard deviation values of Feq for IOSE364 and SKOV3 cells were 74.8 ± 17.0 and 57.5 ± 16.3 pN, respectively (Figure 3B), and significantly different from each other (p = 0.034). As discussed below, the lower mean value of Feq for SKOV3 is related to σtether and the membrane bending modulus (κ). The mean value of ktether for SKOV3 cells (2.8 ± 0.8 pN/μm) was signficantly lower (p = 0.032) than the mean value for IOSE364 cells (3.7 ± 0.8 pN/μm) (Figure 3C), suggesting that the membrane of SKOV3 was less resistant to elongation.
Statistically, the mean value of τshort for IOSE364 (1.9 ± 1.2 s) and SKOV3 cells (1.6 ± 1.1 s) were not significantly different from each other (Figure 4A). These values are on the same order as those for tethers pulled at 1 μm/s from HEK cells (∼1.2 s) [22], OHCs (∼3.7 s) [24], regardless of manipulating the respective membrane composition of these cells by external agents (cholesterol and chlorpromazine), as well as cytoskeletal-lacking synthetic liposomes (∼2–4 s) [23]. These results suggest that the short characteristic time for the convective flow of the lipids from the cell body (region of low membrane tension) toward the tether (region of high membrane tension), due to the Marangoni effect, has slight dependency on the cell type, membrane composition, and presence of cytoskeleton.
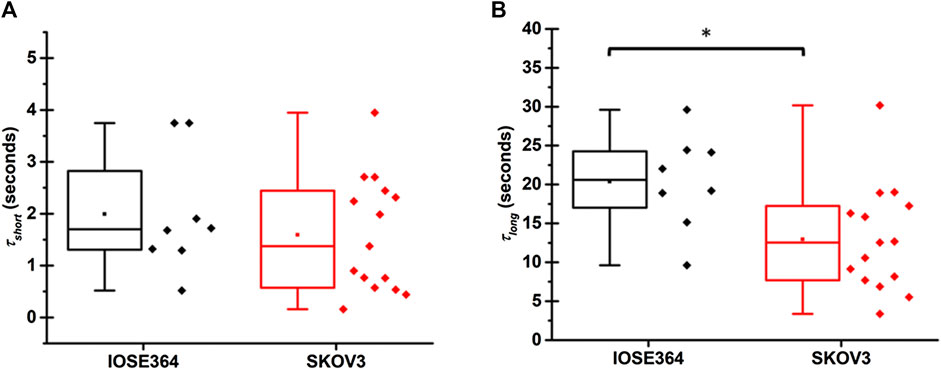
FIGURE 4. Box-and-whisker plots for (A) short (τshort), and (B) long (τlong) characteristic times associated with tethers pulled from IOSE364 and SKOV3 cells. Number of tethers were 8 for IOSE364, and 15 for SKOV cells. Single asterisk * indicates a statistically significant different at p = 0.018.
The mean value of τlong for SKOV3 cells (12.9 ± 6.9 s), however, was significantly shorter (p = 0.018) than the value for IOSE364 cells (20.4 ± 6.2 s). This reduction in τlong for SKOV3 cells is indicative of reduced barriers to the diffusive flow of lipids from the cell body into the tether, suggesting that the architecture of SKOV3 membrane may be altered in ways that reduce the viscous resistance of cytoskeletal-bound membrane proteins and other membrane structures to lipids flow [32].
Brightfield and the corresponding tether images of tethers from IOSE364 and SKOV3 cells obtained by QPI are shown in Figure 5. While tethers under brightfield typically were not visible, QPI provided a capability to visualize the tethers against the surrounding background. Interestingly, QPI revealed tether-like structures protruding from the SKOV3 cell at improved contrast. These protrusions are attributed to filamentous actin (F-actin) polymerization [33–36], and suggestive of the migratory structure and potential capability of these cells to breach basement membranes, and invade tissues and vasculature [37]. Formation of these protrusion is consistent with our finding of reduced membrane stiffness (Figure 3C) for SKOV3, allowing the membrane to more readily extend in response to the forces exerted by F-actin during polymerization [38–40].
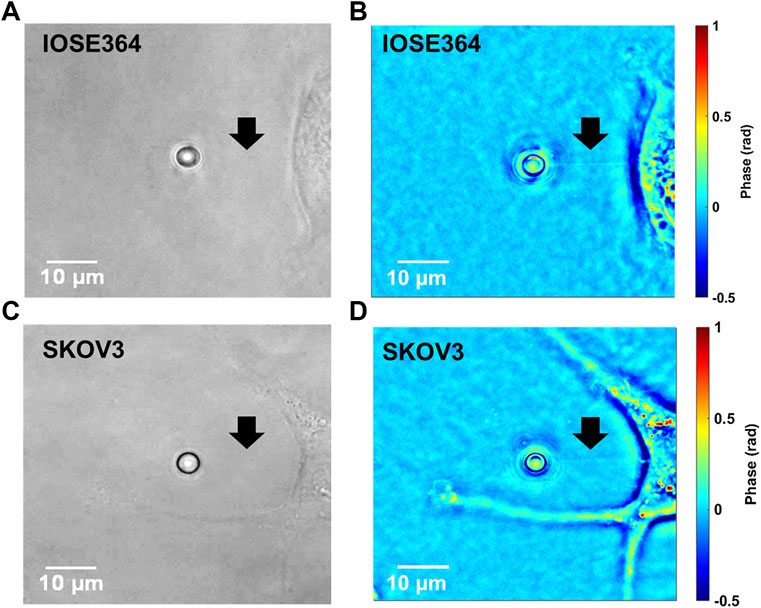
FIGURE 5. Representative images of IOSE364 and SKOV3 cells obtained by (A,C) brightfield microscopy, and (B,D) QPI. Arrows point to tethers, which are not visible under brightfield, but become resolvable by QPI. Membrane protrusions from SKOV3 cells can also be visualized at improved contrast by QPI.
The mean value of dtether for SKOV3 cells (110 ± 45 nm) was significantly smaller (p = 0.010) than that for IOSE364 cells (217 ± 33 nm) (Figure 6A). Using the estimated measurements of dtether, we subsequently estimated κ, a property that allows the membrane bilayer to resist a change in its curvature, and σtether as follows. Assuming that the tether is cylindrically-shaped with length L′, the free energy of the tether (Etether) can be written as [41]:
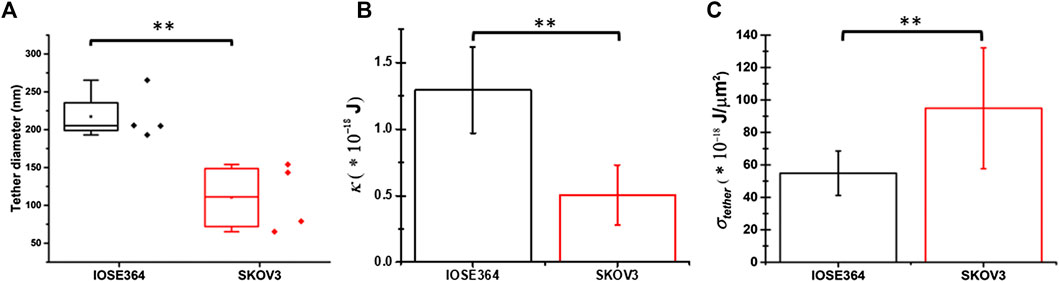
FIGURE 6. Box-and-whisker plots for (A) tether diameter, and mean values of (B) membrane bending modulus (κ), and (C) tether membrane tension (σtether). Error bars in panels (B) and (C) indicate standard deviations from the mean. **Indicates a statistically significant difference with p = 0.010 (A),(B)p = 0.007 (B), and p = 0.006 (C).
To minimize Etether, the membrane tension acts to reduce the diameter of the tether while the bending modulus opposes it. The balance between these two opposing energies determines dtether and Feq at equilibrium, which can be determined by:
and
Equations 7and8 together yield:
and
and:
To estimate the SD associated with
where
Using Eq. 11, and the mean ± SD values of Feq (Figure 3A) and dtether (Figure 6A), the estimated values of κ for IOSE364 (1.29 ± 0.32) × 10–18 J (∼313 kBT) and SKOV3 (0.51 ± 0.23) × 10–18 J (∼124 kBT) cells (where kB is the Boltzmann constant (∼1.38 × 10⁻²³ J/K), and T = 298 K) were significantly different from each other (p = 0.007) (Figure 6B). These values are comparable to the values for microglial cells (∼211 kBT) and macrophages (∼189 kBT) [26], but higher than those for astrocytes (∼63 kBT), glioblastoma GBM95 cells (∼68 kBT) [26] and fibroblasts (∼73 kBT) [28]. The nearly 60% reduction in the value of κ for SKOV3 cells is suggestive of the reduced resistance of the membrane of these cells to curvature changes as compared to IOSE364 cells.
Using Eq. 12, the estimated σtether ∼ (95.0 ± 37.3)× 10–18 J/μm2 for SKOV3 cells was significantly higher (p = 0.006) than σtether ∼ (54.8 ± 13.7) × 10–18 J/μm2 for IOSE364 cells (Figure 6C). Changes in membrane tension are thought to be a regulator of cell motility in coordination with the dynamics of cytoskeletal actin [43]. In view of this notion, the increase in σtether for SKOV3 cells is suggestive of changes in the potential motility of these cells as compared to IOSE364 cells.
Our estimated values of σtether are comparable to those for microglial cells (56 × 10−18 J/μm2), astrocytes (50 × 10−18 J/μm2), and glioblastoma GBM95 cells (51 × 10−18 J/μm2), but higher than the values for neuronal cell bodies (16 × 10–18 J/μm2) and neurites (15 × 10−18 J/μm2) [26]. Results of tether pulling experiments from mouse fibroblast and human melanoma blebbing cells that lack cytoskeletal support indicate that the value of σcell is in the range of 1–3 × 10⁻¹⁸ J/μm2 [44, 45]. Similarly, our previous results based on tethers pulled from HEK cells with disrupted membrane-cytoskeleton attachments indicate σcell ∼ 5 × 10–18 J/μm2 [22]. Based on the results reported in these studies, there appears to be little variation in the value of σcell among different cell types. Furthermore, since σcell < σtether, the major determinant of membrane tension in the tether is W0 (Eq. 6) [31, 44]. Since σtether for SKOV3 cells was higher than the corresponding value for IOSE364 cells (Figure 6C), it would appear that W0 for SKOV3 cells would be concomitantly higher (Eq. 6). However, the reduction in the mean value of Fmax for SKOV3 cells (Figure 3A) suggests that both the lowered κ (Figure 6B) and viscous resistance of the membrane, characterized by τlong (Figure 4B), dominate the energetics associated with detachment of the membrane from the cytoskeleton as compared to W0. Given that the value of Feq for SKOV3 cells was significantly lower for SKOV3 cells (Figure 3B), we attribute the basis for it to the significantly lower value of κ for these cells (Figure 6B) as being the dominant mechanical property as compared to σtether (Eq. 10), which was estimated to be higher for SKOV3 cells (Figure 6C).
In this study, we have characterized the viscoelastic properties of the membranes of normal and cancerous human ovarian cells using an instrumentation platform that combines optical tweezers and QPI. A key advantage of this platform is that it enables quantification of membrane bending modulus and tension, two important mechanical parameters that require the measurements of tether force and diameter. Although tether force has been extensively measured by several investigators for different cells [38, 46–51], a challenge in the field has been the measurements of the tether diameter. Previously, a method using scanning electron microscopy has been reported [28]. However, this method requires fixing the cells after pulling tethers from them, and using geometrical approximations to estimate the tether diameter. QPI allows provides an optical measurement of the tether radius without fixing the cells, simultaneously with measurements of the tether force by optical tweezers. We have previously verified the accuracy of QPI-based measurements (172 ± 16 nm) against AFM-based measurements (179 ± 15 nm) of a pattern of depths, etched within a microchip [16]. Our combined optical tweezers and QPI platform provides a capability for mechanical characterization of various cell types under different conditions and stimuli.
Important findings of this study are that as compared to the membranes of IOSE364 cells, the membranes of SKOV3 cells have significantly lower Fmax for detachment from cytoskeleton (Figure 3A), tether stiffness (Figure 3C), membrane bending modulus (Figure 6B), and characteristic time for lipid flow (Figure 4B), the latter indicative of reduced membrane viscosity. These findings collectively suggest that the membranes of cancerous SKOV3 ovarian cells are less resistant to mechanical forces and deformation. Increased membrane susceptibility to mechanical deformation may be a facilitating factor in the metastatic behavior of cancerous ovarian cells.
Consistent with our findings, AFM-based studies indicate that the value of Young’s modulus for IOSE cells is higher than the corresponding values for different ovarian cancer cell lines [52]. Swaminathan et al. [9] have found that ovarian cancer cell types with highest migratory and invasiveness have lower stiffness values. In particular, these investigators reported that the stiffness of SKOV3 cells, which were shown to have a high relative invasiveness, was nearly threefold lower than that of IGROV cells that had a low relative invasiveness. Ketene et al. have reported that the stiffness and viscosity of mouse ovarian surface epithelial (MOSE) cells progressively decrease as the cells transition from benign to early- and late-stage malignancy stages, and attributed these biomechanical alterations to organizational changes to cytoskeletal actin [53]. Based on our findings, we propose that in addition to changes in actin organization (e.g., F-actin polymerization), the mechanical properties of the membrane itself can also play a role in the progression of ovarian cancer malignancy. As such, the membrane biomechanical properties cells could potentially provide diagnostic value and serve as a biomarker to assay the metastatic potential of ovarian cancer cells.
The reduced κ for SKOV3 cells (Figure 6B) suggests that the membrane composition and/or architecture are altered in these cells. Cholesterol and lipids including phosphosphingolipids (sphingomyelin) form membrane lipid rafts (caveolae) that influence the membrane bending rigidity [54]. Therefore, it is plausible that the lower value of κ for SKOV3 cells may be due to the altered amount of cholesterol and/or compositional/structural changes to the lipid rafts. Lokar et al. [55] have reported that cholesterol depletion in the membrane of urothelial cancer cells resulted in dispersion of cholesterol-sphingomyelin nanodomains, and an increase in the diameter of nanotubes (tether-like structures) interconnecting the cells. As such, our finding that tethers pulled from SKOV3 cells had a significantly smaller (p = 0.010) dtether (Figure 6A), and subsequently, lower κ (Eq. 11; Figure 6B) (p = 0.007) is suggestive of increased membrane cholesterol content and/or compositional changes to the rafts and their landscape within the membrane bilayer.
Further evidence toward the role of phosphosphingolipids in modulating the biomechanical properties of ovarian cancer cells comes from a study that involved treatment of the cells with specific components of phosphosphingolipids (sphingosine, ceramide, or sphoingosine-1-phosphate) [56]. While treatment with ceramide or sphingosine-1-phosphate reduced the average elastic modulus of transitional and aggressive MOSE cells, sphingosine (the backbone component of phosphosphingolipids) treatment increased the average elastic modulus in the aggressive cells. In view of these findings, a reduction in membrane bending modulus and stiffness of SKOV3 cells may be attributable to increased content of ceramide or sphingosine-1-phosphate as metabolites of phosphosphingolipids within the membrane, or alternatively to decreased content of phosphosphingolipids or its sphingosine backbone, which in turn, would suggest a reduction in the size of the raft domains. Smaller rafts may reduce the physical barriers for the flow of the non-raft lipid components of the membrane; hence, resulting in lower diffusion time as we have observed (Figure 4B). In view of our findings with respect to alterations in some of the mechanical properties of SKOV3 cells, it is possible that the membrane biomechanics of ovarian cancer cells may serve as a potentially useful biomarker for diagnostic assessment and a potential target by therapeutic agents for controlling metastasis.
Conclusion
Utilizing an instrumentation platform that combines optical tweezers with QPI, we have characterized the viscoelastic properties of the membranes of normal (IOSE364) and cancerous (SKOV3) ovarian cells. Using dynamic force profiles associated with tethers pulled from these cells in conjunction with QPI-based estimates of tether diameters and quantitative analyses, we find that the membranes of SKOV3 cells require a statistically significant lower force to become separated from the cytoskeleton, and have statistically significant lower stiffness, bending modulus, and characteristic time associated with lipid flow. Our biomechanical characterization approach and results may pave the way for future directions and studies aimed at using the membrane biomechanics as a possible diagnostics biomarker for assessment of the metastatic potential of ovarian cancer, and a target for development of therapeutics.
Data Availability Statement
All raw datasets can be made available by the authors upon request.
Author Contributions
Both authors contributed to the design of experiments, data analyses, interpretation of results, and writing the manuscript. TL performed the experiments.
Conflict of Interest
The authors declare that the research was conducted in the absence of any commercial or financial relationships that could be construed as a potential conflict of interest.
Acknowledgments
This study was supported in part by the Bourns College of Engineering, and the Academic Senate at UC Riverside through a Committee on Research grant. We would like to thank Wei Wen from City of Hope and the Canadian Ovarian Tissue Bank for providing the IOSE364 cell line.
Supplementary Material
The Supplementary Material for this article can be found online at: https://www.frontiersin.org/articles/10.3389/fphy.2020.582956/full#supplementary-material
References
1. Siegel RL, Miller KD, Jemal A. Cancer statistics, 2020. CA Cancer J Clin. (2020). 70:7–30. doi:10.3322/caac.21590
2. Chandra A, Pius C, Nabeel M, Nair M, Vishwanatha JK, Ahmad S, et al. Ovarian cancer: current status and strategies for improving therapeutic outcomes. Cancer Med. (2019). 8:7018–31. doi:10.1002/cam4.2560
3. Yeung T-L, Leung CS, Yip K-P, Au Yeung CL, Wong STC, Mok SC. Cellular and molecular processes in ovarian cancer metastasis. A review in the theme: cell and molecular processes in cancer metastasis. Am J Physiol Cell Physiol. (2015). 309:C444–C456. doi:10.1152/ajpcell.00188.2015
4. Naora H, Montell DJ. Ovarian cancer metastasis: integrating insights from disparate model organisms. Nat Rev Cancer. (2005). 5:355–66. doi:10.1038/nrc1611
5. Lengyel E. Ovarian cancer development and metastasis. Am J Pathol. (2010). 177:1053–64. doi:10.2353/ajpath.2010.100105
6. Mierke CT. The role of the optical stretcher is crucial in the investigation of cell mechanics regulating cell adhesion and motility. Front Cell Dev. Biol. (2019). 7:14–27. doi:10.3389/fcell.2019.00184
7. Guck J, Schinkinger S, Lincoln B, Wottawah F, Ebert S, Romeyke M, et al. Optical deformability as an inherent cell marker for testing malignant transformation and metastatic competence. Biophys J. (2005). 88(5):3689–98. doi:10.1529/biophysj.104.045476
8. Chen M, Zeng J, Ruan W, Zhang Z, Wang Y, Xie S. Examination of the relationship between viscoelastic properties and the invasion of ovarian cancer cells by atomic force microscopy. Beilstein J Nanotechnol. (2020). 11:568–82. doi:10.3762/bjnano.11.45
9. Swaminathan V, Mythreye K, Tim O’Brien E, Berchuck A, Blobe GC, Superfine R. Mechanical stiffness grades metastatic potential in patient tumor cells and in cancer cell lines. Cancer Res. (2011). 71:5075–80. doi:10.1158/0008-5472.CAN-11-0247
10. Wullkopf L, West A-KV, Leijnse N, Cox TR, Madsen CD, Oddershede LB, et al. Cancer cells’ ability to mechanically adjust to extracellular matrix stiffness correlates with their invasive potential. Mol Biol Cell. (2018). 29:2378–85. doi:10.1091/mbc.E18-05-0319
11. Hu J, Zhou Y, Obayemi JD, Du J, Soboyejo WO. An investigation of the viscoelastic properties and the actin cytoskeletal structure of triple negative breast cancer cells. J Mech Behav Biomed Mater. (2018). 86:1–13. doi:10.1016/J.JMBBM.2018.05.038
12. Efremov YM, Dokrunova AA, Efremenko AV, Kirpichnikov MP, Shaitan KV, Sokolova OS. Distinct impact of targeted actin cytoskeleton reorganization on mechanical properties of normal and malignant cells. Biochim Biophys Acta Mol Cell Res. (2015). 1853:3117–25. doi:10.1016/j.bbamcr.2015.05.008
13. Pachenari M, Seyedpour SM, Janmaleki M, Shayan SB, Taranejoo S, Hosseinkhani H. Mechanical properties of cancer cytoskeleton depend on actin filaments to microtubules content: investigating different grades of colon cancer cell lines. J Biomech. (2014). 47:373–9. doi:10.1016/j.jbiomech.2013.11.020
14. Suresh S. Biomechanics and biophysics of cancer cells. Acta Mater. (2007). 55:3989–4014. doi:10.1016/j.actamat.2007.04.022
15. Ketene AN, Roberts PC, Shea AA, Schmelz EM, Agah M. Actin filaments play a primary role for structural integrity and viscoelastic response in cells. Integr Biol. (2012). 4:540–9. doi:10.1039/c2ib00168c
16. Sarshar M, Lu T, Anvari B. Combined optical micromanipulation and interferometric topography (COMMIT). Biomed Opt Express. (2016). 7:1365–74. doi:10.1364/BOE.7.001365
17. Qian F, Ermilov S, Murdock D, Brownell WE, Anvari B. Combining optical tweezers and patch clamp for studies of cell membrane electromechanics. Rev Sci Instrum. (2004). 75:2937–42. doi:10.1063/1.1781382
18. Wang Z, Millet L, Mir M, Ding H, Unarunotai S, Rogers J. Spatial light interference microscopy (SLIM). Optic Express. (2011). 19:1016–26. doi:10.1364/fio.2010.fthk1
19. Curl CL, Bellair CJ, Harris T, Allman BE, Harris PJ, Stewart AG. Refractive index measurement in viable cells using quantitative phase-amplitude microscopy and confocal microscopy. Cytometry Part A.. (2005). 65:88–92. doi:10.1002/cyto.a.20134
20. Nasseri B, Florence AT. The relative flow of the walls of phospholipid tether bilayers. Int J Pharm. (2005). 298:372–7. doi:10.1016/j.ijpharm.2005.03.037
21. Dommersnes PG, Orwar O, Brochard-Wyart F, Joanny JF. Marangoni transport in lipid nanotubes. Europhys Lett. (2005). 70:271–7. doi:10.1209/epl/i2004-10477-9
22. Khatibzadeh N, Gupta S, Farrell B, Brownell WE, Anvari B. Effects of cholesterol on nano-mechanical properties of the living cell plasma membrane. Soft Matter. (2012). 8:8350. doi:10.1039/c2sm25263e
23. Campillo C, Sens P, Köster D, Pontani L-L, Lévy D, Bassereau P. Unexpected membrane dynamics unveiled by membrane nanotube extrusion. Biophys J. (2013). 104:1248–56. doi:10.1016/j.bpj.2013.01.051
24. Murdock DR, Ermilov SA, Spector AA, Popel AS, Brownell WE, Anvari B. Effects of chlorpromazine on mechanical properties of the outer hair cell plasma membrane. Biophys J. (2005). 89:4090–5. doi:10.1529/biophysj.105.069872
25. Li Z, Anvari B, Takashima M, Brecht P, Torres JH, Brownell WE. Membrane tether formation from outer hair cells with optical tweezers. Biophys J. (2002). 82:1386–95. doi:10.1016/S0006-3495(02)75493-3
26. Pontes B, Ayala Y, Fonseca ACC, Romão LF, Amaral RF, Salgado LT, et al. Membrane elastic properties and cell function. PLoS One. (2013). 8:688–712. doi:10.1371/journal.pone.0067708
27. Leijnse N, Oddershede LB, Bendix PM. Helical buckling of actin inside filopodia generates traction. Proc Natl Acad Sci U S A. (2015). 112:136–41. doi:10.1073/pnas.1411761112
28. Pontes B, Viana NB, Salgado LT, Farina M, Neto VM, Nussenzveig HM. Cell cytoskeleton and tether extraction. Biophys J. (2011). 101:43–52. doi:10.1016/j.bpj.2011.05.044
29. Ermilov SA, Murdock DR, Qian F, Brownell WE, Anvari B. Studies of plasma membrane mechanics and plasma membrane-cytoskeleton interactions using optical tweezers and fluorescence imaging. J Biomech. (2007). 40:476–80. doi:10.1016/j.jbiomech.2005.12.006
30. Brochard-Wyart F, Borghi N, Cuvelier D, Nassoy P. Hydrodynamic narrowing of tubes extruded from cells. Proc Natl Acad Sci U S A. (2006). 103:7660–3. doi:10.1073/pnas.0602012103
31. Sheetz MP. Cell control by membrane–cytoskeleton adhesion. Nat Rev Mol Cell Biol. (2001). 2:392–6. doi:10.1038/35073095
32. Shi Z, Graber ZT, Baumgart T, Stone HA, Cohen AE. Cell membranes resist flow. Cell. (2018). 175:1769–79. doi:10.1016/J.CELL.2018.09.054
33. Mattila PK, Lappalainen P. Filopodia: molecular architecture and cellular functions. Nat Rev Mol Cell Biol. (2008). 9(6):446–54. doi:10.1038/nrm2406
34. Kultti A, Rilla K, Tiihonen R, Spicer AP, Tammi RH, Tammi MI. Hyaluronan synthesis induces microvillus-like cell surface protrusions. J Biol Chem. (2006). 281(23):15821–28. doi:10.1074/jbc.M512840200
35. Koistinen V, Kärnä R, Koistinen A, Arjonen A, Tammi M, Rilla K. Cell protrusions induced by hyaluronan synthase 3 (HAS3) resemble mesothelial microvilli and share cytoskeletal features of filopodia. Exp Cell Res. (2015). 337(2):179–91. doi:10.1016/j.yexcr.2015.06.016
36. Nersesian S, Williams R, Newsted D, Shah K, Young S, Evans PA. Effects of modulating actin dynamics on HER2 cancer cell motility and metastasis. Sci Rep. (2018). 8 227–33. doi:10.1038/s41598-018-35284-9
37. Machesky LM. Lamellipodia and filopodia in metastasis and invasion. FEBS Lett. (2008). 582:2102–11. doi:10.1016/j.febslet.2008.03.039
38. Farrell B, Qian F, Kolomeisky A, Anvari B, Brownell WE. Measuring forces at the leading edge: a force assay for cell motility. Integr Biol. (2013). 5:204–14. doi:10.1039/c2ib20097j
39. Dickinson RB. Models for actin polymerization motors. J Math Biol. (2009). 58:81–103. doi:10.1007/s00285-008-0200-4
40. Mogilner A, Oster G. Force generation by actin polymerization II: the elastic ratchet and tethered filaments. Biophys. J. (2003). 84:1591–1605. doi:10.1016/S0006-3495(03)74969-8
41. Derényi I, Jülicher F, Prost J. Formation and interaction of membrane tubes. Phys Rev Lett. (2002). 88:275–88. doi:10.1103/PhysRevLett.88.238101
42. Ku HH. Notes on the use of propagation of error formulas. J Res Natl Bur Stand Sect C Eng Instrum. (1966). 3:95–117. doi:10.6028/jres.070c.025
43. Sens P, Plastino J. Membrane tension and cytoskeleton organization in cell motility. J Phys Condens Matter. (2015). 27:273103. doi:10.1088/0953-8984/27/27/273103
44. Dai J, Sheetz MP. Membrane tether formation from blebbing cells. Biophys J. (1999). 77:3363–70. doi:10.1016/S0006-3495(99)77168-7
45. Raucher D, Stauffer T, Chen W, Shen K, Guo S, York JD. Phosphatidylinositol 4,5-bisphosphate functions as a second messenger that regulates cytoskeleton-plasma membrane adhesion. Cell. (2000). 100:221–8. doi:10.1016/S0092-8674(00)81560-3
46. Köster DV Pulling of tethers from the cell plasma membrane using optical tweezers. Methods Mol Biol. (2020). 2169:167–74. doi:10.1007/978-1-0716-0732-9_15
47. Nussenzveig HM. Cell membrane biophysics with optical tweezers. Eur Biophys J. (2018). 47(5):499–514 doi:10.1007/s00249-017-1268-9
48. Jokhadar ŠZ, Derganc J. Structural rearrangements in CHO cells after disruption of individual cytoskeletal elements and plasma membrane. Cell Biochem Biophys. (2015). 71:1605–13. doi:10.1007/s12013-014-0383-9
49. Titushkin I, Cho M. Distinct membrane mechanical properties of human mesenchymal stem cells determined using laser optical tweezers. Biophys J. (2006). 90:2582–91. doi:10.1529/biophysj.105.073775
50. Ermilov SA. Effects of salicylate on plasma membrane mechanics. J Neurophysiol. (2005). 94:2105–10. doi:10.1152/jn.00414.2005
51. Brownell WE, Qian F, Anvari B. Cell membrane tethers generate mechanical force in response to electrical stimulation. Biophys. J. (2010). 99:845–52. doi:10.1016/J.BPJ.2010.05.025
52. Xu W, Mezencev R, Kim B, Wang L, McDonald J, Sulchek T. Cell stiffness is a biomarker of the metastatic potential of ovarian cancer cells. PLoS One. (2012). 7:e46609. doi:10.1371/journal.pone.0046609
53. Ketene AN, Schmelz EM, Roberts PC, Agah M. The effects of cancer progression on the viscoelasticity of ovarian cell cytoskeleton structures. Nanomed Nanotechnol Biol Med. (2012). 8:93–102. doi:10.1016/j.nano.2011.05.012
54. Banfalvi G. Biological membranes. In Permeability of biological membranes.. Switzerland: Springer International Publishing (2016). p. 1–71. doi:10.1007/978-3-319-28098-1_1
55. Lokar M, Kabaso D, Resnik N, Sepčić K, Kralj-Iglič V, Veranič P. The role of cholesterol-sphingomyelin membrane nanodomains in the stability of intercellular membrane nanotubes. Int J Nanomed. (2012). 7:1891–902. doi:10.2147/IJN.S28723
Keywords: cell membrane, label free imaging, membrane mechanical properties, tether, lipid flow
Citation: Lu T and Anvari B (2020) Characterization of the Viscoelastic Properties of Ovarian Cancer Cells Membranes by Optical Tweezers and Quantitative Phase Imaging. Front. Phys. 8:582956. doi: 10.3389/fphy.2020.582956
Received: 13 July 2020; Accepted: 05 October 2020;
Published: 10 November 2020.
Edited by:
Halina Rubinsztein-Dunlop, The University of Queensland, AustraliaReviewed by:
Lene Oddershede, University of Copenhagen, DenmarkWeiqiang Ding, Harbin Institute of Technology, China
Copyright © 2020 Lu and Anvari. This is an open-access article distributed under the terms of the Creative Commons Attribution License (CC BY). The use, distribution or reproduction in other forums is permitted, provided the original author(s) and the copyright owner(s) are credited and that the original publication in this journal is cited, in accordance with accepted academic practice. No use, distribution or reproduction is permitted which does not comply with these terms.
*Correspondence: Bahman Anvari, anvarib@ucr.edu